


Languages
Pages
Legal

DecomposingIntergenerationalIncomeElasticity:Thegender‐differentiatedcontributionofcapitaltransmission
inruralPhilippines
LeahBevisandChristopherB.BarrettCornellUniversity
August2013revisionCommentsgreatlyappreciated
AbstractAgrowingempiricalliteraturedocumentsstrongintergenerationalincomeelasticity(IGE)worldwidewhileaparallelliteraturefindsclearpatternsofparent‐to‐childtransmissionofhumancapital.AlthoughthelatterpatternclearlyhelpsexplaintheIGE,rarelydoauthorsdecomposetheIGEintodifferentpathwaysofintergenerationalcapitalandproductivitytransmission,muchlessexplorepossibledifferencesbetweendaughtersandsonsinthosepatterns.UsinglongitudinaldatafromruralPhilippines,wedecomposeIGEintofivedistinctpathways:theintergenerationaltransmissionsofhealth,education,land,andspouseeducationcapital,plusresidualintergenerationalcorrelationinproductivity.Wefindthatintergenerationalhumancapitaltransmissionsfrommothersarestrongerthanfromfathers.AlthoughthenaïveIGEestimatesarestatisticallyindistinguishableforsonsanddaughters,thepathwaysthatgeneratetheseresultsdifferstrikingly.Forsons,IGEisentirelyexplainedbyparent‐to‐childcapitaltransmission.Bycontrast,strongincomecorrelationexistsbetweendaughtersandparentsevenaftercontrollingforparentandchildcapitalendowments,suggestingthatitmaybeeasiertopromoteequalityofopportunityamongmalesthanamongfemalesinruralPhilippines.Maternaleducationisthemainparentalcapitaldriverofintergenerationalincometransmission,underscoringthelong‐termpayofftopromotingtheeducationofgirls,especiallythosefrompoorhouseholds. AcknowledgementsWethanktheNSF‐fundedFoodSystemsandPovertyReductionIGERTforfinancialsupport,IFPRIformakingthedataavailable,andworkshopaudiencesatCalvin,Columbia,Cornell,andthe2013AustralasianDevelopmentEconomicsMeetings,EconometricSocietyAustralasianMeetings,andOxfordCenterfortheStudyofAfricanEconomiesconferenceforhelpfulcommentsandquestions.SpecialthanksgotoMabelAndalon,SoniaBhaltora,PeterBrummund,RaviKanbur,JordanMatsudaira,CatherinePorter,AgnesQuisumbing,KazushiTakahashiandYujiTamurafortheircommentsandsuggestionsonearlierdraftsofthispaper.Anyremainingerrorsareoursoleresponsibility.
1
1. Introduction
Intergenerationalincometransmissionestimatesmeasureacrucialcharacteristicofasociety:equalityofopportunity.Areallchildrenequallylikelytoforgeasuccessful(orunsuccessful)futurelivelihood–asreflectedbyzerocorrelationbetweenparents’andchildren’sincomes–orarechildrendestinedtostanduponthesamesocio‐economicrungsastheirparents,aswouldbetrueifincomeswereperfectlycorrelatedintergenerationally?Andifachild’sincomeishighlycorrelatedwithhisorherparents’,throughwhichmechanism(s)doesthistransmissionoccur?Dotheparents’productiveassetspasstothechildren,andifso,isithumancapitalembodiedineducationand/orhealth,orisitphysicalcapital,suchasagriculturallandthatiscentraltoincomegenerationinagrariancommunitiesinthedevelopingworld?Orisitinsteadtheproductivitywithwhichparentsandchildrenemploytheirwealth,perhapsduetoskillorsocialconnections,suchassocioeconomicmatchinginmarriage?Andarepatternsofintergenerationaltransmissiongenderneutralordomothersandfathersexertidentifiablydifferenteffectsontheirchildren’sadultwell‐being,anddodaughtersandsonsdependdifferentiallyonparentsfortheirownadultincomes?Weknowsurprisinglylittleempiricallyaboutthesemorenuancedquestionsabouttheunderlyingstructurebehindoft‐observedintergenerationalincomecorrelationsthatsuggestlimitedequalityofopportunity.Thatlacunamatters.Understandingthepathwaysthattiechildren’seconomicoutcomestothoseoftheirparentsallowspolicymakerstocraftpoliciesthatworktowardsprovidingallchildrenwithreasonablyequaleconomicopportunitiesinlife.Researchonthetopicgainsparticularpertinence,therefore,inthedevelopingworld,whereevidencesuggeststhatintergenerationalincometransmissionmaybeespeciallyhigh(Solon2002,Blanden2013),andwheretheeffectivetargetingofcostlypoliciesiscrucialtosuccessinpovertyreduction.Mosteconomistscouchparent‐to‐childincometransmissionintermsofintergenerationalincomeelasticity(IGE)estimatesgeneratedthroughregressionofchildren’sadultlogincomeontheirparents’logincome.Inequation1,thelogincomeofparentsinhouseholdjisgivenbyyj,thelogincomeofchildiinhouseholdjisgivenbyyij,andIGEisgivenbytheestimatedcoefficientb1:
yij=b0+b1yj+e (1)WhileIGEisaninterestingdescriptivemeasure,itobviouslydescribesonlystatisticalcorrelation;itdoesnotilluminatethepathwaysbetweenparentandchildincome.Understandingtherelativeimportanceamongthemultiplepotentialpathwaysiscrucialtothedesignofpoliciesdesignedtoreduceintergenerationalincometransmissionsoastoenhanceequalityofopportunity.Forinstance,perhapswealthierparentsinvestmorein(better)educationfortheirchildren,andapositivereturntoeducationraisesthesechildren’sadultincomesrelativetothoseofchildrenofpoorerparents.Orperhapswealthierparentstransfer(intervivosorviainheritance)land,moneyorotherphysicalassetstotheirchildren,andthisgreaterwealthleadsdirectlytohigheradultincomesforthesechildren.Inthefirstscenariobetterquality,freeeducationmightleveltheplaying
2
fieldamongchildrenbornintohouseholdsofdifferenteconomicstatus,whileinthesecondscenarioamoreprogressiveinheritancetaxsystemorlandredistributionpolicymaybeappropriate.Orperhapsthereisnoappreciabledifferenceintheeducationalattainmentorproductiveassetholdingsofthechildrenofhigherincomehouseholds,andtheadultincomesofthechildrenofwealthierparentsaregreateronlybecauseoftheirsuperiorproductivity,whichiscorrelatedacrossgenerationsduetointer‐familialdifferencesingenetics,transferableskills,greaterfinancialliquidity,socialconnectionsorotherhard‐to‐observecharacteristics.Insuchacase,whereIGEarisesduetointrinsicheterogeneitythatiscorrelatedwithinfamilies,theremaynotbepolicyoptionsforeffectivelyincreasingequalityofopportunity.Incomeistheproductofcapitalstocksandtheproductivitywithwhichthosestocksareallocated.Wecanthereforecouchmostintergenerationalincomepathwaysintermsofintergenerationaltransmissionsofproductivecapitalsuchaseducation,health,orland.Assortativemarriage1mightbeviewedasanother,fourthcapitalpathway,ifparentsexertanyinfluenceovermarriagepatternsandcouples(atleastpartially)poolincomesorintra‐householdproductivityspilloversarise.Controllingforthesefourcapitaltransmissionpathways,anyresidualIGEconditionalonparentcapitalandspousalcharacteristicswouldsignalintergenerationalcorrelationinproductivityindependentofobservedhuman,physicalormaritalcapitalaccess.Weemphasize,however,thatintergenerationalcorrelationinproductivitynecessarilycapturesunobservedintergenerationalcapitaltransmission,andthusmayeasilybeoverestimated.Intergenerationalcapitaltransmissionsare,likeIGE,astatisticalmeasureofcorrelation.Knowingthatparenthealthorlandholdingsarecorrelatedwithchildhealthorlandholdingsdoesnotmakeclearthestructuralmechanismthatunderpinsthesetransmissions.Nonetheless,decomposingIGEestimatesintocomponentpathwayscanenhanceourunderstandingofintergenerationalincometransmission,ifonlybynarrowingdownthecandidatemechanismstoexploreforpolicypurposes.WhileIGEandintergenerationalcapitaltransmissionshaveeachbeenwelldocumentedwithintheirownliteratures(seesection2,below),fewstudieshaveattemptedtodecomposeIGEintotheconstituentcapitaltransmissionsbehindit.Thoseauthorswhodoattemptdecompositiontypicallyfocusonlyononemechanism,generatingestimatesthatmaybebiasedbyunobservedbutcorrelatedpathways(Erikssonetal2005,Piraino2007).Toourknowledge,decompositionofIGEintomultiplepathwayshasonlybeenattemptedinoneotherpaper,byBlandenetal.(2013)whostudymen’sintergenerationalmobilityinGreatBritainandtheUnitedStates(US).Inthispaper,weofferthefirstsuchdecompositionthatdistinguishesbetweendaughtersandsonsorthatexploresIGEinaruralareaofthedevelopingworld.Morespecifically,weconceptualizeIGEinBukidnon,thePhilippines,astheresultofintergenerationaltransmissionoffourdifferenttypesofcapital–education,health,land,andspouseeducation–andanyremaining,conditionalIGEduetointergenerationalcorrelationinproductivity.
1Assortativemarriagereferstothepropensityfornon‐randommatchingofmates.Ifpartnersmatcharoundattributesrelatedtoincomegenerationcapacity,thenthesedemographicpatternscouldmattertoIGE.
3
InordertounderstandthecontributionofintergenerationalcapitaltransmissiontoIGE,wefirstexamineeachpathwayinturn.FirstwerunthenaïveIGEregressionin(1),instrumentingforparentalincomewithparentalexpendituresinordertobettercapturepermanentincome(onwhich,morebelow).Thenweexploretheassociationbetweenparentcapitallevelsandchildcapitallevels,allowingforcross‐capitaltransmissionsuchastherelationshipbetweenparenteducationandchildhealth.WenextdecomposeIGEintoparentcapitaltransmissionsandparentincometransmission.Weestimateallresultsseparatelyformalesandfemales,andsomeresultsseparatelyformigrantsandnon‐migrants(“splits”),whilecontrollingformeasurementerrorandlifecycleeffectsthatotherwisebiasIGEestimatesdownwards(Black&Devereux2010).ThenetresultisnotonlyanovelestimateofIGEinaruralareaofadevelopingcountry,butmoreimportantlyadecompositionthatfacilitatesincreasedfocusonthepathwaysthatmostimpedeequalityofopportunityinthissettingandtherevelationthatwhatappearstatisticallysimilarintergenerationalincometransmissionbetweendaughtersandsons,mothersandfathers,isinfactmarkedlydifferentintransmissionpathwaysbygender.Therestofthispaperproceedsasfollows.Section2providesbackgroundthroughabriefliteraturereview.Section3informallyexplainsthesimpleconceptualmodelbehindourempiricalanalysisandtheassociatedreducedformequationsforintergenerationcapitalandincometransmissionthatweestimate.Section4describesthePhilippinedataweuse.Section5explainstheestimationstrategy.Section6presentstheresultsforthecapitalandincometransmissionequations.Section7concludes.2.BackgroundMethodsofestimatingintergenerationalincomeelasticityhaveimprovedsteadilyovertime.OlderstudiesofIGEintheUStypicallyfoundIGEestimatesof0.2orless(Solon2002),signalingconsiderableequalityofopportunity.Suchfindings,however,wereusuallybiaseddownwardsbymeasurementerrorandlifecycleeffects(Behrman&Taubman1990,Solon2002,BlackandDevereux2010).CorrectingformeasurementerrorandlifecycleeffectsusingaverageparentincomeacrossmultipleyearscommonlyincreasesIGEestimatestoaround0.4intheUnitedKingdom(UK)andUS(Solon2002,Blanden2013),withlowerestimatesofaround0.1–0.2inCanadaandtheNordiccountriesofEurope(Corak&Heisz1999,Österbacka2001,Solon2002).Itispossible,however,thatmostexistingstudiesstillunder‐estimateIGEduetotheeffectsoftransitoryincomeandpriceshocksthatgeneratetemporaryvariationaroundpermanentincome.Unlikeclassicalmeasurementerror,errorduetotransitoryshocksislikelytopersistacrosstime,andlongerpanelsarethusrequiredtomitigatetheresultingattenuationbiasonestimatedincomecoefficients(Mazumder2005,Naschold&Barrett2011).Forexample,Mazumder(2005)showsthatIGEestimatesrosefrom0.45whenaveragingacross7yearsofUSsocialsecuritydatato0.61whenaveragingacross16years. Studiesofintergenerationalincometransmissionhavegenerallyfocusedonaparticulardemographic:malesinthedevelopedworld.Thedearthofstudiesinpoorercountriesis
4
largelyduetolackofreliableincomedata(Núñez&Miranda2011,Black&Devereux2010).However,thefewstudiesthathaveinvestigatedincometransmissioninpoorcountriesusuallyfindrelativelyhighIGErates(Solon2002,Blanden2013).Conversely,thefewstudiesthathaveinvestigatedparenttodaughterIGE–inthedevelopedworld–havefoundcomparablylowerIGEratesfordaughtersthanforsons(Chadwick&Solon2002,Jänttietal2005).Raaumetal(2008)provideaframeworkforunderstandinghowIGEdiffersacrosssonsanddaughters,andattributemuchofthedifferencetoassortativemarriageandlaborsupplyresponseeffects.Onceestimated,thecrucialquestioniswhatgeneratestheseIGEs.Alargebodyofeconomicsresearchfromthe1990ssuggeststhateducationalachievementiscorrelatedwithinfamiliesandacrossgenerations(Thomas1996,Behrman1997,Behrmanetal2001).Asecondbodyoftheeconomics,nutritionandpublichealthliteraturesexploreshowparenteducationandparenthealtheachinfluencethehealthoutcomesofchildren(Thomasetal1991,Thomas1994,Bhalotra&Rawlings2011,forthcoming).Giventheincomereturnstobothhealthandeducation,theseintergenerationalhumancapitaltransmissionpathwaysseemlikelytoplayanimportantroleunderpinningIGEestimates(Alburg1998). SimilartothemethodusedinestimatingIGE,economistsoftencoucheducationtransmissionintermsofanestimatedregressioncoefficientrelatingparentalandchildeducationalattainmentmeasures.IntheUnitedStates,forexample,BehrmanandRosenzweig(2002)foundmedianestimatesof0.12yearsand0.15extrayearsofchildschoolingforeveryadditionalyearofmother’sandfather’sschooling,respectively.BehrmanandRosenzweig(2002)foundintergenerationaleducationcorrelationsof0.5‐0.7inLatinAmerica,andThomas(1996)foundcorrelationsof0.2‐0.4inSouthAfrica,dependingonraceandparentgender.Relativelyhighratesofintergenerationalschoolingtransmissioninpoorercountriesmaybeduetolowlevelsofparenteducation,poormacroeconomicconditionsandtoalackofgovernmentinvestmentinpubliceducation,allfoundtobesignificantlyrelatedtolowlevelsofschoolingmobility(Behrman&Rosenzweig2002,Corak&Heisz1999,Hertzetal2007). Healthtransmissionismoredifficulttoestimatethaneducationtransmission,giventhemultidimensionalnatureofhealth(Strauss&Thomas1998).Publishedestimatesofparent‐childlifespancorrelationfallbetween0.15and0.3(Yashin&Iachine1997).Erikssonetal(2005)findanaverageparent‐childmorbiditycorrelationofabitunder0.3.Mother’sbirthweightandnutritionalstatusisclearlyassociatedwithchildbirthweight(Currie&Moretti2007,Victoriaetal2008,Blacketal2008),andBhalotraandRawlings(2011)findpositiveassociationsbetweenmaternalandchildhealthoverarangeofindicatorsin38developingcountries.Heightisoftenconsideredthebestsinglemeasureofadulthealth“stock,”giventhatitcaptureshealthshocksfrominuterothroughearlyadulthood(Thomasetal1991,Thomas1994).Inthedevelopingworldespecially,wherestuntingduetomalnutritionanddiseaseiswidespread,heightmaybethemosttellingmeasureofaccumulatedhealth(Fogel2004,Costa1998,Dasgupta1997).
5
Cross‐capitaltransmissionbetweeneducationandhealthisalsowelldocumented,themostcommonexamplebeingtheimpactofmaternaleducationonchildhealth.Thomasetal(1991)findthatmaternaleducationpositivelyaffectschildheight‐for‐age,andthatthisassociationappearstobeworkingthroughaccesstoinformation.Thomas(1994)findsthatinthreecountries(Brazil,GhanaandtheUS)maternaleducationhasalargerpositiveimpactondaughters’heightthanonsons’height,whiletheoppositeistrueforpaternaleducation. Giventhewell‐establishedliteratureonintergenerationaltransmissionofeducationandhealth,itisperhapssurprisingthatonlyafewstudieshaveattemptedtoestimatethecontributionofeithertransmissiontoIGE.Piraino(2007)estimatesthatintergenerationaleducationtransmissionaccountsforroughlyone‐thirdofIGEinItaly.Pekkarinenetal(2009)findthatmajoreducationalreforminFinlandreducedIGEby23percent,andAsadullah(2012)findsthatcontrollingforson’seducationreducesestimatedIGEinruralBangladesh.Erikssonetal(2005)findthataftercontrollingforchildhealthstatus,estimatedIGEinDenmarkdropsby28percentforsonsandby25percentfordaughters.Toourknowledge,onlyonepaperattemptstosimultaneouslyaccountformultipleintergenerationaltransmissionpathwaysbehindestimatedIGE.Blandenetal(2013)useadecompositionapproachtoinvestigatethecontributionofeducation,occupation,labormarketattachment,maritalstatusandhealthtoIGEformalechildrenintheUSandGreatBritain.TheyfindthateducationtransmissionisthepredominantpathwaybehindIGEintheUS,whileoccupationtransmissionisthepredominantpathwaybehindIGEinGreatBritain.TheirstudyillustratesthevariableimportanceoftransmissionpathwaysbehindIGEevenwithinculturallysimilar,developedcountriesandforchildrenofasinglegender.Itthushighlightstheneedtoinvestigatethesepathwaysinothercontexts.Giventheimportanceoflandinagrariansocieties,itseemslikelythatlandinheritancemayalsoplayaroleincreatingintergenerationalincomecorrelationsinmuchofthedevelopingworld.Forinstance,asignificantproportionofchildrenintheruralPhilippinesinheritlanduponmarriageoraparent’sdeath,thoughthispracticeisdecliningaslandbecomesscarcer(Estudilloetal2001b).Itseemsclearthatparentsfavorsonsoverdaughterswhenbequeathinglandtoprogeny,butinrecentyearsfavordaughtersoversonswheninvestingineducation(Estudilloetal2001a,Estudilloetal2001b).Estudilloetal(2001a)attributethelandinheritancepatterntothefactthatintheirstudyarealandisprimarilyusedforricecultivation,traditionallyamaledomain.Anumberofscholarshaveshownthatassortativemarriagecontributessignificantlytointergenerationalincomeelasticity(Raaumetal2008,Black&Devereux2010).ChadwickandSolon(2002)findthatintheUS(wherespousestypicallyhaveseparateincomes),theindividualearningsofahusbandorwifeareashighlycorrelatedwiththeearningsofhisorherin‐lawsaswiththeearningsofhisorherparents.Ermischetal(2006)estimatethatabout40percentoffamilyincomepersistenceintheUKandinGermanyresultsfromassortativemarriage.
6
ItseemspossiblethattheeffectsofassortativemarriagemaybeparticularlyimportantinthePhilippines,wherevariousauthorsagreethatthereturnstoschoolingarehigherforwomenthanformen(Sakellariou2004,Quisumbingetal2004).ThismaybeinpartbecauseschoolingincreaseslaborforceparticipationbywomenmorethanformeninthePhilippines,orbecauseofarelativelylargegenderearningsgapinfavorofmenwithinpoorlyeducatedsubpopulations,whichnarrowsquicklywithinmoreeducatedsubpopulations(DeSilva&Bakhtiar2011,Sakellariou2004).DeSilvaandBakhtiar(2011)specifytwoadditionalavenuesthattheybelieveworkthroughthemarriagemarket.First,bettereducatedwomensecureforthemselveshigher‐earninghusbands.Second,well‐educatedwivesenhancethelaborproductivityoftheirhusbandsthroughtheexchangeofideas,mutuallearning,andintra‐householdspecialization.Thenarrativeofmigrationhashistoricallybeenoneofupwardindividualeconomicmobility.InboththeLewis(1954)andHarrisandTodaro(1970)models,agapbetweenexpectedruralandurbanearningsdrivesanindividualtomigrate.Itisworthasking,however,howmigrationisassociatedwithintergenerationaleconomicmobility,ifatall.Ismigrationanescapefromthesocio‐economiccircumstancesofone’sfamily,ordoesfamilyincomeandproductivecapitalpavetheroadformigrants,suchthatmigrationissimplyanothermechanismbehindintergenerationalincomecorrelation?Beegleetal(2011)findhighincomereturnstomigrationfromruralTanzania;yetindividualswhomigrateusuallycomefrombetterofffamilies.ThissuggeststhatmigrationmayworkasamechanismbehindIGEinruralTanzania.QuisumbingandMcNiven(2010)suggestthatmigrationmaybeusedasanescapefromfamilypovertyinruralPhilippines,buttheyalsofindthateducationincreasesone’slikelihoodofmigrating.Ifthereisintergenerationaltransmissionofeducation,thenitisunclearwhethermigrationincreasesordecreasestheassociationbetweenmigrantandparentincomeinthiscontext.AddingtothatambiguityisthefactthatPhilippinemigrants,especiallydaughters,commonlysendremittanceshometotheirfamilies,whichmayincreaseparent‐childincomecorrelationinthe“opposite”directionfromthatusuallysupposed.Insummary,itisclearthateducation,health,land,andspouse’seducationareoftenimportantpredictorsofincome,bothgenerallyinthedevelopingworldandspecificallyinthePhilippines(Maluccioetal2009,Estudilloetal2001a,Estudilloetal2001b,Quisumbing1994).Thesecapitallevelsareinfluencedbyparentcapital,bothdirectlyandthroughparentincomethatcanfosterinvestmentinchildren’scapitalaccumulation.Suchinfluencemaydifferacrosschildandparentgenderandalsoacrossspace,assomechildrenmovefurtherfromtheirparentsthanothers.Multivariatecapitaltransmissionthereforelikelyexplainsatleastpartofintergenerationalincomeelasticity,althoughtheremayberesidualIGEconditionalonallofthesefactors,whichwouldseemtoreflectintergenerationalcorrelationinproductivityduetofactorsotherthanthecontrolled‐forcapitalstocks.Moreover,howmucheachtransmissionpathwaycontributestoaggregateIGE,andwhetherthepowersofvariouspathwaysdifferacrosscategoriesofchildren(malevs.female,ormigrantvs.non‐migrant),isanopenquestion,unexploredinboththeintergenerationalincometransmissionliteratureandtheintergenerationalcapitaltransmissionliterature.Wecontributenewempiricalfindingstohelpbegintofillthatgap.
7
3.ConceptualModelInordertoinformtheempiricalanalysisthatisthecorecontributionofthispaper,inthissectionweinformallylayoutasimple,conceptualmodelofintergenerationaltransmissionofdifferentformsofcapitalthatresultinintergenerationalcorrelationinincomes.Considerahouseholdmadeupofparentsandchildren.FollowinganapproachbegunbyBecker(1974)andBeckerandTomes(1979),weassumeparentsarealtruistic,andcollectivelymaximizeutilityovercurrentconsumptionandtheexpectedfutureincomelevelsoftheirchildren,constrainedbytheirowncurrentincome.Childgenderisexogenous,andparentsperceivethefutureincomesoftheirchildrentobegender‐specificfunctionsofchildeducation,health,landownership,andtheearningpotentialofthechild’sfuturespouse.Futureincomemayalsodependonchildren’sgeneticallyorsociallyheritableattributes,suchasabilityandsocialnetworks,thatarepositivelycorrelatedacrossgenerationswithinthefamilyandobservedbytheparentsbutunobservedbytheeconometrician.Parentsmaximizeutilityovercurrenthouseholdconsumptionandchildfutureincomebychoosingoptimallevelsofinvestmentinchildcapitalstocks,whichgeneratesintergenerationaltransmissionofeducation,health,landandspouseeducationcapitalstockstoeachoftheirchildren.2Thefirsttwopathwaysforhumancapitaltransmissionoccurduringachild’sformativeyearsathome;thelattertwousuallyoccurwhenachildleaveshisorherparent’shouse.Weassumethatthedecisiontoleavethehouseisexogenoustochildcharacteristics,sincemostchildreneventuallyestablishtheirownhousehold.However,weallowachild’sdecisiontomigrate(ratherthantoremaininthelocalareaofhisorherbirth)tobeendogenoustoparentandchildcapitallevels.Parentincome,whichconstrainsthemaximizationproblem,isitselfafunctionofthesameparentcapitallevelsthatcontributetochildincome:education,health,andland/assetownership.Householdsizealsoconstrainsthemaximizationproblem,andmayalsobeafunctionofparentcapitallevels,suchasmaternaleducation.Thus,intergenerationalcapitaltransmissionscanbeaffectedbyparentcapitalstocksin(atleast)threedistinctways.First,insomecasestheyaredirectlyconstrainedbyparentcapitalholdings.Forexample,parentswithextensivelandholdingsarebetterabletogivetheirchild(ren)landthanarelandlessparents.Similarly,anunhealthymotherwilloftentransmitpoorhealthtohernewborn,ceterisparibus.Second,parentalpreferencesandexpectationsmaythemselvesbeaffectedbyparentcapital(Jensen2010,Maertens2013).Forexample,apoorlyeducatedfathermaynotbelievethateducationisimportanttothefutureearningsofhischildrenandmightnotputintrinsicvalueontheireducation.Whilethismechanismisconceptuallydistinctfromthefirstone,itwillbeobservationallyequivalenttoanalysts,likeus,wholackdataonparents’
2Spousecapitaltransmissionreferstotheinfluenceparentshaveoverdeterminingtheirchild’sfuturespouse.Parentsmayraisetheirchildtopreferacertaintypeofspouse,theymaydirectlychoosetheirchild’sspouse,theymayprovidechildrenwithsocialnetworkswhichleadtoaparticulartypeofspouse,etc.
8
subjectivevaluationofalternativeformsofchildcapital.Thesefirsttwomechanismswillinfluencechildcapitallevelsregardlessofparentincome.Parentexpectationsandpreferencesmayalsodependuponchildgender.Forinstance,parentsmayperceivethereturnstolandoreducationtodifferacrosschildgender,asfoundinthePhilippinesbyEstudilloetal(2001a).Parentperceptionsmayalsobeshapedbysocialnorms,whichoftenregardbirthorderandmaybedictatedbyethnicgroup(LaFerrara2007).Itisthereforeimportanttocontrolforthesefactorswhenattemptingtorecoverparent‐to‐childcapitaltransmissions.Third,intergenerationalcapitaltransmissionmaybeinfluencedbythefinancialliquidityeffectofparentcapitalonparentincome.Ifcapitalmarketsfunctionperfectly,parentsinvestinchildcapitaluntilthemarginalreturnsequaltheinterestrateonborrowing.Butinmanyplaces,perhapsespeciallyruralareasofthedevelopingworld,accesstocredittofinancelong‐terminvestmentsiscommonlylimited.Borrowingconstraintsincreasetheopportunitycostofinvestment.Asaresult,parentalcapitalstocksmayhaveastrongeffectonchildcapitalaccumulationbyobviatingliquidityconstraintsoninvestmentsinschoolingorhealthcarefortheirchildren(Loury1981).Ofcourse,ifparentincomehaslittleimpactonchildcapitallevels–forexample,inasocietywithhighqualitypublicschoolsandfreegovernmentclinics,orwithperfectlong‐termcreditmarkets–thismechanismmaybeweak.Theremaybecross‐capitaltransmissioneffectsas,forexample,whenparentaleducationpositivelyaffectschildhealthstatus.Thesecross‐capitaleffectscannotrepresentthefirst,directtransmissionpathway.Butinadditiontothepossibleeffectsofparentalcapitalinobviatingliquidityconstraints,theycanreflecteitherdifferencesinparentalpreferencesandexpectations–aneffectthatshouldbeindependentofparentalincome–orpossibleeffectsofparentalcapitalintheproductionofnontradablechildcapital,asinthecaseofmaternaleducationaffectingchildhealth.Soitisstilldifficulttoisolatetheeffectsofparentalpreferencesandexpectationswithoutimposingundulystrongassumptions.Furthermore,intergenerationalcorrelationinproductivitycanleadtointergenerationalcorrelationinincomesindependentofassetaccumulation.Soparentalincomecaninfluencechildadultincomethroughseveralcausalpathways,butacorrelationbetweenparentandchildincomemayalsoreflectunseenproductivityorevencapitaltransmissions.Accordingtothisframework,achild’sadultincomemaybecorrelatedwithparentincomethroughanyofmultiplemechanisms,someofwhichoperatethroughparentincome,othersofwhichdependonparentcapitallevelsindependentofparentalincome.ThisstandsincontrasttotheworkhorseregressionspecificationforestimatingIGE,equation1,whichignorestheinfluenceofparentcapitallevelsonchildincome.Beforeexaminingthereducedformequationsthatweestimate,recallthatincomeistheproductofone’scapitalandtheproductivitywithwhichoneappliesthatcapital.Thus,in
9
ourconceptualmodel,parentj’sincome, ,stemsfromparenteducation, ,parenthealth, ,andparentland, ,allinteractedwithunobservableproductivity.Parentcapitallevelsinfluencechildcapitallevelsthroughdirecttransmissionandcross‐capitaltransmissionrelatedtoparentalexpectationsandpreferences,andalsothroughaffectingparentincomeusedtoinvestinchildcapitalformation.Childiinhouseholdjwillthusgrowuptoattainfixedquantitiesofhisorherowncapitallevels:education, ,health, ,land, ,andspouseeducationcapital, .Andfinally,likehisorherparents,thechildiwillearnandincome, ,thatresultsfromhisorhercapitallevelsandproductivity.Figure1illustratesthesetransmissionpathwaysvisually.Equations2‐5thenreflectintergenerationalcapitaltransmissionstochildifromhouseholdj,asweestimatethemintheBPSdata.Equation6reflectstherelationshipbetweenchildincomeandparentincomeconditionalonchildcapital,therebyreflectingchildproductivity,includinganyunobservedintergenerationalcapitaltransmission.Inallequations,thevector includescontrolsforhouseholdsizeandvariablesthatcontrolforsocialnorms(ethnicgroup,childhooddistrict,andsex‐specificbirthorderdummies).E θ θ θ (2)H θ θ θ (3)L θ θ θ (4)S θ θ θ (5)y λ λ λ (6)Substitutingequations2‐5intoequation6givesareducedformequationforchildincome,asinequation7.Additionallycontrollingforchildcapitalresultsinequation8,whichnestswithinitthepriortworeducedformrelationships.ThesespecificationsenableustoisolatetheintergenerationalcorrelationinproductivityindependentofintergenerationaltransmissionofvariousformsofproductivecapitalaswellseektounpackIGEestimates.y λ λ λ (7)y λ λ λ λ λ λ (8)Inequations2‐5,thecoefficient estimatestheeffectofparentalincomeonchildaccumulationofcapitaloftypec,reflectingliquidityeffectsonchildcapitalaccumulationbeyonddirectintergenerationalcapitaltransmissionorthatattributabletoparentalexpectationsandpreferencesalone.Thecoefficientθ estimatesthedirecttransmissiontochildcapitalcfromparentcapitalp.Notethatweallowexplicitlyforcross‐capitalinfluences,suchastheeffectofparentalhealthorlandholdingsonchildren’seducation.Becauseoneformofcapitalcannotbeconvertedtoanother,otherthanthroughincomeandresultinginvestment,intergenerationalcross‐capitaltransmissionmostlikelyreflectstheroleofparentalexpectationsandpreferenceswhenonecontrolsforparentalincome.Thisestimationstrategytherebypermitsustogetasenseastotherelativeimportanceof
10
financialliquidity(the estimates),parentalexpectationsorpreferences,versusdirectintergenerationalassettransfersasmechanismsforchildcapitalaccumulation.Equation6explainschildadultincomeasafunctionofchildcapitalandparentalincome.Theparameter reflectstheimpactofparentalincomeindependentofitseffectonchildcapitalaccumulation,i.e.,theeffectofproductivitytransmissionplusanyunobservedcapitaltransmission.Estimatesofthisequationallowustotestthehypothesisthat 0,implyingtheabsenceofproductivitytransmissionandthatIGEoperatesentirelythroughparentalinvestmentinchildren’scapitalstocks.Theparametervectorλ representsthereturnstochildi’sstockofcapitalcinthisrestrictedspecification.Bycontrast,inequation7,theparentalincomecoefficient estimatesthecombinedinfluenceofparentincomeonultimatechildadultincome–thatis,thecumulativeeffectofparentalincomeonchildproductivecapitalaccumulationthroughrelaxedliquidityconstraints,independentofdirectintergenerationalcapitaltransmission,plusintergenerationalcorrelationinproductivity.Thecoefficientλ estimatesthecombinedinfluenceofalldirecttransmissionsfromparentcapitalponultimatechildincome.Estimatingequations6and7allowsustotestthehypothesisthat ,implyingthatparentalliquidityconstraintsdonotaffectchildcapitalaccumulation.Equation8isthemostgeneralspecification,whichallowsustotesttheexclusionaryrestrictionthatthevectorλ 0,signalingthatparentalcapitalhasnodirecteffectonchildincome,butonlyoperatesthroughchildcapitalaccumulationandproductivitytransmission.Ofcourseifthisistrue,equation7collapsesbacktoequation4.Thisyieldsthecomplementaryhypothesesthat andλ λ ,implyingthatintergenerationalproductivitytransmissionandthereturnstodifferentformsofchildcapitalareallinvarianttoparentalcapitalendowments.Therelativemagnitudesofthesecoefficientestimateshavedirectpolicyimplications.Ifthe incometransmissioncoefficientsaresignificantandlargethenchildcapitallevelsarenormalgoods,andinfrastructuresuchasbetterpublicschools,freehealthclinicsinruralareasormoreaggressivetaxpoliciescanmitigateintergenerationalcapitalaccumulation.If isalsolarge,suchpoliciesmightalsomitigateeventualintergenerationalincometransmission.Ofcourse,incometransmissioncoefficientscouldbelargebut small,reflectinglowreturnstohumancapital.Orincometransmissioncoefficientscouldbesmallbut large,signalinghighratesofintergenerationalcorrelationinproductivity.Ifincometransmissioncoefficientsand arebothsmall,however,andinsteadthedirectcapitaltransmissioncoefficientsarelarge,thenchangeinparentcapitallevelsmaybenecessarytoimprovesocialmobility,implyinganeedforprogramsthatreachoutspecificallytolow‐capitalparentsandtheirchildren.Thatiswhyitbecomesimportanttotesttheexclusionaryrestrictionthatparentcapitalexertsnoinfluenceonchildadultincomeindependentofparentalincome(theintergenerationalproductivitytransmissionparameter)andchildcapitalaccumulation(thereturnstocapitalparameters).4.Data
11
ThedataweregatheredoverthecourseoftwodecadesinNorthernMindanaoDistrictinthePhilippines.Thefirstroundofdatawasgatheredoverfourwavesin1984/85,inarural,landlockedprovincecalledBukidnon.Thissurvey,underthePhilippinesCashCroppingProject,wasfocusedonhouseholdeffectsofagriculturalcommercialization.Itsampled510familiesfromruralBukidnon,almostallofwhomreliedheavilyonagriculturalincome.ThesecondroundofdatawasgatheredbytheInternationalFoodPolicyResearchInstitute(IFPRI)andtheResearchInstituteforMindanaoCulture(RIMCU)in2003/04,usingaquestionnairehighlysimilartotheonefrom1984/85.Thissurvey,calledtheBukidnonPanelSurvey(BPS)in2003/04,wasadministeredtothreetypesoffamilies.First,itinterviewedalloriginalhouseholdsstilllivingintheoriginalsurveyarea,atotalof311households(61percentoforiginalrespondents).Duringthissurvey,originalrespondentslistedallnon‐coresidentchildren,andalsoprovidedbasicinformationaboutmanyofthesechildrenincludinglocation,educationalattainment,andmaritalstatus.Alsoduringthissurvey,coresidentchildrenwereinterviewed.However,wedonotincludedatafromcoresidentchildreninthispaper,giventhattheyareneverhouseholdheadsandarenotearningincomeindependentlyfromtheirparents.3Second,itsampledatrandomuptotwonon‐coresidentchildrenneartheiroriginal(parent)household,atotalof261households.Werefertothesechildrenas“splits”fortherestofthepaper.Third,itsamplednon‐coresidentchildrenlivingfurtherawayfromtheirparenthousehold.Thesechildren,whowerefertoas“migrants,”werelivinginthethreeurbanareasinMindanao,orinmunicipalityseats,orinotherruralareasofBukidnon.About75percentofpotentialmigrantswereinterviewed,foratotalof257migranthouseholds.Thesplitandmigrantchildreninterviewedin2003and2004wereonaverage10.3yearsofagein1984,withastandarddeviationof5.7years.Fifty‐sixpercentwerefemales,and65percentofthosewhowouldlaterbecomemigrants(asopposedtosplits)werefemales.Allchildrenareeithersonsordaughtersofthe1984householdhead,withtheexceptionof3femalerelativesand1femalenon‐relative.Givenourassumptionsaboutthetimingofintergenerationalcapitaltransmissions,itisimportanttonotethatofthe402marriedchildren(92%),73%leftthehouseholdtheyeartheygotmarried,and84%leftwithin2yearsofgettingmarried.Ofthe89childrenwhoinheritedlandfromtheirparents,60%
3Ofthesonsanddaughterslistedinthe1984survey,4percentare“lost”inthe2003/2004surveys–mentionedneitherasco‐residingchildrennoraschildrenwhohavemovedoutofthehousehold.Ofthechildrenwhowerenotlost,29percentstillresidedwiththeirparentsin2003,41percenthadmovedoutoftheirparents’housebutwerenottrackedforinterview,and30percenthadmovedoutandweretrackedforinterview.Surprisingly,therewerenoinstancesofchildrenwhoremainedinthehouseholdandbecamehouseholdheads.Weusethelastcategoryofchildren(the30percentwhoweretrackedforinterview)inouranalysis.Theomissionofco‐residentchildrenmightslightlybiasdownwardscoefficientestimatesbasedonpercapitahouseholdincome,givenstrongerintra‐generationalautocorrelationthanintergenerationalcorrelationacrossperiods.Thisbiasisunavoidable,however,giventhatwehaveonlyhouseholdlevelincomedata.
12
inheritedwithinayearofleavingtheirparent'shouse,and71%inheritedwithinayearofgettingmarried.Thus,ourassumptionsthatlandandspouseeducationtransmissionoccuraschildrenareleavingtheirchildhoodhomedoseemtohold.ForevenmoredetailsontheBPSdata,seeQuisumbing&McNiven(2009).Original(round1)familieswhowerefoundandre‐interviewedin2003arenotablydifferentin1984thanfamilieswhichwerenotfoundin2003.Theformeraresignificantlylarger,withmorechildren,andheadedbyindividualswhoareolderandmigratedtotheir1984locationearlier.Theyownmoreland,dependmoreheavilyonhome‐producedfood,incomefromcashcroppingandcorn,anddependlessheavilyonnon‐agriculturalsourcesofincomeandagriculturalwagelabor.Theyalsohavehigherincomeandexpenditurelevels.Mostofthesedifferencesaresignificantattheonepercentlevel,andallatthefivepercentlevel.Givensuchattritioneffects,theintergenerationaltransmissiontrendsdiscussedinthispapershouldbeconsideredspecifictothesampleoffamilieswhoremainedinBukidnonthrough2003.Whileitseemslikelythatfamily‐levelmigrationwouldchangesubsequentintergenerationaltransmissiontrends,suchanalysisisunfortunatelyimpossiblewiththesedata.Inthispaper,parentvariablesaretakenfromthe1984survey.Whileitwouldbeidealtotakesomeparentcharacteristics,suchaslandholdings,fromtheyearduringwhichchildrenfirstlefttheirparent’shousehold,thesedataarenotavailable.Childattributesduringchildhood,asexaminedinTable4,alsocomefromthe1984survey.Weusechildattributesinadulthood(suchaschildincome,childheight,andchildeducationalattainment)fromthe2003/04surveysofnon‐coresidentsplitandmigrantchildren.Table1displayssummarystatisticsformalechildren,femalechildren,splits(i.e.,non‐migrants)andmigrants.Aseriesoft‐testsshowsthatthereisnosignificantdifferenceinobservablecharacteristicsbetweenmigrantsandsplitsduringchildhood,exceptthatmalemigrantstendtobeofaslightlylowerbirthorder,averagingaroundthird‐bornwhilethemalesplitsaveragearound2.5‐born.Byadulthood,however,therearediscernibledifferencesbetweenmigrantsandsplits.Bothmaleandfemalemigrantsaresignificantlymoreeducated,havesignificantlygreaterincomes,andaresignificantlylesslikelytobemarriedthansplits.Thereisnodifferenceinheightacrossadultmigrantsandsplits.Sincet‐testssuggestthatmigrantsandsplitsaresimilarasyoungchildren,itseemsunlikelythatparentsinvestintheirchildren’scapitallevelsaccordingtofuturemigrantstatus.Wethusanalyzeintergenerationalcapitaltransmissionsseparatelyformalesandfemales,butnotseparatelyacrosssplitsandmigrants.Migrationhasoccurred,however,by2003whenchildrenaremarried,livingintheirnewhouses,andearningincome.Bythistimetherearediscernibledifferencesbetweensplitsandmigrants,anditseemsplausiblethatmigrantsmightexperiencedifferentintergenerationalincomemobilitytrendsthannon‐migrants.Forthisreason,weanalyzeanddecomposeIGEseparatelyformales,females,migrantsandsplits.Inthesefinalregressionswecontrolforgenderwhengroupingchildrenbymigrantstatus(sincegendercertainlyeffectsincome),butwedonotcontrolformigrantstatuswhengroupingchildrenbygender(sinceweconsidermigrantstatuspotentiallyendogenoustochildcapitallevels).
13
Thereisnoapparentselectionbiasinthechoiceofsiblingswhoweretrackedin2003/2004.Anexaminationoftheirsex,age,health,educationlevels,andheightandweightz‐scoresshowsthatthechildrentrackedbytheBPSsurveywerenotsignificantlydifferentin1984thantheirsiblingsexceptbysex,ageandbirthorder(seeAppendix1).Trackedchildrenweresignificantlylesslikelytobemale,andwereofsignificantlygreaterageandhigherbirthorder.Sinceolderchildrenweremorelikelytohavemovedoutoftheirparents’houseby2003/2004,thedifferenceinageandbirthorderisexpectedanddoesnotimplyanydifferenceinothercharacteristics;itlikelyjustreflectslifecycleeffectsforwhichwecontrolanyway.Trackedchildrenaremoreoftenfemalechildrenlargelybecausefemalesmigratedmoreoftenthanmalechildren,andsoahigherproportionofthemigrantchildrentrackedin2004werefemale.Evenofthesplitchildrenclosertohome,however,slightlymorefemalechildrenweretrackedthanmalechildren,adifferencethatisstatisticallysignificantatthetenpercentlevel.Sincewepresentallresultsacrosssex,thisselectionissuedoesnotaffectanyofourresultsexceptinasmuchasitdecreasessamplesizeformalechildren.Throughoutthispaper,thevariableseducationandspouses’educationaremeasuredinyearsofschoolingcompleted,4landismeasuredinhectaresowned,andheightismeasuredincentimeters.Thebaselineheightofallfamilymembers(adultsandchildren)isanaverageoverfourroundsofanthropometricdatagatheredduring1984/5.The2003/4heightdataweregatheredagainthroughmeasurement,butinonlyoneround.Incomeandexpendituremeasuresareexpressedinlogterms,andrepresenttheaverageweeklyincome/expenditureoftheentireco‐residenthousehold.Bothvariableswereaggregatedfromanumberofdifferentmodules.In2003/4thesemodulesaccountedforincomefromand/orexpenditureson:landrental;agriculturallabor;majorcropproduction;fruitandvegetableproduction;wageemployment;non‐agriculturalbusinesses;inheritance;NGOorgovernmentbenefits;gambling;non‐landassetsales;livestock;foodpurchases.Allincomeandexpenditurevariablesaredeflatedbyprovince‐specificconsumerpriceindicesobtainedfromtheNationalStatisticsOfficeinManila.5Weuseheightastheindicatorforparentandchildhealthfortworeasons.First,heightisagoodmeasureofhealthstock,inthatitcapturesthefinaloutcomeofmanyyearsofvaryinghealthinvestmentsandhealthshocks(Thomas1994).Second,fullheightisattainedroughlysimultaneouslywiththecompletionofeducation,bothundertheauspicesofparentalguidanceandinvestment.Thus,itrepresentschildhoodhealthformation,heavilyweightingtheearliestyearsofliferatherthanlaterhealthconditionsattainedonceachildislivingseparatelyfromhisorherparents.4Ideally,onewouldincludemeasuresofchildcognitiveabilityorperformanceasyetanotherformofintergenerationalcapitaltransmission.Unfortunately,nosuchvariablesexistinthesedata.Thus,thetransmissionofcognitiveabilityiscapturedonlywithintheproductivitytransmissionmeasuredinequations13and15.5All1984familiesliveinoneprovince(Bukidnon),duringbothroundsofthepanel.MostgrownchildrenalsoliveinBukidnon,butby2004afewmigrantshavegoneasfarasMisamisOriental,aneighboringprovinceonthecoast.
14
5.EstimationStrategyThroughoutthepaperweadjustformeasurementerrorinandtransitoryshockstoparentincomebyinstrumentingforparentincomewithparentexpenditure,whichbetterreflectspermanentincome.6,7Weinstrumentthisway,ratherthanaveragingmultipleperiods’incomeobservations,becausetheBPScontainsonlytworoundsofparentincomedata.Underclassicalmeasurementerror,butespeciallyunderthetime‐persistentmeasurementerrorthatislikelytoexistaroundpermanentincome(Mazumder2005,Naschold&Barrett2011),tworoundsofdatawillnotsignificantlymitigateattenuationbiasonincometransmissionorIGEestimates.Thisestimationstrategyeliminatesmeasurementerrorbiasinestimatedincomecoefficientsifmeasurementerroraroundpermanentincomeisorthogonaltomeasurementerroraroundexpenditure.Foranyrandomcomponentofmeasurementerror,forinstancemisreportingormisrecordingerror,suchorthogonalityseemslikely.Orthogonalitymayseemlesslikelytoholdforerrorduetotransitoryincomeshocks.Butwetestforandfindstrongevidenceofconsumptionsmoothingthatmakesthisassumptionplausible(seeAppendix2).Consistentwithpriorresultsintheliterature,instrumentingforsingleyearincomewithexpenditure,asaproxyforpermanentincome,resultsinasignificantlyhigherIGEestimatethandoesaveragingacrossjusttwoperiods.TableA4inAppendix2comparestheseestimatesfortheentiresampleofchildrenandforsub‐samplesselectedbygenderandmigrantstatus.Weuse1984parentincome/expendituremeasuresratherthan2003parentincome/expendituremeasures,forthreereasons.First,the1984measuresbetterpredictchildincomeandassetlevels.Second,wewishtocapturethecausalpathwaysbetweenparentandchildincome,andthecapitaltransmissionsthatwehypothesizeserveasthesepathwaysoccurprimarilyduringchildhoodandyoungadulthood.Thepermanentincomeofparentsin1984oughttoholdmoreinformationaboutthesepathwaysthanthepermanentincomeofparentsin2003.Third,2003parentexpendituresmay,tosome
6Notethatweinstrumentnottoaddressanendogeneityissue,whichwouldrequireaplausibleexclusionaryrestriction,butrathertoobviateanerror‐in‐variablesproblemthatwouldotherwiseleadtoattenuationbiasintheIGEestimates.Thisdoesimply,however,thatifparentexpenditureswereto(positively)affectfuturechildincomeinanywayexceptthroughcorrelationwithaparent’spermanent/structuralincome,thecoefficientestimateonparentincomemightbebiased(upwards)inallcapitalandincometransmissionregressions.Wethereforetestedtheexclusionaryrestrictionbyregressingchildincomeonbothparentincomeandparentexpenditure.In15of18cases,wecouldnotrejectthenullhypothesisthatparentexpenditurehadnoindependentcorrelationwithchildincomeinfavorofthealternatehypothesisofapositivecorrelation.Detailsofthesetestsareavailablebyrequest.Inthefewcaseswheretheexclusionaryrestrictiondoesnothold(notedinthetext),thenon‐adjustedandadjustedestimatesoftheparentincomecoefficientmaybeviewedaslowerandupperbounds,respectively,aroundthetrueIGEcoefficient.Thequalitativestoryisnonethelessconsistentwhicheverofthoseestimatesoneprefers.7Wepreferusingexpendituresasaninstrumenttousingexpendituresasaproxy(i.e.,usingexpendituresdirectlyratherthanincomepredictedoffofexpenditures)butthequalitativeresultsareunchangedifweuseitasaproxyinstead.
15
extent,reflectremittancesfrommigrantandsplitchildren,andweareinterestedinisolatingthemechanismsbehindIGEthatflowfromparenttochildratherthantheotherwayaround.Theestimationofequations2‐8representstheprimarycontributionofthispaper.Becausecapitaltransmissionslikelyshareanerrorstructureforanygivenchild,wewouldnormallyestimateequations2‐5simultaneously,correctingforlikelymeasurementerrorinparentincomeusingThreeStageLeastSquares(3SLS).8However,becauseourregressorsareidenticalacrossall4transmissionequations,orderconditionsdonotholdforsimultaneousestimation,and3SLSisequivalenttoaseriesof4ordinaryleastsquaresestimations,instrumentingforparentincomewithparentexpenditure(OLS‐IV).Thisishowweestimatethefourtransmissionequations,whichappearinTables2and3,andalsohowweestimateEquations6‐8,whichappearinTables5‐8.Inallinstancesweclustererrorsattheparenthouseholdlevel.Becauselandinheritanceandspouseeducationcapitallevelsaredeterminedinthesameperiodasmigrantstatus(whichindicateswhetherachildmovesoutsideoftheirparents’barrio,orgeographicarea),wedonotcontrolformigrantstatusinequations4and5.Wetreatmigrantstatusasanintermediaryoutcome,itselfaconsequenceofparentcapitallevels.Ratherthanbeingaformofhumancapitalinandofitself,migrationchangesthereturntohumancapital,suchaseducation,byaffordingoneaccesstodifferentlabormarkets(Mudeetal2007).However,theestimationresultsarerobusttobothincludingmigrantstatusasacontrolvariableinequations4and5andalsoestimatingafifth“transmission”equationalongwithequations2‐5,whichgivesmigrantstatusasafunctionofparentcapitallevels(resultsavailableonrequest).Asmentionedearlier,decomposingIGEintoparent‐to‐childcapitaltransmissionsdoesnotnecessarilyilluminatethemechanismsbehindthesepathways.Knowingthatmother’seducationisassociatedwithanincreaseordecreaseinchildhealth,forinstance,doesnotilluminatethebehaviorsorcircumstanceswhichcreatesuchanassociation.Inordertobeginexplorationofsuchmechanism,weaddcontrolstothedecompositionsgivenbyEquations2‐52,afterestimatingthoseequationsontheirown.ThesecontrolsallowsomeinformedspeculationastothecausalmechanismsbehindimportantIGEpathways.Thesedetailsarediscussedinthesubsectionsthatfollow.6.ResultsTables2and3displayestimatesofintergenerationalhumanandphysicalcapitaltransmissionfordaughtersandsons,respectively.Theregressionsshownineachtablewereestimatedsimultaneouslyvia3SLS,instrumentingforparentincomewithparentexpenditure.Ineachtable,columns1and2reflecteducationandheighttransmission,
8Onemightalsohypothesizethataseparateerrorstructuresexistsforchildhoodtransmissions(thatofeducationandheight)andyoungadulttransmissions(thatoflandandspousecapital).Thisassumptionwouldsuggesttwoseparateestimationsofthe(sub)systemsofequations,whichleadstoalmostidenticalresultsasdisplayedinTables2and3.Wegowiththelessrestrictiveassumption.Theotherresultsareavailableuponrequest.
16
respectively,andcolumns3and4estimatelandholdingandspouseeducationtransmission,respectively.Wediscusseachofthesecapitaltransmissionsinturn,andthenexamineanddecomposeintergenerationalincometransmission.TheparentcapitalvariablesinTables2and3arecorrelatedbutnotmulticollinear.Thetoleranceofeachparentcapitalvariable,withrespecttoallotherparentcapitalvariables,rangesfrom0.54to0.99,withameanvarianceinflationfactorof1.42.Furthermore,capitaltransmissionregressionsthatcontrolforoneparentcapitallevelatatime,asacheckontherobustnessoftherelativeassociationsbetweenparentandchildcapitallevelsinTables2and3,generateverysimilarresults(detailsavailablebyrequest).Whileseveralpointestimatesincreasewhenparentcapitallevelsarecontrolledforindividually–almostcertainlyduetoomittedvariablebias–therelativemagnitudesofcoefficientsbothwithinandacrosstransmissionequationsremainslargelyunchanged.EducationTransmissionParentalincomeexertsastatisticallysignificantpositiveeffectonlyondaughters’education,althoughtheeffectisnotstatisticallysignificantlygreaterfordaughtersthanforsons.Thepointestimatesarereasonablysimilar,1.6versus1.3yearsadditionaleducationforgirlsandboys,respectively,foreachdoublingofparentalincomeduringchildhood,butfarmorepreciselyestimatedfordaughtersthansons.9Notethatfreepublicprimaryschoolhadbeenlongestablishedby1984,whenround1oftheBPSwasconducted,andfreesecondaryschoolwasestablishedin1988.Theseresultssuggestthatdespitefreegovernmenteducation,childeducationappearsanormalgood,likelyduetothegreatermarginalvaluationofchildincomebypoorerparents,butwiththeeducation‐incomeassociationhavinggreatervariationforsonsthanfordaughters.Directintergenerationaleducationtransmissionclearlyoccurs,especiallyfrommotherstochildren.Themagnitudeoftheestimatedeffectofthemother’seducationistwotothreetimesthatofthefather’seducation(althoughthedifferenceisnotstatisticallysignificant)andstronglystatisticallysignificantlydifferentfromzero.Afather’seducationhasnostatisticallysignificanteffectonsons’education,butdoeshaveamarginallysignificanteffectondaughters’education.Thereis,however,nostatisticallysignificantdifferencebetweentheeffectofafather’seducationondaughtersandonsons.Curiously,mother’sheightisnegativelyandstatisticallysignificantlyrelatedtodaughter’seducation,whichmayreflectanincreasedneedfordaughterstoprovidedomesticworkgiventhehigherlabormarketopportunitycostoftallermothers’time.Unfortunately,thedatadonotallowustotestthathypothesis.HeightTransmissionControllingforparentalhumancapital,parentalincomehasnostatisticallysignificantrelationshipwithchildren’srealizedadultheight.Healthtransmissionthusappearsmore
9Moreover,thecoefficientestimateonparentalincomemaybebiasedupwardinthedaughters’educationequationbecausewerejecttheexclusionaryrestrictiononparentexpenditure,whichweusetoinstrumentforparentpermanent/structuralincome.Parentexpenditurehasapositivecorrelationwithdaughters’educationindependentofparentincome.
17
directthanmediatedbyliquidityeffects.Aswithamother’seducation,mother’sheightpositivelyandsignificantlyimpactstheheightofbothsonsanddaughters.Father’sheighthasonlyasignificantimpactontheheightofsons.Fordaughters,theimpactofmother’sheightisclosetotentimesgreaterthanthatoffather’sheight,adifferencethatisstatisticallysignificant.Forsons,theimpactofmother’sheightisonly20percenthigherthanthatoffather’sheight,adifferencethatisnotstatisticallysignificant.Thenegative,(weakly)statisticallysignificantrelationshipbetweenmother’seducationanddaughter’sheightisstriking,aswasthenegativerelationshipbetweenmother’sheightanddaughter’seducation.Again,thiseffectmayrelatetomaternallaborsupply.Avarietyofauthorshaveshowedthatmaternallaborsupplyand/oramother’sfeedingpractices,bothofwhichmightbeassociatedwithamother’seducationorheight,caninfluencechilddevelopment(Leslie1989).Amoreeducatedmothermightbelesslikelytobreastfeedherchild,forexample.Indeed,inoursamplemother’seducationispositivelycorrelatedwithbottlefeeding.Blauetal(1996)findthatbothmother’slaborsupplyandmother’swagesarenegativelyassociatedwithbreast‐feedinginruralPhilippines.Theirresultsshow,however,thatincreasedmaternallaborsupplyactuallyimproveschildhoodhealthinthelongrun,withperhapsquestionableimpactsintheveryfirstmonths.Poordataonchildfeedingpracticespreventsusfromestimatingtheassociationbetweenmaternallaborsupplyorfeedingpracticesanddaughter’sheightin2003.However,Table4illustratestheassociationbetweenmaternallaborsupply,feedingpracticesandmother’sbirth‐ageonheight‐for‐agez‐scores(HAZ)forchildrenunderfiveyearsofagein1984.Notethatthisregressionincludesthosechildreninthe1984surveywhowerenotfollowedduringthe2003/4survey.Controllingforchildfeedingpracticesdoeschangethesignonmother’seducationfromnegativetopositivefordaughters,althoughthisisnottrueforsons.Theseresultsaresuggestiveonly,butleaveopenthepossibilitythatnegativeassociationsbetweenadaughter’shumancapitalandmother’sheightoreducationlevelmaybearesultofmaternallaborsupply.LandTransmissionItmayseemsurprisingtofindinsignificantlandtransmissiontobothsonsanddaughters,giventhattheBPSdataweregatheredinpredominantlyagriculturalcommunities.ThisresultisalmostcertainlyduetothesignificantlandreformundertakenbytheAquinogovernmentin1988,betweenthetwosurveyrounds.Duringthistime,landacrossthecountrywasredistributedfromlandownerstotenants.Officially,landownerswerenotallowedtoretainmorethanfivehectaresofland,andindeedintheBPSdatalandholdingsfellsharply,onaverage,forfamilieswhoheldoverfivehectaresoflandin1984.Familieswithfewerthanfivehectaresoflandin1984didgenerallygainlandoverthedecade,althoughat‐testfindstheincreasestatisticallyinsignificant.Thefactthatwedonotobservetransmissionbetweenparentlandholdingsin1984andeventualchildlandholdingsdoesnotnecessaryimplythatlandreformequalizedlandaccessinBukidnon.Ideally,wecouldexamineintergenerationallandtransmissionusingparentlandholdingsimmediatelybeforechildrenmovedawaytobegintheirownhousehold.Ninetypercentofchildreninthesampleleftafter1988,theprimaryyearof
18
landreformimplementationbythegovernment.Ifthedistributionoflandholdingschangedsignificantlyenoughbetweenthe1984observationsandtheyearsinwhichchildrenestablishedtheirown(agricultural)households,thentheresultingmeasurementerrorcouldsignificantlyattenuateourestimateofthetrueintergenerationallandtransmissionrate.Asacheckonthatpossibility,weregress2003childlandholdingson2003parentlandholdingsandfindamuchhigher,statisticallysignificantcorrelationinthesepost‐landreformestimates(seeAppendix3).However,giventhat2003landholdingsandchildlandholdingsweremeasuredconcurrently,thiscannotreflectdirecttransfersfromparentto(adult)childandthuslikelyindicatesproductivitytransmission,marketconnections,and/orotherformsofintra‐familialcorrelatedunobservedheterogeneity.Thefactthattheestimatedlandtransmissionratefrom2003parentlandholdingsissignificantlygreaterforsonsthanfordaughtersmaystemfromdifferentlandinheritancecustoms(sonsarealmosttwiceaslikelyasdaughterstoinheritland,andinheritanaveragevalueovertwicethatofdaughters),butcouldalsojustreflectsons’greaterpropensitytofarm,resultinginstrongerintergenerationalcorrelationinunobservedheterogeneityduetoskill,marketaccess,etc.Lowlandtransmissionratesmayalsobeanaturalcharacteristicforagenerationthatisshiftingawayfromland‐basedoccupations.WhileoverhalfofparentsintheBPSdataownland,inboth1984and2003,only11percentofchildrenownlandin2003/4.Whilealmostallparentsworkedintheagriculturalsectorin1984,onlyaboutaquarteroftheadultchildrensurveyedin2003listagriculturalworkastheirprimaryoccupation.In1984,thewealthiest,tallest,andoftenmosteducatedparentswerethelandholdingparentswhogrewsugarorcorn,themostremunerativecropsintheregion.By2003,however,thewealthiestandmosteducatedchildrenheldprofessionaljobssuchasgovernmentofficialsorteachers.Theseprofessionalchildrenaremorelikelythanotherchildrentocomefromlandholdingfamilies,andtheyholdlandatslightlyhigherratesthanotherchildren.Yetlandisunnecessaryfortheirprimaryjob,amajortransitioninjustonegeneration.Expresseddifferently,in1984thebivariatecorrelationcoefficientbetweenparentlandholdingsandparentincomewas0.719.By2003thatcorrelationcoefficientforparentshadfallento0.639.Morestrikingly,thecoefficientbetweenchildlandholdingsandchildincomein2003wasjust0.275.Takahashi(2013)findssimilargenerationaltrendswhenitcomestooccupationandagriculturalincomeinruralPhilippines.Wecannotestablishthatgovernmentlandreformloweredintergenerationallandtransmissionratesorhelpedtocatalyzetherapidoccupationalshiftawayfromland‐basedincomeinBukidnon,butourresultsareconsistentwiththathypothesis.SpouseEducationParentincomeispositivelyandsignificantlyassociatedwiththeeducationalattainmentofadaughter’sspouse,andbutnotason’sspouse.Thisgenderdifferentialissignificantatthetenpercentlevel.Aswithhumancapitaltransmission,mother’seducationissignificantlyandpositivelyassociatedwithspouseeducationforbothsonsanddaughters,thoughthemagnitudeofthisimpactis(insignificantly)higherforsonsthanfordaughters.
19
Father’seducationispositivelyandsignificantlyrelatedtotheeducationofadaughter’sspouse,butnottotheeducationofason’sspouse.Giventheillustratedexistenceofparent‐to‐childeducationtransmission,itseemspossiblethattheimpactofparenteducationonspouseeducationmightworkindependentlyoforthroughchildeducation.Controllingforchildeducationdirectlyinequation5suggeststhatthecorrelationofBukidnonparents’attributeswiththeeducationlevelsoftheirchild’sspouseworkspredominantlythroughavenuesotherthanthechild’sowneducation(seeAppendix4).Inparticular,theinfluenceoffather’seducationontheeducationlevelofson‐in‐lawsisalmostundiminishedaftercontrollingfordaughter’seducation,andtheinfluenceofmother’seducationontheeducationofdaughter‐in‐lawsisbarelyreducedbycontrollingforson’seducation.Thissuggestsmorematchingonsocialstatusandthroughassociatedsocialnetworksthatarecorrelatedwithparentalincomes,ratherthanstrictassortativematingbasedonpartners’educationalattainment.ThisfindingcontrastswiththeconclusionsofDeSilvaandBakhiar(2011),whousesimilarregressionstotestthevalidityofparenteducationasaninstrumentforchildeducationinthePhilippinecontext.TheysupportthetheoreticalvalidityofthisinstrumentbynotingthatinthePhilippines,familiesplayarelativelyminorroleinthechoiceofmarriagepartners;only30percentofthewomenintheirsamplewereintroducedtopartnersbyparentsorotherfamilymembers.Indeed,itmaybetruethatparentincomeandparenteducationplayalesserroleinthePhilippinemarriagemarketthaninothercountries.Thismakesourfindingsallthemorestriking,asitdoescertainlyappearthatdespitetheirlackofpersonalinvolvement,parenteducationand(fordaughters)parentincomearestillstronglyassociatedwithassorativematchinginthePhilippinesmarriagemarket,evenaftercontrollingforchildeducation.Takentogether,theresultsdisplayedinTables2and3suggestthatthetransmissionofmother’shumancapitalmaybelessgender‐specificandgenerallystrongerthanthetransmissionoffather’shumancapital.Quisumbing(1994)andEstudilloetal(2001b)foundsimilarpatternsofgender‐specificintergenerationalcapitaltransmissionsinthePhilippines.However,thereisnoclearpatternofwhichchildisfavoredbytransmissionsfrompaternalcapital.Whileafather’seducationhasastrongerimpactontheeducationofdaughtersthanonsons,afather’sheighthasastrongerimpactontheheightofsonsthandaughters.Anothergeneralresultisthatwhenwere‐estimateequations2‐5,droppingparentalincomeasanexplanatoryvariable(resultsavailablebyrequest),wefindfewqualitativechangesintheresultingestimates.Thisprovidesastrongindicationthatmostofobservedintergenerationalcapitaltransmissionisdrivenbyfirsttworeasonswepositabove–directheritabilityorparentalexpectations/preferences–andnotduetoparentalliquidityconstraintsoninvestmentinchildcapitalaccumulation.Wedosee,however,thatfailingtocontrolforparentincomeappearstoincreasethemagnitudeandsignificanceofthefollowingpositiverelationships:(i)theassociationbetweenparentlandholdingsandchildeducationofbothgenders,(ii)theassociationbetweenparentlandholdingsandthespouseeducationofdaughters,and(iii)theassociationbetweenparenteducationandson’s
20
education.Inthefirsttwocases,itislikelythatparentlandholdingssimplycaptureproductivitytransmissionorevenliquidityconstraints,intheabsenceofparentincome.Thethirdcaseseemslogicalgiventhatparenteducationishighlycorrelatedwithparentincome,andclearlysons’educationisanormalgood(withhighvariation)withinthissample.IncomeTransmissionTheprecedingestimatesestablishthatintergenerationalcapitaltransmissionisstatisticallysignificantandofconsiderablemagnitudeinmanycases,especiallywithrespecttohumancapital.Thismotivatesthedecompositionofintergenerationalincometransmission(IGE)presentedinTables5‐8.ThesetablesgraduallydecomposeIGEaccordingtoequations6‐8fordaughters(Table5),sons(Table6),migrants(Table7)andnon‐migrants(Table8).Ineachtable,thenumberofobservationsusedinthelasttworegressionsisslightlylessthanthatinthefirstthreeregressionsduetomissingchildcapitalvariables,primarilyspouseeducationandheight.Coefficientestimatesarevirtuallyidenticalifonlytheexactsamecoreobservationsavailableforallspecificationsareusedineachcolumn(resultsavailablebyrequest).Giventhatmigrantscompriseanon‐randomselectionofthebroaderadultchildpopulation,andsincemigrantstatusmaybedeterminedbyfactorsthatalsoaffectincome,thecoefficientestimatesinTables7and8mightbebiased.Heckmancorrectionmodelestimates(availablebyrequest),however,findthecoefficientestimateonthemigrantselectioncovariatestatisticallyinsignificantinallcases,andfindalmostnochangeinothercoefficientestimates.SoprospectiveselectiononobservablesdoesnotseemtohaveanyappreciableeffectonIGEpatternsinthissample.OnemightalsowonderwhetherIGEvariessignificantlyacrossthepopulation,acrosspoorandwealthy1984families,forinstance.Whilesamplesizerestrictssuchinvestigations,ouranalysisusingparametric,semi‐parametric,andnon‐continuousmethodssuggeststhatthisisnotthecase(resultsavailablebyrequest).IGEappearstobefairlyconstantacrossthe1984incomedistribution.Thefirstcolumnofeachtable(5‐8)displaysnaïveIGEestimates,correspondingtoequation1.Theseregressionsinstrumentparentincomewithparentexpenditure,andcontrolonlyforchildageandparentagequadratically,inordertocontrolforlifecycleeffects.Thesecondcolumnsofeachtabledisplaythesameregression,butcontrollingadditionallyforlocation,ethnicity,householdsizeandgender‐specificbirthorder.(ThesesamecontrolswereusedinTables2and3.)TheIGEfiguresestimatedinthefirstcolumnsofTables5‐8–0.43to0.57–areconsistentwiththeexistingliterature.Takahashi(2013)estimatesIGEintheruralPhilippines,uncorrectedformeasurementerror,tobeapproximately0.22,similartoourownfindingswhenweuseuncorrectedOLSregressiontoestimateIGE(seeTableA4inAppendix2).Mazumder(2005)andBehrmanandTaubman(1990)findIGEestimatesofover0.5intheUSwhenmeasurementerrorisproperlycontrolledfor,andSalon(2002)compilesatableofIGEestimatesfromoutsidetheUSwhichrangefrom0.11to0.57.Blanden’s(2013)
21
cross‐countrycomparativereviewlikewisereportsseveralIGEestimatesinthissamerange.WhiletheIGEestimateishighestfordaughtersandmigrants,thereisnostatisticallysignificantdifferenceinIGEacrossethergenderormigrantstatus.10Itisinterestingtonote,however,thattheR2ofcolumn1inTable5ismorethandoublethatofcolumn1inTable6,indicatingthatparentincomebetterexplainsdaughterincomethansonincome.Controllingforethnicity,location,householdsizeandbirthorderinthesecondcolumnofeachtableincreasestheR2forsonsbyafactorofseven,andfordaughtersbyafactorofalmostthree.Fromthesetwocolumnsalone,itseemsclearthatfamilycapital,incomeand/orproductivityplaysalargerroleininfluencingdaughters’adultincomethansons’adultincome,whichseemstobetterexplainedbyextra‐familialstructuralfactorssuchasethnicityandlocation.Whileonemightbetemptedtoassumethatthisdifferenceisduetothehigherproportionofdaughterswhomigrate(50percentofdaughtersasopposedto37percentofsons),theR2actuallyincreaseslessfromcolumn1tocolumn2forsplitsthanitdoesformigrants. Thethirdcolumnsofeachtableincludeparentcapitallevelsasadditionalregressors,followingequation7,illustratingtheinfluenceofparent‐to‐childcapitaltransmissionsonIGE.Mother’seducationandparentincomearebothstatisticallysignificantpredictorsofadaughter’sadultincome.Theimportanceofmother’seducationisunsurprisinggivenitsimportancetoadaughter’seducationandtotheeducationofadaughter’sspousethroughassortativemarriage.Whatisstrikingandperhapssurprising,however,isthatparentalincomeexertssuchstronginfluenceoverdaughters’adultincome,evencontrollingforparentalcapitalstocks.Wesuspectthatthispartlyreflectsthecomplexityofassortativemarriage,andthefactthatlimitedinformationonspouses’backgroundslimitsourabilitytocontrolformaritalmatchingonattributesotherthaneducation.Forexample,especiallysuccessfulfarmingfamiliesmaymarryoffdaughterstolocalmerchants’sonswhoinheritthefamilybusinessbutdonotaccumulatemucheducation.Inourspecifications,suchmechanismsappearasresidualcorrelationbetweenadultchildandparentalincomecontrollingforparentandchildcapitalstocks.Parentlandholdingsarealsoasignificant,butnegative,predictorofdaughter’sincome.Thisrelationship–whichdoesnotappearifweuseparent2003landholdingsinplaceofparent1984land(seeAppendix3,tableA5)–maystemfromgovernmentlandreform.Sincelandlessfamiliesoftengainedlandduringthereform,andfamilieswithoverfivehectaresoflandoftenlostland,1984landholdingsmaybenegativelycorrelatedwithsubsequentstandardsofliving,holdingotherfactorsconstant.Itiscurious,however,thatwedonotseeanegativeassociationbetween1984parentlandholdingsandson
10Thecoefficientestimateonparentalincomeincolumn1ofthesons’incomeequationmaybebiasedupward,however,becausewerejecttheexclusionaryrestrictiononparentexpenditure,whichhasapositivecorrelationwithsons’incomeindependentofparentincome.Thesameistrueforcolumn2ofthedaughters’incomeequation.
22
landholdings.Perhapsthisreflectsthecustomthatlandisprovidedfirsttosons,andonlytodaughterswhensurplusisavailable.Forsons,mother’seducationandmother’sheightaretheonlystatisticallysignificantpredictorsofincome.(Ifwecontrolfor2003ratherthan1984parentland,parentlandisalsoasignificant,positivepredictorofsonincome.)Thenegativeimpactofmaternalheightonsonincomeispuzzling.Sincematernalheighthasasignificantlypositiveimpactonson’sheight,itwouldappearthatson’sheightisnotasignificantpredictorofson’sincome.Perhapsthisreflectsthedemographicandoccupationalshiftsdiscussedearlier.Mother’seducationistheonly(weakly)significantpredictorofmigrantincome,andnoparentcapitalvaluesaresignificantlyassociatedwithsplitincome.Thisfurthersuggeststhatparentcapitaltransmissionsarebasedonchildgenderratherthanonmigrantstatus.Thecoefficientestimateonparentincome,however,issignificantonlyforsplitsanddaughters,thoughlargeinmagnitudeformigrants.Infact,thiscoefficientincreasesinmagnitudefromcolumn1tocolumn3fordaughters,splitsandmigrants.Itdecreasesandbecomesstatisticallyinsignificantforsons,andbecomesstatisticallyinsignificantformigrants.Parentincomeisevenmoreimportanttodaughters’adultearningsandtonon‐migrantearningsonceonecontrolsforparentcapitalstocks,whiletheoppositeistruefortheadultearningsofsons.ThissuggestsastronggenderdifferentinIGEchannels.BycontrollingforchildcapitallevelsthemselvesinthefourthandfifthcolumnsofTables5‐8,followingequations6and8,weisolatethecontributionofintergenerationalproductivitytransmission(orperhapsintergenerationaltransmissionofunobservedformsofproductivecapital),asthecoefficientestimateonparentincome.Thesecoefficientestimatesaresignificantandlargefordaughtersandforsplits,andbothsmallandinsignificantforsonsandmigrants.Themagnitudeoftheparentincomecoefficientestimateisalmostbutnotquitethesameacrosscolumns4and5ofTable5,aspredictedinsection3.AWaldtestrejectsthenullthatthesecoefficientsareidenticalfordaughters(p=0.0413)andforsplits(p=0.0076),suggestingthatproductivitytransmissionisnotimpervioustoparentcapitallevels.Thesametestcannotrejectthepossibilitythesecoefficientsareequalformigrantsorsons,whichisunsurprisinggiventheinsignificanceofthecoefficientsbeingtested.Thefactthatthepointestimatesoftheeffectofparentincomeondaughters’adultincome(Table5)fallinmagnitudefromcolumn3tocolumns4and5,albeitnotsignificantly,suggeststhatparentincomeplaysaroleinshapingdaughterincomethroughinvestmentinchildcapitalaccumulation.Thisunderscoresthenormalgoodcharacteristicofbothdaughters’educationanddaughter’sspouseeducation,illustratedfirstinTable5.Thelargeandstatisticallysignificantpointestimatesonparentalincomeevencontrollingforchildandparentcapital,however,clearlyindicatearoleforproductivitytransmissioninshapingdaughters’adultincome.Conversely,thecoefficientsonparentincomeincolumns3‐5ofTable6suggestthatparentincomeandproductivitytransmissionplaylittleroleinshapingsons’adultincome.Thisdifferencebetweenincometransmissiontodaughtersandsonsisstatisticallysignificant,andimpliesdifferentpathwaysbehindsonanddaughterIGE.Thefindingisstrikingandnovelinthisliterature.
23
Furthermore,thepointestimatesonparentincomeformigrants(Table7)fallsharplyinmagnitudefromcolumn3tocolumns4and5.Thesameestimateremainsstatisticallyindistinguishableacrosscolumns3,4,and5fornon‐migrants(Table8).Becausewesupposefromthestartthatparentstodonotinvestinchildcapitaldifferentlyacrossmigrantstatus,itseemsunreasonabletosupposethatparentsconsidermigrantcapitalinvestments(andnotsplitcapitalinvestments)asnormalgoods.Possiblythefallinmagnitudeformigrantsstemsfromthefactthatoverhalfofmigrants(65percent)arefemale.Thegenerallyhighpointestimatesonparentincomeforsplits,inallcolumnsofTable8,mayindicateafarhigherproductivitytransmissionforchildrenwhostayincloserphysicalproximitytotheirparents.ThelasttwocolumnsofTables5and6illustratethatchildlandholdingsareimportantpredictorsofchildadultincome,inspiteofthemarkedtransitiontowardnon‐farmoccupations.Oddly,giventhegenderednatureoflandinheritanceandfarminginthisregionofthePhilippines,theassociationbetweenlandholdingsandincomeissignificantlystrongerfordaughtersthanforsons.Alsocounter‐intuitiveisthefactthatmigrantsandsplitsexperiencesimilarreturnstoland,eventhoughmigrantsaremoreoftenworkingjobsthatdonotrelyonlandholdings.Spouseeducationisalsoanimportantpredictorofchildadultincome,thoughthemagnitudeofthiscoefficientisfourtimesgreaterforsonsthanfordaughters,andstatisticallysignificantlydifferentattheonepercentlevel.Thedifferencebetweentheinfluenceofspouseeducationonmigrantsandnon‐migrantsissignificantonlyatthetenpercentlevel.Owneducationisasignificantpredictorofincomeforallgroupsexceptsplits.Fordaughtersandmigrants,itisagreaterpredictorthanspouseeducation,buttheeducationofsonsislessstronglyassociatedwithincomethanistheeducationoftheirwives.AWaldtestrejectstheexclusionaryrestrictionimpliedbyequations13‐15forsons(p=0.0023)butnotfordaughters(p=0.1208).Inparticular,bothmother’sheightandfather’sheightremainnegativelyassociatedwithsonincomeincolumn5ofTable6.AndwhileparentcapitallevelsasawholearejointlyinsignificantinTable5,mother’sheightandmother’seducationremainindividuallysignificantlypositivelyassociatedwithdaughterincomeincolumn5ofTable5.AsecondWaldtestdoesrejecttheexclusionaryrestrictionwithrespecttomother’seducationandheightonly.AWaldtestrejectstheexclusionaryrestrictionimpliedbyequations13‐15forbothmigrantsandsplits.Itseemsprobablethat,likethecoefficientestimateonparentincome,thecoefficientestimatesonparenthumancapitallevelscapturetheimpactofsomesortofproductivityinheritanceorcorrelatedintergenerationaltransmissionofanomittedcapitalstock.Forexample,perhapsmother’seducationandheightaidadaughter’ssuccessinthemarriagemarketirrespectiveofthehusband’seducationlevel.Orperhapsbyincreasingason’sagriculturalproductivityandthusincreasinghischanceofworkingintheagriculturalsector,parentheightactuallydecreasesason’seconomicproductivitybydivertinghim
24
fromthemoreremunerativenon‐farmsector.Thenegativeimpactsofbothfather’seducationandparentlandonmigrantincomearecuriousandbearfurtherinvestigation.TheRelativeExplanatoryPowerofDifferentPathwaysTheresultsdisplayedinTables5‐8donotallowustocomparetherelativeimportanceofvariousparentcapitallevels,sincethemagnitudeofregressioncoefficientsdependsuponregressorunitsofmeasure.Table9offersonerepresentationofthecomparativeexplanatorypowerofeachpathwayoftransmissionfromparentalcapitalstocks,fordaughters,sons,splitsandmigrants.Wegeneratedlowerandupperboundestimatesofthemagnitudebasedontwodistinctmethodsofestimation.ThefirstmethodestimatescontributionofagivenparentcapitalstockbyaddingonlythatvariabletothenaïveIGEregression(equation1,reflectedinthefirstcolumnsofTables5‐8)andnotingtheresultingchangein .Thisisanupperboundestimateofthemarginalcontributionto becausethesevariablesarenotorthogonaltootherparentalcapitalvariables.ThesecondmethoddropstherelevantparentcapitalvariablefromthefullIGEdecomposition(equation7,reflectedinthethirdcolumnsofTables5‐8).Thisgivesalowerboundestimateofthemarginalcontributionto ,forthesamereasonthatthefirstmethodgivesanupperboundestimate.InTable9wereporttheboundsoneachparentalcapitalstock’s(andresidualparentalincome,orproductivity’s)proportionalshareofthesumofthesemarginalchangesin .TheresultsinTable9largelymirrortheresultsshowninTables5‐8.Theprimaryresultoftheserelativecomparisonsisthatmaternalhumancapital,especiallymaternaleducation,clearlyappearsastheprimarycapitalpathwaybehindintergenerationalincometransmission.Forexample,maternaleducationexplainsover60%oftheexplainablevariationofmigrantincome.Thisresultunderscoresthelong‐termpayofftopromotingtheeducationofgirls,especiallythosefrompoorhouseholds.Paternaleducationappearstobeanimportantpathwayifonefailstocontrolformaternalattributes(upperboundestimate),butoncematernalattributesarecontrolledfor,paternalhumancapitalhasfarless(oftenno)explanatorypower.Thislikelyreflectsassortativemarriage.Similarly,maternalheighthasgreaterexplanatorypowerthanpaternalheight.AssuggestedbyTables5‐8,parentincomehashugeexplanatorypowerwhenitcomestotheadultincomeofdaughtersandsplits,explainingoverthree‐fourthsofthevariationindaughters’incomeand50percentofthevariationinsplits’income.Itismuchlessimportantforsonsandmigrants.Whileparentcapitallevelshavealargeexplanatorypowerwhenitcomestosons’income,theyarelessimportantfordaughters’income,signalingthatitmaybemoredifficulttoidentifyprospectiveinterventionpointstoequalizeopportunityforgirlsinruralPhilippines.Otherparentalhumancapitalvariablesalsohavesomeexplanatorypower.Maternalheightexplainsathirdofthevariationinsons’income.Paternalheightappearstohavegreaterexplanatorypowerwhenthesampleisbrokenbymigrantstatusratherthangender.7.Conclusions
25
Thispaperdocumentshighintergenerationalincomeelasticity(IGE)intheruralPhilippinesandthenillustratesthatdecomposingIGEestimatesintoitsconstituentcapitalandproductivitytransmissionpathwaysisbothpossibleanduseful.ExaminingintergenerationalcapitaltransmissionandintergenerationalincomeelasticityjointlyenhancesourunderstandingofthemechanismsunderpinningIGEandallowsustocomparetheimportanceofparentincomeandparentcapitaltochildcapitalformation.Thispermitsidentificationofdomainsthatappearrelativelylessormoreimportanttopromotingequalityofopportunity,therebyenablingmorefocusedpolicy‐orientedresearchtoidentifywhichsortsofinstitutionalchangesorinterventionsaremosteffectiveinpromotinggreateropportunitiesforchildrenbornintopoorhouseholds.PerhapsthemostimportantconclusionthatcanbedrawnfromourresultsisofsharpgenderdifferencesinthepathwaysofintergenerationalincometransmissionintheruralPhilippines.AlthoughthenaïveIGEestimatesarestatisticallyindistinguishableforsonsanddaughters,thepathwaysthatgeneratetheseresultsdifferstrikingly.Parentincomeperseactuallyplaysnodirectroleinthetransmissionofparentincometosons.Rather,productivecapitalistransmittedacrossgenerations,especiallyintheformsofeducation,healthandlandholdings.Financialliquidityconstraintsarelessimportanttosons’productivecapitalaccumulationandadultincomethanareparentalcapitalendowments,whichmaytransmitdirectly(asinthecaseofheight,duetogeneticsandbehaviors)orviaparentalexpectationsandpreferences.Sons’educationandsons‐in‐law’seducationaretheonlytwochildcapitalstocksthatarestronglyandpositivelyaffectedbyparentincome,indicatingthat“soneducation”(whetherbiologicalormarriedin)isanormalgood.Bycontrast,whileintergenerationalcapitaltransmissioncompletelyexplainstheIGEforsons,parentalincomeexertsaverystrongindependenteffectondaughters’adultincomeandthateffectincreasesratherthanfallsasoneaddscontrolsforparentand/orchildcapitalstocks.Daughters’incomeappearsheavilyinfluencedbysuccessinthemarriagemarket,whichisinpartdrivenbyherowneducation(shapedinlargepartbymaternaleducation),andinpartdrivenbytheeffectsofparentincome.Daughters’adultincomealsoexhibitsconsiderableintergenerationalproductivitytransmission,possiblyrelatedtosocialnetworksandagainworkingthroughthemarriagemarket.Incontrast,parentincomeseemstoplayverylittleroleinobtaininga“valuable”wifeforsonsthroughthemarriagemarket;parentendowmentstransmitmoredirectlytoson’sendowments.Whileitissometimesdifficulttodistinguishpatternsdifferentiatedbygenderfromthoseaccordingtomigrantstatus,itisclearthatthepathwaysbehindIGEalsodifferformigrantsandnon‐migrants.Parentalinvestmentinmigrantcapitalseemsconstrainedbyparentliquidity,likethatofdaughtersandperhapsbecausesuchahighproportionofmigrantsaredaughters.Investmentinnon‐migrantsdoesnotappeartobeconstrainedinthesameway.Theproductivitytransmissiontonon‐migrantsismuchhigherthanthattomigrants,whichseemslogicalgiventhatchildrenwholiveclosetotheirparentscontinuetosharewiththemsocialnetworksandotherfactorsthataffectproductivity.Thevariabilityaroundproductivitytransmissionformigrantsisnotablyhigh,muchhigherthanforanyothergroup.Thismayimplyalargevariationinthebenefitsofsocialnetworksandotherfamily
26
assetsavailabletomigrants,whichwouldbelogicalifboth“pull”and“push”factorsinfluenceachild’sdecisiontomigrate.Additionally,itseemsgenerallytruethatwhilemotherstransmithumancapitalrelativelyequallyandstatisticallysignificantlytobothsonsanddaughters,fathers’humancapitalislessimportanttochildreningeneralandoftenaffectsthecapitallevelofonlydaughtersoronlysons.Mothers’educationisparticularlyimportanttoeventualchildincomebecauseitisstronglyandpositivelyassociatedwithbothownandspouseeducation,eachofwhichis,inturn,stronglyassociatedwithchildadultincome.Thesefindingscarrysignificantpolicyimplications.Policiesfocusedonobviatingtheeffectsofparentincomeinequalityappearlikelytohaveapronouncedeffectonfemales’intergenerationaleconomicmobilitybutnegligibleeffectsontheintergenerationaleconomicmobilityofsonsinBPScommunities.Rather,forsons,theintergenerationaltransmissionofcapitallevels–especiallyineducationandland–mustbemitigatedinordertoenhanceequalityofopportunityacrossgenerations.TheAquinogovernment’ssignificantlandreformsofthelate1980smayhavehelpeddampenIGEbylimitingdirectlandtransfersacrossgenerations.Widespreadfreepublicschoolingthatpredatesourinitialsurveyroundmayalsohelpexplainthestatisticallyinsignificantroleofparentalincomeinexplainingdaughters’educationalattainment,althoughitisstillstronglyassociatedwithsons’educationalattainment.Thisdecompositionapproachtounderstandingtheintergenerationalelasticityofincomeshedsgreaterlightonthemultiple,parallelprocessesunderpinningeconomicmobilitythandosimplestatisticalassociationssuchasnaïveIGEestimatesorasimpleregressionofchildeducationonparenteducation.Whilethisanalysisnecessarilyfallsfarshortofidentifyingthecausalpathwaysthatmightmosteffectivelypermitpolicymakerstoenhanceequalityofopportunity,decomposingthedirectandincometransmissionavenuesallowsustonarrowtherangeofmechanismsworthexploringthroughmoremeticulousstructuralorexperimentalempiricalwork.8.References
Asadullah,M.Niaz.2012.“IntergenerationalwealthmobilityinruralBangladesh,”JournalofDevelopmentStudies,48(9):1193‐1208.Becker,GaryS.1974."ATheoryofSocialInteractions."JournalofPoliticalEconomy,82(6):1063‐1093.Becker,GaryS.andNigelTomes.1979.“AnEquilibriumTheoryoftheDistributionofIncomeandIntergenerationalMobility,”JournalofPoliticalEconomy,87(6):1153‐1189.Beegle,Kathleen,JoachimDeWeerdt,StefanDercon.2011.“MigrationandeconomicmobilityinTanzania:evidencefromatrackingsurvey,”ReviewofEconomicsandStatistics,93(3):1010‐1033.
27
Behrman,JereR.1997."Women'sSchoolingandChildEducation:ASurvey."Mimeo,UniversityofPennsylvania.Behrman,Jere,AlejandroGaviria,MiguelSzekely,NancyBirdsall,SebastianGaliani.2001.“IntergenerationalmobilityinLatinAmerica,”Economia,2(1):1‐44.Behrman,Jere,MarkRosenzweig.2002.“Doesincreasingwomen’sschoolingraisetheschoolingofthenextgeneration?”AmericanEconomicReview,92(1):323‐334.Behrman,Jere,PaulTaubman.1990.“Theintergenerationalcorrelationbetweenchildren’sadultearningandtheirparent’sincome:resultsfromtheMichiganpanelsurveyofincomedynamics,”ReviewofIncomeandWealth,36(2):115‐127.Bhalotra,Sonia,SamanthaRawlings.Forthcoming.“Gradientsoftheintergenerationaltransmissionofhealthindevelopingcountries,”ReviewofEconomicsandStatistics.Bhalotra,Sonia,SamanthaRawlings.2011.“Intergenerationalpersistenceinhealthindevelopingcountries:thepenaltyofgenderinequality,”JournalofPublicEconomics,95(3‐4):286‐299.Black,Sandra,PaulDevereux.2011.“Recentdevelopmentsinintergenerationalmobility,”chapter16inDavidCardandOrleyAshenfelter,editors,HandbookofLaborEconomics,volume4B:1487‐1541(Amsterdam:Elsevier).Blanden,Jo.2013.“Cross‐CountryRankingsinIntergenerationalMobility:AComparisonofApproachesFromEconomicsAndSociology,”JournalofEconomicSurveys27(1):38‐73.Blanden,Jo,RobertHaveman,TimothySmeeding,KathrynWilson.2013.“IntergenerationalMobilityInTheUnitedStatesAndGreatBritain:AComparativestudyOfParent‐ChildPathways,”ReviewofIncomeandWealth.doi:10.1111/roiw.12032Blau,David,DavidGuilkey,BarryPopkin.1996.“Infanthealthandthelaborsupplyofmothers,”JournalofHumanResources31(1):90‐139.Chadwick,Laura,GarySolon.2002.“Intergenerationalincomemobilityamongdaughters,”AmericanEconomicReview,92(1):335‐344.Corak,MilesandAndrewHeisz.1999.“TheintergenerationalearningsandincomemobilityofCanadianMen:evidencefromlongitudinaltaxdata,”JournalofHumanResources,34(3):504–533.Costa,DoraL.1998.“Unequalatbirth:along‐termcomparisonofincomeandbirthweight,”JournalofEconomicHistory,58(4):987‐1009.Currie,Janet,EnricoMoretti.2007.“Biologyasdestiny?Short‐andlong‐rundeterminantsofintergenerationaltransmissionofbirthweight,”JournalofLaborEconomics,25(2):231–
28
264.Dasgupta,Partha.1997.“Nutritionalstatus,thecapacityforwork,andpovertytraps,”JournalofEconometrics77:5‐37.DeSilva,Sanjaya,MohammedMehrabBinBakhtiar.2011.“Women,schoolingandmarriageinruralPhilippines,”LevyEconomicsInstituteofBardCollege,WorkingPaperNo.701.Eriksson,Tor,BerntBratsberg,OddbjørnRaaum.2005.“Earningspersistenceacrossgenerations:transmissionthroughhealth?”Memorandum35/2005,OsloUniversity,DepartmentofEconomics.Ermisch,John,MarcoFrancesconiandThomasSiedler.2006.“Intergenerationalmobilityandmaritalsorting,”EconomicJournal,116(513):659‐679.Estudillo,Jonna,AgnesQuisumbing,KeijiroOtsuka.2001a.“Genderdifferencesinlandinheritance,schoolingandlifetimeincome:evidencefromtheruralPhilippines,”JournalofDevelopmentStudies,37(4):28‐48.Estudillo,Jonna,AgnesQuisumbing,KeijiroOtsuka.2001b.“GenderdifferencesinlandinheritanceandschoolinginvestmentsintheruralPhilippines,”LandEconomics77(1):130‐143.Fogel,Robert.2004.“Health,nutrition,andeconomicgrowth,”EconomicDevelopmentandCulturalChange,52(3):643‐658. Harris,John,MichaelTodaro.1970.“Migration,unemploymentanddevelopment:atwo‐sectoranalysis,”AmericanEconomicReview60(1):126‐142.Hertz,Tom,TamaraJayasundera,PatrizioPiraino,SibelSelcuk,NicoleSmith,AlinaVerashchagina.2007.“Theinheritanceofeducationalinequality:internationalcomparisonsandfifty‐yeartrends,”B.E.JournalofEconomicAnalysisandPolicy,7(2):article10. Jäntti,Markus,BerntBratsberg,KnutRøed,OddbjørnRaaum,RobinNaylor,EvaÖsterbacka,AndersBjörklund,TorEriksson.2005.“AmericanexceptionalisminanewLight:AcomparisonofintergenerationalearningsmobilityintheNordiccountries,theUnitedKingdomandtheUnitedStates,”WarwickEconomicResearchPapers,No.781,DepartmentofEconomics,UniversityofWarwick.Jensen,Robert.2010.“The(Perceived)ReturnstoEducationandtheDemandforSchooling,”QuarterlyJournalofEconomics125(2):515‐548.LaFerrara,Eliana.2007.“Descentruleandstrategictransfers.EvidencefrommatrilinealgroupsinGhana,”JournalofDevelopmentEconomics,83(2):280‐301.
29
Leslie,Joanne.1989."Women'sworkandchildnutritioninthethirdworld."InWomen,Work,andChildWelfareintheThirdWorld,eds.JoanneLeslieandMichaelPaolisso,19‐58.Boulder:WestviewPress.Lewis,W.Arthur.1954.“Economicdevelopmentwithunlimitedsuppliesoflabor,”ManchesterSchool22(2):139‐91.Loury,GlennC.,1981.“Intergenerationaltransfersandthedistributionofearnings,”Econometrica,49(4):843‐867.Maertens,Annemie.2013.“SocialNormsandAspirations:AgeofMarriageandEducationinRuralIndia,”WorldDevelopment,47:1‐15.Maluccio,John,JohnHoddinott,JereBehrman,ReynaldoMartorell,AgnesQuisumbing,AryehStein.2009.“TheimpactofimprovingnutritionduringearlychildhoodoneducationamongGuatemalanadults,”EconomicJournal,119(537):734‐763.Mazumder,Bhashkar.2005.“Fortunatesons:NewestimatesofintergenerationalmobilityintheU.S.usingsocialsecurityearningsdata,”ReviewofEconomicsandStatistics,87(2):235‐255.Mude,Andrew,ChristopherB.Barrett,JohnMcPeak,CherylDoss.2007.“Educationalinvestmentsinadualeconomy,”Economica74:351‐369.Naschold,Felix,ChristopherB.Barrett.2011.“Doshort‐termobservedincomechangesoverstatestructuraleconomicmobility?”OxfordBulletinofEconomicsandStatistics,73(5):0305‐9049.Núñez,Javier,LeslieMiranda.2011.“IntergenerationalincomeandeducationalmobilityinurbanChile,”EstudiosdeEconomia,38(1):195‐222.Österbacka,Eva.2001.“FamilybackgroundandeconomicstatusinFinland,”ScandinavianJournalofEconomics,103(3):467‐484.Pekkarinen,Tuomas,RoopeUusitalo,SariKerr.2009.“Schooltrackingandintergenerationalincomemobility:evidencefromtheFinnishcomprehensiveschoolreform,”JournalofPublicEconomics,93(7‐8):965‐973.Piraino,Patrizio.2007.“ComparableestimatesofintergenerationalincomemobilityinItaly,”B.E.JournalofEconomicAnalysisandPolicy,7(2):1‐15.Quisumbing,Agnes.1994.“IntergenerationaltransmissionsinPhilippinericevillages:Genderdifferencesintraditionalinheritancecustoms,”JournalofDevelopmentEconomics,43(2):167‐197.Quisumbing,AgnesR.,JonnaP.Estudillo,andKeijiroOtsuka.2004.LandandSchooling:
30
TransferringWealthAcrossGenerations.BaltimoreandLondon:JohnsHopkinsUniversityPress.Quisumbing,Agnes,ScottMcNiven.2010.“Movingforward,lookingback:theimpactofmigrationandremittancesonassets,consumption,andcreditconstraintsintheruralPhilippines,”JournalofDevelopmentStudies,46(1):91–113.Raaum,Oddbjørn,BerntBratsberg,KnutRøed,EvaÖsterbacka,TorEriksson,MarkusJänttiRobinNaylor.2008.“Maritalsorting,householdlaborsupplyandintergenerationalearningsmobilityacrosscountries,”B.E.JournalofEconomicAnalysis&Policy,7(2).Sakellariou,Chris.2004.“Theuseofquantileregressionsinestimatinggenderwagedifferentials:acasestudyofthePhilippines,”AppliedEconomics36:1001‐1007.Solon,Gary.2002.“Cross‐CountryDifferencesinIntergenerationalEarningsMobility,”JournalofEconomicPerspectives,16(3):59‐66.Strauss,John,DuncanThomas.1998.“Health,nutrition,andeconomicdevelopment,JournalofEconomicLiterature,36(2):766‐817.Takahashi,Kazushi.2013."Pro‐poorgrowthorpovertytrap?:estimatingtheintergenerationalincomemobilityinruralPhilippines,”IDEDiscussionPaper382,IDE‐JETRO.Thomas,Duncan.1994.“Likefather,likeson;likemother,likedaughter:parentalresourcesandchildheight,”JournalofHumanResources,29(4):950‐988.Thomas,Duncan.1996.“EducationacrossgenerationsinSouthAfrica,”AmericanEconomicReview,86(2):330‐334.Thomas,Duncan,JohnStrauss,Maria‐HelenaHenriques.1991.“Howdoesmother’seducationaffectchildheight?”JournalofHumanResources,Vol.26(2):183‐211.
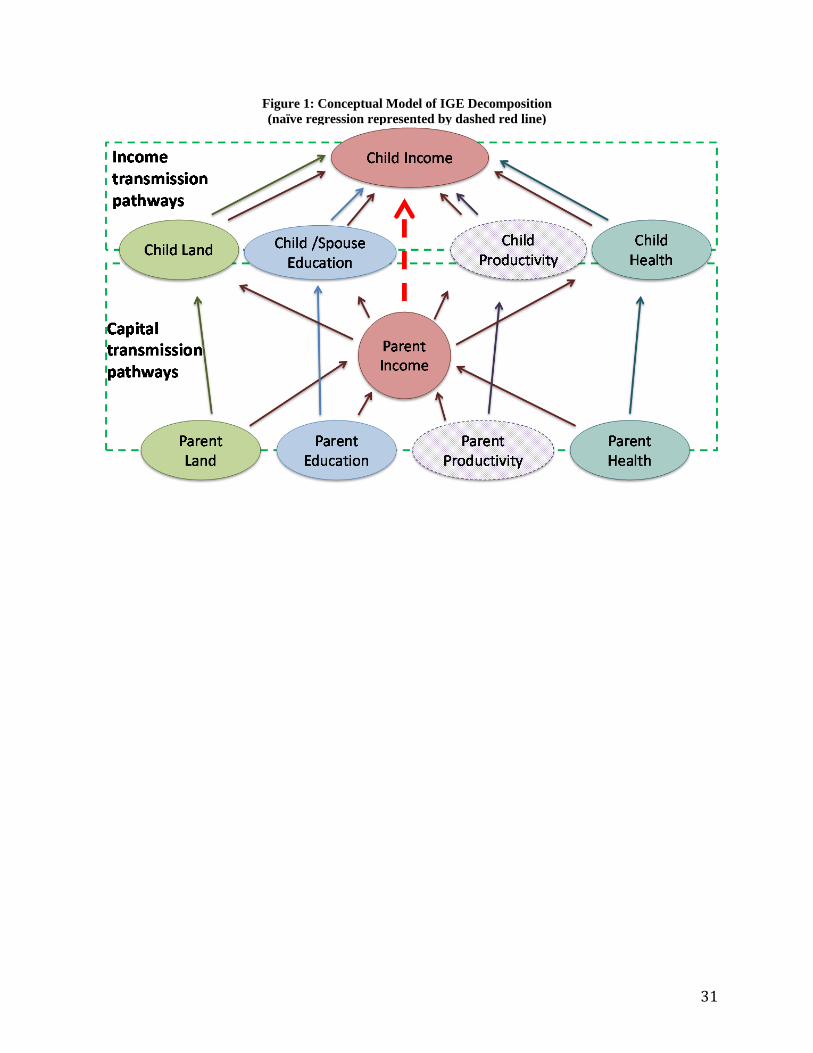
31
Figure 1: Conceptual Model of IGE Decomposition (naïve regression represented by dashed red line)
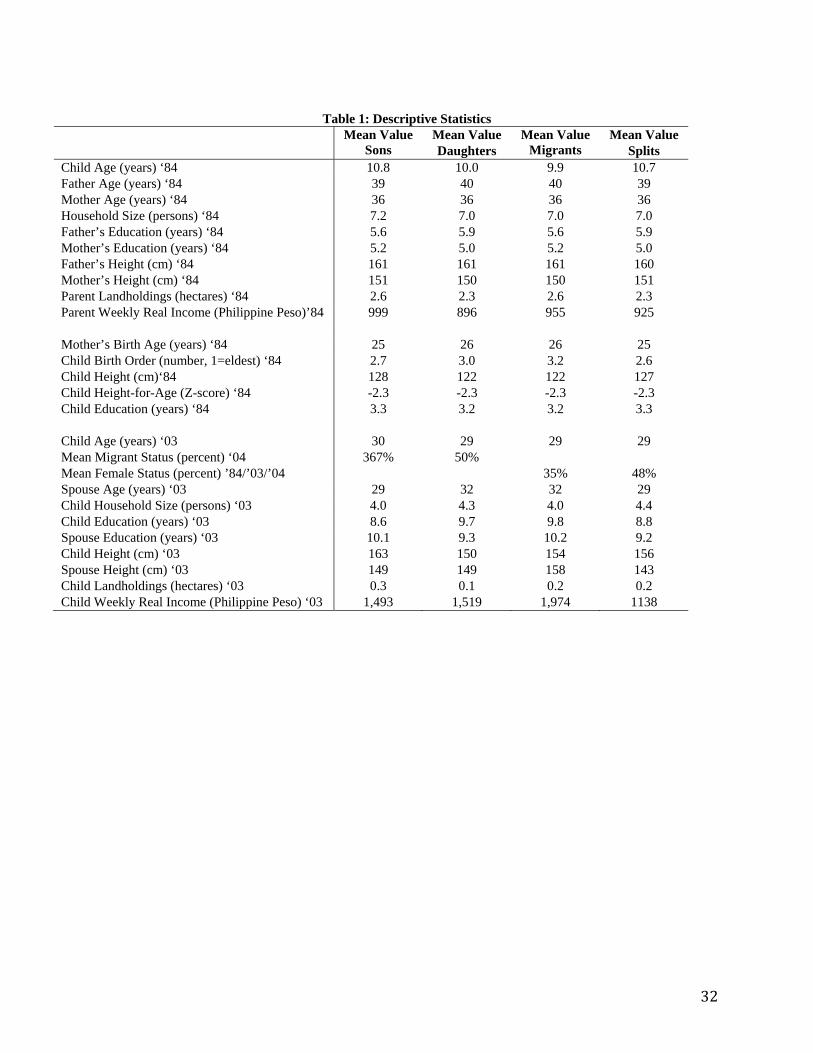
32
Table 1: Descriptive Statistics
Mean Value Sons
Mean Value Daughters
Mean Value Migrants
Mean Value Splits
Child Age (years) ‘84 10.8 10.0 9.9 10.7 Father Age (years) ‘84 39 40 40 39 Mother Age (years) ‘84 36 36 36 36 Household Size (persons) ‘84 7.2 7.0 7.0 7.0 Father’s Education (years) ‘84 5.6 5.9 5.6 5.9 Mother’s Education (years) ‘84 5.2 5.0 5.2 5.0 Father’s Height (cm) ‘84 161 161 161 160 Mother’s Height (cm) ‘84 151 150 150 151 Parent Landholdings (hectares) ‘84 2.6 2.3 2.6 2.3 Parent Weekly Real Income (Philippine Peso)’84 999 896 955 925 Mother’s Birth Age (years) ‘84 25 26 26 25 Child Birth Order (number, 1=eldest) ‘84 2.7 3.0 3.2 2.6 Child Height (cm)‘84 128 122 122 127 Child Height-for-Age (Z-score) ‘84 -2.3 -2.3 -2.3 -2.3 Child Education (years) ‘84 3.3 3.2 3.2 3.3 Child Age (years) ‘03 30 29 29 29 Mean Migrant Status (percent) ‘04 367% 50% Mean Female Status (percent) ’84/’03/’04 35% 48% Spouse Age (years) ‘03 29 32 32 29 Child Household Size (persons) ‘03 4.0 4.3 4.0 4.4 Child Education (years) ‘03 8.6 9.7 9.8 8.8 Spouse Education (years) ‘03 10.1 9.3 10.2 9.2 Child Height (cm) ‘03 163 150 154 156 Spouse Height (cm) ‘03 149 149 158 143 Child Landholdings (hectares) ‘03 0.3 0.1 0.2 0.2 Child Weekly Real Income (Philippine Peso) ‘03 1,493 1,519 1,974 1138
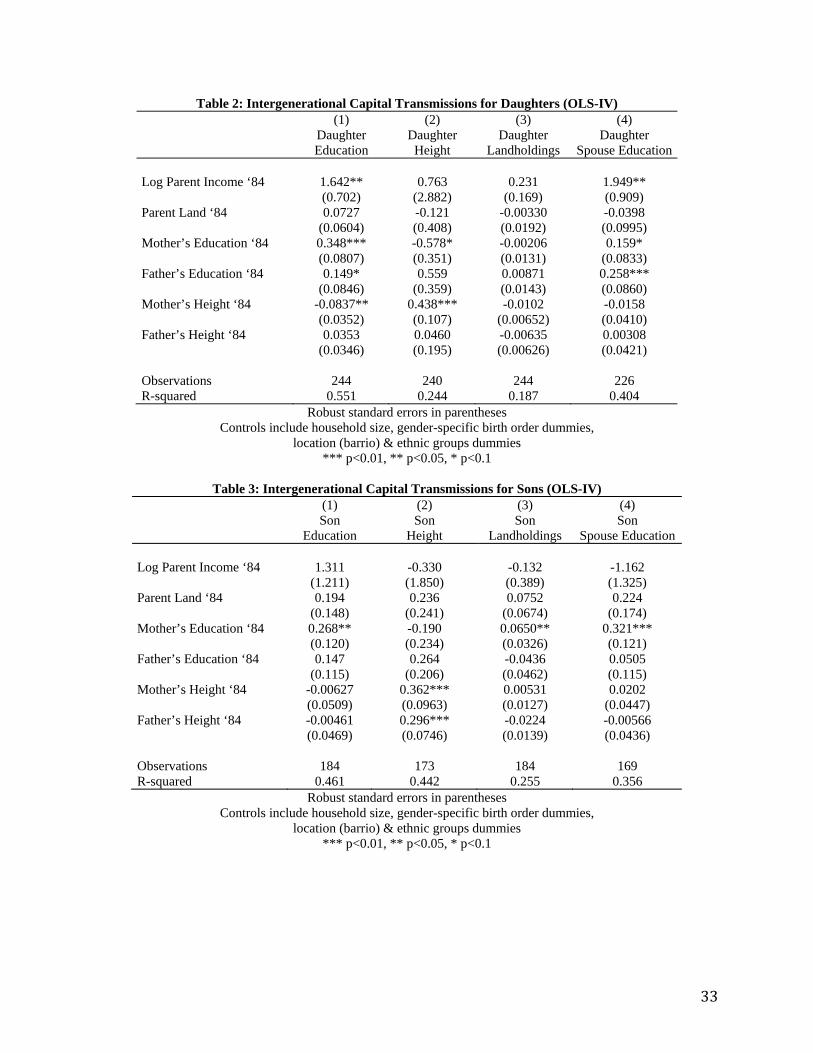
33
Table 2: Intergenerational Capital Transmissions for Daughters (OLS-IV) (1) (2) (3) (4) Daughter
Education Daughter Height
Daughter Landholdings
Daughter Spouse Education
Log Parent Income ‘84 1.642** 0.763 0.231 1.949** (0.702) (2.882) (0.169) (0.909) Parent Land ‘84 0.0727 -0.121 -0.00330 -0.0398 (0.0604) (0.408) (0.0192) (0.0995) Mother’s Education ‘84 0.348*** -0.578* -0.00206 0.159* (0.0807) (0.351) (0.0131) (0.0833) Father’s Education ‘84 0.149* 0.559 0.00871 0.258*** (0.0846) (0.359) (0.0143) (0.0860) Mother’s Height ‘84 -0.0837** 0.438*** -0.0102 -0.0158 (0.0352) (0.107) (0.00652) (0.0410) Father’s Height ‘84 0.0353 0.0460 -0.00635 0.00308 (0.0346) (0.195) (0.00626) (0.0421) Observations 244 240 244 226 R-squared 0.551 0.244 0.187 0.404
Robust standard errors in parentheses Controls include household size, gender-specific birth order dummies,
location (barrio) & ethnic groups dummies *** p<0.01, ** p<0.05, * p<0.1
Table 3: Intergenerational Capital Transmissions for Sons (OLS-IV)
(1) (2) (3) (4) Son
Education Son
Height Son
Landholdings Son
Spouse Education Log Parent Income ‘84 1.311 -0.330 -0.132 -1.162 (1.211) (1.850) (0.389) (1.325) Parent Land ‘84 0.194 0.236 0.0752 0.224 (0.148) (0.241) (0.0674) (0.174) Mother’s Education ‘84 0.268** -0.190 0.0650** 0.321*** (0.120) (0.234) (0.0326) (0.121) Father’s Education ‘84 0.147 0.264 -0.0436 0.0505 (0.115) (0.206) (0.0462) (0.115) Mother’s Height ‘84 -0.00627 0.362*** 0.00531 0.0202 (0.0509) (0.0963) (0.0127) (0.0447) Father’s Height ‘84 -0.00461 0.296*** -0.0224 -0.00566 (0.0469) (0.0746) (0.0139) (0.0436) Observations 184 173 184 169 R-squared 0.461 0.442 0.255 0.356
Robust standard errors in parentheses Controls include household size, gender-specific birth order dummies,
location (barrio) & ethnic groups dummies *** p<0.01, ** p<0.05, * p<0.1
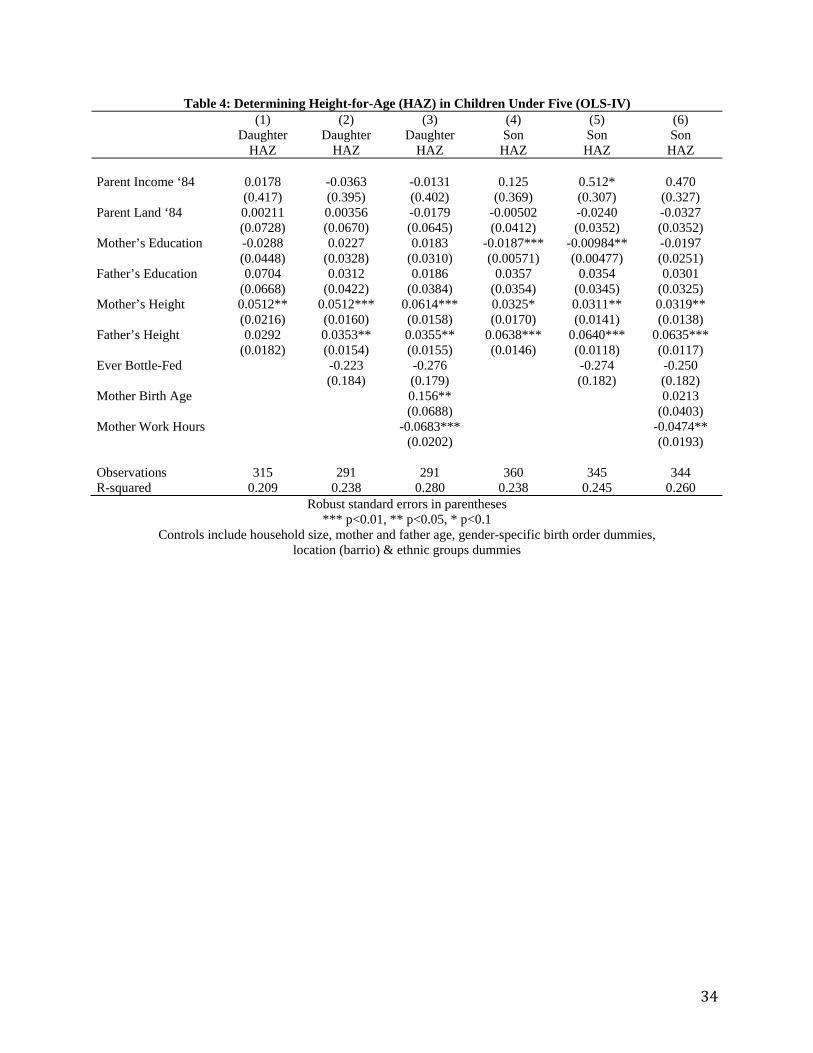
34
Table 4: Determining Height-for-Age (HAZ) in Children Under Five (OLS-IV) (1) (2) (3) (4) (5) (6) Daughter
HAZ Daughter
HAZ Daughter
HAZ Son
HAZ Son
HAZ Son
HAZ Parent Income ‘84 0.0178 -0.0363 -0.0131 0.125 0.512* 0.470 (0.417) (0.395) (0.402) (0.369) (0.307) (0.327) Parent Land ‘84 0.00211 0.00356 -0.0179 -0.00502 -0.0240 -0.0327 (0.0728) (0.0670) (0.0645) (0.0412) (0.0352) (0.0352) Mother’s Education -0.0288 0.0227 0.0183 -0.0187*** -0.00984** -0.0197 (0.0448) (0.0328) (0.0310) (0.00571) (0.00477) (0.0251) Father’s Education 0.0704 0.0312 0.0186 0.0357 0.0354 0.0301 (0.0668) (0.0422) (0.0384) (0.0354) (0.0345) (0.0325) Mother’s Height 0.0512** 0.0512*** 0.0614*** 0.0325* 0.0311** 0.0319** (0.0216) (0.0160) (0.0158) (0.0170) (0.0141) (0.0138) Father’s Height 0.0292 0.0353** 0.0355** 0.0638*** 0.0640*** 0.0635*** (0.0182) (0.0154) (0.0155) (0.0146) (0.0118) (0.0117) Ever Bottle-Fed -0.223 -0.276 -0.274 -0.250 (0.184) (0.179) (0.182) (0.182) Mother Birth Age 0.156** 0.0213 (0.0688) (0.0403) Mother Work Hours -0.0683*** -0.0474** (0.0202) (0.0193) Observations 315 291 291 360 345 344 R-squared 0.209 0.238 0.280 0.238 0.245 0.260
Robust standard errors in parentheses *** p<0.01, ** p<0.05, * p<0.1
Controls include household size, mother and father age, gender-specific birth order dummies, location (barrio) & ethnic groups dummies

35
Table 5: Decomposing Intergenerational Income Elasticity for Daughters (OLS-IV) (1) (2) (3) (4) (5) Income Income Income Income Income Parent Income ‘84 0.537*** 1.040*** 1.033*** 0.748** 0.779** (0.163) (0.278) (0.317) (0.302) (0.344) Parent Land ‘84 -0.0435* -0.0558** (0.0260) (0.0267) Mother’s Education 0.0529* 0.0614* (0.0316) (0.0357) Father’s Education -0.00447 -0.0325 (0.0276) (0.0275) Mother’s Height 0.0160 0.0359*** (0.0113) (0.0114) Father’s Height -0.00606 -0.00619 (0.0140) (0.0117) Own Education 0.0507 0.0632* (0.0331) (0.0346) Spouse Education 0.0380* 0.0356* (0.0200) (0.0193) Own Height -0.00366 -0.00605 (0.00806) (0.00730) Landholdings 0.271** 0.307*** (0.115) (0.112) Age Controls: Yes Yes Yes Yes Yes Additional Controls: No Yes Yes Yes Yes Observations 240 240 240 220 220 R-squared 0.114 0.333 0.356 0.402 0.433
Robust standard errors in parentheses Age controls include quadratic terms for child and father age
Additional controls include parent household size, gender-specific birth order dummies, location (barrio) & ethnic groups dummies
*** p<0.01, ** p<0.05, * p<0.1

36
Table 6: Decomposing Intergenerational Income Elasticity for Sons (OLS-IV) (1) (2) (3) (4) (5) Income Income Income Income Income Parent Income ‘84 0.434*** 0.145 -0.182 -0.135 -0.00884 (0.146) (0.246) (0.410) (0.258) (0.385) Parent Land ‘84 0.0522 -0.0285 (0.0476) (0.0459) Mother’s Education 0.0753* 0.0511 (0.0396) (0.0382) Father’s Education 0.0334 -0.00327 (0.0438) (0.0312) Mother’s Height -0.0349** -0.0598*** (0.0168) (0.0186) Father’s Height -0.0175 -0.0245* (0.0159) (0.0132) Own Education 0.0458* 0.0367* (0.0242) (0.0223) Spouse Education 0.131*** 0.131*** (0.0251) (0.0229) Own Height -0.00124 0.0217 (0.0122) (0.0140) Landholdings 0.182*** 0.161*** (0.0560) (0.0605) Age Controls: Yes Yes Yes Yes Yes Additional Controls: No Yes Yes Yes Yes Observations 182 182 182 157 157 R-squared 0.050 0.351 0.407 0.545 0.594
Robust standard errors in parentheses Age controls include quadratic terms for child and father age
Additional controls include parent household size, gender-specific birth order dummies, location (barrio) & ethnic groups dummies
*** p<0.01, ** p<0.05, * p<0.1
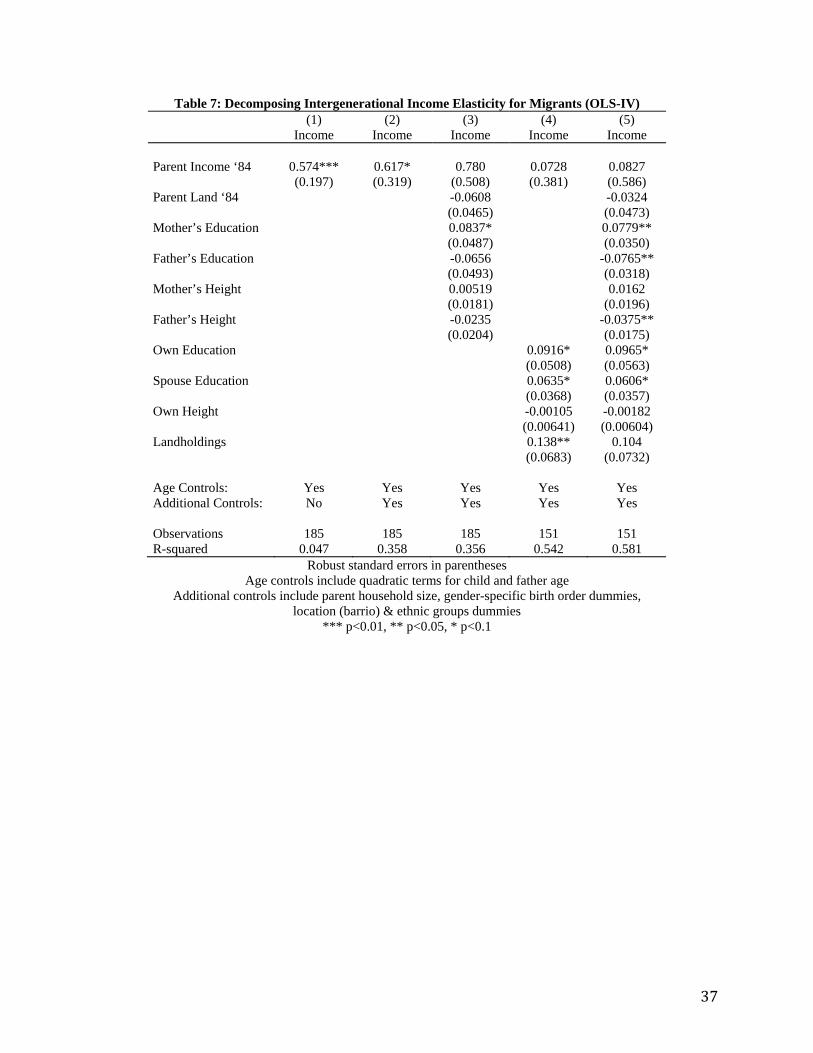
37
Table 7: Decomposing Intergenerational Income Elasticity for Migrants (OLS-IV) (1) (2) (3) (4) (5) Income Income Income Income Income Parent Income ‘84 0.574*** 0.617* 0.780 0.0728 0.0827 (0.197) (0.319) (0.508) (0.381) (0.586) Parent Land ‘84 -0.0608 -0.0324 (0.0465) (0.0473) Mother’s Education 0.0837* 0.0779** (0.0487) (0.0350) Father’s Education -0.0656 -0.0765** (0.0493) (0.0318) Mother’s Height 0.00519 0.0162 (0.0181) (0.0196) Father’s Height -0.0235 -0.0375** (0.0204) (0.0175) Own Education 0.0916* 0.0965* (0.0508) (0.0563) Spouse Education 0.0635* 0.0606* (0.0368) (0.0357) Own Height -0.00105 -0.00182 (0.00641) (0.00604) Landholdings 0.138** 0.104 (0.0683) (0.0732) Age Controls: Yes Yes Yes Yes Yes Additional Controls: No Yes Yes Yes Yes Observations 185 185 185 151 151 R-squared 0.047 0.358 0.356 0.542 0.581
Robust standard errors in parentheses Age controls include quadratic terms for child and father age
Additional controls include parent household size, gender-specific birth order dummies, location (barrio) & ethnic groups dummies
*** p<0.01, ** p<0.05, * p<0.1

38
Table 8 Decomposing Intergenerational Income Elasticity for Splits (OLS-IV) (1) (2) (3) (4) (5) Income Income Income Income Income Parent Income ‘84 0.474*** 0.665*** 0.719*** 0.452*** 0.654*** (0.103) (0.163) (0.258) (0.167) (0.252) Parent Land ‘84 -0.0340 -0.0578 (0.0353) (0.0366) Mother’s Education 0.0368 0.0113 (0.0349) (0.0337) Father’s Education 0.00802 -0.00793 (0.0319) (0.0288) Mother’s Height -0.000835 -0.000551 (0.0118) (0.0127) Father’s Height -0.0144 -0.0127 (0.0108) (0.0108) Own Education 0.0322 0.0388 (0.0209) (0.0248) Spouse Education 0.0728*** 0.0749*** (0.0176) (0.0176) Own Height -0.0100 -0.00145 (0.0112) (0.0127) Landholdings 0.156 0.157 (0.104) (0.106) Age Controls: Yes Yes Yes Yes Yes Additional Controls: No Yes Yes Yes Yes Observations 237 237 237 226 226 R-squared 0.122 0.342 0.348 0.455 0.444
Robust standard errors in parentheses Age controls include quadratic terms for child and father age
Additional controls include parent household size, birth order dummies and a dummy for sex, location (barrio) & ethnic groups dummies
*** p<0.01, ** p<0.05, * p<0.1
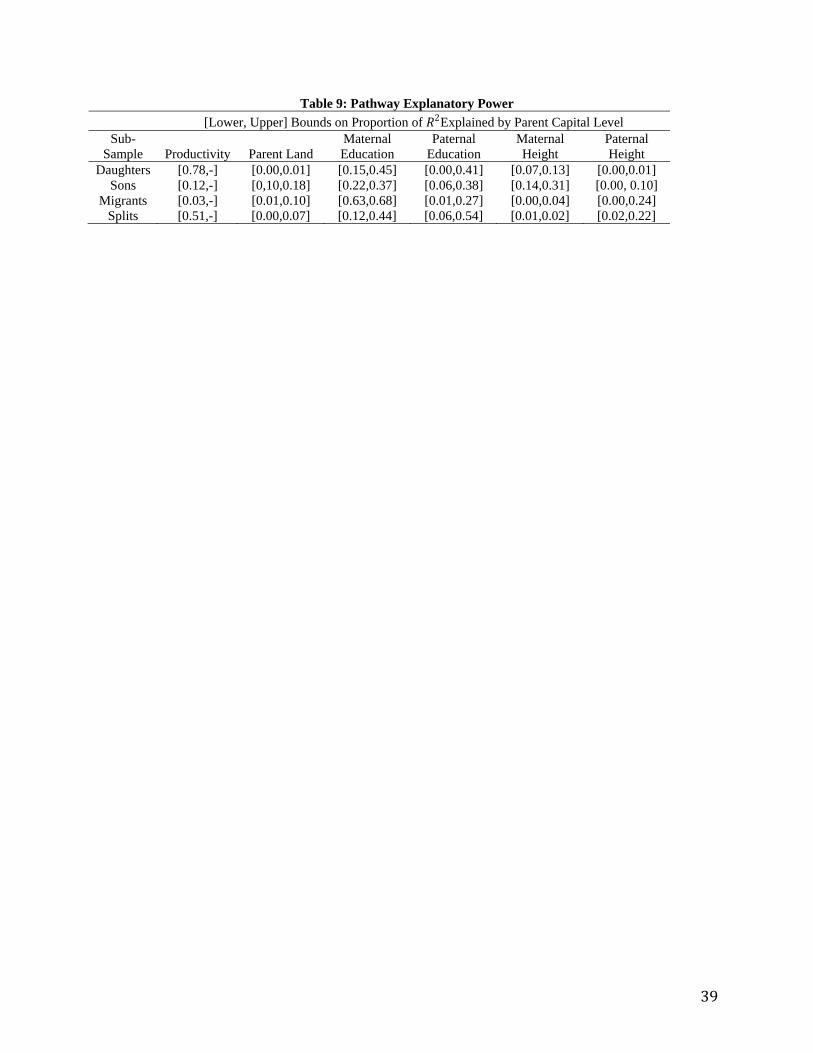
39
Table 9: Pathway Explanatory Power [Lower, Upper] Bounds on Proportion of 2Explained by Parent Capital Level
Sub-Sample
Productivity
Parent Land
Maternal Education
Paternal Education
Maternal Height
Paternal Height
Daughters [0.78,-] [0.00,0.01] [0.15,0.45] [0.00,0.41] [0.07,0.13] [0.00,0.01] Sons [0.12,-] [0,10,0.18] [0.22,0.37] [0.06,0.38] [0.14,0.31] [0.00, 0.10]
Migrants [0.03,-] [0.01,0.10] [0.63,0.68] [0.01,0.27] [0.00,0.04] [0.00,0.24] Splits [0.51,-] [0.00,0.07] [0.12,0.44] [0.06,0.54] [0.01,0.02] [0.02,0.22]
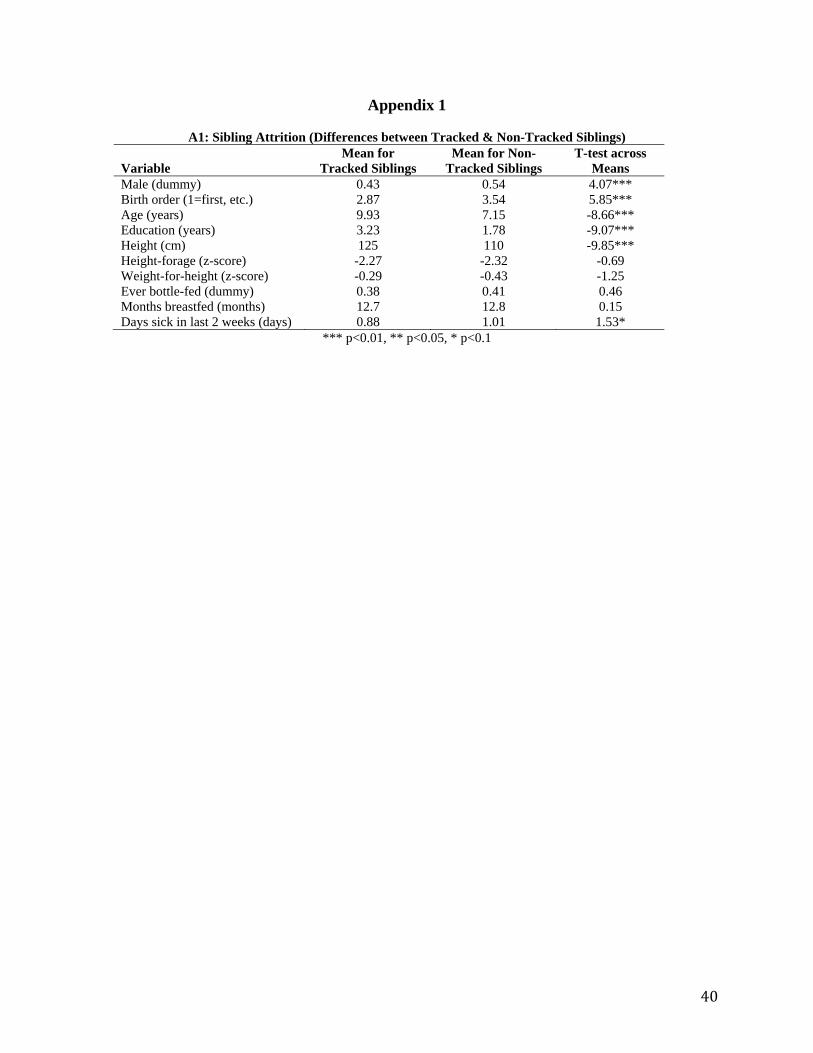
40
Appendix 1
A1: Sibling Attrition (Differences between Tracked & Non-Tracked Siblings) Variable
Mean for Tracked Siblings
Mean for Non-Tracked Siblings
T-test across Means
Male (dummy) 0.43 0.54 4.07*** Birth order (1=first, etc.) 2.87 3.54 5.85*** Age (years) 9.93 7.15 -8.66*** Education (years) 3.23 1.78 -9.07*** Height (cm) 125 110 -9.85*** Height-forage (z-score) -2.27 -2.32 -0.69 Weight-for-height (z-score) -0.29 -0.43 -1.25 Ever bottle-fed (dummy) 0.38 0.41 0.46 Months breastfed (months) 12.7 12.8 0.15 Days sick in last 2 weeks (days) 0.88 1.01 1.53*
*** p<0.01, ** p<0.05, * p<0.1
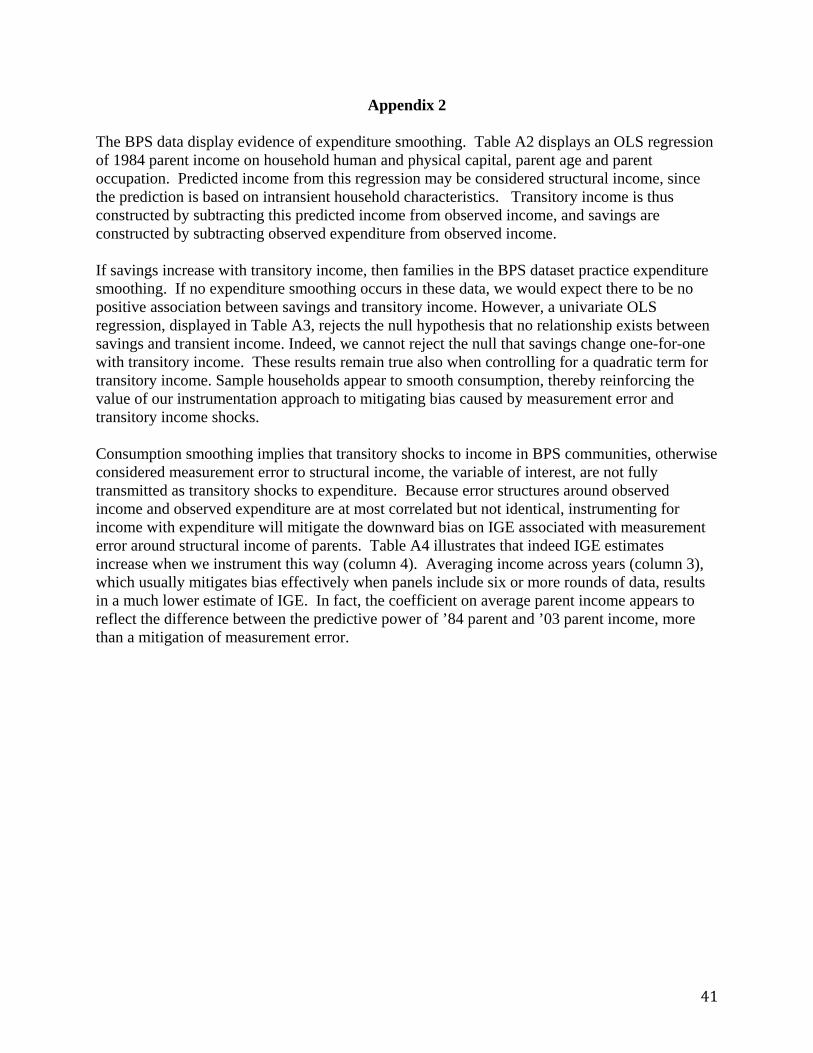
41
Appendix 2 The BPS data display evidence of expenditure smoothing. Table A2 displays an OLS regression of 1984 parent income on household human and physical capital, parent age and parent occupation. Predicted income from this regression may be considered structural income, since the prediction is based on intransient household characteristics. Transitory income is thus constructed by subtracting this predicted income from observed income, and savings are constructed by subtracting observed expenditure from observed income. If savings increase with transitory income, then families in the BPS dataset practice expenditure smoothing. If no expenditure smoothing occurs in these data, we would expect there to be no positive association between savings and transitory income. However, a univariate OLS regression, displayed in Table A3, rejects the null hypothesis that no relationship exists between savings and transient income. Indeed, we cannot reject the null that savings change one-for-one with transitory income. These results remain true also when controlling for a quadratic term for transitory income. Sample households appear to smooth consumption, thereby reinforcing the value of our instrumentation approach to mitigating bias caused by measurement error and transitory income shocks. Consumption smoothing implies that transitory shocks to income in BPS communities, otherwise considered measurement error to structural income, the variable of interest, are not fully transmitted as transitory shocks to expenditure. Because error structures around observed income and observed expenditure are at most correlated but not identical, instrumenting for income with expenditure will mitigate the downward bias on IGE associated with measurement error around structural income of parents. Table A4 illustrates that indeed IGE estimates increase when we instrument this way (column 4). Averaging income across years (column 3), which usually mitigates bias effectively when panels include six or more rounds of data, results in a much lower estimate of IGE. In fact, the coefficient on average parent income appears to reflect the difference between the predictive power of ’84 parent and ’03 parent income, more than a mitigation of measurement error.
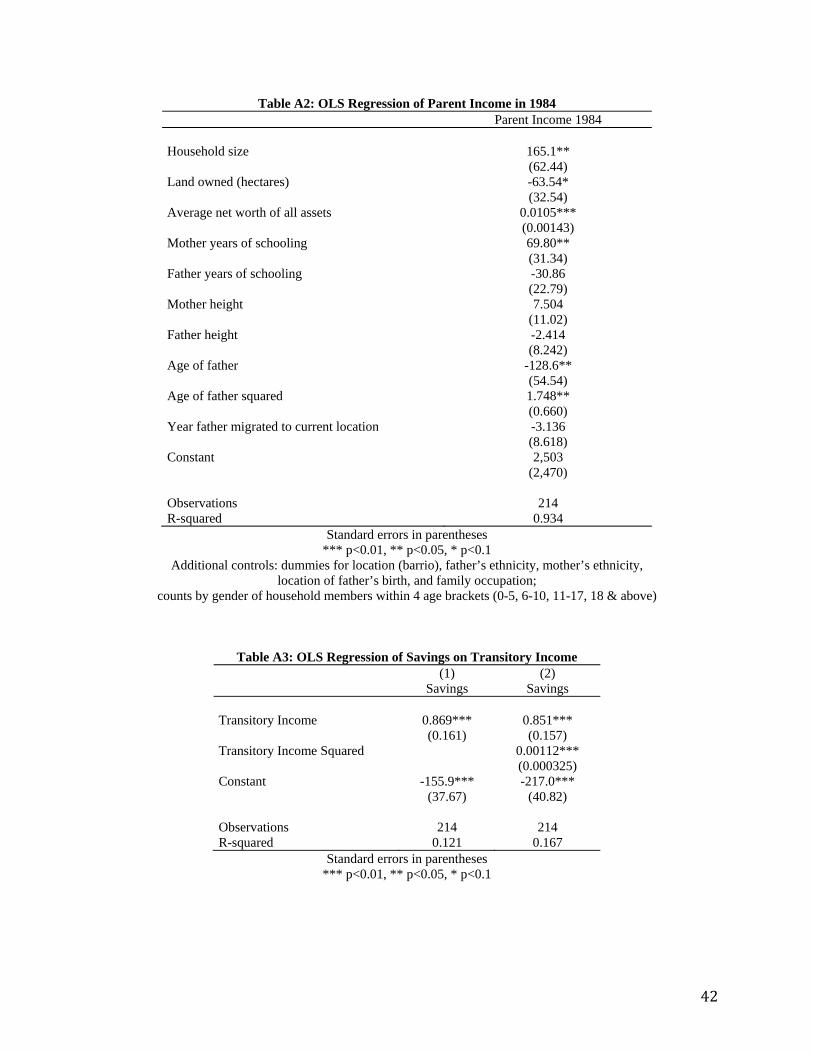
42
Table A2: OLS Regression of Parent Income in 1984 Parent Income 1984 Household size 165.1** (62.44) Land owned (hectares) -63.54* (32.54) Average net worth of all assets 0.0105*** (0.00143) Mother years of schooling 69.80** (31.34) Father years of schooling -30.86 (22.79) Mother height 7.504 (11.02) Father height -2.414 (8.242) Age of father -128.6** (54.54) Age of father squared 1.748** (0.660) Year father migrated to current location -3.136 (8.618) Constant 2,503 (2,470) Observations 214 R-squared 0.934
Standard errors in parentheses *** p<0.01, ** p<0.05, * p<0.1
Additional controls: dummies for location (barrio), father’s ethnicity, mother’s ethnicity, location of father’s birth, and family occupation;
counts by gender of household members within 4 age brackets (0-5, 6-10, 11-17, 18 & above)
Table A3: OLS Regression of Savings on Transitory Income (1) (2) Savings Savings Transitory Income 0.869*** 0.851*** (0.161) (0.157) Transitory Income Squared 0.00112*** (0.000325) Constant -155.9*** -217.0*** (37.67) (40.82) Observations 214 214 R-squared 0.121 0.167
Standard errors in parentheses *** p<0.01, ** p<0.05, * p<0.1
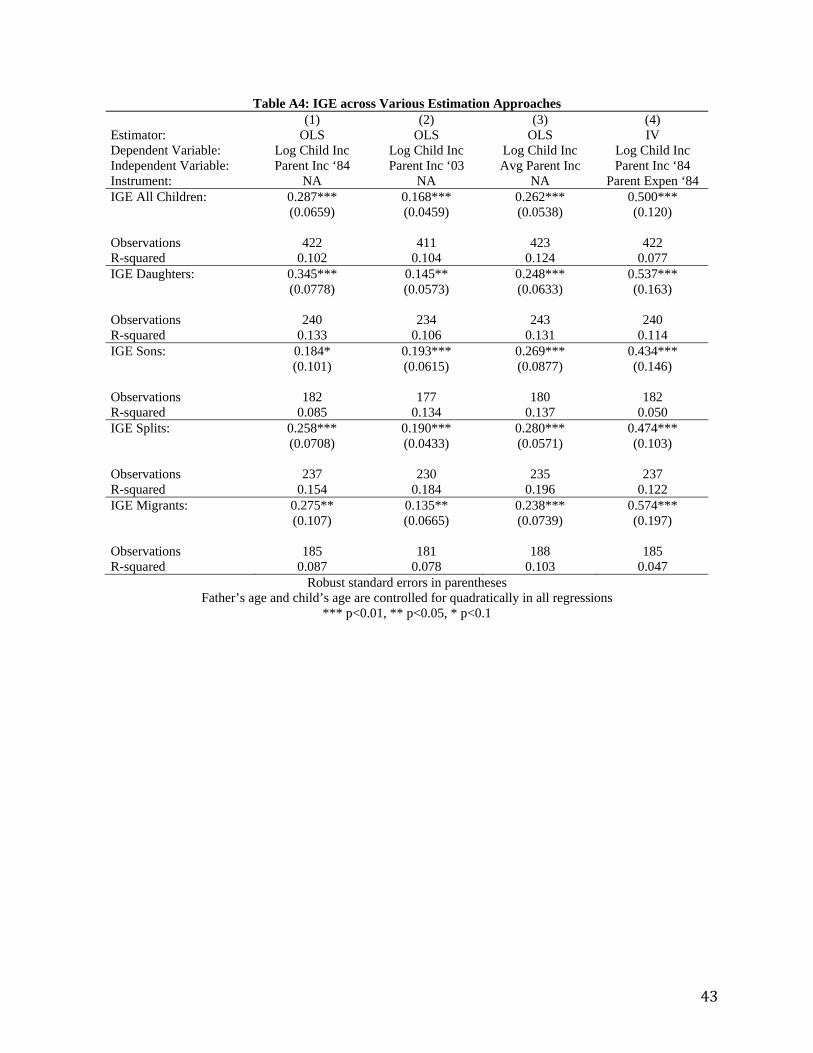
43
Table A4: IGE across Various Estimation Approaches Estimator:
(1) OLS
(2) OLS
(3) OLS
(4) IV
Dependent Variable: Log Child Inc Log Child Inc Log Child Inc Log Child Inc Independent Variable: Parent Inc ‘84 Parent Inc ‘03 Avg Parent Inc Parent Inc ‘84 Instrument: NA NA NA Parent Expen ‘84 IGE All Children: 0.287*** 0.168*** 0.262*** 0.500*** (0.0659) (0.0459) (0.0538) (0.120) Observations 422 411 423 422 R-squared 0.102 0.104 0.124 0.077 IGE Daughters: 0.345*** 0.145** 0.248*** 0.537*** (0.0778) (0.0573) (0.0633) (0.163) Observations 240 234 243 240 R-squared 0.133 0.106 0.131 0.114 IGE Sons: 0.184* 0.193*** 0.269*** 0.434*** (0.101) (0.0615) (0.0877) (0.146) Observations 182 177 180 182 R-squared 0.085 0.134 0.137 0.050 IGE Splits: 0.258*** 0.190*** 0.280*** 0.474*** (0.0708) (0.0433) (0.0571) (0.103) Observations 237 230 235 237 R-squared 0.154 0.184 0.196 0.122 IGE Migrants: 0.275** 0.135** 0.238*** 0.574*** (0.107) (0.0665) (0.0739) (0.197) Observations 185 181 188 185 R-squared 0.087 0.078 0.103 0.047
Robust standard errors in parentheses Father’s age and child’s age are controlled for quadratically in all regressions
*** p<0.01, ** p<0.05, * p<0.1
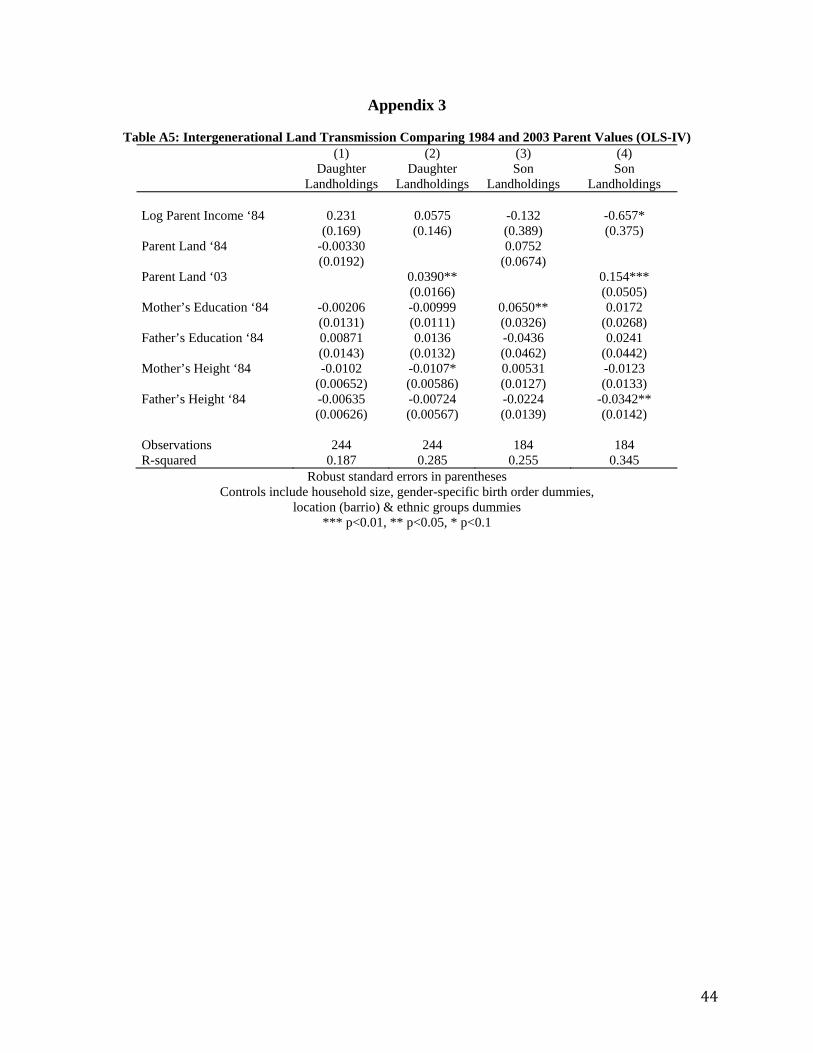
44
Appendix 3
Table A5: Intergenerational Land Transmission Comparing 1984 and 2003 Parent Values (OLS-IV) (1) (2) (3) (4) Daughter
Landholdings Daughter
LandholdingsSon
Landholdings Son
Landholdings Log Parent Income ‘84 0.231 0.0575 -0.132 -0.657* (0.169) (0.146) (0.389) (0.375) Parent Land ‘84 -0.00330 0.0752 (0.0192) (0.0674) Parent Land ‘03 0.0390** 0.154*** (0.0166) (0.0505) Mother’s Education ‘84 -0.00206 -0.00999 0.0650** 0.0172 (0.0131) (0.0111) (0.0326) (0.0268) Father’s Education ‘84 0.00871 0.0136 -0.0436 0.0241 (0.0143) (0.0132) (0.0462) (0.0442) Mother’s Height ‘84 -0.0102 -0.0107* 0.00531 -0.0123 (0.00652) (0.00586) (0.0127) (0.0133) Father’s Height ‘84 -0.00635 -0.00724 -0.0224 -0.0342** (0.00626) (0.00567) (0.0139) (0.0142) Observations 244 244 184 184 R-squared 0.187 0.285 0.255 0.345
Robust standard errors in parentheses Controls include household size, gender-specific birth order dummies,
location (barrio) & ethnic groups dummies *** p<0.01, ** p<0.05, * p<0.1
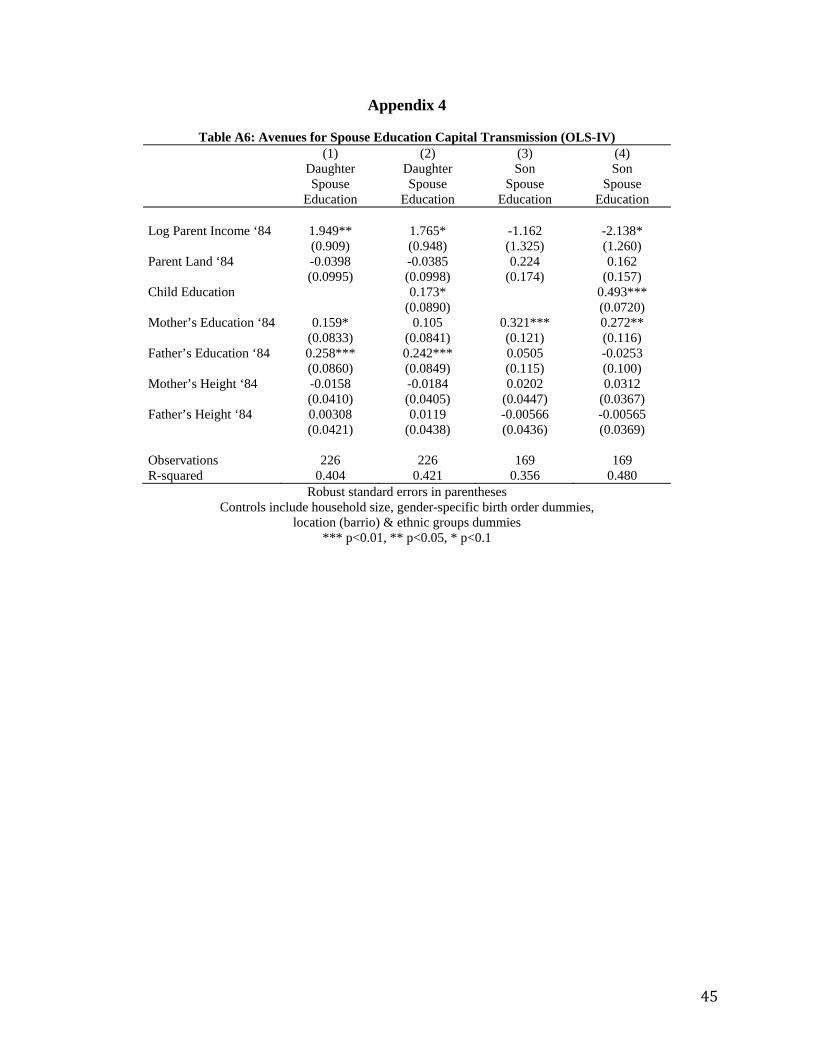
45
Appendix 4
Table A6: Avenues for Spouse Education Capital Transmission (OLS-IV) (1) (2) (3) (4) Daughter
Spouse Education
Daughter Spouse
Education
Son Spouse
Education
Son Spouse
Education Log Parent Income ‘84 1.949** 1.765* -1.162 -2.138* (0.909) (0.948) (1.325) (1.260) Parent Land ‘84 -0.0398 -0.0385 0.224 0.162 (0.0995) (0.0998) (0.174) (0.157) Child Education 0.173* 0.493*** (0.0890) (0.0720) Mother’s Education ‘84 0.159* 0.105 0.321*** 0.272** (0.0833) (0.0841) (0.121) (0.116) Father’s Education ‘84 0.258*** 0.242*** 0.0505 -0.0253 (0.0860) (0.0849) (0.115) (0.100) Mother’s Height ‘84 -0.0158 -0.0184 0.0202 0.0312 (0.0410) (0.0405) (0.0447) (0.0367) Father’s Height ‘84 0.00308 0.0119 -0.00566 -0.00565 (0.0421) (0.0438) (0.0436) (0.0369) Observations 226 226 169 169 R-squared 0.404 0.421 0.356 0.480
Robust standard errors in parentheses Controls include household size, gender-specific birth order dummies,
location (barrio) & ethnic groups dummies *** p<0.01, ** p<0.05, * p<0.1
Top Related