


Languages
Pages
Legal


Decisionmaking Quality:Experimental Measures and their Correlates
Dan SilvermanASU
HCEO Conference, University of Chicago
October 2015
Silverman (HCEO Conference, University of Chicago) DMQ October 2015 1 / 24

Background
Standard econ analysis attributes differences in choices to heterogeneity in:
ConstraintsPreferencesInformationBeliefs
Silverman (HCEO Conference, University of Chicago) DMQ October 2015 2 / 24
Background: Decision-making Ability
More recent (empirical) studies consider another source
Decision-making abilityExamples:
Ameriks, Caplin, and Leahy (2003)Bernheim and Garrett (2003)Fang, Keane, and Silverman (2008)Agarwal, Driscoll, Gabaix, and Laibson (2009)EJ special issue (2010)Abaluck and Gruber (2011)Choi, Kariv, Müller, and Silverman (2014)Ambuehl, Bernheim, and Lusardi (2014)
Silverman (HCEO Conference, University of Chicago) DMQ October 2015 3 / 24

DMA & DMQ
Certain skills and knowledge seem to facilitate “better”decisions.
Thus, actual choices may not match true objectives.
Those with less decision-making abilty (DMA) may make choices of lowerdecision-making quality (DMQ).
Silverman (HCEO Conference, University of Chicago) DMQ October 2015 4 / 24

Conceptual and Practical Problems
Makes sense that some decisions are better than others (DMQ)
Makes sense that some people are better decision-makers than others (DMA)
But what is “better?”
How can we tell if someone tends to lower-quality decisions?
Silverman (HCEO Conference, University of Chicago) DMQ October 2015 5 / 24

Measurement and Identification Problems
An identification problem
Distinguish differences in DMA from unobserved differences in preferences,constraints, information, or beliefs
A measurement problem
Define and implement a measure of DMQ that applies across domains andhas an economic interpretation
Silverman (HCEO Conference, University of Chicago) DMQ October 2015 6 / 24

Our Approach
Measure DMQ by the consistency of choices with rationality (GARP)
If no utility function can rationalize a set of choices, then they are notpurposeful, or high DMQ
Present individuals with a choice experiment in which we can measure DMQwith precision.
Measure has economic interpretation and is portable across domains(measurement problem)
Experiment holds information and beliefs constant within subject, andcontrols the relevant constraints.
Define DMA as capacity to make high DMQ choicesExperiment then addresses identification problem, in the lab
Silverman (HCEO Conference, University of Chicago) DMQ October 2015 7 / 24

Our Approach (contd.)
Interest in DMQ in the lab due mostly to the possibility that it reflects DMAimportant outside the lab.
Implement experiment with a large and diverse samples of subjects
Panel data from two surveys in the Netherlands and two surveys in the USStudy relationship between DMQ in experiments and observablecharacteristics.Evaluate in risk, time, and social preference domainsDo some characterstics predict choices because of they proxy DMA?
Can DMQ in the experiment independently explain important economicoutcomes?
Silverman (HCEO Conference, University of Chicago) DMQ October 2015 8 / 24

Basic Structure of the Experiments
Each subject faces 25-50 independent decision problems.
Each problem is to choose a bundle of two contingent commodities X and Yfrom a budget line.
In a risk experiment, allocation (x , y) pays either x or y , with equalprobability.
Budget lines vary randomly– crossing often.
Payoffs calculated in terms of tokens (stakes usually low)
One decision problem randomly selected, at the end, for payment.
Experiment conducted via the web. Subjects point and click and are paidelectronically.
Silverman (HCEO Conference, University of Chicago) DMQ October 2015 9 / 24
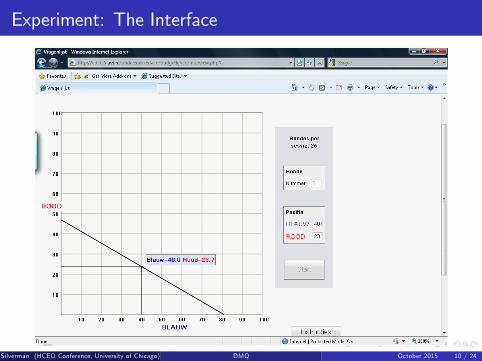
Experiment: The Interface
Silverman (HCEO Conference, University of Chicago) DMQ October 2015 10 / 24
Example: The CentERpanel
Internet panel of 2,000 households (5,000 individuals)
Representative of the Dutch-speaking population in the Netherlands.
Panel data on demographic and economic variables.
Comprehensive household survey dates to 1993.
Experiment conducted in 2009 with randomly selected subset
Approximately 700 households and 1,200 individuals completed the experiment
Silverman (HCEO Conference, University of Chicago) DMQ October 2015 11 / 24
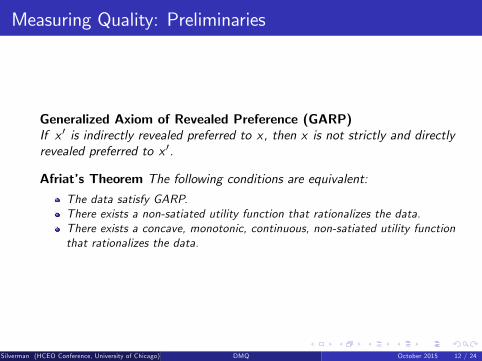
Measuring Quality: Preliminaries
Generalized Axiom of Revealed Preference (GARP)If x ′ is indirectly revealed preferred to x, then x is not strictly and directlyrevealed preferred to x ′.
Afriat’s Theorem The following conditions are equivalent:
The data satisfy GARP.There exists a non-satiated utility function that rationalizes the data.There exists a concave, monotonic, continuous, non-satiated utility functionthat rationalizes the data.
Silverman (HCEO Conference, University of Chicago) DMQ October 2015 12 / 24
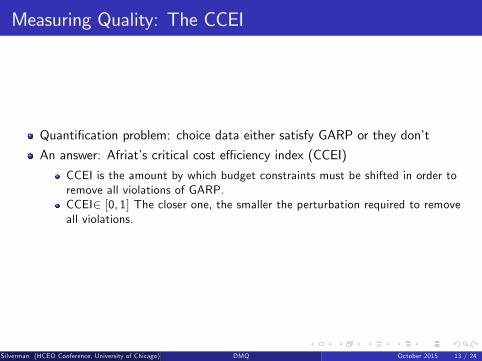
Measuring Quality: The CCEI
Quantification problem: choice data either satisfy GARP or they don’t
An answer: Afriat’s critical cost effi ciency index (CCEI)
CCEI is the amount by which budget constraints must be shifted in order toremove all violations of GARP.CCEI∈ [0, 1] The closer one, the smaller the perturbation required to removeall violations.
Silverman (HCEO Conference, University of Chicago) DMQ October 2015 13 / 24
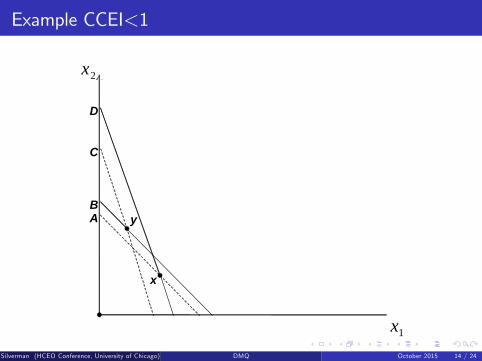
Example CCEI<1
2x
1x
D
C
BA
x
y
Silverman (HCEO Conference, University of Chicago) DMQ October 2015 14 / 24

Distribution of CCEI
PercentilesMean S.D. 10 25 50 75 90 N
All 0.881 0.141 0.676 0.808 0.930 0.998 1.00 1,182Female 0.874 0.147 0.666 0.796 0.928 0.998 1.00 537Ages 50− 64 0.863 0.142 0.666 0.784 0.901 0.985 1.00 421
Large fractions have virtually no violations.
Substantial heterogeneity
Silverman (HCEO Conference, University of Chicago) DMQ October 2015 15 / 24

Who is (More) Rational?
Silverman (HCEO Conference, University of Chicago) DMQ October 2015 16 / 24

Who is (More) Rational?
(1) (2).887*** .735***(.022) (.037)
.024*** .011(.009) (.015)
Age.016 .007(.011) (.020)
.052*** .077***(.011) (.020)
.051** .081**(.020) (.032)
Education.009 .021
(.011) (.017).026** .060***(.011) (.018)
Income.026** .026(.012) (.019).020 .006
(.013) (.020).033** .017(.014) (.022)
Occupation.028 .030
(.018) (.026).047** .039(.021) (.030).037* .035(.019) (.030)
Household composition.026** .023(.011) (.018).001 .001
(.004) (.007).068 .058
# of obs. 1182 1182
Medium
House work
Others
Constant
Female
3549
5064
# of children
65+
€25003499
€35004999
€5000+
Partner
High
Paid work
2R 2RSilverman (HCEO Conference, University of Chicago) DMQ October 2015 17 / 24
Rationality and Wealth
Blending of experiment and survey research allows us to study whether DMQunder experimental conditions captures DMA that applies across many (evenreal-world) domains.
We study the correspondence between CCEI in the experiment and wealth inthe real world.
Conditional on income, wealth summarizes innumerable financial decisionsinvolving a host of different tradeoffs (risk, time, self vs. others).
Predicting wealth/portfolio thus offers a relatively “strong test” for themeasure.
If consistency with utility maximization in the experiment were a good proxyfor financial decision-making ability it should help explain patterns of wealth.
Silverman (HCEO Conference, University of Chicago) DMQ October 2015 18 / 24
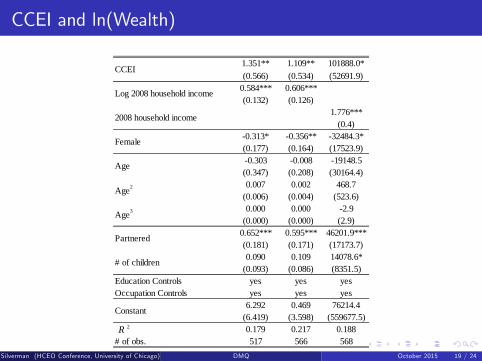
CCEI and ln(Wealth)
1.351** 1.109** 101888.0*(0.566) (0.534) (52691.9)
0.584*** 0.606***(0.132) (0.126)
1.776***(0.4)
0.313* 0.356** 32484.3*(0.177) (0.164) (17523.9)0.303 0.008 19148.5(0.347) (0.208) (30164.4)0.007 0.002 468.7
(0.006) (0.004) (523.6)0.000 0.000 2.9
(0.000) (0.000) (2.9)0.652*** 0.595*** 46201.9***(0.181) (0.171) (17173.7)0.090 0.109 14078.6*
(0.093) (0.086) (8351.5)Education Controls yes yes yesOccupation Controls yes yes yes
6.292 0.469 76214.4(6.419) (3.598) (559677.5)0.179 0.217 0.188
# of obs. 517 566 568
Constant
# of children
Age2
Age3
Partnered
2008 household income
Female
Age
Log 2008 household income
CCEI
2R
Silverman (HCEO Conference, University of Chicago) DMQ October 2015 19 / 24

Is the Correlation Due to Unobserved Constraints?
1.322** 1.318** 1.925*** 1.888*** 1.441**(0.570) (0.574) (0.672) (0.652) (0.578)
Log household income19.770 1.000 0.544*** 0.285* 0.616***
(14.629) . (0.137) (0.165) (0.128)2.194(1.533)0.082(0.053)
0.232(0.231)0.215(0.174)
Demography Controls yes yes yes yes yesEducation Controls yes yes yes yes noOccupation Controls yes yes yes yes yes
47.059 0.864 5.354 3.016 6.398(46.275) (6.545) (6.93) (7.109) (6.484)
0.187 0.205 0.217 0.177# of obs. 517 517 449 449 517
Constant
CCEI
2006
2008
2004
20082
20083
2R
Silverman (HCEO Conference, University of Chicago) DMQ October 2015 20 / 24

Unobserved Preferences or Beliefs?
1.379** 1.396** 1.404** 1.214* 1.237**(0.568) (0.568) (0.569) (0.625) (0.623)
Risk tolerance0.768 0.808 0.766(0.714) (0.711) (0.718)
0.017 0.023(0.074) (0.076)0.190 0.162(0.335) (0.482)
Stanardized Conscientiousness 0.089(0.072)
Conscientiousness missing 0.040(0.668)
0.034(0.040)
0.589*** 0.578*** 0.572*** 0.443*** 0.434***(0.132) (0.131) (0.133) (0.123) (0.123)
Demog, Educ, Occup Controls yes yes yes yes yes6.840 6.883 6.496 3.777 4.411
(6.361) (6.357) (6.395) (15.258) (15.256)0.179 0.176 0.176 0.163 0.163
# of obs. 517 517 517 414 414
Constant
Quantitative (experiment)
CCEI
Log 2008 household income
Qualitative (survey)
Qualitative (survey) missing
Longevity expectations
2R
Silverman (HCEO Conference, University of Chicago) DMQ October 2015 21 / 24

Alternative Proxies for Decision-making Ability
1.253* 1.412* 1.328* 1.177**(0.712) (0.724) (0.725) (0.583)0.0990.38
0.682(0.489)
0.120*(0.071)0.203(0.237)
0.586*** 0.402** 0.399** 0.577***(0.132) (0.156) (0.155) (0.132)
Demog, Educ, Occup. Controls yes yes yes yes6.237 8.862 7.583 6.855
(6.424) (7.037) (6.992) (6.464)0.177 0.216 0.219 0.181
# of obs. 517 328 328 517
Constant
CRT missing
von Gaudecker et al. (2011)
Log 2008 household income
CCEI
CCEI (combined dataset)
Cognitive Reflection Test (CRT)
2R
Silverman (HCEO Conference, University of Chicago) DMQ October 2015 22 / 24
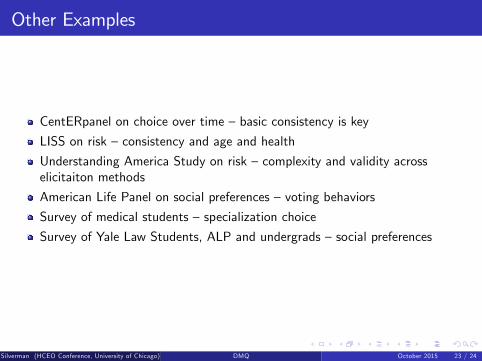
Other Examples
CentERpanel on choice over time —basic consistency is key
LISS on risk —consistency and age and health
Understanding America Study on risk —complexity and validity acrosselicitaiton methods
American Life Panel on social preferences —voting behaviors
Survey of medical students — specialization choice
Survey of Yale Law Students, ALP and undergrads — social preferences
Silverman (HCEO Conference, University of Chicago) DMQ October 2015 23 / 24

Summary
Research blends experimental methods and survey research.
Graphical interface permits rich experimental data collection from relativelylarge and heterogenous population.
Proposing that quality⇒rationality, and measuring it in this way, addresseschallenges of decision-making ability literature.
Observed heterogeneity in rationality and its relationship with observablessupports the view that quality ⇒ rationality.
Motivates further work
Silverman (HCEO Conference, University of Chicago) DMQ October 2015 24 / 24
Top Related