


Languages
Pages
Legal


Decent Work in MoldovaStatistical Indicators
ELENA VUTCARIOV Head of Division for Labour Force Statistics and
Sample Surveys
ELENA BASARAB Deputy head of Division for Labour Force Statistics
and Sample Surveys

I Employment opportunities
1 Labour force participation rate
2 Employment-population ratio
3 Unemployment rate
4 Youth unemployment rate
5 Share of wage employment in non-agricultural employment
II Unacceptable work
6 Children in wage employment or self-employment activity rate
7 Children not in school by employment status
III Adequate earnings and productive work
8 Inadequate pay rate
9 Average earnings in selected occupations
10 Employees with recent job training
IV Decent hours
11 Excessive hours of work
12 Time-related underemployment rate
V Stability and security of work
13 Tenure less then one year
14 Temporary work
VI Balancing work and family life
15 Employment rate for women with children under compulsory age
Statistical indicators of decent work

VII Fair treatment in employment
16 Occupational segregation by sex
17 Female share of employment in managerial and administrative occupations
VIII Safe work
18 Fatal injury rate
19 Labour inspectors
20 Occupational injury insurance coverage
IX Social protection
21 Public social security expenditure
22 Public expenditure on needs-based cash income support
23 Beneficiaries of cash income support
24 Share of population over 65 year benefiting from a pension
25 Share of economically active population contributing to a pension fund
26 Average monthly pension
X Social dialogue and workplace relations
27 Union density rate
28 Collective wage bargaining coverage rate
29 Strikes and lockouts
XI Economic and social context of decent work
30 Informal economy employment
Output per employed person
Growth of output per employed person
Inflation
Education of adult population
Composition of employment by economic sector
Income inequality
Poverty

Evolution of activity rate for population aged 15 years and over
61,359,9
57,9 57,2
51,649,7
66,463,9
61,660
54,556,9 56,3
54,6 54,7
49,1
51,7
47,9
40
45
50
55
60
65
70
1999 2000 2001 2002 2003 2004
%
Total
Male
Female

Evolution of employment rate by sex
54,5 54,853,7 53,3
47,545,7
57,6 57,756,2
55,1
49,3
46,6
51,8 52,2 51,4 51,7
4644,9
4042444648505254565860
1999 2000 2001 2002 2003 2004
%
total male female

Employment rate by age groups - 2004
32,8 30,6 27,9 26,820,2 18,1
73,8 73,7 72,6 71,466,6 63,5
40,0 43,3 44,1 46,240,7 40,7
0
10
20
30
40
50
60
70
80
1999 2000 2001 2002 2003 2004
%
15-24 years 25-49 years 50 years and over
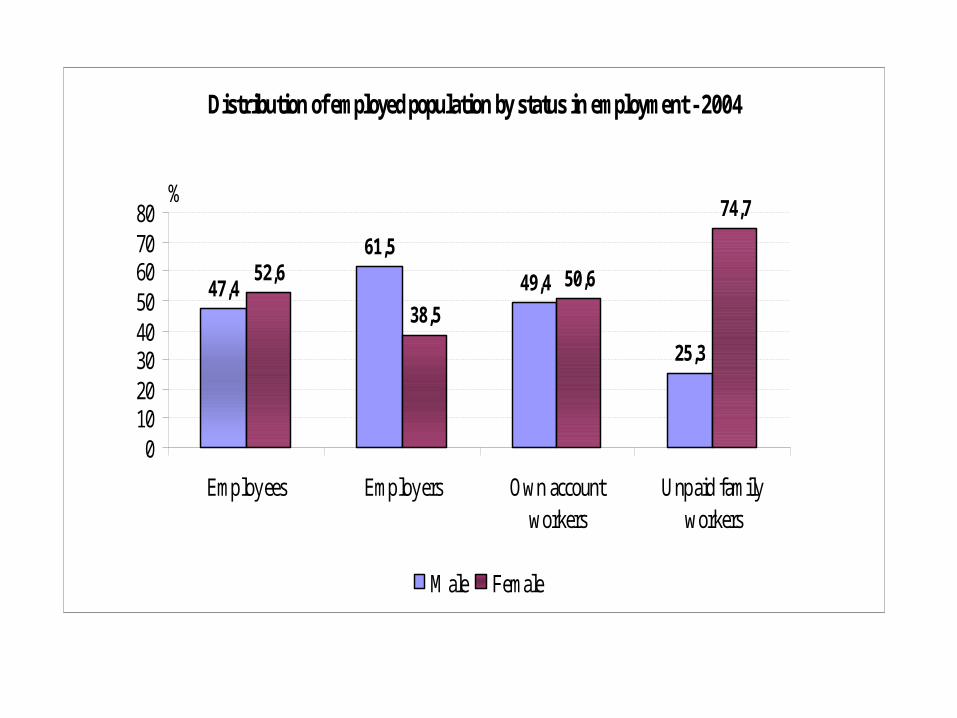
Distribution of employed population by status in employment - 2004
47,4
61,5
49,4
25,3
52,6
38,5
50,6
74,7
01020304050607080
Employees Employers Own accountworkers
Unpaid familyworkers
%
Male Female
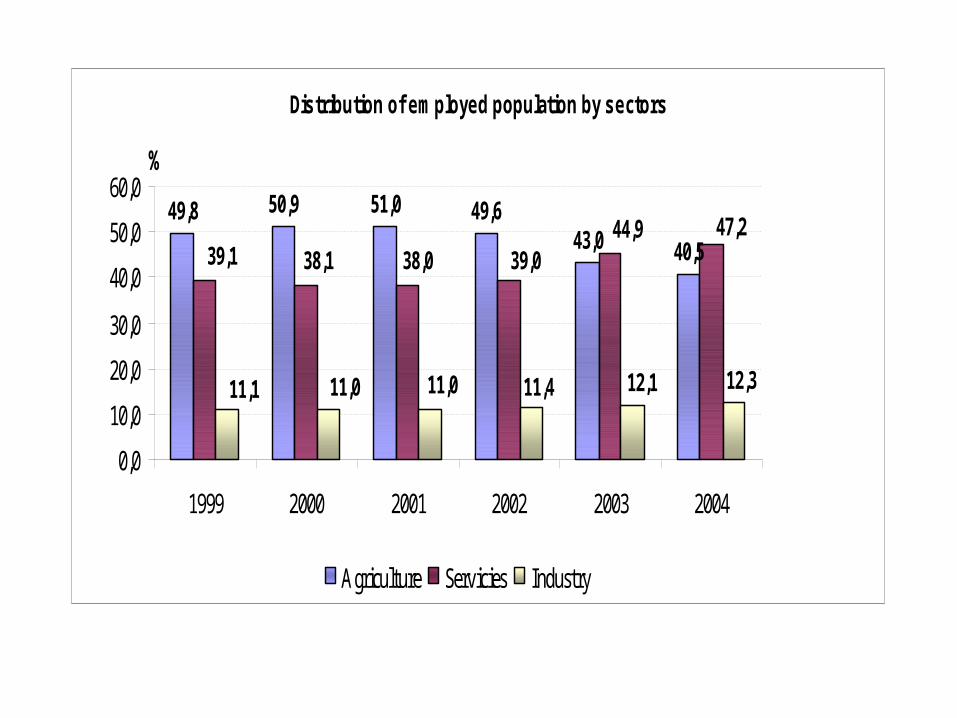
Distribution of employed population by sectors
49,8 50,9 51,0 49,643,0 40,539,1 38,1 38,0 39,0
44,9 47,2
11,1 11,0 11,0 11,4 12,1 12,3
0,0
10,0
20,0
30,0
40,0
50,0
60,0
1999 2000 2001 2002 2003 2004
%
Agriculture Servicies Industry

Distribution of employed population by sectors and age groups - 2004
30,736,5
53,552,4 51,1
36,2
16,912,4 10,3
0102030405060
15-24 years 25-49 years 50 years and over
%
Agriculture Servicies Industry

Evolution of employees in non-agricultural activities by sex
52,9 52,8 52,7 53,7 54,6 54,6
47,1 47,2 47,3 46,3 45,4 45,4
0
10
20
30
40
50
60
1999 2000 2001 2002 2003 2004
%
female male

Distribution of employees in non-agricultural activities by sex - 2004
54,1
85,4
39,9
21,2
73,6
33,3
55,9
21,1 20,7
54,845,9
14,6
60,1
78,8
26,4
66,7
44,1
78,9 79,3
45,2
0102030405060708090
С+E F G H I J K M M L+O+P+Q
%
Male Female
C-E Industry J Financial, banking and insurance activities
F Constructions K Real estate and other services mainly for enterprises
G Trade M Education H Hotels and restaurants N Health and social assistance I Transport and storage L+O+PQ Other activities

Evolution of unemployment rate
11,1
8,57,3 6,8
7,9 8,1
13,3
9,78,7 8,1
9,6 10,08,9
7,25,9 5,5
6,4 6,3
2
4
6
8
10
12
14
1999 2000 2001 2002 2003 2004
%
total male female

Unemployment rate by age groups
22,3
15,8 16,315,2
18,119,7
10,58,5
6,9 6,77,8 7,8
4,2 3,7 3,2 2,7 3,7 4,0
0
5
10
15
20
25
1999 2000 2001 2002 2003 2004
%
15-24 years 25-49 years 50 years and over

Evolution of number of unemployed by duration of unemployment
187
140
118 110 117 116100
8568 65 57 52
133
10587
78 72 71
0
20
40
60
80
100
120
140
160
180
200
1999 2000 2001 2002 2003 2004
thousand persons
unemployment long-term unemployment unemployment for 6 months and over

Evolution of long-term unemployment rate by sex
7,2
6,2
5,0 4,8 4,7 4,54,64,0
3,4 3,33,0 2,8
0
1
2
3
4
5
6
7
8
1999 2000 2001 2002 2003 2004
%
male female
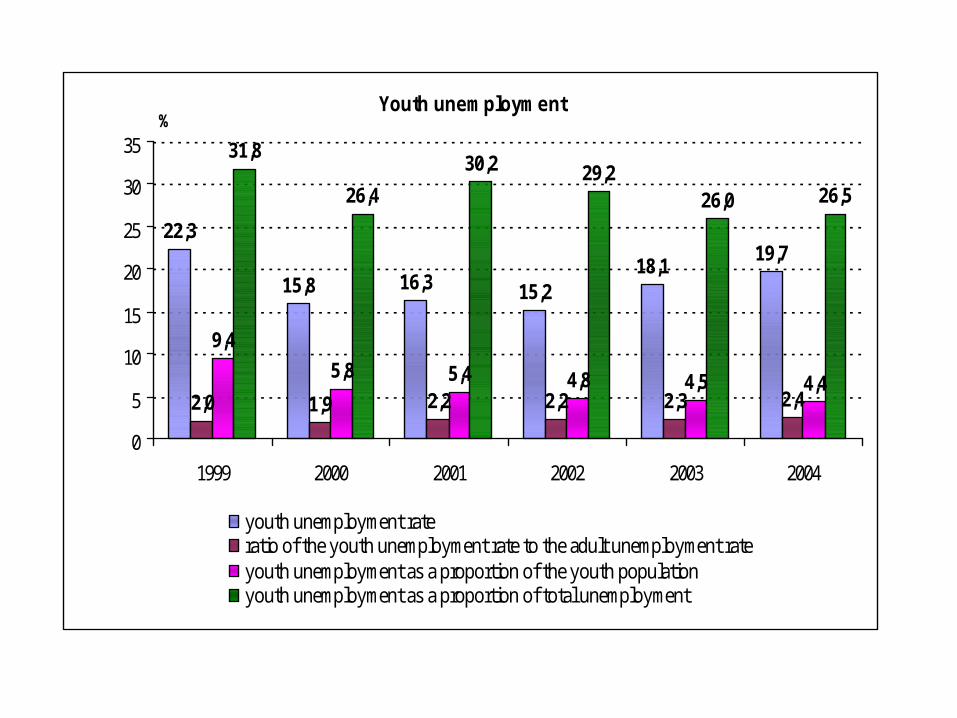
Youth unemployment
22,3
15,8 16,3 15,218,1
19,7
2,0 1,9 2,2 2,2 2,3 2,4
9,4
5,8 5,4 4,8 4,5 4,4
31,8
26,4
30,2 29,226,0 26,5
0
5
10
15
20
25
30
35
1999 2000 2001 2002 2003 2004
%
youth unemployment rateratio of the youth unemployment rate to the adult unemployment rateyouth unemployment as a proportion of the youth populationyouth unemployment as a proportion of total unemployment

Evolution of youth unemployment rate (15-24 years) in urban and rural areas
36,9
28,9 29,226,1 24,3 22,9
12,99,0 9,6 9,4
13,517,1
0
5
10
15
20
25
30
35
40
1999 2000 2001 2002 2003 2004
%
urban rural
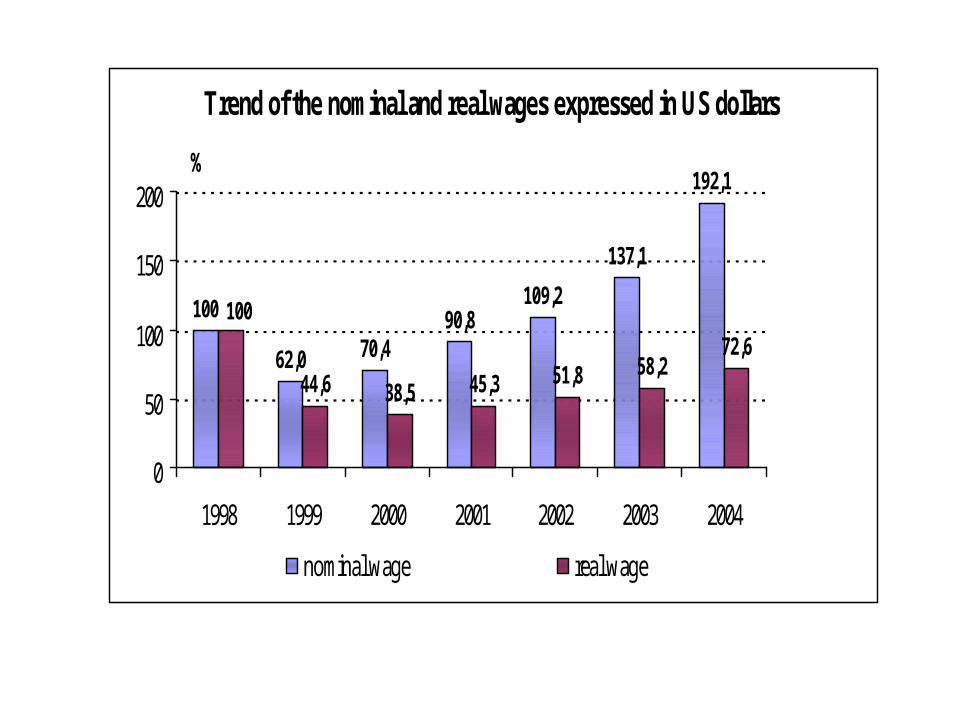
Trend of the nominal and real wages expressed in US dollars
62,0 70,490,8
109,2
137,1
192,1
44,6 38,5 45,3 51,8 58,272,6
100 100
0
50
100
150
200
1998 1999 2000 2001 2002 2003 2004
%
nominal wage real wage

Distribution of general volume of population income by decile groups
0.9 1.1 1.9 1.8
31.230,032.532.9
0
10
20
30
40
2001 2002 2003 2004
%
0
10
20
30
40
times
Idecile X decile ratio I to X

The structure of informal employment
36,1%
36,9%
27,0%
Formal sector Informal sector Households

Employed population by type of production units and nature of the job
65,484,0
34,616,0
100,0 100,0
0
20
40
60
80
100
Total economy Formal sectorenterprises
Informal sectorenterprises
Households
%
Formal employment Informal employment

Employees in informal employment by conditions of employment
83,6
65,5
76,7
14,7 17,1
31,7
16,4
34,5
23,3
85,3 82,9
68,3
0102030405060708090
Job permanency: Employmentcontract:
Employers’social
contributions:
Paid annualleave:
Paid sick leave: Maternity leave:
%
yes no
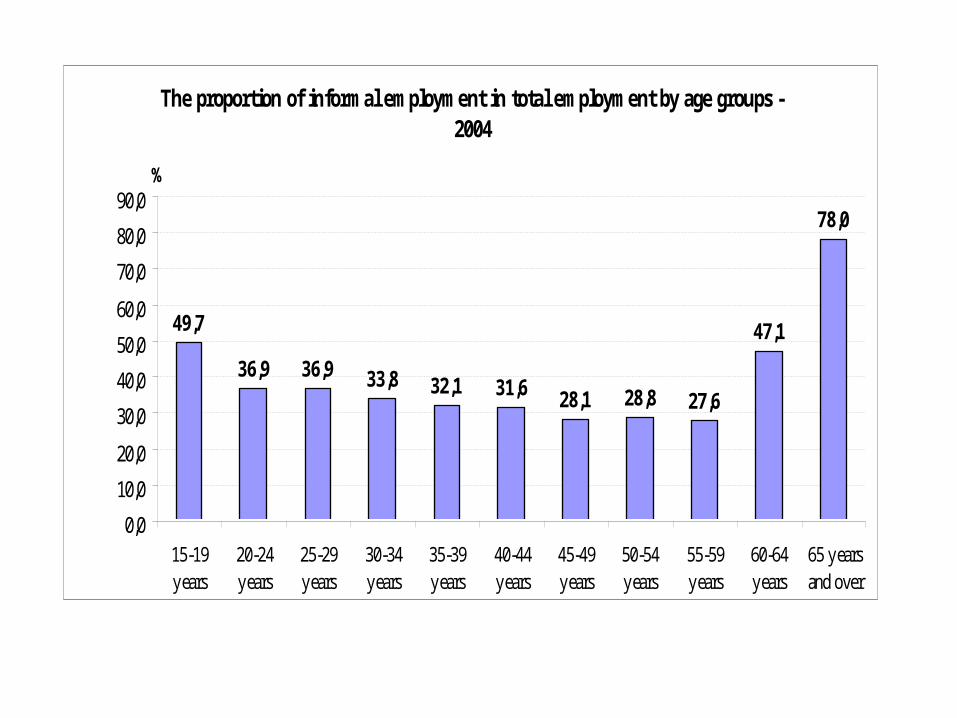
The proportion of informal employment in total employment by age groups - 2004
49,7
36,9 36,9 33,8 32,1 31,6 28,1 28,8 27,6
47,1
78,0
0,0
10,0
20,0
30,0
40,0
50,0
60,0
70,0
80,0
90,0
15-19years
20-24years
25-29years
30-34years
35-39years
40-44years
45-49years
50-54years
55-59years
60-64years
65 yearsand over

The share of informal employment by activities - 2004
53,8
14,3
46,642,4
20,4
7,713,8
0,1 1,1 1,1
31,6
57,8
0
10
20
30
40
50
60
70
A+B C-E F G H I J K L M N O-Q
%
A Agriculture J Financial, banking and insurance activities
B Forestry, fishery and hunting K Real estate and other services mainly for enterprises
C-E Industry L Public administration F Constructions M Education G Trade N Health and social assistance H Hotels and restaurants O-Q Other activities I Transport and storage

Persons who worked 40 hours and over
23,6 22,5 22,819,3 20 20,9
24,3 23,7 23,621,6 21,6 22,5
0
20
40
1999 2000 2001 2002 2003 2004
%
total employment employees
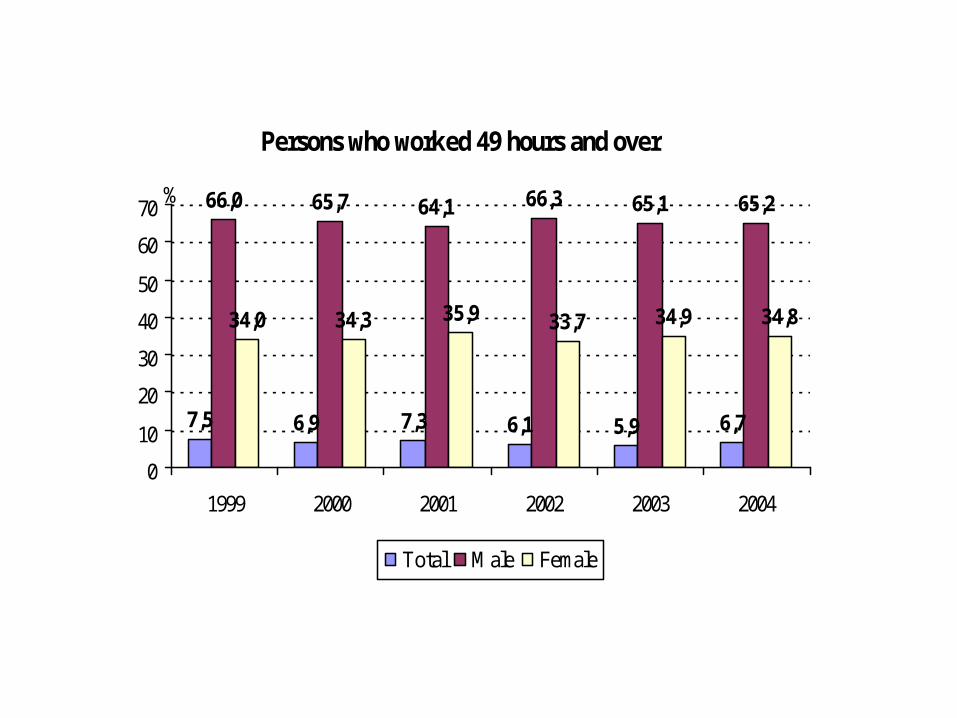
Persons who worked 49 hours and over
7,5 6,9 7,3 6,1 5,9 6,7
66,0 65,7 64,1 66,3 65,1 65,2
34,0 34,3 35,9 33,7 34,9 34,8
0
10
20
30
40
50
60
70
1999 2000 2001 2002 2003 2004
%
Total Male Female
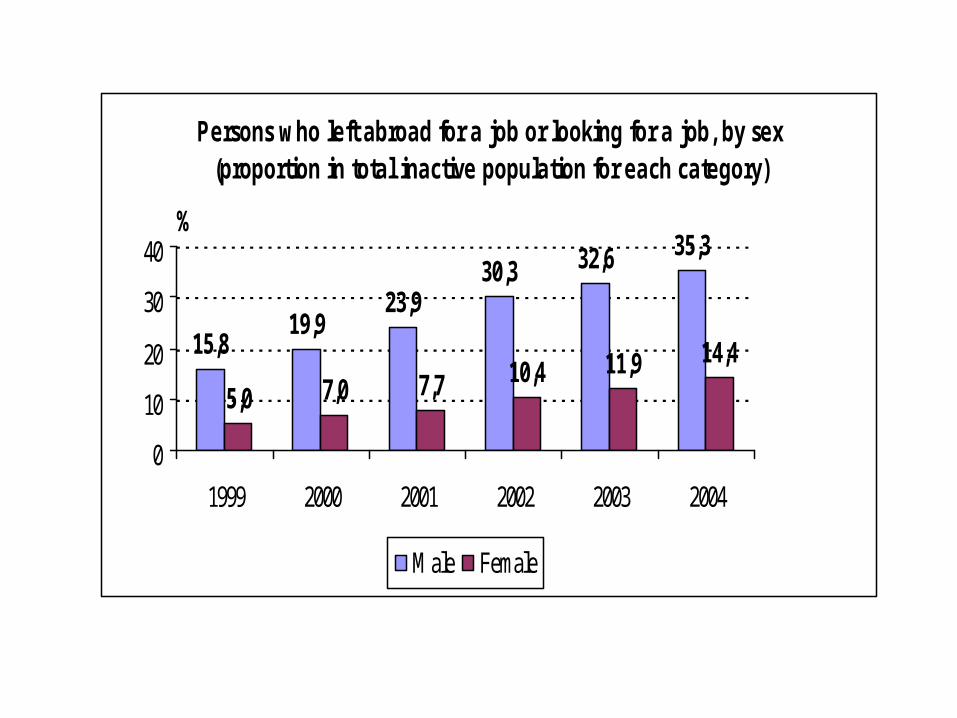
Persons who left abroad for a job or looking for a job, by sex (proportion in total inactive population for each category)
15,819,9
23,930,3 32,6 35,3
5,0 7,0 7,7 10,4 11,9 14,4
0
10
20
30
40
1999 2000 2001 2002 2003 2004
%
Male Female

Persons who left abroad for a job or looking for a job, by age categories (proprtion in total inactive population for each category)
10,6 13,0 13,517,6 18,3 20,7
25,1
31,937,2
46,449,7
52,7
0,6 0,9 1,2 1,8 2,7 3,7
0
10
20
30
40
50
60
1999 2000 2001 2002 2003 2004
%
15-24 years 25-49 years 50 years and over
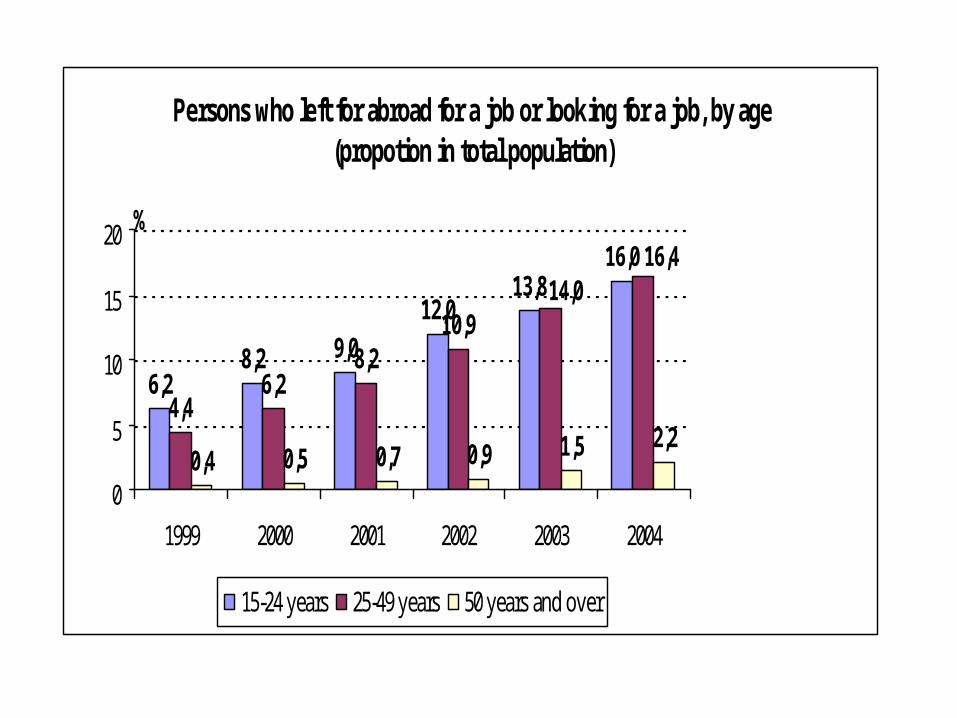
Persons who left for abroad for a job or looking for a job, by age (propotion in total population)
6,28,2 9,0
12,013,8
16,0
4,46,2
8,210,9
0,4 0,5 0,7 0,9 1,5 2,2
16,414,0
0
5
10
15
20
1999 2000 2001 2002 2003 2004
%
15-24 years 25-49 years 50 years and over
Top Related