


Languages
Pages
Legal


8/14/2019 Dave Rosenberg Gluskin Sheff 01/07/2010
http://slidepdf.com/reader/full/dave-rosenberg-gluskin-sheff-01072010 1/12
David A. Rosenberg January 7, 2010 Chief Economist & Strategist Economic [email protected]+ 1 416 681 8919
MARKET MUSINGS & DATA DECIPHERING
Breakfast with DaveWHILE YOU WERE SLEEPING
IN THIS ISSUE
• While you were sleeping —overseas equity marketsare down today; bonds areever so slightly bid; globaleconomic datalanguishing
• Policy paralysis — the transition mechanism
from monetary policy to the financial system and the broad economyremains broken
• Income theme still intact— retail investors in theU.S. continue to pourmoney into bond funds
• Pithy thoughts — despite the bearish sentiment towards U.S. Treasuries,attempts at the 4% markhas been futile
• What to look for in theU.S. payroll data
• Minutes from theDecember FOMC meeting is a really big deal
• The non-manufacturing ISM index fails to reviveall that much
• More on the secularfrugality theme
• Another roadblock for thehousing industry
For the first time this year, we see red on our Bloomberg equity market screens:
Europe down 0.7% and practically every region of Asia (Kospi -1.3%, China
-1.9%, Hang Seng -0.7%, Nikkei -0.5%) and U.S. futures down a tad. Bonds are
ever so slightly bid. The S&P 500 is at a critical technical juncture, sitting at the
50% retracement line and a whole lot of positive news already priced in.
The commodity complex is also off today with copper coming down from its 16-
month highs on Chinese moves to curb lending growth; crude oil so far snapping
a 10-day winning streak that was underpinned by the cold snap; gold is downaround 4% today on the back of a firmer tone to the U.S. dollar, which has
occurred on the back of the first comments from the new Japanese Finance
Minister Naotio Kan to the effect that he welcomes a weaker yen; and he is
getting it. Note that this verbal intervention is a big shift from the strong Yen
policy that was being advocated by his predecessor, Hirohisa Fujii. Nifty article
on page 22 of the FT is worth a read – Japan and U.S. in Libor See-Saw.
Japanese 3-month Libor has recently moved down into line with the U.S. level of
just over 25bps, which may have taken away from the “dollar carry trade” that
depressed the greenback through much of 2009.
It could also very much be the case that the departures of several senior
Democrats this week (including Messrs Dodd and Dorgan) is adding some
positive sentiment to the greenback as well, insofar as this reflects somediscontent with the current policy backdrop.
Again, the data from abroad were less than stellar, and that is actually a polite
way to put it — German real manufacturing orders came in well below expected
at +0.2% for November (consensus was +1.2%) and retail sales plunged 1.1%
(and down 1.2% for the entire Eurozone).
This is what we were talking about the other day. Everyone thinks that U.S. earnings
derived from the global economy are going to skate consensus forecasts of a 36%
profits boom onside this year. But the only “boomers” are the BRIC countries and
they represent the grand total impact of 1% on the broad U.S. economy.
Please see important disclosures at the end of this document.
Gluskin Sheff + Associates Inc. is one of Canada’s pre-eminent wealth management firms. Founded in 1984 and focused primarily on high net worth private clients, we are dedicated to meeting the needs of our clients by delivering strong, risk-adjusted returns together with the highest
level of personalized client service. For more information or to subscribe to Gluskin Sheff economic reports,
visit www.gluskinsheff.com

8/14/2019 Dave Rosenberg Gluskin Sheff 01/07/2010
http://slidepdf.com/reader/full/dave-rosenberg-gluskin-sheff-01072010 2/12
January 7, 2010 – BREAKFAST WITH DAVE
Meanwhile, all of Europe is still struggling and that is a region as large as the
U.S., in terms of economic impact, and Japan is clearly still very much stuck in
the mud as far as domestic demand and the impact on U.S. exports is
concerned. The reality is that the rest of the G7, perhaps as un-dynamic as it is
relative to the likes of China and Brazil, are still four times more important for
the U.S. economy than the BRIC economies. So this notion of a global boom
when we get spending data out of Germany this weak and Japan in dire need of
a weak currency policy to put a floor under its ongoing deflation in nominal GDP
is a bit ridiculous.
Information going into
tomorrow’s nonfarm payrollreport is mixed at best
We were never very big on the Monster employment index (after all, it isn’t even
seasonally adjusted) but it did show a rare four point decline to 115 in
December. The information going into tomorrow’s nonfarm payroll report is
mixed at best:
• We had a weaker than expected ADP figure yesterday but all the pundits are
talking about is how an 84,000 decline is good news because when you factor
in the extent of the “miss” in this index versus payrolls in recent months, this
actually would point to a positive print.
• The jobs components in the Conference Board survey improved a tad but
remained at deep recession levels.
• The ISM index pointed to improved factory payrolls but that certainly did not
get picked up in the ADP data (-43k compared with -42k in November). While
the non-manufacturing ISM suggested contraction in service-sector jobs, this
was actually the one pleasant surprise in the ADP with growth in this area for
the first time in 21 months.
• The jobless claims data have improved of late but then again, they neversuggested we would see nonfarm payrolls come in at only -11k in November,
either.
So who knows? But if you ask us, the one economist in the Bloomberg survey
calling for down-100k may be the guy you want to latch on to; or we will see a
revision to the downside in that surprising number that came out a month ago.
POLICY PARALYSIS
We were asked the question yesterday as to why the equity market doesn’t see
what we see. Look, we have a market here that is at least 25% overvalued and
it can stay overvalued for extended periods of time but what makes overvalued
markets unique is that they become very susceptible to any adverse news. If the
stock market was not so overvalued in October 1987, for example, the crashwould not have been so intense. If the U.S. housing bubble had not been so
profound back in 2006, then the plunge would have been far less severe.
Page 2 of 12

8/14/2019 Dave Rosenberg Gluskin Sheff 01/07/2010
http://slidepdf.com/reader/full/dave-rosenberg-gluskin-sheff-01072010 3/12
January 7, 2010 – BREAKFAST WITH DAVE
Go back to 2007 and you will see the stock market peaked in October 9 of that
year. It kept going up to new highs long after New Century Financial closed its
doors, long after the deflation in residential real estate began, long after the
financial stocks rolled over, months after the two Bear Stearns hedge funds
went bust, and indeed, a full three months after the credit collapse really got
going with the blowup in the money market forcing the Fed to cut the discount
rate in August. So the stock market, in some sense, has swung from being a
classic leading indicator to something quite a bit different.
Back in 2007, the S&P 500
kept on going up despite allthe obstacles
The financial situation in what is the world’s largest economy — the BRIC
countries haven’t changed that fact quite yet — remains extremely tenuous. We
have rates at zero, a $2.2 trillion Fed balance sheet and a Fed Chairman who
has taken out a tool kit that has never been used before, not to mention a 10%
budget deficit-to-GDP ratio.
We only got a 2.2% rebound in GDP out of all this in Q3, so it’s good news that it
is not negative but this goes down as the weakest response to such an overt
monetary/fiscal policy thrust ever recorded. The economy actually responded
much more forcefully to the dramatic incursion of the central bank and Treasury
back in the mid-1930s; though it pays to note that the Depression really didn’t
end until the 1940s.
Look at the charts below and you will see how little effect the policy stimulus is
exerting leaving the government continuing with demand-growth policies, such
as extended and expanded housing tax credits, and the Fed, Treasury and the
FHA doing all it can to keep the credit taps open … and for marginal borrowers at
that. So the charts below show what, exactly? That the transmission
mechanism from monetary policy to the financial system and the broad
economy is still broken fully 2½ years after the first Fed rate cut. Cash on bank
balance sheets as a share of total assets is at a three-decade high.
The financial situation in theworld’s largest single economyremains extremely tenuous
CHART 1: BANKS SITTING ON A LOT OF CASH
United States: Commercial Banks: Cash Assets as a share of Total Assets
(percent)
050505
12
10
8
6
4
2
Source: Haver Analytics, Gluskin Sheff
Page 3 of 12

8/14/2019 Dave Rosenberg Gluskin Sheff 01/07/2010
http://slidepdf.com/reader/full/dave-rosenberg-gluskin-sheff-01072010 4/12
January 7, 2010 – BREAKFAST WITH DAVE
Bank lending to households and businesses has contracted more than 7% from
a year ago, an unheard-of rate of decline unless you want to go back to Japan in
the 90s or the U.S.A. in the 30s.
CHART 2: BANK LENDING CONTINUES TO CONTRACT
United States: Commercial Banks: Loans & Leases in Bank Credit
(year-over-year percent change)
05050505
20
15
10
5
0
-5
-10
Source: Haver Analytics, Gluskin Sheff
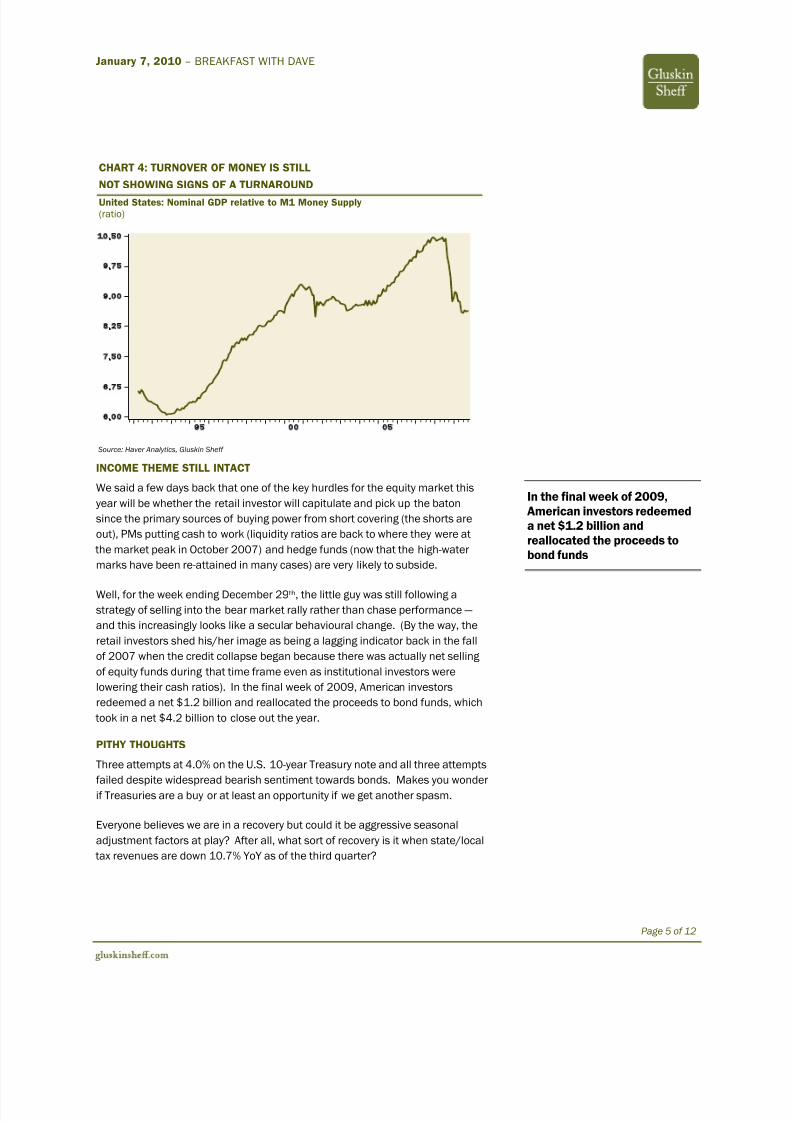
The money multiplier is breaking down and the velocity or turnover of money is still
showing no signs of turning around; perhaps some stabilization at best, but at a
very depressed level. This is why deflation, not inflation, is the principal risk in
2010, and why it is that utilities, the most out of favour equity group, may be the
surprise for the year — that 4.1% dividend yield looks very juicy next to the sub-2%
yield for the overall market.
CHART 3: MONEY MULTIPLIER HAD BROKEN DOWN
United States: M1 Money Multiplier(ratio of M1 money supply to the adjusted monetary base)
050505
3. 2
2. 8
2. 4
2. 0
1. 6
1. 2
0. 8
Source: Haver Analytics, Gluskin Sheff
Page 4 of 12
8/14/2019 Dave Rosenberg Gluskin Sheff 01/07/2010
http://slidepdf.com/reader/full/dave-rosenberg-gluskin-sheff-01072010 5/12
January 7, 2010 – BREAKFAST WITH DAVE
CHART 4: TURNOVER OF MONEY IS STILL
NOT SHOWING SIGNS OF A TURNAROUND
United States: Nominal GDP relative to M1 Money Supply(ratio)
0505
10.50
9.75
9.00
8.25
7.50
6.75
6.00
Source: Haver Analytics, Gluskin Sheff
INCOME THEME STILL INTACT
We said a few days back that one of the key hurdles for the equity market this
year will be whether the retail investor will capitulate and pick up the baton
since the primary sources of buying power from short covering (the shorts are
out), PMs putting cash to work (liquidity ratios are back to where they were at
the market peak in October 2007) and hedge funds (now that the high-water
marks have been re-attained in many cases) are very likely to subside.
In the final week of 2009,American investors redeemeda net $1.2 billion andreallocated the proceeds tobond funds
Well, for the week ending December 29 th, the little guy was still following a
strategy of selling into the bear market rally rather than chase performance —
and this increasingly looks like a secular behavioural change. (By the way, the
retail investors shed his/her image as being a lagging indicator back in the fall
of 2007 when the credit collapse began because there was actually net selling
of equity funds during that time frame even as institutional investors were
lowering their cash ratios). In the final week of 2009, American investors
redeemed a net $1.2 billion and reallocated the proceeds to bond funds, which
took in a net $4.2 billion to close out the year.
PITHY THOUGHTS
Three attempts at 4.0% on the U.S. 10-year Treasury note and all three attempts
failed despite widespread bearish sentiment towards bonds. Makes you wonder
if Treasuries are a buy or at least an opportunity if we get another spasm.
Everyone believes we are in a recovery but could it be aggressive seasonal
adjustment factors at play? After all, what sort of recovery is it when state/local
tax revenues are down 10.7% YoY as of the third quarter?
Page 5 of 12

8/14/2019 Dave Rosenberg Gluskin Sheff 01/07/2010
http://slidepdf.com/reader/full/dave-rosenberg-gluskin-sheff-01072010 6/12
January 7, 2010 – BREAKFAST WITH DAVE
Auto sales looked better in December but 20% of the pickup was in fleet sales,
which do not show up in the retail sales data. Consumer spending intentions on
autos and homes are at multi-decade lows.
All the economic growth in theU.S. in Q3 was due togovernment stimulus, and justabout all the growth in thecurrent quarter is a decliningrate of inventory destocking
The unsold housing inventory is higher than you think — we have two million
vacant units for sale in the U.S.A. and on top of that we have one million units
being held off the market for unmentioned reasons and on top of that, 3.5
million folks with a home for sale that haven’t sold. That brings us to 6.5 million
houses and condos that are overhanging the market and another 15 million
foreclosures that could well be in the pipeline.
The consensus of economists see 4% nominal GDP growth in the coming year;
strategists see 36% profit growth. Both can’t be right.
According to the latest Investors Intelligence Poll, the share of PMs who are bulls
now stands at 48.3% versus 16.9% for the bears. In other words, there are
three times as many bulls out there as there are bears. The industry is
populated with rose-coloured glasses.
All the economic growth in the U.S. in Q3 was due to government stimulus. And
just about all the growth in the current quarter is a declining rate of inventory
destocking. We reiterate that what is normal after a recession ends is that the
first quarter of growth sees real GDP expand at a 7% annual rate, not 2.2%.
Indeed, 2.2% was the weakest quarter to follow a recession — assuming we are
out of recession — in recorded history.
One has to wonder what sort of recovery we have in the housing market when a
5% mortgage rate can’t lift mortgage applications — the purchase index is down
28% from what were ultra-depressed levels of a year ago.
WHAT TO LOOK FOR IN THE PAYROLL DATA?
To reiterate, a glaring gap has developed between the ADP private payroll results
and what we see out of the nonfarm payroll (“Establishment”) survey. Part of
the reason is that the nonfarm payroll report is not fully reflecting what is
happening at the small business level, and this is the key part of the economy
that is lagging the trends in output, orders and sales evident among large
corporations at this time.
The Household survey has its own flaws; it is just a poll of individuals and has
sampling errors of its own. But there is a metric that puts the Household survey
on a comparable basis to the payroll survey (called the ‘payroll and populationconcept adjusted’ employment — now doesn’t that just roll off the tongue?) and
it fell 109,000 in November and is off 1.2 million over the past three months.
Some recovery. This measure, by the way, was early in picking up what was
happening with the economy as it started to peel off in April 2007 or about nine
months before the recession officially began, and it began to pick up in August
2002, at least six months before the recovery really took hold.
Page 6 of 12

8/14/2019 Dave Rosenberg Gluskin Sheff 01/07/2010
http://slidepdf.com/reader/full/dave-rosenberg-gluskin-sheff-01072010 7/12
January 7, 2010 – BREAKFAST WITH DAVE
This measure is useful because it better captures what is happening at the small
business level — the nonfarm payroll survey covers 160,000 businesses and
government agencies while the ADP covers 400,000. So you can see which one
of the two may be a better representation of the small business sector.
CHART 5: TODAY’S RELEVANT EMPLOYMENTMEASURE IS STILL IN FREEFALL
United States: Household Employment: Population and Payroll Concept Adjusted
(millions)
110
115
120
125
130
135
140
94 95 96 97 98 99 00 01 02 03 04 05 06 07 08 09
Source: Haver Analytics, Gluskin Sheff
FOMC MINUTES A REALLY BIG DEAL
Anyone who thought we were going to see the Fed raise rates any time on the
forecasting horizon are probably going to have to switch their view. So long as
the Fed is out of the picture there is precious little chance of any sustained
increase in bond yields, large-scale fiscal deficits notwithstanding. The yield
curve is already at its steepest level in three decades, so the trend will likely
be towards bull flattening, which must be the most contrary trade out there
today (besides being overweight the utilities or health care sectors).
It is amazing that after 2½ years of rate cuts and over a year of quantitative
easing, coupled with the most dramatic fiscal stimulus of all time, that there
would be so much concern — and debate — over the economic outlook. Go
back to 1960 and isolate the nine Fed easing cycles. What you will see is that
what is “normal” is that 10 quarters after the first rate cut the magic is
working and on average GDP growth is rocking and rolling at a 5% annual rate.
Sort of puts a fiscally-induced 2.2% rebound in Q3 and a near 4% inventory-led
pace in Q4 into a certain perspective. So maybe it is not a surprise as the
stock market hyperventilates that policymakers, for the most part, areextremely nervous over the economic outlook.
Page 7 of 12

8/14/2019 Dave Rosenberg Gluskin Sheff 01/07/2010
http://slidepdf.com/reader/full/dave-rosenberg-gluskin-sheff-01072010 8/12
January 7, 2010 – BREAKFAST WITH DAVE
All the kings horses and men have yet to put Humpty together again and this is
at a time when the easing began 2½ years ago and has hit a level that would
leave you wondering what can be done next if the economy were to fall short
of growing at trend rate of growth, let alone relapse which is a distinct
possibility in a post bubble credit collapse that is being cushioned by dramatic
government stimulus.
Here are some of the key quotes from the December 15-16 FOMC minutes,
which were released yesterday:
“Participants agreed that underlying inflation currently was subdued
and was likely to remain so for some time. Some noted the risk that,
over the next couple of years, inflation could edge further below the
rates they judged most consistent with the Federal Reserve's dual
mandate for maximum employment and price stability; others saw
inflation risks as tilted toward the upside in the medium term.”
“While these developments were positive, participants noted several
factors that likely would continue to restrain the expansion in
economic activity. Business contacts again emphasized they would
be cautious in adding to payrolls and capital spending, even as
demand for their products increases. Conditions in the commercial
real estate (CRE) sector were still deteriorating. Bank credit had
contracted further, and with many banks facing continuing loan
losses, tight bank credit could continue to weigh on the spending of
some households and businesses. Some participants remained
concerned about the economy's ability to generate a self-sustaining
recovery without government support.”
“With rising levels of nonperforming loans expected to be a
continuing source of stress, and with many regional and small banks
vulnerable to the deteriorating performance of CRE loans, bank
lending terms and standards were seen as likely to remain tight.”
“While survey evidence suggested that small businesses considered
weak demand to be a larger problem than access to credit,
participants saw limited credit availability as a potential constraint
on future investment and hiring by small businesses, which normally
are a significant source of employment growth in recoveries.”
Page 8 of 12

8/14/2019 Dave Rosenberg Gluskin Sheff 01/07/2010
http://slidepdf.com/reader/full/dave-rosenberg-gluskin-sheff-01072010 9/12
January 7, 2010 – BREAKFAST WITH DAVE
“The weakness in labor markets continued to be an important
concern to meeting participants, who generally expected
unemployment to remain elevated for quite some time. The
unemployment rate was not the only indicator pointing to substantial
slack in labor markets: The employment-to-population ratio had
fallen to a 25-year low, and aggregate hours of production workers
had dropped more than during the 1981-82 recession. Although the
November employment report was considerably better than
anticipated, several participants observed that more than one good
report would be needed to provide convincing evidence of recovery
in the labor market. Participants also noted that the slowing pace of
employment declines mainly reflected a diminished pace of layoffs;
few firms were hiring. Moreover, the unusually large fraction of those
individuals with jobs who were working part time for economic
reasons, as well as the uncommonly low level of the average
workweek, pointed to only a gradual decline in unemployment as the
economic recovery proceeded. Indeed, many business contacts
again reported that they would be cautious in their hiring, saying
they expected to meet any near-term increase in demand by raising
their existing employees' hours and boosting productivity, thus
delaying the need to add employees.”
“The decelerations in wages and unit labor costs this year, and the
accompanying deceleration in marginal costs, were cited as factors
putting downward pressure on inflation. Moreover, anecdotal
evidence suggested that most firms had little ability to raise their
prices in the current economic environment.”
“A few members noted that resource slack was expected to diminish
only slowly and observed that it might become desirable at some
point in the future to provide more policy stimulus by expanding the
planned scale of the Committee's large-scale asset purchases and
continuing them beyond the first quarter, especially if the outlook for
economic growth were to weaken or if mortgage market functioning
were to deteriorate.”
THIS ISM INDEX FAILS TO REVIVE ALL THAT MUCH
While the ISM manufacturing index managed to blow through expectations, the
non-manufacturing index came up a tad short in December even if it did nudge up
to 50.1 from 48.7 in November. Orders and backlogs fell; employment and
inventories rose but the former was still at 44.0; therefore, signaling contraction in the service sector, which was missing in the last nonfarm payroll report.
Amazingly, only 39% of the industries that are included in this survey recorded any
positive growth in December. Only 33% saw their order books expand and 22%
said employment rose last month. Hardly inspiring results.
Page 9 of 12

8/14/2019 Dave Rosenberg Gluskin Sheff 01/07/2010
http://slidepdf.com/reader/full/dave-rosenberg-gluskin-sheff-01072010 10/12
January 7, 2010 – BREAKFAST WITH DAVE
Page 10 of 12
Unlike the manufacturing ISM, this report showed that only 5% of respondents
believe customer inventories are “too low” (44% said “too high”). The
comparables in the manufacturing ISM report were 37% and 7%, respectively.
In the fourth quarter, U.S.
apartment vacancy rates hit anew all-time high
MORE ON THE SECULAR FRUGALITY THEME
A valued friend sent along to us a consumer report that cited a Fidelity survey on
New Year’s resolutions, and it dovetailed very nicely with our ongoing Ozzy and
Harriet theme. In essence, the survey found that 60% of those who made
resolutions related to improving their financial position stuck with them in 2009
— the average for all resolutions is just a snick above 50% so this is a
meaningful result.
For the year ahead, 70% said that improving their financial position was going to
be their resolution. A similar Putnam survey showed that this is topped the share
of responses who pledged to “lose weight”. This is a different way to tighten the
belt — pay down debt, boost savings, radically re-prioritize the family budget, invest
in prudent financial products.
ANOTHER ROADBLOCK FOR THE HOUSING INDUSTRY
Ries just published their Q4 numbers and showed that U.S. apartment vacancy
rates hit a new all-time high of 8.0%, forcing landlords to cut asking rents by 2.3%
from a year ago. This is the most pronounced rate of deflation since records
began in 1980, and that understates the situation because “net effective” rents
are down more like 3%. And here we have bond bears talking about inflation.
Well, maybe in raw materials but certainly not in rents, wages, the broad retail
sector and finished goods manufacturing. This is why home prices have the
potential to decline another 10% to 15% this year — the process of mean reverting
relative to rents or incomes has not yet been completed. In our view, this next leg down in home prices will pose the greatest challenge of the year to the outlook for
confidence and spending; not to mention foreclosures, debt forgiveness and
banking sector writedowns.
8/14/2019 Dave Rosenberg Gluskin Sheff 01/07/2010
http://slidepdf.com/reader/full/dave-rosenberg-gluskin-sheff-01072010 11/12
January 7, 2010 – BREAKFAST WITH DAVE
Gluskin Sheff at a Glance
Gluskin Sheff + Associates Inc. is one of Canada’s pre-eminent wealth management firms.Founded in 1984 and focused primarily on high net worth private clients, we are dedicated to theprudent stewardship of our clients’ wealth through the delivery of strong, risk-adjustedinvestment returns together with the highest level of personalized client service. OVERVIEW
As of September 30, 2009, the Firmmanaged assets of $5.0 billion.
Gluskin Sheff became a publicly tradedcorporation on the Toronto Stock Exchange (symbol: GS) in May 2006 andremains 65% owned by its senior
management and employees. We havepublic company accountability andgovernance with a private company commitment to innovation and service.
Our investment interests are directly aligned with those of our clients, asGluskin Sheff’s management andemployees are collectively the largestclient of the Firm’s investment portfolios.
We offer a diverse platform of investmentstrategies (Canadian and U.S. equities,Alternative and Fixed Income) andinvestment styles (Value, Growth and
Income).1
The minimum investment required toestablish a client relationship with theFirm is $3 million for Canadian investors and $5 million for U.S. & Internationalinvestors.
PERFORMANCE
$1 million invested in our Canadian ValuePortfolio in 1991 (its inception date)
would have grown to $15.5 million2
onSeptember 30, 2009 versus $9.7 millionfor the S&P/TSX Total Return Index
over the same period.$1 million usd invested in our U.S.Equity Portfolio in 1986 (its inceptiondate) would have grown to $11.2 millionusd
2on September 30, 2009 versus $8.7
million usd for the S&P 500 TotalReturn Index over the same period.
INVESTMENT STRATEGY & TEAM
We have strong and stable portfoliomanagement, research and client serviceteams. Aside from recent additions, ourPortfolio Managers have been with theFirm for a minimum of ten years and wehave attracted “best in class” talent at all
levels. Our performance results are thoseof the team in place.
Our investment interests are directlyaligned with those of our clients, as Gluskin
She ff ’s management and employees are collectively the largest client of the Firm’sinvestment portfolios.
$1 million invested in our
Canadian Value Portfolio
in 1991 (its inception
date) would have grown to
$15.5 million2 on
September 30, 2009
versus $9.7 million for the
S&P/TSX Total Return
Index over the same
period.
We have a strong history of insightfulbottom-up security selection based onfundamental analysis.
For long equities, we look for companies with a history of long-term growth andstability, a proven track record,shareholder-minded management and ashare price below our estimate of intrinsic
value. We look for the opposite inequities that we sell short.
For corporate bonds, we look for issuers
with a margin of safety for the paymentof interest and principal, and yields whichare attractive relative to the assessedcredit risks involved.
We assemble concentrated portfolios —our top ten holdings typically representbetween 25% to 45% of a portfolio. In this
way, clients benefit from the ideas in which we have the highest conviction.
Our success has often been linked to ourlong history of investing in under-followed and under-appreciated smalland mid cap companies both in Canada
and the U.S.
PORTFOLIO CONSTRUCTION
For further information,
please contact
questions@gluskinshe ff .com
In terms of asset mix and portfolioconstruction, we offer a unique marriagebetween our bottom-up security-specificfundamental analysis and our top-downmacroeconomic view.
Page 11 of 12
Notes:Unless otherwise noted, all values are in Canadian dollars.
1. Not all investment strategies are available to non-Canadian investors. Please contact Gluskin Sheff for information specific to your situation.
2. Returns are based on the composite of segregated Value and U.S. Equity portfolios, as applicable, and are presented net of fees and expenses.

8/14/2019 Dave Rosenberg Gluskin Sheff 01/07/2010
http://slidepdf.com/reader/full/dave-rosenberg-gluskin-sheff-01072010 12/12
January 7, 2010 – BREAKFAST WITH DAVE
IMPORTANT DISCLOSURES
Copyright 2010 Gluskin Sheff + Associates Inc. (“Gluskin Sheff”). All rights
reserved. This report is prepared for the use of Gluskin Sheff clients andsubscribers to this report and may not be redistributed, retransmitted ordisclosed, in whole or in part, or in any form or manner, without the expresswritten consent of Gluskin Sheff. Gluskin Sheff reports are distributedsimultaneously to internal and client websites and other portals by GluskinSheff and are not publicly available materials. Any unauthorized use ordisclosure is prohibited.
Gluskin Sheff may own, buy, or sell, on behalf of its clients, securities of issuers that may be discussed in or impacted by this report. As a result,readers should be aware that Gluskin Sheff may have a conflict of interest
that could affect the objectivity of this report. This report should not beregarded by recipients as a substitute for the exercise of their own judgmentand readers are encouraged to seek independent, third-party research onany companies covered in or impacted by this report.
Individuals identified as economists do not function as research analystsunder U.S. law and reports prepared by them are not research reports underapplicable U.S. rules and regulations. Macroeconomic analysis isconsidered investment research for purposes of distribution in the U.K.
under the rules of the Financial Services Authority.
Neither the information nor any opinion expressed constitutes an offer or aninvitation to make an offer, to buy or sell any securities or other financialinstrument or any derivative related to such securities or instruments (e.g.,options, futures, warrants, and contracts for differences). This report is notintended to provide personal investment advice and it does not take intoaccount the specific investment objectives, financial situation and theparticular needs of any specific person. Investors should seek financialadvice regarding the appropriateness of investing in financial instrumentsand implementing investment strategies discussed or recommended in thisreport and should understand that statements regarding future prospectsmay not be realized. Any decision to purchase or subscribe for securities inany offering must be based solely on existing public information on suchsecurity or the information in the prospectus or other offering documentissued in connection with such offering, and not on this report.
Securities and other financial instruments discussed in this report, orrecommended by Gluskin Sheff, are not insured by the Federal DepositInsurance Corporation and are not deposits or other obligations of anyinsured depository institution. Investments in general and, derivatives, inparticular, involve numerous risks, including, among others, market risk,counterparty default risk and liquidity risk. No security, financial instrumentor derivative is suitable for all investors. In some cases, securities andother financial instruments may be difficult to value or sell and reliableinformation about the value or r isks related to the security or financialinstrument may be difficult to obtain. Investors should note that incomefrom such securities and other financial instruments, if any, may fluctuateand that price or value of such securities and instruments may rise or fall
and, in some cases, investors may lose their entire principal investment.
Past performance is not necessarily a guide to future performance. Levelsand basis for taxation may change.
Foreign currency rates of exchange may adversely affect the value, price orincome of any security or financial instrument mentioned in this report.Investors in such securities and instruments effectively assume currencyrisk.
Materials prepared by Gluskin Sheff research personnel are based on publicinformation. Facts and views presented in this material have not beenreviewed by, and may not reflect information known to, professionals inother business areas of Gluskin Sheff. To the extent this report discussesany legal proceeding or issues, it has not been prepared as nor is itintended to express any legal conclusion, opinion or advice. Investorsshould consult their own legal advisers as to issues of law relating to thesubject matter of this report. Gluskin Sheff research personnel’s knowledgeof legal proceedings in which any Gluskin Sheff entity and/or its directors,officers and employees may be plaintiffs, defendants, co-defendants or co-plaintiffs with or involving companies mentioned in this report is based onpublic information. Facts and views presented in this material that relate to
any such proceedings have not been reviewed by, discussed with, and maynot reflect information known to, professionals in other business areas of Gluskin Sheff in connection with the legal proceedings or matters relevant
to such proceedings.
Any information relating to the tax status of financial instruments discussedherein is not intended to provide tax advice or to be used by anyone toprovide tax advice. Investors are urged to seek tax advice based on theirparticular circumstances from an independent tax professional.
The information herein (other than disclosure information relating to GluskinSheff and its affiliates) was obtained from various sources and GluskinSheff does not guarantee its accuracy. This report may contain links to
third-party websites. Gluskin Sheff is not responsible for the content of any third-party website or any linked content contained in a third-party website.Content contained on such third-party websites is not part of this report andis not incorporated by reference into this report. The inclusion of a link in
this report does not imply any endorsement by or any affiliation with GluskinSheff.
All opinions, projections and estimates constitute the judgment of theauthor as of the date of the report and are subject to change without notice.Prices also are subject to change without notice. Gluskin Sheff is under noobligation to update this report and readers should therefore assume thatGluskin Sheff will not update any fact, circumstance or opinion contained in
this report.
Neither Gluskin Sheff nor any director, officer or employee of Gluskin Sheff accepts any liability whatsoever for any direct, indirect or consequentialdamages or losses arising from any use of this report or its contents.
Page 12 of 12
Top Related