


Languages
Pages
Legal


DEPARTMENT OF ECONOMICS
THE EVOLUTION OF COOPERATION IN
BUSINESS: INDIVIDUAL VS. GROUP
INCENTIVES
Daniel Ladley, Department of Economics, University of
Leicester
Ian Wilkinson, University of Sydney Business School,
University of Sydney
Louise Young, School of Marketing, University of Western Sydney
Working Paper No. 13/14
July 2013

The Evolution of Cooperation in Business: Individual
vs. Group Incentives
Daniel Ladley1, Ian Wilkinson2, and Louise Young3
1Department of Economics, University of Leicester∗
2University of Sydney Business School, University of Sydney
3School of Marketing, University of Western Sydney
July 8, 2013
Abstract
Cooperative relations, within and between firms, play important roles in business.
How to produce such relations, however, is less well understood. Building on work in
evolutionary biology we examine the conditions under which group based incentives
result in better performance than individual based incentives. We find that when
individual and group interests are not aligned, group incentive systems lead to both
higher group and individual performance. Hybrid reward systems, with both group
and individual components, are found on average to be inferior to pure group based
systems, but superior for some specific cases.
Keywords: Emergence of cooperation, Incentive systems, Iterated games, Group se-
lection
JEL codes: D00, M52, C63
∗Department of Economics, University of Leicester, Leicester, Leicestershire, LE17RH, UK,[email protected], +44 (0)116 252 5285

1 Introduction
Empirical research has identified cooperative behavior as a key characteristics of groups,
relations and networks associated with high performance (e.g. de Jong et al., 2005; Cum-
mings and Cross, 2003; Spekman and Davis, 2004; Wilkinson, 2008). These studies,
however, do not tell us how such cooperation can be developed and managed, only the
personal and behavioral characteristics that are associated with its presence. More gen-
erally, the reasons for cooperative and altruistic behavior, the presence of which has been
repeatedly demonstrated in experiments carried out across many cultures (e.g. Henrich
et al., 2004), is not well understood. Recent developments in biological theories of the
evolution of cooperation point to the importance of group based selection and reward
mechanisms in driving the emergence of cooperative behavior and superior performance.
This paper investigates the effect of individual, versus group, selection and reward mech-
anisms on performance and considers the implications of the results for the design of
incentive systems.
Our work builds on the computational approach developed by Axelrod and Hamilton
(1981) and others to examine the evolution of cooperation. This previous work focused on
individual selection and reward mechanisms and, in the main, on only one type of game,
the iterated prisoners dilemma (IPD). Here we use this approach to model behavior under
individual, group and hybrid (i.e. mixed) selection mechanisms over a extensive space of
iterated games and examine the conditions under which each type of selection mechanism
results in superior performance. Our findings show that group based systems are superior
when group and individual incentives are not aligned, whilst individual based systems
produce better outcomes more frequently when they are. For hybrid systems the results
show that, over the space of all games, they do not outperform a pure group based system.
In short the outcomes of different types of selection mechanisms depend on the type of
game and the type of interdependence this creates among players. We argue these results
have important implications for the design of incentive systems and may explain the
results of previous experiments and case studies.
The paper is organized as follows. In Section 2, we discuss the role of cooperation in
2

business and the evolution of cooperation. Section 3 presents our model of the evolution
of interaction strategies among individuals in groups. Detailed results examining the
effect of individual, group and hybrid reward and selection mechanisms on performance
are presented in Section 4. Section 5 concludes.
2 Cooperation in Business
Cooperative relations are increasingly seen as a source of competitive advantage for firms,
industries, regions and nations e.g. Spekman and Davis (2004). Within a firm there are
many formal and informal groups of people and departments carrying out interdependent
activities that co-produce value (Stabell and Fjeldstad, 1998). As one manager comments:
“We think everything worth doing is done by groups, not by individuals”(Weber et al.,
2005). The degree of cooperation and coordination within and among groups effects
firm performance (Hakansson and Snehota, 1995; Rulke and Galaskiewicz, 2000; Smith
et al., 1995), however, these effects are often ignored and unrewarded (Kleiner, 2010).
Similarly the value of cooperation between firms has also been highlighted (Wilkinson,
2008; Wilkinson and Young, 2002; Morgan and Hunt, 1994) yet is often neglected in
government policy, e.g. Porter (1990); Wilkinson et al. (2000).
Prior research has analyzed the role of cooperation in business and identified vari-
ous characteristics of agents associated with superior performance. The means by which
these characteristics are encouraged and maintained, however, are not well understood.
Incentives designed to reward individual effort may actually reduce overall performance if
individuals hinder each other. For instance, as Henry Mintzberg observed: “We know that
the most effective companies and organizations are those that embody the importance of
being communities. ... But most conventional management practice and education has
gone in completely the opposite direction. It’s becoming more mercenary, more individu-
alistic, less community oriented, and less nuanced.” (cited in Kleiner, 2010).1 In general
it is difficult to directly control, monitor or evaluate the behavior of all actors involved
1This concern has been echoed by others and highlighted in recent developments in relational contracttheory and research on the evolution of cooperation (e.g. Chassang, 2010; Henrich, 2004; Selten andWarglien, 2007; Weber and Camerer, 2003).
3

(Baker, 2000). Instead for successful cooperative relationships there must be an alignment
of interests between actors such that each individual’s outcomes are maximized when they
behave in ways that maximize the group’s total outcomes.
The design of incentive systems to align and enforce preferred behavior has received
a great deal of attention in economics (e.g. Williamson, 1981) and more broadly (see for
example Hunger and Stern, 1976; Day, 1999). One potential mechanism is the use of
group based incentive systems which assess and reward the group as a whole, dividing the
outcome in a way not directly related to personal performance (see for example Weber
and Camerer, 2003; Selten and Warglien, 2007). Group based systems, however, are not
the norm. In most firms individual based systems are employed in which each person
is rewarded based on their own success (Pfeffer, 1998). The focus on individual-based
incentive systems stems in part from a belief in the primary role of competition, in which
survival of the fittest drives performance. This, however, does not have to be the case.
2.1 The Evolution of Cooperation
While the emergence and value of cooperation among people is observed throughout the
social realm, the reasons for this are unclear and remains a frequent topic of articles in
leading scientific journals (e.g. Hruschka and Henrich, 2006; Nowak, 2006). There are three
main explanations. Firstly, those involved may have unique features that enable cooper-
ators to recognize each other. This, however, creates opportunities for non-cooperators
to emerge who mimic and exploit, cooperators (Hamilton, 1964a,b; Dawkins, 1979). Sec-
ondly, cooperation may be explained in terms of kinship, the biological relation between
two actors. People are more caring, self-sacrificing and cooperative towards others they
share genetic material with, e.g. siblings, children etc. (Axelrod and Hamilton, 1981;
Henrich, 2004). Kinship based explanations, however, are rarely relevant for understand-
ing cooperation in business. Third, the emergence of cooperation may be explained as
a consequence of the interactions taking place over time between individuals. Repeated
interactions are different from one-off interactions. Cooperative strategies can emerge be-
cause of the shadow of the past, demonstration of past altruism, and the future, value of
4

cooperation in subsequent interaction (Axelrod, 1984). Becker (1976) motivates altruism
in an economic context and this has also been demonstrated in computational simulations
by Axelrod and Hamilton (1981); Bergstrom (2002); Hanaki et al. (2007) amongst others.
A fourth way in which the emergence of cooperation may be explained has recently
regained favor. Group selection focuses on the group as the unit of assessment, rather
than the individual actor. This theory hypothesizes that groups, with some degree of
continuity of membership and interaction, provide advantage to their members and out-
perform groups where survival is based solely on individual performance (Goodnight and
Stevens, 1997).
An illustration of the power of group selection mechanisms is provided experimentally.
Selective breeding for hens which lay the most eggs has been used for many years, resulting
in birds that are aggressive with high mortality rates, which undermine increased egg
production (Clarke and Wise, 2009). Research by Muir (1996) has showed that selecting
the most productive groups of hens, rather than individuals, results in superior egg laying
performance and normal life spans. Similar findings apply in other species (Muir, 2005).
Group selection is not a new theory. It was initially embraced by evolutionary biol-
ogists (e.g. Wynne-Edwards, 1962) then rejected (e.g. Maynard-Smith, 1976; Williams,
1966), due to lack of biological evidence and its explanations being less parsimonious than
those of individual selection. A re-examination of the evolutionary equations underlying
group selection (Griffing, 1967; Price, 1970), however, showed that the experimental re-
sults demonstrating the superiority of individual selection did so due to the exclusion of
interaction effects (Goodnight and Stevens, 1997), in other words a random mixing of
the population was assumed. Group selection theories, however, rely on this not being
the case. Henrich (2004) has further developed the theory of group selection in terms of
social and economic systems. His work highlighted a fundamental tension, within groups,
competitive behavior provides greater benefits to individuals than cooperative behavior
but more cooperative groups outperform more competitive groups.
This line of work suggests a mechanism by which more cooperative behavior and
better group performance can be engineered through group as opposed to individual
5

based incentive systems. The fundamental question is: Under what conditions do group
based assessment, reward and selection systems do better than individual based systems?
2.2 Group Reward Systems
In practice, group based incentive systems have been shown to be able to enhance the
performance of teams (FitzRoy and Kraft, 1987; Kruse, 1992; Arya et al., 1997; Che and
Yoo, 2001). The risk of free riding and the inability to detect it is often cited as the
main reason against group based incentives (see for example Hamilton et al., 2003). One
possible solution is the use of mixed incentive schemes, those rewarding both individual
and group performance. Libby and Thorne (2009), however, show that they may not be
beneficial as they may confuse employees.
Whilst group incentive mechanism may produce enhanced performance in some cases
their ability to do so is dependent on the situation in which they are employed (e.g.
FitzRoy and Kraft, 1995). For instance, Libby and Thorne (2009) show that group
reward systems only have a significant benefit in team based tasks but have no benefit
for production lines where there is limited interaction. The exact design of the incentive
scheme is important. Nalbantian and Schotter (1997) show that relative performance
schemes outperform target based schemes whilst the interactions between group members
(Encinosa III et al., 2007), the types of incentives (Lavy, 2002), aspects such as job image
(Akerlof and Kranton, 2005), group membership (Goette et al., 2006) society and company
norms (Kreps, 1997; Fehr and Fischbacher, 2002) and the ability of individuals to hold
up output Kvaløy and Olsen (2012) may also play a role.
The complexity of the relationship between the problem setting and the outcome
makes drawing conclusions regarding the applicability of group reward systems difficult.
Performing an empirical analysis within a firm is expensive and time consuming making
it impossible to gain a general picture with this method. In this paper we use computa-
tional techniques to identify optimal behaviors for a wide range of games under different
incentive schemes. Whilst laboratory experiments could be used to investigate individual
specifications, it would be infeasible to examine the breadth of experiments considered
6
here. Our results, however, provide a basis for designing future experimental research.
The computational approach we will set out in the next section has previously been
used to examine individual selection mechanisms (e.g. Axelrod and Hamilton, 1981). The
effect of group selection has been largely overlooked with a few exceptions. Axelrod (1987)
considered it in terms of spatial models whilst Bowles et al. (2004) show how the existence
of certain types of group level structures may encourage the evolution of group beneficial
traits. Similarly Matros (2012) find that alturism may survive in groups although this is
dependent on the decision rules used by agents. Work in this area has primarily focused
on the IPD game rather than other types of games, which have different types of payoffs.
No research has systematically compared the impact of group versus individual selection
for different game conditions.
3 Model
In this section we present a model of the interaction of individuals under different situa-
tions (games). We initially examine the effect of two different reward mechanism, group
selection, in which the best performing groups are rewarded, and individual selection in
which the best performing individuals are rewarded. We use a computational technique,
a genetic algorithm, to identify the equilibrium strategies under each mechanism. We
do not argue that in reality individuals go through an evolutionary process, instead this
is a mechanism to determine equilibrium behavior in different circumstances Riechmann
(2001). As such this model is normative, rather than descriptive of the mechanism by
which group selection occurs.
3.1 Selection Rules
We consider a model in which individuals interact within groups. The interactions take
the form of two player, iterated, binary choice games. For ease of description we refer
to the two actions as ’cooperate’ and ’defect’, they could, however, take any name. In-
dividual payoffs are dependent on the selection and reward mechanism under which they
7

are interacting. The population consists of n players divided into m groups, each of equal
size (n/m). In each generation every individual plays a specific 2 player game with every
other individual within the group in turn. Each interaction last for r rounds. By con-
sidering iterated games we allow individuals to condition their behavior on that of their
partners, and their previous interactions, as is typically the case within groups and teams.
Arya et al. (1997) and Che and Yoo (2001) have both shown that the ability to monitor
and punish opponents is potentially important in successfully employing group reward
schemes.2
Groups may be considered to be teams of individuals interacting in a company or
similar setting. By modeling groups as a collection of individuals playing two players
games we allow a wide range of strategic possibilities. Players may potentially exploit or
assist different individuals within the team to maximize their payoff under the specific
reward scheme. Their behavior may depend on their own strategy and the personal
characteristics (strategy) of each individual with whom they interact. For example one
player may exploit some members of the group to increase their personal gain but at the
same time cooperate with others who show a propensity to retaliate. An alternative would
be to consider n-player games, however, this would constrain the scope of strategies and
interactions.3
Each individual has a strategy dictating how they play the game. A strategy is rep-
resented as a ’string’ of zeros (defect) and ones (cooperate), which specify the players.
responses to all possible game situations. The set of situations a player may face is de-
pendent on their memory length. With two possible actions, and a memory length of k,
there are 2k possible game situations the player must be able to respond to. For example,
a strategy with memory length two must be able to respond to 4 different game histories
of opponent actions i.e. DD, DC, CD and CC. Throughout this paper we use the con-
2Here we implicitly model all members of the group as interacting equally frequently with all othermembers, however, this need not be the case. A network structure could be imposed on each group,which would determine the individual interactions. The network could even be determined endogenously(e.g. Fosco and Mengel, 2011). It is known that the structure of relations within a group (e.g. Cummingsand Cross, 2003) or units within an organization (e.g. Ethiraj and Levinthal, 2004) can influence itsperformance. Here we use the simplest group structure in order to separate and demonstrate the effectof the reward and evaluation mechanism.
3Although this may make an interesting future extension.
8

vention that the most historically distant action is on the left with actions increasing in
recentness to the right, for example DC means the opponent defected two periods ago,
and cooperated in the last period.4
This strategy, however, is not complete. Players. actions depend on the history of
their opponent’s actions. At the start of the game, for the first k periods, the player
does not have sufficient observations of their opponent’s actions to be able to choose an
action themselves. To resolve this, a player’s strategy also contains a fictitious history of
the opponents play which effect responses during the first k periods. For example with
a memory of two, in addition to the 4 bits governing the players responses there are two
additional bits giving the fictitious history (by convention we start the bit string with
these values). A strategy of 010111 is composed of a fictitious history of 01 (first two
positions) and 0111 (positions 3-6) corresponding to actions in the four states (described
above). This means the individual defects if the other player defected in the previous two
rounds (0 in position 3), cooperates after defection two periods ago and cooperation in
the last period (1 in position 4), cooperates if their opponent cooperated two rounds ago
but defected in the last (1 in position 5) and cooperates if the other player cooperated in
both of the last two rounds (1 in position 6). A player’s first move will be solely governed
by their pre-assigned memory, in this case the memory is 01 which corresponds to D
two periods ago and C one period ago. The agent therefore plays C in the first period,
the response to DC (fourth position) in their strategy. In the second period the second
(more recent) value in the fictitious history (here the value 1) along with one round of real
history are used. Let us assume the other player defects on the first round, the history
will then be 10 (or CD) so the player will therefore play cooperate in the next round.
After round two, decisions are solely based on the real history of play.
We employ a simple Genetic Algorithm (Holland, 1975) to optimize strategies (in a
similar manner to Axelrod, 1987; Midgley et al., 1997). At the start of the simulation
individual strategies are randomly generated. In each generation each individual’s score
is calculated as the total value of the players payoffs from all games played against all
4Ho (1996) uses an alternative automate mechanism. This approach allows more complex strategiesat the expense of clarity of interpretation.
9

other members of the individual’s group. The group’s score is the total score of all
players within a group. Once every player has played every other player within their
group a new generation of players is generated from the existing population. One of two
alternative mechanisms is used to produce the groups. Under individual selection the
best performing individuals are denoted as the n/2 individuals in the population with the
highest total scores. These individuals are copied and inserted into random groups in the
next generation. The remaining individuals are formed by randomly choosing pairs of
the best performing individuals and creating a new strategy by combining the first part
of one strategy with the second part of the other (crossover). The break point is chosen
randomly from a uniform distribution. In biology this mimics reproduction, whilst in
social systems it may be thought of as a form of learning and sharing of strategies within
a population. After crossover there is also a small probability (5%) of a single point
mutation in a strategy in which a 0 flips to 1 or vice versa. The set of n new individuals
are then randomly allocated to groups. Under group selection the m/2 best performing
groups are selected and copied directly into the next generation. The remaining groups
are formed by combining pairs of individuals selected from the best performing groups at
random, irrespective of their individual performance.
This mechanism identifies an equilibrium: A population of strategies in which perfor-
mance is maximized for the given selection mechanism. The process is repeated for 1000
generations. Convergence, defined as group and individual payoffs being on average con-
stant, however, occurs relatively early in this period, typically after 100 iterations. Games
are played for r=200 rounds.5 The population size, n=64, whist the number of groups,
m=8. The memory length, k=3. Repeating the simulations with different population
sizes and memory lengths did not qualitatively change the results but are available from
the authors on request. Different group sizes have a small effect on the results, primarily
for groups of size two. In this case many of the interaction effects are removed as each
player only ever plays one opponent. As a consequence the population behaves like one
large group. For larger groups sizes, however, the results are qualitatively similar. All
5Different numbers of rounds were examined but had no effect on the results.
10

results are averaged over 1000 repetitions with different random seeds.
4 Results
We consider a broad space of games to determine those in which individual or group
selection are superior. Rapoport and Guyer (1966) identify 726 strategically distinct 2×2
games in which individuals have weak preferences over outcomes.6 For this analysis,
however, the absolute values of the payoffs rather than simply their ordering is important
in determining strategy success. This is because an individuals payoff is the sum of the
gains over the repeated game, i.e. the total score. Consequently there are an infinite
number of possible games, making an exhaustive analysis impossible. In order to bound
our analysis we restrict all payoffs to be integer multiples of 0.1 and to lie in the range
[0,1]. This space consists of 14,641 games that show many different structures and include
all orderings of payoffs. There are some games that cannot be represented in this format,
for instance games that would produce lexicographic preferences, nevertheless, this set is
substantial and sufficient for the analysis both in terms of its breadth and detail.
4.1 Group vs. Individual Selection
We first consider which selection mechanism produces the best group and individual
performance for each game in the space described above. In Figures 1 and 2 a black
cell corresponds to games where group selection scored higher, gray cells when individual
selection scored higher and white cells indicate no significant difference. There were 1000
repetitions each for group and individual selection and all differences are significant at
the 99% level. For presentation we focus on a single value of the CC payoff (CC = 0.5),
however, different values have been analyzed. The results are qualitatively similar and
are available on request. In all figures the payoffs for CD and DC vary along the x and
y axis respectively, whilst changes in the DD payoff are represented in terms of different
grids.
6If preferences are strong there are 78 distinct games.
11

[Figure 1 about here.]
Figure 1 shows distinct areas in which each selection mechanism produces better per-
forming groups. The area corresponding to group selection is much larger than that for
individual selection. This means that, for a larger proportion of games, group based
reward mechanisms produce better performance than individual based mechanisms.
Whilst the black area appears to be contiguous it contains several distinct regions of
different types of games. The first is the area bounded by DD ≤ 0.5 and CD +DC > 1.0
i.e. the triangle in the upper right most clearly identifiable in the sub figure for DD =
0.5. In these games the highest combined score may be obtained from anti-coordination.
Consider for example the game in which the payoffs are CC = 0.5, DC = 0.8, CD = 0.4,
DD = 0.0. The best group payoff in this case is if one individual cooperates and the other
defects, however, the defector gets a higher individual score. Under individual selection
this will lead to an increase in the number of defectors and therefore more DD interactions
within the population - consequently reducing group scores. Group selection is able to
select the optimal mix of cooperators and defectors to maximize performance, whereas,
under individual selection, this is not the case.7
The second segment is approximately bounded by DD ≤ 0.4, DC ≥ 0.5 and CD +
DC < 1.0. This corresponds to the area of games in the upper left of the first five sub-
figures, although note it is contiguous with the previously described region. In this area,
mutual cooperation produces the highest total score but defection against a cooperator
produces a higher individual score (the prisoners dilemma exists in this segment). Like
the area discussed above individual selection rewards those players who defect as they
increase their individual score - even though this is at the expense of the group score.
Group selection allows the population to settle on an equilibrium that is beneficial to all.
The payoff favors those that mutually cooperate and it is group selection that encourages
the existence of these strategies. The final area in which group selection is superior is the
triangle bounded by DD > 0.5, DC < 0.5, CD > 0.5 (the bottom right in those figures
7This type of game resembles simple or modular coordination tasks in which individuals specialize indifferent sub-tasks that can then be assembled or added together, as when groups of workers take turnsin digging a hole, recording results, or serving different customers in a market (see the experiments ofSelten and Warglien, 2007; Weber and Camerer, 2003).
12

for DD > 0.5), where the combined payoff for DD is the same or more than CD/DC
and more than CC. This is equivalent to the first region except that the payoff matrix is
mirrored, with DD being the equivalent of CC. Hence the explanation is the same.
Individual selection does better for a range of games present in the bottom left of
the sub-figures. In order to maximize group scores all players must synchronize on either
CC or DD, depending on which is higher. The CD and DC scores are such that if an
individual changes strategy when in the lower performing equilibria they reduce their own
score but reduce the groups score by even more, i.e. they increase their relative fitness.
For example for CD = 0.3, DC = 00 and DD = 0.4 in a group of defectors a single
cooperator would receive 0.3 every time they played and their opponent would receive
0.0. For DD between 0.4 and 0.7 the pure CC and DD payoffs are sufficiently similar that
the optimization method may initially identify either. The actual choice will depend on
the random distribution of strategies at the start of the model. Under group selection
if a population synchronizes on the wrong strategy it is very hard to change. A single
player changing will reduce the group score (even though the individual score is increased)
leading to the group being eliminated. Under individual selection, however, the change
in strategy increases the individuals payoff leading to them spreading in the population
and, in time, the whole population adopting the superior strategy.8
Overall group selection does better than individual selection when individual and group
incentives are not aligned. To achieve the optimal performance some individuals must
sacrifice their payoff for the good of the group as a whole. A Pareto optimum results when
it is possible to compensate those who sacrifice their own performance from the greater
returns to the group as a whole. There is a large area of the space, however, for which
the two mechanisms do equally well. In these areas both individual and group selection
are able to find strategies that are equally effective.
[Figure 2 about here.]
Figure 2 shows that group selection produces the best performing individual in nearly
half of all games. This is surprising as the individual based selection mechanism is specif-
8Note for DD = 0.5 both DD and CC are equally good and so switching is not necessary.
13

ically designed to maximize this quantity. The areas in which this is true closely match
those in which group selection also produced the best performing groups. The conditions
which lead to high total performance also encourage the best individual performance.
There is, however, a notable exception; the set of games for which CD = DC and
CD > 0.5 and DC > 0.5. Here the CD/DC option provides the greatest individual
and combined payoff. Within this region individual scores are maximized by being in
the minority of the group. The regular mixing of individuals occasionally allocates a
defector (cooperator) to a group of cooperators (defectors) resulting in high individual
performance but a low group score (Figure 1). Off this diagonal there is an advantage for
either one action or the other. In these regions the ability to maintain a better environ-
ment provided by group selection outweighs the selection benefits of individual selection
leading to higher individual scores.
A second area in which individual selection does particularly well is the small light gray
triangle in the region DD ≤ 0.4, CD+DC < 1.0 and CD > 0.5. In this region individual
selection does particularly well because of the noise introduced by the selection process.
Occasionally, mutations lead to individuals who defect. Defection in these games damages
the defectors score but give a small increases to their opponents. As a result, the presence
of one of these individuals leads to the group containing the best performing individual in
the population. At the same time the groups overall score is reduced meaning that they
are not the highest scoring group. The highest scoring group is one which contains only
cooperators and is found under both individual and group selection.
There are other instances in which individual selection produces the best individual
in a population although the areas in which this occurs are somewhat diffuse. The reason
for this is that whilst a particular combination of strategies may result in a higher scoring
individual, it is frequently the case that, as this individual spreads throughout the pop-
ulation, their performance is reduced. Consequently, the score of the best individual is
partially dependent on timing and the games they happen in appear to have little pattern.
14
4.2 Strategies
In order to fully understand the behaviors of players under the two selection mechanisms
it is helpful to consider the strategies of player in an example game. The results presented
below are based on the set of strategies present in the 1000th generation for one of the
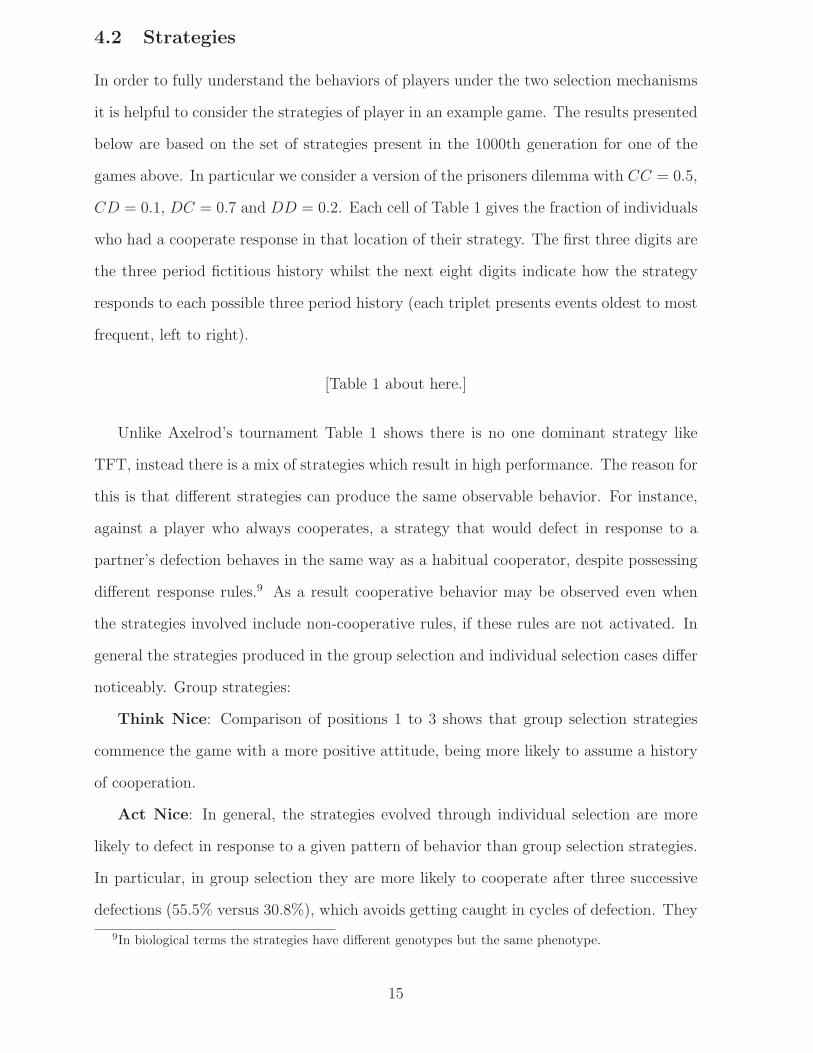
games above. In particular we consider a version of the prisoners dilemma with CC = 0.5,
CD = 0.1, DC = 0.7 and DD = 0.2. Each cell of Table 1 gives the fraction of individuals
who had a cooperate response in that location of their strategy. The first three digits are
the three period fictitious history whilst the next eight digits indicate how the strategy
responds to each possible three period history (each triplet presents events oldest to most
frequent, left to right).
[Table 1 about here.]
Unlike Axelrod’s tournament Table 1 shows there is no one dominant strategy like
TFT, instead there is a mix of strategies which result in high performance. The reason for
this is that different strategies can produce the same observable behavior. For instance,
against a player who always cooperates, a strategy that would defect in response to a
partner’s defection behaves in the same way as a habitual cooperator, despite possessing
different response rules.9 As a result cooperative behavior may be observed even when
the strategies involved include non-cooperative rules, if these rules are not activated. In
general the strategies produced in the group selection and individual selection cases differ
noticeably. Group strategies:
Think Nice: Comparison of positions 1 to 3 shows that group selection strategies
commence the game with a more positive attitude, being more likely to assume a history
of cooperation.
Act Nice: In general, the strategies evolved through individual selection are more
likely to defect in response to a given pattern of behavior than group selection strategies.
In particular, in group selection they are more likely to cooperate after three successive
defections (55.5% versus 30.8%), which avoids getting caught in cycles of defection. They
9In biological terms the strategies have different genotypes but the same phenotype.
15

are more likely to continue to cooperate when the pattern is repeatedly cooperative (DCC,
CCC) and are more forgiving, being more prepared to cooperate when there is cooperation
after two previous defections (58% versus 26.4%).
Provocable: Group evolved strategies are not naive cooperators, as they are just as
likely as individual selection strategies to retaliate once the other starts to defect, i.e.
responses to DCD and CDD.
Group selected strategies have much in common with the characteristics of successful
strategies identified by Axelrod (1984) in an IPD setting: nice, provocable, forgiving and
clear.
4.3 Hybrid Rules
In the previous sections we have compared two schemes: group and individual selection.
Whilst group selection appears to outperform individual selection in many circumstances
it may not fully differentiate in terms of rewarding self-sacrificing behavior (good) as
opposed to free riding behavior (bad). As such free riders may survive in a group over
extended periods of time and have a negative impact on payoffs. For example van Dijk
et al. (2001) show experimentally how the extra effort induced in some individuals by
team based rewards may be lost due free riders in the group. A variety of approaches for
dealing with this have been considered including punishment (Gachter and Fehr, 2000) and
allowing individuals a say in who they interact with (Page et al., 2005). An alternative
is for firms to mix group rewards (encouraging cooperation) with individual incentives
(encouraging effort). Libby and Thorne (2009) suggest that such incentive systems may
be confusing to agents, however, there may be situations in which they produce superior
results.
The reward mechanisms we have previously studied differ in two important dimensions
- the way in which fitness is calculated, based on either that of the individual or the group
total, and the way in which groups are formed. Under group selection the fittest groups
are retained in their entirety whilst under individual selection no structure persists. We
consider, therefore, a two dimensional space of selection schemes. The first dimension is
16

the fitness measure. We define the fitness of individual, i, in group k as:
Ui = (1 − α)Si + αGk
n/m(1)
Where Si is individual i’s score and Gk the total score of group k, Gk
n/mis therefore the
average score of each member of the group. The second dimension is the degree of group
mixing, β. After each generation all individuals with fitness below the median are removed
from their groups and the population. For each individual who’s fitness is greater than or
equal to the population median, with probability β they remain in the same group in the
new generation. Whilst with probability 1−β they are moved to another group selected at
random. The remaining empty space in all groups are filled by new individuals generated
by mutation and crossover of those individuals which survived the previous generation. If
β = 0 the next population is randomly mixed whilst if β = 1 the population structure is
maintained with those individual who performed less well being replaced by new strategies.
We consider all combinations of α and β where α, β ∈ {0.0, 0.1...0.9, 1.0}. If α = 1 and
β = 1 the model matches group selection as presented in the previous section, whilst if
α = 0 and β = 0 the model corresponds to individual selection.
[Figure 3 about here.]
Figure 3 presents the best individual and best group scores for the space of reward
mechanisms averaged over all games where CC,DC,CD,DD ∈ {0.0, 0.1, ., 0.9, 1.0}. The
results show that individual performance is maximized when fitness is solely based on
group performance. Hybrid rules do not enhance performance. Higher levels of β increase
the best scores, however, this effect is secondary to that of α. Group scores are increasing
in both α and β with the maximum occurring for α = 1 and β = 1. Pure group selection
on average produces better individuals and groups than either individual selection or
hybrid rules. It also shows that both group based rewards and a stable environment
contribute to this effect.
The results presented in Figure 3 show the overall pattern, however, our earlier analysis
highlighted certain types of games where individual selection was superior. We go on in
17

this section to consider the effect of α and β on three specific games. The payoff matrices
are presented in Table 2. For Game 1 (Prisoners Dilemma), our previous results showed
group selection produced both the best individuals and groups. In Game 2 group selection
again produced the best groups but individual selection produced the best individuals.
For Game 3 individual selection produced the best individuals and groups.
[Table 2 about here.]
[Figure 4 about here.]
Figure 4 presents results for the three games under the selection mechanisms. For
Game 1, the prisoners dilemma, the highest average performance occurs at high levels
of α and any level of β. High α means that individual fitness is principally determined
by the overall group performance, which rewards co-operators. This being the case β
becomes unimportant, whether group structure is maintained or new groups are formed
from the successful co-operators has no effect. The best individuals for these parameter
combinations also score relatively highly but they are out performed by the best indi-
viduals under high β and intermediate α. In this setting an individual’s performance is
partly dependent on their own score as well as the group. If one individual in a group
occasionally defects they increase their own score with relatively little effect on the group
component of their fitness. This is only the case if β is high. If population shuffling results
in defectors coming together they potentially perform very badly - damaging the group
performance and overall fitness.
In Game 2 individual selection produces the best individuals and group selection the
best groups. It was argued that the highest individual scores were obtained when a player
was part of a group in which the majority use the opposite strategy and that this occurred
more frequently under individual selection. From the analysis of α and β in Figure 4 we
can see that both contribute to this effect. More population mixing ensures that these
chance pairings may happen frequently whilst an individual component to fitness means
that successful individual strategies will spread in the population, changing the numbers
of cooperators and defectors and making unbalanced groups more likely. Panel D shows
18

that the key element leading to better groups under group selection is high β, i.e. stable
group structure. In this game the highest scores are achieved when cooperators play
defectors in equal numbers. Stable groups are better able to do this than those that are
randomly mixed. α has a weak effect, particularly at high β, however, for lower values of β
fitness is decreasing with increasing α - the same pattern observed for the best individual.
The figures for Game 3 show that β has very little effect on fitness, rather the ap-
parent superiority of individual reward mechanisms comes from α i.e. group structure is
unimportant but individual reward components are beneficial. This follows from the jus-
tification provided above for superior individual performance in these games. We argued
that individual based selection aids individuals, and therefore the population, to move
from inferior equilibria to a superior one. The results show that it is only necessary for a
small individual component to be included in the fitness for this to happen. Whether or
not individuals are mixed or population structure is maintained has little effect on this.
5 Conclusion
Whilst many papers have highlighted the positive effect on performance of cooperation
within and between firms, little work has considered the means by which this cooperation
can be developed. Our results provide a systematic basis for understanding the conditions
under which group based incentives systems lead to higher group and individual perfor-
mance relative to individually oriented systems. We find that group selection produces
the best individual and higher average performance for a wider range of games than indi-
vidual selection. The results show that group selection dominates in games where group
and individual payoffs are not aligned. Individual selection only does better when group
and individual payoffs are aligned and where unilateral deviation may aid the group in
moving to a superior equilibrium. When interests are not aligned, group selection leads
to the emergence and survival of groups of strategies in which some individuals do far
better than others and the group as a whole benefits. The use of hybrid rules, those
rewarding both individual and group performance does not change this key finding. The
best performing groups and individuals still occur when fitness is determined purely on
19

group score and team structure is maintained.
Our results call into question the conventional wisdom and common practice in which
group formation and reward structures are designed in ways that in the main favor se-
lection of best performing individuals. As Sutton (2007) notes a focus exclusively on
individual incentives is likely to damage group functioning as this over-rewards the most
visible performers, under rewards those who support them and fails to include in metrics
the costs and damages associated with favoring the top performers.
20

References
Akerlof, G. A., Kranton, R. E., 2005. Identity and the economics of organizations. The
Journal of Economic Perspectives 19 (1), 9–32.
Arya, A., Fellingham, J., Glover, J., 1997. Teams, repeated tasks, and implicit incentives.
Journal of Accounting and Economics 23 (1), 7–30.
Axelrod, R., 1984. The Evolution of Cooperation. Basic Books, New York.
Axelrod, R., 1987. The evolution of strategies in the iterated prisoner’s dilemma. In:
Davis, L. (Ed.), Genetic Algorithms and Simulated Annealing,. Pitman, London, pp.
32–41.
Axelrod, R., Hamilton, W. D., 1981. The evolution of cooperation. Science 21 (1), 1390–
1396.
Baker, G., 2000. The use of performance measures in incentive contracting. The American
Economic Review 90 (2), 415–420.
Becker, G. S., 1976. Altruism, egoism, and genetic fitness: Economics and sociobiology.
Journal of Economic Literature 14 (3), 817–826.
Bergstrom, T. C., 2002. Evolution of social behavior: Individual and group selection.
Journal of Economic Perspectives 16 (2), 67–88.
Bowles, S., Choi, J.-K., Hopfensitz, A., 2004. The co-evolution of individual behaviours
and social institutions. Journal of Theoretical biology 223, 135–147.
Chassang, S., 2010. Building routines: Learning, cooperation, and the dynamics of in-
complete relational contracts. American Economic Review 100 (1), 448–465.
Che, Y.-K., Yoo, S.-W., 2001. Optimal incentives for teams. American Economic Review
91 (3), 525–541.
Clarke, D. G., Wise, R. E., 2009. Optical distortion (a). Harvard Business School Case
(original publication 1975).
21

Cummings, J., Cross, R., 2003. Structural properties of work groups and their conse-
quences for performance. Social Networks 25 (3), 197–210.
Dawkins, R., 1979. The Selfish Gene. Oxford University Press.
Day, G., 1999. Creating a market-driven organization. Sloan Management Review 41 (1),
11–22.
de Jong, A., de Ruyter, K., Wetzels, M., 2005. Antecedents and consequences of group
potency: A study of self-managing service teams. Management Science 51 (11), 1610–
1625.
Encinosa III, W. E., Gaynor, M., Rebitzer, J. B., 2007. The sociology of groups and the
economics of incentives: Theory and evidence on compensation systems. Journal of
Economic Behavior and Organization 62 (2), 187–214.
Ethiraj, S. K., Levinthal, D., 2004. Bounded rationality and the search for organizational
architecture: An evolutionary perspective on the design of organizations and their
evolvability. Administrative Science Quarterly 49 (3), 404–437.
Fehr, E., Fischbacher, U., 2002. Why social preferences matter - the impact of non-selfish
motives on competition cooperation and incetives. The Economic Journal 112, 1–33.
FitzRoy, F. R., Kraft, K., 1987. Cooperation, productivity, and profit sharing. Quarterly
Journal of Economics 102 (1), 23–35.
FitzRoy, F. R., Kraft, K., 1995. On the choice of incentives in firms. Journal of Economic
Behavior and Organization 26 (1), 145–160.
Fosco, C., Mengel, F., 2011. Cooperation through imitation and exclusion in networks.
Journal of Economic Dynamics and Control 35 (5), 641–658.
Gachter, S., Fehr, E., 2000. Cooperation and punishment in public goods experiments.
American Economic Review 90 (4), 980–994.
22

Goette, L., Huffman, D., Meier, S., 2006. The impact of group membership on cooperation
and norm enforcement: Evidence using random assignment to real social groups. The
American Economic Review 96 (2), 212–216.
Goodnight, C., Stevens, L., 1997. Experimental studies of group selection: what do they
tell us about group selection in nature? The American Naturalist 150 (Supplement),
S59–S79.
Griffing, B., 1967. Selection in reference to biological groups. individual and group se-
lection applied to populations of unordered groups. Australian Journal of Biological
Science. 10 10, 127–139.
Hakansson, H., Snehota, I., 1995. Developing Relationships in Business Networks. Rout-
ledge.
Hamilton, B. H., Nickerson, J. A., Owan, H., 2003. Team incentives and worker hetero-
geneity: An empirical analysis of the impact of teams on productivity and participation.
Journal of Political Economy 111 (3), 465–497.
Hamilton, W. D., 1964a. The genetic evolution of social behaviour, I. The Joural of
Theoretical Biology 7 (1), 1–16.
Hamilton, W. D., 1964b. The genetic evolution of social behaviour, II. The Joural of
Theoretical Biology 7 (1), 17–52.
Hanaki, N., Peterhansl, A., Dodds, P. S., Watts, D. J., 2007. Cooperation in evolving
social networks. Management Science 53 (7), 1036–1050.
Henrich, J., 2004. Cultural group selection, coevolutionary processes and large-scale co-
operation. Journal of Economic Behavior and Organization 53 (1), 3–35.
Henrich, J., Boyd, R., Bowles, S., Camerer, C., Fehr, E., Gintis, H. (Eds.), 2004. Founda-
tions of human sociality: Economic experiments and ethnographic evidence from fifteen
small-scale societies. Oxford University Press.
23

Ho, T.-H., 1996. Finite automata play repeated prisoner’s dilemma with information
processing costs. Journal of Economic Dynamics and Control 20 (1-3), 173–207.
Holland, J. H., 1975. Adaption in natural and artificial systems. University of Michigan
Press.
Hruschka, D. J., Henrich, J., 2006. Friendship, cliquishness, and the emergence of coop-
eration. Journal of Theoretical Biology 239, 1–15.
Hunger, D. J., Stern, L. W., 1976. An assessment of the functionality of superordinate
goals in reducing conflict. Academy of Mangement Journal 19, 591–605.
Kleiner, A., March 15 2010. Management by reflection. Strategy and Business.
Kreps, D. M., 1997. Intrinsic motivation and extrinsic incentives. The American Economic
Review 87 (2), 359–364.
Kruse, D. K., 1992. Profit sharing and productivity: Microeconomic evidence from the
united states. The Economic Journal 102 (410), 24–36.
Kvaløy, O., Olsen, T. E., 2012. The rise of individual performance pay. Journal of Eco-
nomics & Management Strategy 21 (2), 493–518.
Lavy, V., 2002. Evaluating the effect of teachers’ group performance incentives on pupil
achievement. Journal of Political Economy 110 (6), 1286–1317.
Libby, T., Thorne, L., 2009. The influence of incentive structure on group performance in
assembly lines and teams. Behavioral Research In Accounting 21 (2), 57–72.
Matros, A., 2012. Altruistic versus egoistic behavior in a public good game. Journal of
Economic Dynamics and Control 36 (4), 642–656.
Maynard-Smith, J., 1976. Group selection. Quarterly Review of Biology 51, 277–283.
Midgley, D. F., Marks, R. E., Cooper, L. C., 1997. Breeding competitive strategies. Man-
agement Science 43, 257–275.
24

Morgan, R. M., Hunt, S. D., 1994. The commitment-trust theory of relationship market-
ing. Journal of Marketing 58, 20–38.
Muir, W. M., 1996. Group selection for adaptation to multiple-hen cages: selection pro-
gram and direct responses. Poultry Science 75, 447–458.
Muir, W. M., 2005. Incorporation of competitive effects in forest tree or animal breeding
programs. Genetics 170, 1247–1259.
Nalbantian, H. R., Schotter, A., 1997. Productivity under group incentives: An experi-
mental study. The American Economic Review 87 (3), 314–341.
Nowak, M. A., 2006. Five rules for the evolution of cooperation. Science 314 (5805),
1560–1563.
Page, T., Putterman, L., Unel, B., 2005. Voluntary association in public goods exper-
iments: Reciprocity, mimicry and efficiency. The Economic Journal 115 (506), 1032–
1053.
Pfeffer, J., 1998. The Human Equation. Harvard Business School Press, Boston, MA.
Porter, M., 1990. The Competitive Advantage of Nations. Free Press, New York.
Price, G. R., 1970. Selection and covariance. Nature 227, 520–521.
Rapoport, A., Guyer, M., 1966. A taxonomy of 2x2 games. General Systems 11, 203–14.
Riechmann, T., 2001. Genetic algorithm learning and evolutionary games. Journal of
Economic Dynamics and Control 25 (6-7), 1019–1037.
Rulke, D. L., Galaskiewicz, J., 2000. Distribution of knowledge, group network structure,
and group performance. Management Science 46 (5), 612–625.
Selten, R., Warglien, M., 2007. The emergence of simple languages in an experimental
coordination game. Proceedings of the National Academy of Sciences 104 (18), 7361–
7366.
25

Smith, K. G., Carroll, S. J., Ashford, S., 1995. Intra- and interorganizational cooperation:
Toward a research agenda. Academy of Management Journal 38 (1), 7–23.
Spekman, R. E., Davis, E. W., 2004. Extended Enterprise. Prentice Hall, Financial Times.
Stabell, C. B., Fjeldstad, O. D., 1998. Configuring value for competitive advantage: on
chains, shops, and networks. Strategic Management Journal 19 (5), 413–437.
Sutton, R., 2007. Building the Civilised Workplace. McKinsey Quarterly. May.
van Dijk, F., Sonnemans, J., van Winden, F., 2001. Incentive systems in a real effort
experiment. European Economic Review 45 (2), 187–214.
Weber, J., Holmes, S., Palermi, C., 2005. The corporate innovation. Business Week, 79–80.
Weber, R. A., Camerer, C. F., 2003. Cultural conflict and merger failure: An experimental
approach. Management Science 49 (4), 400–415.
Wilkinson, I. F., 2008. Business Relating Business: Managing Organisational Relations
and Networks. Edward Elgar, Chichester, UK.
Wilkinson, I. F., Mattsson, L.-G., Easton, G., 2000. International competitiveness and
trade promotion policy from a network perspective. Journal of World Business 35 (3),
275–299.
Wilkinson, I. F., Young, L., 2002. On cooperating: Firms, relations and networks. Journal
of Business Research 55 (2), 123–132.
Williams, G., 1966. Adaptation and Natural Selection: A Critique of Some Current Evo-
lutionary Thought. Princeton University Press, Princeton, New Jersey.
Williamson, O. E., 1981. The modern corporation: Origins, evolution, attributes. Journal
of Economic Literature 19, 1537–1568.
Wynne-Edwards, V., 1962. Animal Dispersion in Relation to Social Behaviour. Hafner
Publishing Company, New York, NY.
26

DD=0.0
0.1 0.3 0.5 0.7 0.9
0.90.70.50.30.1
DD=0.1
0.1 0.3 0.5 0.7 0.9
0.90.70.50.30.1
DD=0.2
0.1 0.3 0.5 0.7 0.9
0.90.70.50.30.1
DD=0.3
0.1 0.3 0.5 0.7 0.9
0.90.70.50.30.1
DD=0.4
0.1 0.3 0.5 0.7 0.9
0.90.70.50.30.1
DD=0.5
0.1 0.3 0.5 0.7 0.9
0.90.70.50.30.1
DD=0.6
0.1 0.3 0.5 0.7 0.9
0.90.70.50.30.1
DD=0.7
0.1 0.3 0.5 0.7 0.9
0.90.70.50.30.1
DD=0.8
0.1 0.3 0.5 0.7 0.9
0.90.70.50.30.1
DD=0.9
0.1 0.3 0.5 0.7 0.9
0.90.70.50.30.1
DD=1.0
0.1 0.3 0.5 0.7 0.9
0.90.70.50.30.1
Figure 1: Comparison of group and individual selection mechanisms in terms of the best groupperformance across a range of games. Simulations results with CC = 0.5, CD on the x-axis, DCon the y-axis, 1000 repetitions each, < 0.01 t-test.
27

Fitness
Cha
nge
DD=0.0
0.1 0.3 0.5 0.7 0.9
0.90.70.50.30.1
Fitness
Cha
nge
DD=0.1
0.1 0.3 0.5 0.7 0.9
0.90.70.50.30.1
Fitness
Cha
nge
DD=0.2
0.1 0.3 0.5 0.7 0.9
0.90.70.50.30.1
Fitness
Cha
nge
DD=0.3
0.1 0.3 0.5 0.7 0.9
0.90.70.50.30.1
Fitness
Cha
nge
DD=0.4
0.1 0.3 0.5 0.7 0.9
0.90.70.50.30.1
Fitness
Cha
nge
DD=0.5
0.1 0.3 0.5 0.7 0.9
0.90.70.50.30.1
Fitness
Cha
nge
DD=0.6
0.1 0.3 0.5 0.7 0.9
0.90.70.50.30.1
Fitness
Cha
nge
DD=0.7
0.1 0.3 0.5 0.7 0.9
0.90.70.50.30.1
Fitness
Cha
nge
DD=0.8
0.1 0.3 0.5 0.7 0.9
0.90.70.50.30.1
Fitness
Cha
nge
DD=0.9
0.1 0.3 0.5 0.7 0.9
0.90.70.50.30.1
FitnessC
hang
e
DD=1.0
0.1 0.3 0.5 0.7 0.9
0.90.70.50.30.1
Figure 2: Comparison of group and individual selection mechanisms in terms of the best individ-ual performance across a range of games. Simulations results with CC=0.5, CD on the x-axis,DC on the y-axis, 1000 repetitions each, < 0.01 t-test.
28

Fitness
Cha
nge
0.0 0.1 0.2 0.3 0.4 0.5 0.6 0.7 0.8 0.9 1.0
1.0
0.9
0.8
0.7
0.6
0.5
0.4
0.3
0.2
0.1
0.0
(a) Best Individual
Fitness
Cha
nge
0.0 0.1 0.2 0.3 0.4 0.5 0.6 0.7 0.8 0.9 1.0
1.0
0.9
0.8
0.7
0.6
0.5
0.4
0.3
0.2
0.1
0.0
(b) Best Group
Figure 3: Scores of the best individual (Left) and best group (right) averaged over 14641 differentgames across a space of reward rules. The fitness measure, α, ranging from individual basedto group based is given on the X axis. The group mixing measure, β, ranging from random toconstant is given on the Y axis. Lighter colors represent higher scores.
29

Fitness
Cha
nge
0.0 0.1 0.2 0.3 0.4 0.5 0.6 0.7 0.8 0.9 1.0
1.0
0.9
0.8
0.7
0.6
0.5
0.4
0.3
0.2
0.1
0.0
(a) Best Individual
Fitness
Cha
nge
0.0 0.1 0.2 0.3 0.4 0.5 0.6 0.7 0.8 0.9 1.0
1.0
0.9
0.8
0.7
0.6
0.5
0.4
0.3
0.2
0.1
0.0
(b) Best Group
Fitness
Cha
nge
0.0 0.1 0.2 0.3 0.4 0.5 0.6 0.7 0.8 0.9 1.0
1.0
0.9
0.8
0.7
0.6
0.5
0.4
0.3
0.2
0.1
0.0
(c) Best Individual
Fitness
Cha
nge
0.0 0.1 0.2 0.3 0.4 0.5 0.6 0.7 0.8 0.9 1.0
1.0
0.9
0.8
0.7
0.6
0.5
0.4
0.3
0.2
0.1
0.0
(d) Best Group
Fitness
Cha
nge
0.0 0.1 0.2 0.3 0.4 0.5 0.6 0.7 0.8 0.9 1.0
1.0
0.9
0.8
0.7
0.6
0.5
0.4
0.3
0.2
0.1
0.0
(e) Best Individual
Fitness
Cha
nge
0.0 0.1 0.2 0.3 0.4 0.5 0.6 0.7 0.8 0.9 1.0
1.0
0.9
0.8
0.7
0.6
0.5
0.4
0.3
0.2
0.1
0.0
(f) Best Group
Figure 4: Scores of the best individual (Left) and best group (right) for four games across aspace of reward rules. The fitness measure, α, ranging from individual based to group based isgiven on the X axis. The group mixing measure, β, ranging from random to constant is given onthe Y axis. Lighter colors represent higher score. Lighter colors represent higher scores. Panelsa+b: CC = 0.5, CD = 0.1, DC = 0.7, DD = 0.2, Panels c+d: CC = 0.5, CD = 1.0, DC = 1.0,DD = 0.1, Panels e+f: CC = 0.5, CD = 0.0, DC = 0.3, DD = 0.6.
30

Position Ht−3 Ht−2 Ht−1 DDD DDC DCD DCC CDD CDC CCD CCCGroup 61.9% 83.3% 88.7% 55.5% 58.0% 48.8% 84.1% 49.8% 55.6% 54.1% 98.9%Individual 54.1% 56.1% 86.0% 30.8% 26.4% 53.4% 67.0% 48.0% 71.9% 62.3% 77.6%
Table 1: Probability of a cooperating for strategies with memory length three in the finalgeneration. First three cells contain the fictitious history whilst the remaining eight contain theplayers responses.
31

C DC 0.5,0.5 0.1,0.7D 0.7,0.1 0.2,0.2
(a) Game 1
C DC 0.5,0.5 1.0,1.0D 1.0,1.0 0.1,0.1
(b) Game 2
C DC 0.5,0.5 0.0,0.3D 0.3,0.0 0.6,0.6
(c) Game 3
Table 2: Payoff matrices for three sample games (row player payoff, column player payoff).
32
Top Related