


Languages
Pages
Legal

DALLAS – FORT WORTH MULTIFAMILY OUTLOOK 2016
1
DALLAS – FORT WORTH | MULTIFAMILY OUTLOOK
OVERVIEW
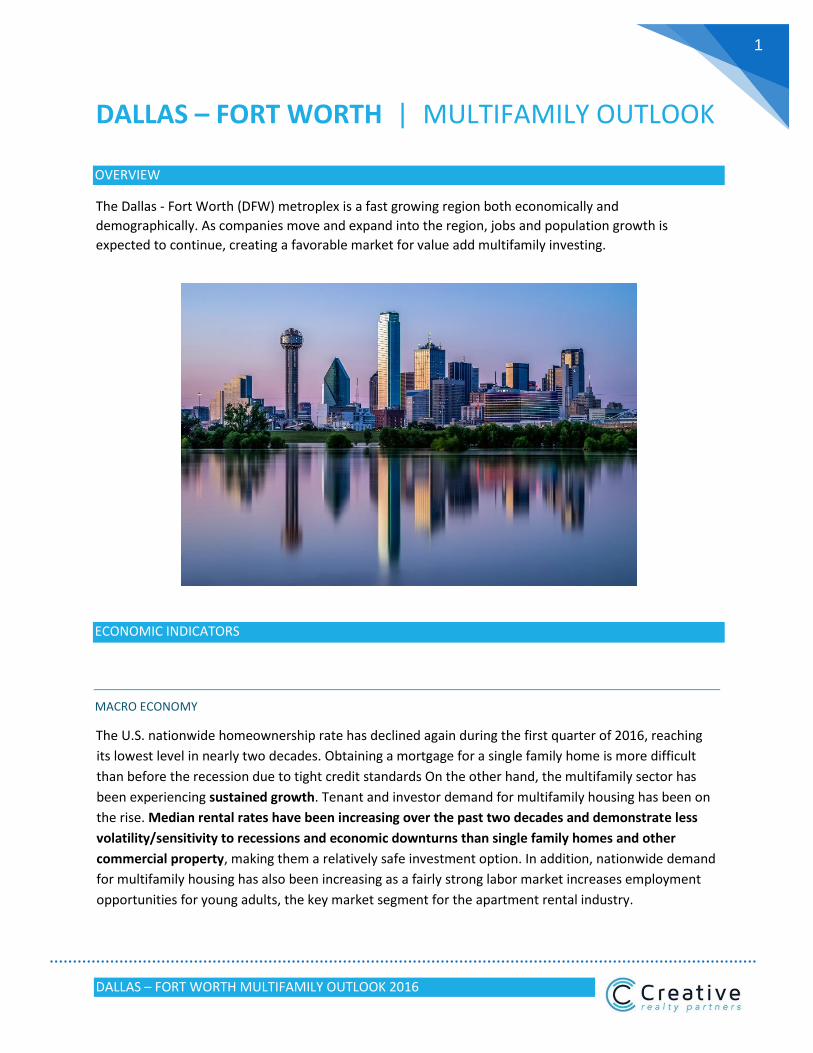
The Dallas - Fort Worth (DFW) metroplex is a fast growing region both economically and
demographically. As companies move and expand into the region, jobs and population growth is
expected to continue, creating a favorable market for value add multifamily investing.
ECONOMIC INDICATORS
MACRO ECONOMY
The U.S. nationwide homeownership rate has declined again during the first quarter of 2016, reaching
its lowest level in nearly two decades. Obtaining a mortgage for a single family home is more difficult
than before the recession due to tight credit standards On the other hand, the multifamily sector has
been experiencing sustained growth. Tenant and investor demand for multifamily housing has been on
the rise. Median rental rates have been increasing over the past two decades and demonstrate less
volatility/sensitivity to recessions and economic downturns than single family homes and other
commercial property, making them a relatively safe investment option. In addition, nationwide demand
for multifamily housing has also been increasing as a fairly strong labor market increases employment
opportunities for young adults, the key market segment for the apartment rental industry.

DALLAS – FORT WORTH MULTIFAMILY OUTLOOK 2016
2
DALLAS – FORT WORTH ECONOMY
The Dallas-Ft. Worth area posted a $504.36 billion economy, the 4th highest metropolitan economy in the
United States and higher than many countries. The DFW area has one of the highest concentrations of
corporate headquarters in the US with numerous companies continuing to announce their relocation and
expansion plans into Dallas. ExxonMobil, AT&T, American Airlines, and many other Fortune 500
companies have headquarters there. It has a highly diversified economy. From 2001-2014 the
metropolitan economy doubled in size and had an average compound growth rate of about 5.4% each
year in the same time period. It has far exceeded pre-recession high of about $375 Billion.
Image Above: GDP (Millions of Dollars) of Dallas Fort Worth Area (2001-2014)
DALLAS – FORT WORTH MULTIFAMILY OUTLOOK 2016
3
EMPLOYMENT
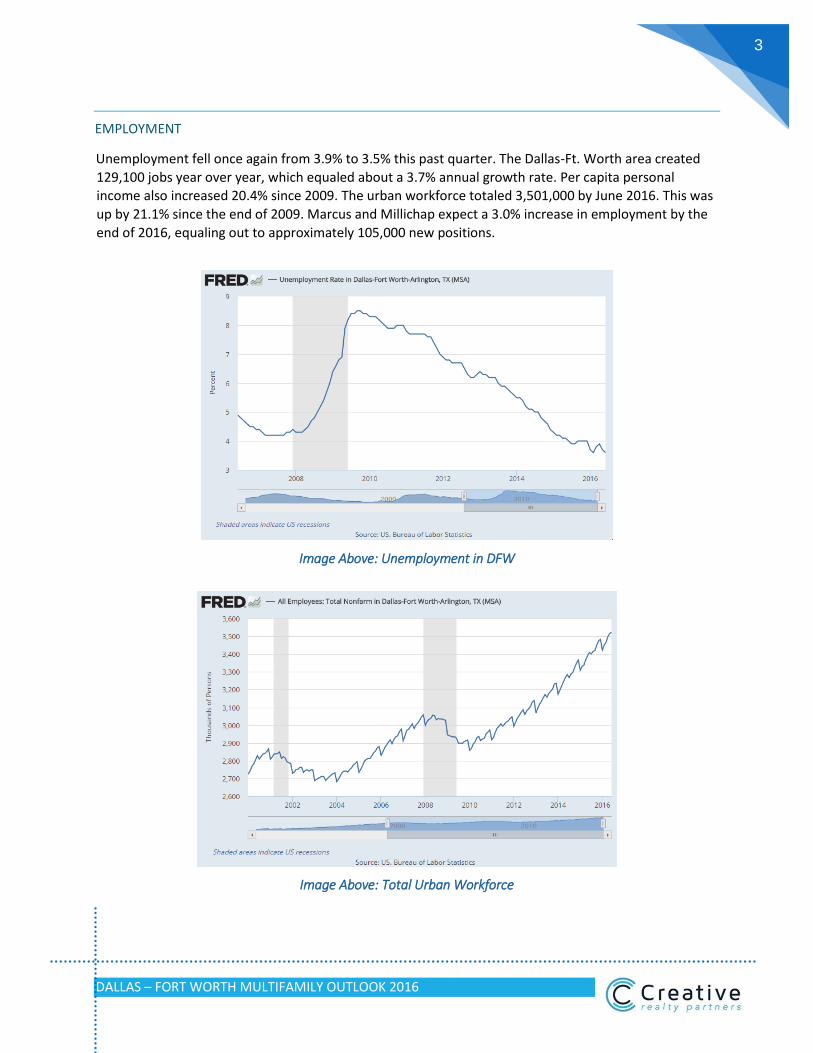
Unemployment fell once again from 3.9% to 3.5% this past quarter. The Dallas-Ft. Worth area created
129,100 jobs year over year, which equaled about a 3.7% annual growth rate. Per capita personal income also increased 20.4% since 2009. The urban workforce totaled 3,501,000 by June 2016. This was
up by 21.1% since the end of 2009. Marcus and Millichap expect a 3.0% increase in employment by the
end of 2016, equaling out to approximately 105,000 new positions.
Image Above: Unemployment in DFW
Image Above: Total Urban Workforce

DALLAS – FORT WORTH MULTIFAMILY OUTLOOK 2016
4
Image Above: Per Capita Personal Income
DALLAS – FORT WORTH MULTIFAMILY OUTLOOK 2016
5
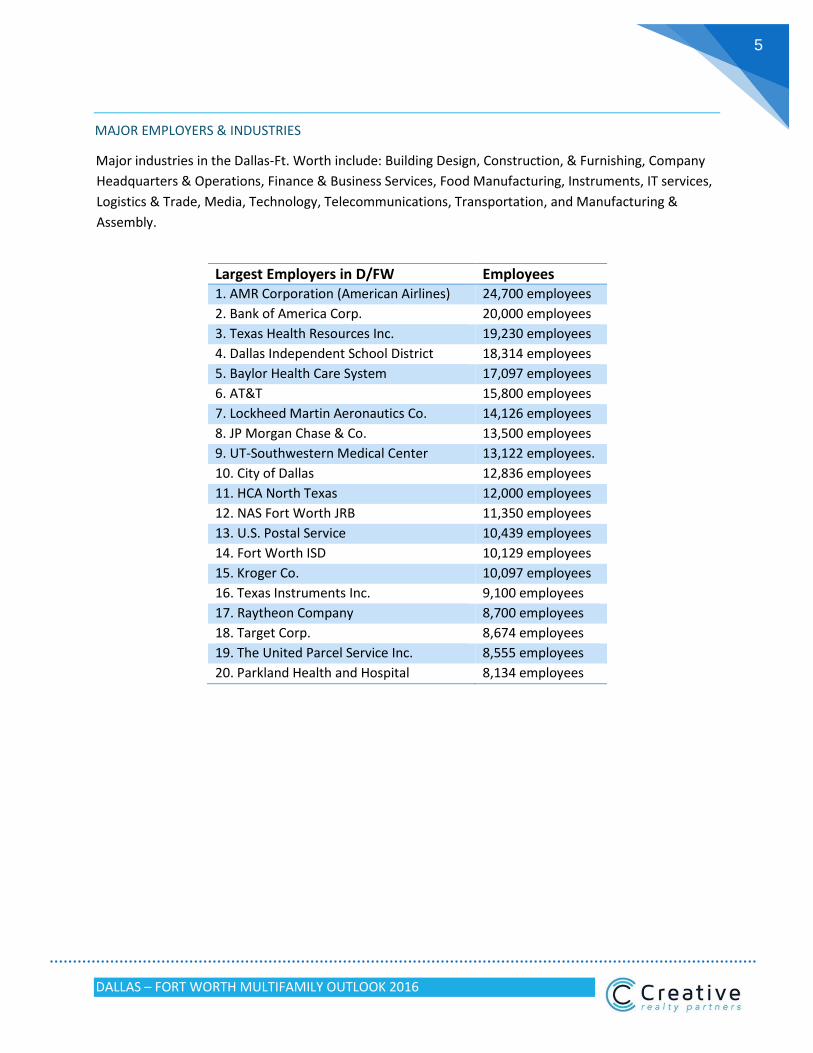
MAJOR EMPLOYERS & INDUSTRIES
Major industries in the Dallas-Ft. Worth include: Building Design, Construction, & Furnishing, Company
Headquarters & Operations, Finance & Business Services, Food Manufacturing, Instruments, IT services,
Logistics & Trade, Media, Technology, Telecommunications, Transportation, and Manufacturing &
Assembly.
Largest Employers in D/FW Employees 1. AMR Corporation (American Airlines) 24,700 employees
2. Bank of America Corp. 20,000 employees
3. Texas Health Resources Inc. 19,230 employees
4. Dallas Independent School District 18,314 employees
5. Baylor Health Care System 17,097 employees
6. AT&T 15,800 employees
7. Lockheed Martin Aeronautics Co. 14,126 employees
8. JP Morgan Chase & Co. 13,500 employees
9. UT-Southwestern Medical Center 13,122 employees.
10. City of Dallas 12,836 employees
11. HCA North Texas 12,000 employees
12. NAS Fort Worth JRB 11,350 employees
13. U.S. Postal Service 10,439 employees
14. Fort Worth ISD 10,129 employees
15. Kroger Co. 10,097 employees
16. Texas Instruments Inc. 9,100 employees
17. Raytheon Company 8,700 employees
18. Target Corp. 8,674 employees
19. The United Parcel Service Inc. 8,555 employees
20. Parkland Health and Hospital 8,134 employees

DALLAS – FORT WORTH MULTIFAMILY OUTLOOK 2016
6
List of Fortune 500 Companies in Dallas/Ft. Worth Metro Area
Ranking Name Location
2 Exxon Mobil Irving
10 AT&T Dallas
65 Energy Transfer Equity Dallas
67 American Airlines Ft Worth
140 Tenet Healthcare Dallas
142 Southwest Airlines Dallas
151 Kimberly Clark Irving
155 Fluor Corporation Irving
214 HollyFrontier Dallas
219 Texas Instruments Dallas
228 J.C. Penney Plano
260 D.R. Horton Ft Worth
302 GameStop Grapevine
336 Dean Foods Dallas
404 Alliance Data Systems Plano
407 Trinity Industries Dallas
413 Dr. Pepper Snapple Group Plano
417 Commercial Metals Irving
453 Celanese Dallas
475 Energy Future Holdings Dallas
DALLAS – FORT WORTH MULTIFAMILY OUTLOOK 2016
7
POPULATION TRENDS
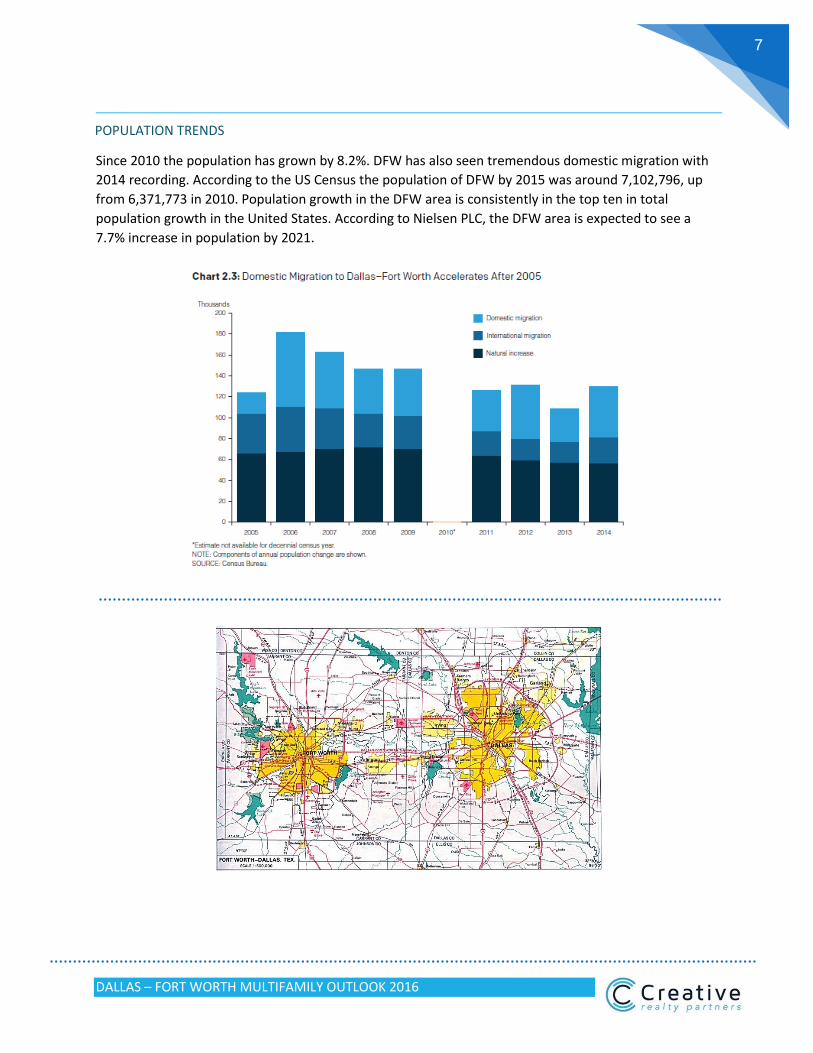
Since 2010 the population has grown by 8.2%. DFW has also seen tremendous domestic migration with
2014 recording. According to the US Census the population of DFW by 2015 was around 7,102,796, up
from 6,371,773 in 2010. Population growth in the DFW area is consistently in the top ten in total
population growth in the United States. According to Nielsen PLC, the DFW area is expected to see a
7.7% increase in population by 2021.
DALLAS – FORT WORTH MULTIFAMILY OUTLOOK 2016
8
LOCAL MULTIFAMILY TRENDS
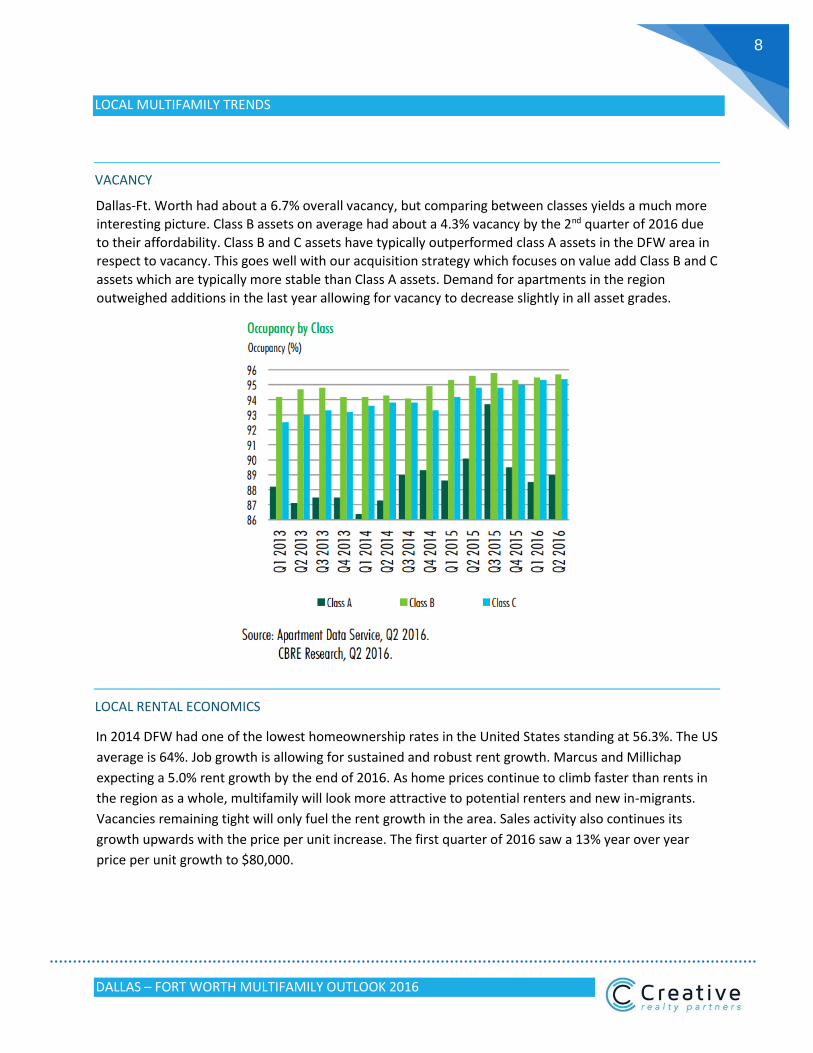
VACANCY
Dallas-Ft. Worth had about a 6.7% overall vacancy, but comparing between classes yields a much more interesting picture. Class B assets on average had about a 4.3% vacancy by the 2nd quarter of 2016 due
to their affordability. Class B and C assets have typically outperformed class A assets in the DFW area in respect to vacancy. This goes well with our acquisition strategy which focuses on value add Class B and C
assets which are typically more stable than Class A assets. Demand for apartments in the region
outweighed additions in the last year allowing for vacancy to decrease slightly in all asset grades.
LOCAL RENTAL ECONOMICS
In 2014 DFW had one of the lowest homeownership rates in the United States standing at 56.3%. The US
average is 64%. Job growth is allowing for sustained and robust rent growth. Marcus and Millichap
expecting a 5.0% rent growth by the end of 2016. As home prices continue to climb faster than rents in
the region as a whole, multifamily will look more attractive to potential renters and new in-migrants.
Vacancies remaining tight will only fuel the rent growth in the area. Sales activity also continues its
growth upwards with the price per unit increase. The first quarter of 2016 saw a 13% year over year
price per unit growth to $80,000.
DALLAS – FORT WORTH MULTIFAMILY OUTLOOK 2016
9
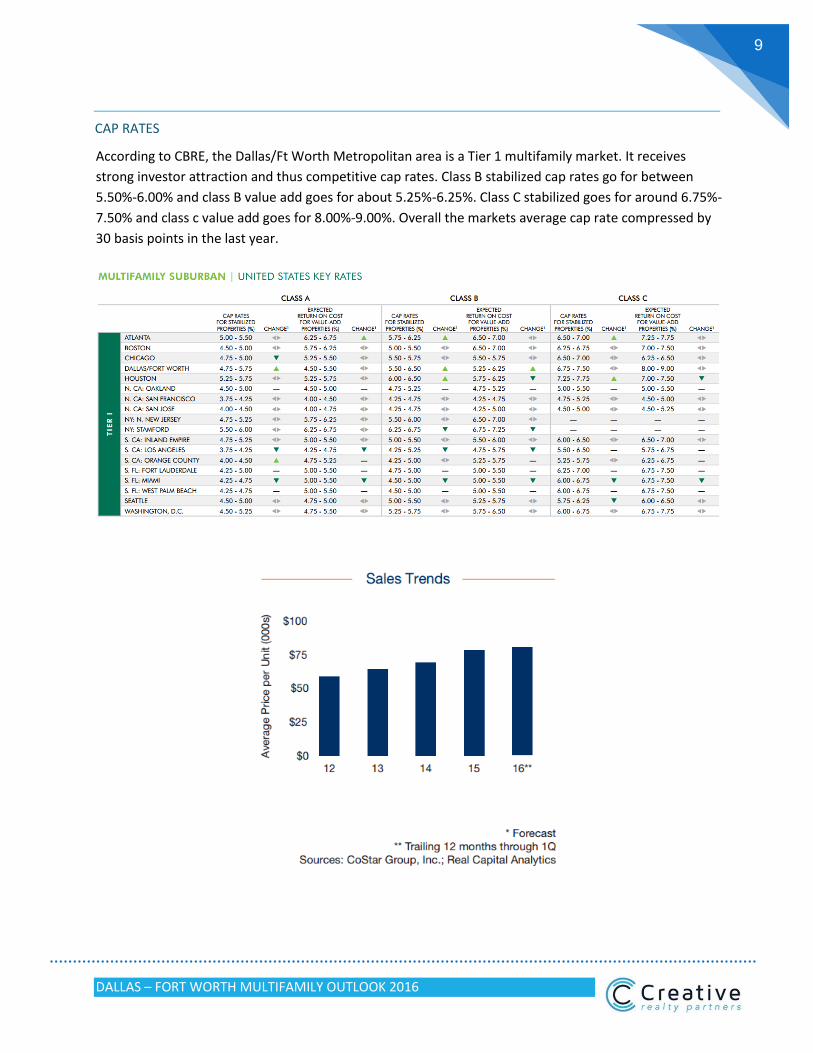
CAP RATES
According to CBRE, the Dallas/Ft Worth Metropolitan area is a Tier 1 multifamily market. It receives
strong investor attraction and thus competitive cap rates. Class B stabilized cap rates go for between
5.50%-6.00% and class B value add goes for about 5.25%-6.25%. Class C stabilized goes for around 6.75%-
7.50% and class c value add goes for 8.00%-9.00%. Overall the markets average cap rate compressed by
30 basis points in the last year.

DALLAS – FORT WORTH MULTIFAMILY OUTLOOK 2016
10
HIGHLIGHTS
CONTACT
Maurice Benitah
President
310-786-8100 [email protected]
Jonathan Benitah
Senior Vice President
424-284-4132 [email protected]
Roxana Vaziri
Analyst
424-284-4131 [email protected]
Chris Hasbun
Acquisitions Analyst
424-284-4135 [email protected]
Gina Evans
Transaction Coordinator
424-284-4133 [email protected]
Top Related