


Languages
Pages
Legal

White Paper
Customer Experience Optimization in
Wireless Networks
CelPlan International, Inc.
February 2014
©2014 CelPlan International, Inc., 1920 Association Drive, 4th
Floor, Reston, Virginia, 20191, USA
+1 (703) 259-4020 / +1 (703) 476-8964 / [email protected] 2
Customer Experience Optimization in Wireless Networks
CelPlan International, Inc.
February 2014
Wireless networks are getting more and more complex, mixing 2G, 3G and 4G technologies in different bands, and
carrying voice and data simultaneously.
Revenues are not following the increase in throughput per user, obliging operators to squeeze as much as possible
from existing networks.
Existing optimization methods do not provide results that express the actual customer experience; neither do they
fully optimize the network. They in general provide a regional temporary fix, but create issues in other parts of the
network, thereby resulting in an infinite effort to optimize the network.
Besides, the different optimization techniques generate conflicting solutions, which interfere with each other,
mainly when they are applied by different departments within the operator’s organization (RAN x OSS x
Engineering).
Operators end up in a constant optimization cycle while spending fortunes in OPEX and CAPEX.
A proper optimization should keep the network stable for large periods, of at least several months. New
optimizations should only be required when the network undergoes changes or expansions.
Several vendors provide network optimization solutions, which rely on a combination of 5 basic methodologies
described below.
It is essential to understand the benefits and shortcomings of each optimization method, so we can utilize them
properly.
1. Main Optimization methods used today The main optimization methods are presented below in an approximate introduction chronological order.
1. Path Loss Prediction, Automatic Frequency Planning (AFP) and Automatic Cell Planning (ACP)
2. Field Drive Test using scanners and call placement equipment
3. User device measurement collection
4. OSS KPI statistics
5. Heuristic data analysis
1.1- Path Loss Prediction, Automatic Frequency Planning (AFP) and Automatic Cell Planning (ACP)
1.1-1. Path Loss Analysis
Path loss analysis was the first method used to analyze network performance, but its use fell out of favor
as the results did not match reality as the density of the networks increased. The main reasons for it were:
Propagation models were based on the model developed by Yoshihisa Okumura in 1968, which was
developed for single cell and mobile radio. Several variations of this model were used by vendors under
different names
©2014 CelPlan International, Inc., 1920 Association Drive, 4th
Floor, Reston, Virginia, 20191, USA
+1 (703) 259-4020 / +1 (703) 476-8964 / [email protected] 3
Masaharu Hata in 1981 developed a computational method for the Okomura model but did not improve
it.
Vendors proposed other empirical and semi-empirical models to compensate for the limitations of the
Okomura-Hata (OH) model, but all of them presented limitations and this explains the longevity of the OH
model.
When conventional approaches failed Ray Tracing based methods were developed to better calculate
path loss, but they relied on morphological databases could not be rich enough to reflect what was
happening in real life. The performance of ray tracing methods was similar to the best available models
but with much larger computational requirements.
A usable path loss model had to consider the following aspects:
Consider the different propagation mechanisms applied to all the morphologies in the path: free
space, over morphology, through morphology, diffraction and reflection
Consider different parameters for each morphology
Consider the propagation in a 3D geometry, which can be approximated by the propagation in a
horizontal and in a vertical plane.
Calculate the propagation outdoor and indoor on the same path
Mainly consider that the path loss represents an average value for 50% of the time and 50% of
the area and that the real propagation will have a statistical distribution over it
CelPlan developed the Korowajczuk 3D model (2010) that fulfills all this features and is starting to be used
only recently.
The main tool providers are1: Infovista’s Mentum, Forsk’s Atol, TEOCO’s Aircom, ATDI’s ICS, EDX’s Signal
Pro and CelPlan’s CellDesigner™
1.1-2. Automatic Frequency Planning (AFP)
The need of planning frequencies came as soon as the networks expanded above few tenths of sites. This
planning relied on a relationship matrix between radios. These matrixes used empirical set of weights,
without a physical connotation. This worked for a while but failed when the network cells density
increased. It is still a method used today, but it requires many adjustments and is one of the culprits of
the never ending optimization.
An AFP to be efficient has to use physical parameter for the relationship matrix to be consistent. CelPlan
has developed a sophisticated methodology based on the statistics of path loss distribution and customer
experience availability, which is described later in this paper.
Additionally, the need to extract the maximum capacity from each cell requires the use of a fractional
AFP, also developed and patented by CelPlan.
The main tool providers are1 AMDOC’s ACTIX/Comopt, TEOCO’s Schema, CelPlan’s CelOptima, Ericsson’s
Optimi, Nokia’s Iris, InfoVista’s Aexio, JDSU’s Dyaptive, besides all the path loss tools listed above
implemented their own variations or adopted someone else’s solutions.
1 The company, product and service names used in this white paper are for identification purposes only. All trademarks and registered trademarks are the property of their respective owners. The companies listed are the ones we identified to the best of our knowledge, precise capabilities should be obtained from the companies themselves. The list may not be complete.
©2014 CelPlan International, Inc., 1920 Association Drive, 4th
Floor, Reston, Virginia, 20191, USA
+1 (703) 259-4020 / +1 (703) 476-8964 / [email protected] 4
1.1-3. Automatic Cell Planning (ACP)
In the quest of increasing network capacity engineers found that they need to control interference, and
this could be achieved by controlling the cell footprint. A footprint enhancement procedure resulted in
less interference while maintaining enough overlap for handovers.
An ACP algorithm to be efficient has to consider the statistical path loss variation as well as traffic
distribution. Instead, vendors decided to use arbitrary weights based mainly on coverage. This limited the
efficiency of the ACP technique.
Later on ACP based techniques were used to locate new sites.
CelPlan addressed the ACP issues by using geographically spread traffic and considering the statistics of
path loss.
The main tool providers are1: JDSU’s Arieso, TEOCO’s Symena, CelPlan’s CelEnhancer, besides all the path
loss tools listed above implemented their own variations or adopted someone else’s solutions.
1.2- Field Drive Test using scanners and call placement equipment
Operators found that the planning techniques commonly used were not precise enough, so they resorted
to field measurements to collect data about the network performance.
This worked well in the beginning when the networks were small and single service. As the network
complexity grew this technique became inefficient providing inconsistent information. Although it is still
the most common technique used to optimize networks by vendors and operators, it is one of the reasons
that networks are never optimized and measurements have to be done continuously in an effort to one
day reach stability.
Field Drive Tests can be classified in two categories:
Measuring Received Signal Strength Intensity (RSSI) and Signal to Noise Ratio (SNR)
Perform call placement and analyze performance, mainly call drops, handovers and file transfers
and eventually call quality
o Field Drive Tests are man power intensive and fail to represent the network
performance for the following reasons.
They lack statistical validity, as an interferer may not be present during the moments the
measurement is made at a location or be present but not statistically significant. The
measurement results will imply in actions that address one occurrence in detriment to many
others.
They are collected at different times over the network (sometimes over a period of a whole day
and even night). This leads to analysis outside the network busy hours.
They are collected in general at ground level outdoors, while the majority of connections today
are coming from indoors and the most interfered connections are the ones made at higher
levels. Even when walkthroughs are made indoors, the number of samples is insignificant when
compared to outdoor measurements.
In summary Field Drive Tests are statistically invalid as they address some occurrences at time of
measurement in detriment of others that may be statistically more representative. The effect of changes

©2014 CelPlan International, Inc., 1920 Association Drive, 4th
Floor, Reston, Virginia, 20191, USA
+1 (703) 259-4020 / +1 (703) 476-8964 / [email protected] 5
made by analyzing the measurements cannot be determined without additional measurements, which
will be done at a different moment in time and consequently not correlated.
The main tool providers are1: Ascom’s TEMS/Comarco, Anite’s Nemo, JDSU’s CellAdviser, R&S’s ROMES,
and other.
1.3- Probes measurement collection
To address the statistical significance of Field Drive Tests a solution using distributed measuring probes
was envisaged. These probes are distributed along the network and collect data for whole periods.
This approach solves the time representativeness of the measurements, but has a limited geographical
representation, even when thousands of probes are deployed. Besides, probes are static and do not
represent the traffic mobility in a real network.
The main tool providers are1: TEOCO and other
1.4- User device measurement collection
Another approach to solve the statistical significance of Field Drive Tests is to collect measures made by
the user devices. This approach can rely on regular measurements sent by the user to eNB or use
applications installed on user devices.
Contrary to Field Drive Test equipment that has sophisticated electronics to do measurements, user
devices have a limited measurement capability and the 3GPP allows for an error of ± 8 dB in signal
strength measurements.
Another issue is that the location of the user device is not known. Some vendors have developed
sophisticated algorithms to estimate the user location. In some cases the location can be estimated in
others gross errors are made. There is no information if the user is indoor or outdoor and an error of few
meters can place an indoor user outdoor and vice versa. User height is even harder to determine and this
is important information to evaluate the network.
This method provides useful information, but it has to be taken with a grain of salt.
The main tool providers are1: CelCite, TEOCO and other
1.5- OSS KPI statistics
Some vendors decided to resort to statistics provided by the eNB and OSS. These statistics are not
specified by 3GPP and rely on equipment vendor implementations. Vendors are not very keen in providing
their algorithms, so generally whoever is analyzing the statistics is kept partially in the dark.
KPIs provide performance averages on a timely basis, but lack location information. This again is valuable
information but does not provide the whole picture, it just can inform that a cell has an issue, but gives
little information on why and where.
The main tool providers are1: CelCite, ACTIX and other
©2014 CelPlan International, Inc., 1920 Association Drive, 4th
Floor, Reston, Virginia, 20191, USA
+1 (703) 259-4020 / +1 (703) 476-8964 / [email protected] 6
1.6- Heuristic data analysis
The amount of data that can be collected by the above methods is huge and when the expected results
were not achieved due to lack of statistical significance of the data collected, operators decide to increase
the amount of data collected in an effort to improve its statistical significance.
Field drive testing became a daily activity; probes and user collected data came on truck loads and to top
all of this come the KPIs. Engineers could not process all this data, so a quest for tools that could analyze
the data was initiated.
Heuristic algorithms were developed that would amass all these data in an effort to extract useful
information about how to fix the network.
What was missed is that all those sources were giving imprecise and conflicting information, so making
sense from it became a useless effort that could provide results that would improve some areas and ruin
others.
Besides, heuristic algorithms have to be tailored for each situation and for it they need have a common
denominator that will provide them with a base over which to work from.
The main tool providers are1: TEOCO, AMDOCS and other
2. Why Operators are experiencing not satisfied customers? Each of the above methods is valuable if the data collected is understood in terms of useful information and its
limitations. Data should be collected in the statistically correct amounts. Excess data is as bad as too little data.
Another shortcoming of the collected data is its inability of predicting the consequences of each change and its
inability of correlating it to the customer’s experience.
Operators are today in a continuous optimization efforts, but customers experience is still not very good and this
results in complaints and churn.
Due to the huge amount of data being collected, operators have resorted to do regional optimizations. This solves
issues in one area, by moving them to adjacent areas.
There is also a limit on what can be done with the hardware deployed. This is not perceived by the existing
optimization methods and the operator goes into a continuous optimization loop.
Customers are agnostic in terms of technology or hardware deployed, so they get even more annoyed when they
get good service on day and bad another.
3. What is the solution to fix the wireless networks? What is missing is a methodology that could represent the network in terms of customer experience and could
predict its performance as well as its evolution. The collected measurements can then complete the picture against
this backdrop.
For this to happen we require a metric to expresses customer experience.
In a static environment Signal to Noise + Interference Ratio (S/(N+I) can be related to the customer experience for
each modulation scheme and hybrid backward error correction method used.

©2014 CelPlan International, Inc., 1920 Association Drive, 4th
Floor, Reston, Virginia, 20191, USA
+1 (703) 259-4020 / +1 (703) 476-8964 / [email protected] 7
Required SNR
% area= % of time
Frequency
of occurance
Signal Level
It happens that (S/(N+I) varies over time according to its statistical distribution. This statistical variable can be
represented by its Availability, which can be represented as a percentage of time or a percentage of traffic.
Contrary to (S/(N+I) average values, availability values can be added statistically and represent a relationship
between two signals, the availability of a location, of a cell or of an entire network.
CelPlan has developed an extensive statistical methodology to calculate traffic based availability. This metric is
ideal to be used in AFP, ACP and performance predictions. Differently of the arbitrary weight methods traditionally
used, availability is a physical metric that does have real life connotations.
CelPlan calculates the signal availability based on the 3D geographic traffic distribution as illustrated below. This
methodology can be summarized as follows:
Cell coverage is assessed in two areas: primary areas where the cell is the best server and secondary areas
where the cell is a server. This is illustrated in the figure below.

©2014 CelPlan International, Inc., 1920 Association Drive, 4th
Floor, Reston, Virginia, 20191, USA
+1 (703) 259-4020 / +1 (703) 476-8964 / [email protected] 8
The next figures illustrate interference cases for the downlink and uplink. It can be readily conclude that
the strength of the interference depends not only on the user location but also on the user location in the
interfering cell and the duration of the interference depends on the traffic load in the interfering cell and
the traffic of the interfered user. CelPlan considers all this factors and calculates the availability of a
certain SNIR for every prediction pixel in the network..
This availability can then be accumulated to express the relationship between cells. This accumulation is
done by cell region, according to Dynamic Resource Reuse Scheme proposed in the companion White
Paper from CelPlan: “The role of Planning and Optimization tools in SON ICIC”. Although oriented towards
SON, this paper describes the importance of dividing a cell in interference regions to increase cell
capacity.
The data is stored in several matrixes which is then used during the optimization process
CelPlan has developed powerful optimization algorithms, based on simulated annealing and its own
method.
The Master Plan is then generated, which can be used as the resource allocation plan or as a basis for
SON ICIC operation.
The advantage of this methodology is that it can also be used to express the network performance in terms of
customer satisfaction at a pixel, cell and network basis.
©2014 CelPlan International, Inc., 1920 Association Drive, 4th
Floor, Reston, Virginia, 20191, USA
+1 (703) 259-4020 / +1 (703) 476-8964 / [email protected] 9
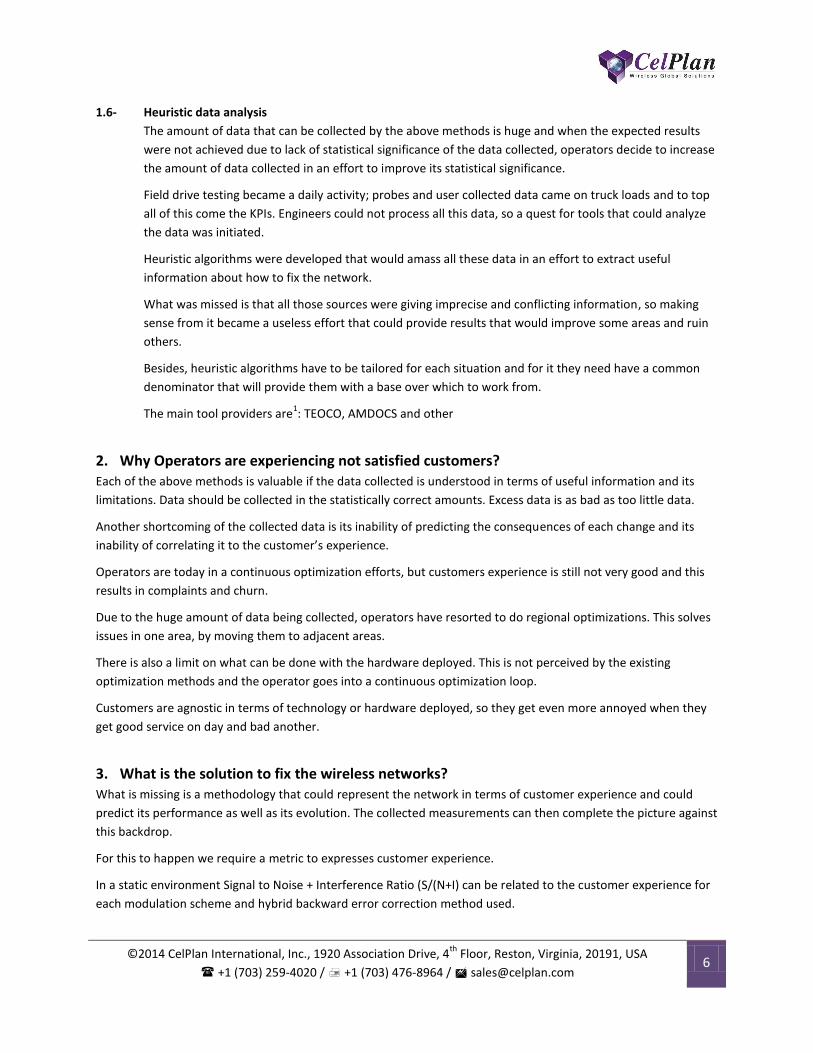
4. What are the steps required to implement a proper optimization? This methodology requires that the network be correctly represented and the following data bases have to be
prepared:
Geographical data base of terrain, with morphology heights.
Definition of user service classes that share the same devices and have a similar traffic demand
0
100000
200000
300000
400000
500000
600000
1:0
0
2:0
0
3:0
0
4:0
0
5:0
0
6:0
0
7:0
0
8:0
0
9:0
0
10
:00
11
:00
12
:00
13
:00
14
:00
15
:00
16
:00
17
:00
18
:00
19
:00
20
:00
21
:00
22
:00
23
:00
0:0
0
Tonnage per hour per day of week (KB)
Monday
Tuesday
Wednesday
Thursday
Friday
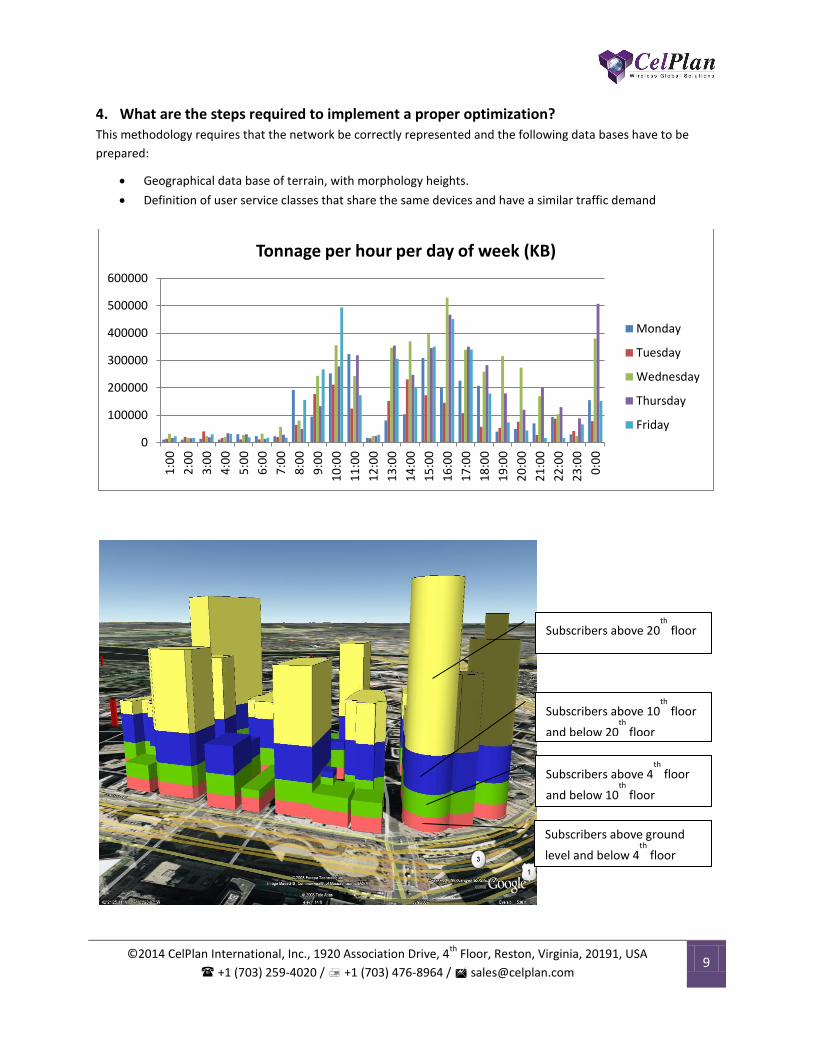
Subscribers above 20th
floor
Subscribers above 10th
floor
and below 20th
floor
Subscribers above 4th
floor
and below 10th
floor
Subscribers above ground
level and below 4th
floor

©2014 CelPlan International, Inc., 1920 Association Drive, 4th
Floor, Reston, Virginia, 20191, USA
+1 (703) 259-4020 / +1 (703) 476-8964 / [email protected] 10
Geographical user distribution that allows for the calculation of a geographical traffic demand for different
hours of the day
Subscriber Outdoor 1.5 m
Subscribers Outdoor 10.5 m
Subscribers Indoor 1.5 m
Subscribers in Marinas and Beaches
0.00
5.00
10.00
15.00
20.00
25.00
0 2 4 6 8 10 12 14 16 18 20 22 24
Traf
fic
pe
r h
ou
r in
MiB
Hour of day
Residential Traffic per average subscriber
Downlink
Uplink
©2014 CelPlan International, Inc., 1920 Association Drive, 4th
Floor, Reston, Virginia, 20191, USA
+1 (703) 259-4020 / +1 (703) 476-8964 / [email protected] 11
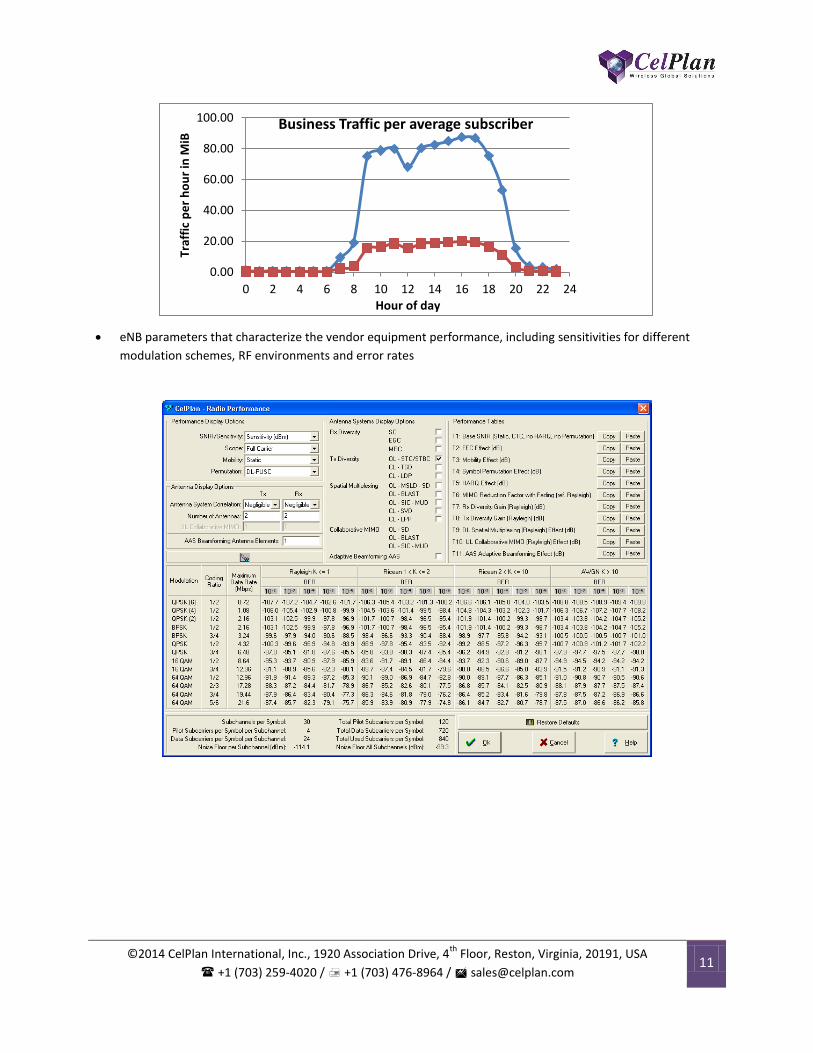
eNB parameters that characterize the vendor equipment performance, including sensitivities for different
modulation schemes, RF environments and error rates
0.00
20.00
40.00
60.00
80.00
100.00
0 2 4 6 8 10 12 14 16 18 20 22 24
Traf
fic
pe
r h
ou
r in
MiB
Hour of day
Business Traffic per average subscriber
MARKET MODELLING
©2014 CelPlan International, Inc., 1920 Association Drive, 4th
Floor, Reston, Virginia, 20191, USA
+1 (703) 259-4020 / +1 (703) 476-8964 / [email protected] 12
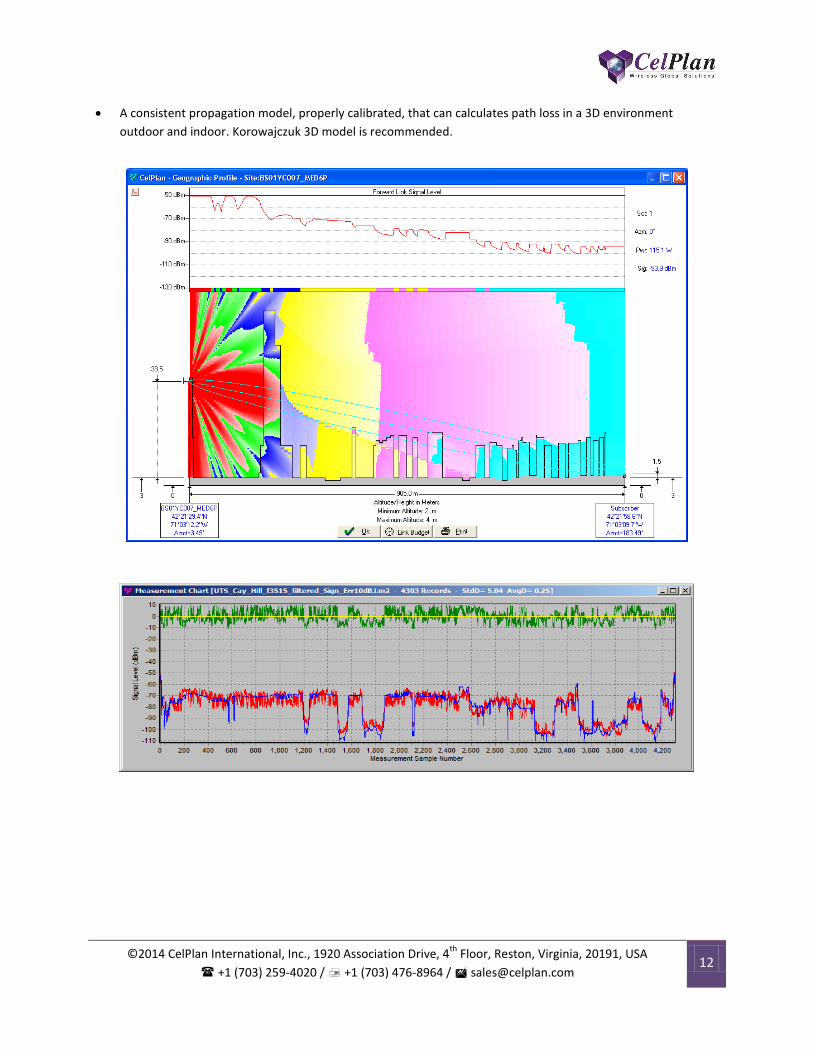
A consistent propagation model, properly calibrated, that can calculates path loss in a 3D environment
outdoor and indoor. Korowajczuk 3D model is recommended.

©2014 CelPlan International, Inc., 1920 Association Drive, 4th
Floor, Reston, Virginia, 20191, USA
+1 (703) 259-4020 / +1 (703) 476-8964 / [email protected] 13
A geographic representation of the RF environment that adds statistical variation to the average path loss
RF variation in frequency and time, multipath spread and antenna correlation, which are required for the
implementation of 4G technologies and MIMO connections. These parameters are exclusively provided by
CelPlan’s CellSpectrum
The effort to build this information is large initially, but after that it requires only a periodic maintenance.
The reward is the possibility of predicting the network performance and its evolution. The effect of any action on
the network can be evaluated before its deployment.
The different network measurement procedures discussed previously can then be compared to the predictions and
divergences can be analyzed against the prediction background.
This methodology is implemented in CelPlan’s CellDesigner and it allows for long lasting network optimization
procedures and at the same reducing CAPEX and OPEX.
Come and visit us at the Mobile World Congress at stand 5140.
Top Related