
![Index [gkboptic.com]gkboptic.com/images/brochure.pdfIndex STOCK LENSES PHOTOCHROMIC LENSES IMPRINT SERIES Imprint 2.0 Imprint Neo (Silver) Imprint HD (Gold) Imprint Individual (Platinum)](https://static.fdocuments.us/doc/165x107/5fd4a0b84618f23b9c177e36/index-index-stock-lenses-photochromic-lenses-imprint-series-imprint-20-imprint.jpg)


Languages
Pages
Legal


CURRENT TRENDS IN APPRENTICESHIP AND TRAINEESHIP TRAINING IN NEW SOUTH WALES

2
(Imprint page inside front cover)
© NSW Board of Vocational Education and Training
Level 3, 35 Bridge Street
(GPO Box 33)
Sydney NSW 2000
Telephone: (02) 9561 1500
Facsimile: (02) 9561 1499
ISBN 0 7310 7952 3
Additional copies of this publication can be obtained by contacting the Board secretariat
at the above address or by accessing the Boards Internet website
(www.bvet.nsw.gov.au).
Disclaimer: All rights reserved. Although the work is copyright, permission is granted to
teachers or trainers to make photocopies or other duplication for use within their own
agencies or in workplace training settings for educational purposes. The views expressed
in this work are not necessarily those of the Board of Vocational Education and Training
nor do they represent the policies of either the Board or the NSW Department of
Education and Training.

3
Phillip Toner and Nic Croce
Employment Studies Centre, University of Newcastle
and
Richard Pickersgill and Kristin Van Barneveld
Australian Centre for Industrial Relations Research
and Training, University of Sydney
December 2001
Final report of the Board-commissioned research project Current Trends in
Apprenticeship and Traineeship Training in New South Wales

CONTENTS
I EXECUTIVE SUMMARY ......................................................................................... 4
Purpose of the project .................................................................................................. 4
Research undertaken .................................................................................................... 4
Key findings on apprenticeship trends ......................................................................... 4
Recommendations to improve apprenticeship training rates ......................................... 5
Key findings on traineeship trends ............................................................................... 5
Recommendations for improving the traineeship system .............................................. 5
II INTRODUCTION ....................................................................................................... 6
III ANALYSIS AND DISCUSSION OF TRENDS ......................................................... 7
Data Collection ............................................................................................................ 7
Data Sources ............................................................................................................ 7
Deficiencies in the Data ........................................................................................... 7
Trends in NSW Apprenticeships ................................................................................ 11
Apprentice Approvals ............................................................................................ 11
Apprentice approvals by trade fields ...................................................................... 12
Changes in the Long-term Composition of Apprenticeship Approvals ................... 18
Public and Private Sector Apprenticeship Approvals .............................................. 19
Group Training Companies .................................................................................... 20
Apprenticeship Completions .................................................................................. 20
An overview of Apprentices-In-Training and Apprentice Training Rates ............... 22
Total Apprentices In-Training ................................................................................ 23
Apprentice Training Rates ..................................................................................... 28
Training rates by Trade .......................................................................................... 29
Apprenticeships In-Training and Gender................................................................ 34
Distribution of Apprentices by Region ................................................................... 35
Traineeships .......................................................................................................... 37
Traineeships by Occupation ................................................................................... 38
Traineeship skill levels .......................................................................................... 38
Public and Private Sector Traineeship Approvals ................................................... 40
Traineeship Completions ....................................................................................... 41
Traineeship completions and completion rates classified by the Australian Standard
Classification of Occupations................................................................................. 42
IV SURVEY FINDINGS .............................................................................................. 44
Consultations With Stakeholders ............................................................................... 44
Mail Survey of Apprentices and Trainees .................................................................. 45
Employers’ Survey .................................................................................................... 47
V LITERATURE REVIEW AND DISCUSSION OF ISSUES ...................................... 50
Low Apprenticeship Commencement Rates ............................................................... 50
Explanations offered for declining apprenticeship rates.......................................... 50
Criticisms of the Supply Side of Vocational and Education Training ..................... 51
Discussion of the criticisms of the supply side of vocational education and training
.............................................................................................................................. 52
Demand-side Explanations of declining apprentice numbers .................................. 56
Vocational Skills Shortages ....................................................................................... 66

2
Evidence of skill shortages .................................................................................... 66
Evidence of skill shortages in apprentice and trade fields ....................................... 66
Skill shortages as an outcome of a market-based training system ........................... 67
Need for system to meet broader skill needs .......................................................... 67
Traineeship concentration in lower-skill occupations ............................................. 68
Decline in middle-skill occupations ....................................................................... 68
Targeting some traineeships to higher skill occupations ......................................... 69
Overall discussion of vocational skill shortages ..................................................... 69
Overall conclusion/recommendation on vocational skill shortages ......................... 69
Traineeship Non-Completion Rates ........................................................................... 70
High rates of traineeship non-completion ............................................................... 70
Trainee non-completion rates compared with those of apprentices ......................... 70
Determinants of traineeship non-completion .......................................................... 70
Measures to improve completion rates ................................................................... 71
Traineeship Target Groups and Objectives ................................................................ 71
Increase in participation rate of older trainees ........................................................ 71
Need to define target group and role of traineeships ............................................... 71
Training Quality ........................................................................................................ 72
Effect of employer subsidies on quality of training ................................................ 72
Inadequate monitoring of activities of New Apprenticeship Centres and Registered
Training Organisations .......................................................................................... 72
Poorer quality of fully on-the-job-training ............................................................. 72
Employers not aware of all training options available ............................................ 73
Training quality as a factor in voluntary non-completions ...................................... 73
Monitoring of training quality ................................................................................ 73
possible quality dilution of certain Australian Qualifications Framework standards ... 73
Preponderance of AQF III and IV courses.............................................................. 74
Low skill occupation/High skill level qualification ................................................ 74
Probable dilution of qualification standards ........................................................... 74
Effect on articulation and market signals to students .............................................. 75
Possible distortion by financial incentives for training ........................................... 75
VI FINDINGS AND RECOMMENDATIONS ............................................................ 76
Trends in Apprenticeship Approvals .......................................................................... 76
Declining Apprentice Training Rates ......................................................................... 77
Causes of the Decline in Apprentice Intake ................................................................ 77
Corporatisation and privatisation of public sector activities .................................... 77
Growth of labour-hire and outsourcing of trades work ........................................... 78
Reduction in firm size ............................................................................................ 78
Growth of casual and part-time employment .......................................................... 78
Labour and training market deregulation ................................................................ 79
Declining quality of applicants .............................................................................. 79
Trade Skill Shortages................................................................................................. 79
Recommendations to Improve Apprentice Training Rates ......................................... 80
Enforcement of current policies ............................................................................. 80
Changes to government financial incentives........................................................... 80
Re-introduce pre-apprenticeships ........................................................................... 80

3
Increased role for Group Training Companies ........................................................ 81
Improve the image of the trades ............................................................................. 81
Trends in Traineeship Approvals ............................................................................... 81
Concerns About the traineeship system ...................................................................... 82
Low skill levels of traineeships .............................................................................. 82
Quality of training ................................................................................................. 83
Low completion rates ............................................................................................ 83
Recommendations to Improve the Traineeship System .............................................. 83
Review low-skill traineeship vocations .................................................................. 83
Address traineeship non-completion ...................................................................... 84
Clearer definition of the role and target groups of traineeships ............................... 84
VII REFERENCES ....................................................................................................... 86
VIII APPENDIX - TABLES ......................................................................................... 91

4
I EXECUTIVE SUMMARY
PURPOSE OF THE PROJECT
This is an edited version of a report on research commissioned by the NSW Board of
Vocational Education and Training on current trends in apprenticeship and traineeship
training in New South Wales.
The purpose of the project was to analyse trends in NSW apprenticeship and traineeship
training and develop recommendations for improvement in this training, with reference to
access, participation and completion rates, the quality and flexibility of training, and the
meeting of skill shortages.
RESEARCH UNDERTAKEN
Research undertaken to fulfil the brief included:
Collection and analysis of primary data sources on apprenticeship and traineeship
training in NSW and Australia
Three large-scale surveys, of
- 130 key vocational education and training (VET) stakeholders in the NSW
public and private sectors, by interview
- 3 000 apprentices and trainees, by mail
- 500 employers, by telephone
Review of existing research on issues raised.
KEY FINDINGS ON APPRENTICESHIP TRENDS
In respect of apprenticeships, the report’s key findings are:
Declining overall apprenticeship approvals in the 1990s, with
Declines in the share of traditional trade fields such as the electrical, metal and
automotive sectors
An increase in the share of construction apprenticeships, due to a decline in
overall approval numbers
Growth in the shares of food trade apprentice approvals and stability in
hairdressing and agriculture/horticulture apprenticeship approvals
Declining rates of apprentice training.
Likely causes of the decline include:
- Corporatisation and privatisation of public sector activities
- Growth of labour hire and increased outsourcing to labour hire companies
of trades, maintenance and construction activity by the public and private
sectors
- Reduction in firm size
- Growth of casual and part-time employment
- Labour and training market deregulation
It was difficult to find evidence of a decline in the quality of applicants.
5
RECOMMENDATIONS TO IMPROVE APPRENTICESHIP TRAINING RATES
On the basis of the trends observed, information provided by the surveys of stakeholders
and consideration of other research on the issues, the following recommendations have
been made to improve apprenticeship training rates:
Enforcement of requirements in larger, longer-term government contracts for
ratios of apprentices to on-site tradespeople
Changes to Federal Government financial incentives for apprenticeships vis-à-vis
traineeships
Reintroduction of pre-apprenticeship courses
Increased role for Group Training Companies
Improvement of the image of the trades.
KEY FINDINGS ON TRAINEESHIP TRENDS
In respect of traineeships, the key findings of this report were:
Traineeship commencements increased by 420 percent from 1994-95 to 1998-99
The rapid growth reflects
- Financial incentives for the employment of trainees
- The active promotion of traineeships through New Apprenticeship Centres
- The concentration of traineeships in service industries such as retail,
transport, hospitality and communications, which have experienced rapid
growth
- The availability of fully on-the-job training delivery for trainees
- The extension of traineeships from new entrants to existing workers
- The possible partial substitution of traineeships for apprenticeships
Concerns about the concentration of traineeships in low-skill occupations
Concerns about the quality of training provided in traineeships
Concerns about low traineeship completion rates
Concern about possible dilution of Australian Qualification Framework standards
III and IV in low-skill occupational training.
RECOMMENDATIONS FOR IMPROVING THE TRAINEESHIP SYSTEM
The following recommendations have been made for improving the traineeship system:
A review of traineeships in low-skill vocations
Addressing traineeship non-completion
Clearer definition of the role and target groups of traineeships.

6
II INTRODUCTION
The NSW Board of Vocation Education and Training commissioned this research to
analyse trends in NSW apprenticeship and traineeship training and develop
recommendations for improvement in this training, with reference to access, participation
and completion rates, the quality and flexibility of training, and the meeting of skill
shortages.
To fulfil the brief, the following research was undertaken:
Collection and analysis of primary data sources on apprenticeship and traineeship
training in NSW and Australia
Three large-scale surveys, of
- 130 key vocational education and training (VET) stakeholders in the NSW
public and private sectors, by interview
- 3 000 apprentices and trainees, by mail
- 500 employers, by telephone
A review of existing research on issues raised.
Section III - Analysis and Discussion of Trends (page ) reports and discusses the
results of the research on the primary data.
Section IV – Survey Results (page ) summarises the findings of the surveys of
stakeholders, apprentices and trainees, and employers.
Section V – Literature Review and Discussion of Issues (page ) summarises discussion
in the literature on the key issues identified from the researchers’ analysis of trends in
apprenticeships and traineeships in New South Wales, issues raised in the literature and
the issues for research identified in the tender brief.
Section VI – Findings and Recommendations (page ) sets out the overall findings and
offers recommendations on possible policy responses for improving the apprenticeship
and traineeship systems.
Section VII – References cites the statistics and literature referred to in the report.
A number of tables referred to in the text are appended to the report.

7
III ANALYSIS AND DISCUSSION OF TRENDS
DATA COLLECTION
DATA SOURCES
To establish trends in apprenticeships and traineeships a number of data sources were
used:
the apprenticeship data base on the NSW Department of Education and Training’s
Integrated Vocational Education and Training System (IVETS) from 1985-86 to
1998-99. It covers Apprenticeship Commencements, Withdrawals/Cancellations and
Completions. This data was cross-classified by a number of variables such as
Australian Standard Classification of Occupation (ASCO), sector of employment
(public, private, Group Training Companies), field of study etc. Equivalent data was
provided for traineeships from 1991-92 to 1998-99
National Centre for Vocational Education Research data
early time series data from the former Federal Department of Employment,
Education and Training’s Annual Apprenticeship statistics.
DEFICIENCIES IN THE DATA
There are number of deficiencies in the data sets which present problems in describing
and analysing trends on a number of subjects of interest.
Difficulty in compiling time series for trades and for industries
From 1984-85 to 1991-92, ‘declared callings’ were aligned with a broad industry
classification, such as building, metal, electrical, food, furnishing (wood machining and
upholstery), printing, hairdressing and other. This classification was internally consistent,
in that close to 100 percent of declared callings related to a particular industry
classification were included in that classification. From 1992-93 to the present, declared
callings are aligned with NSW Industry Training Advisory Board (ITAB) coverage of
these trade occupations. Because several ITABs may have coverage of an industry, a
'similar' trade calling may be divided across a number of ITABs. This is the case for
example with 'Electrical Fitters' who are included in the Utilities and Electro Technology,
Building and Metal ITABs.
The break in the method of aligning trade callings and the changes in the allocation of
trade callings over time across ITABs makes it very difficult (and time intensive) to
develop a consistent time series on particular trades or industries. It should also be noted
that the industry coverage of NSW ITABs does not necessarily align with national ITABs
or indeed those in other states. This problem was resolved by requesting data from NSW
Department of Education and Training (DET) based on an aggregated occupational
classification (ASCO).

8
Difficulty of compiling time series for comparison of national and NSW data
A key objective of the research was to investigate the construction of a consistent time
series of comparative Australian and NSW apprenticeship and traineeship statistics. The
advantage of a time series extending over a period of one or two decades is that it enables
an analysis of trends in vocational education and training which abstracts, as much as is
possible, from the effects of short term business cycles. This enables an examination of
longer term structural relations and possible breaks in these structural relations.
However, there are also considerable difficulties in constructing such a time series. Prior
to 1994-95 and beginning in the late 1960s, the former Federal Department of
Employment, Education and Training (DEET) issued annual apprenticeship statistics
containing useful disaggregated Australian and state data. From 1994-95 the National
Centre for Vocational Education and Research (NCVER) was given responsibility for
compiling this and related data. From 1994-95 the Australian Vocational Educational
Training Management Information System (AVETMIS) was introduced nationally.
AVETMIS is a system of classification for the recording of vocational education and
training data.
Change of recording date of commencements for national data
The AVETMIS introduced a number of important changes in the recording of vocational
education and training data, which makes its data incompatible with the earlier DEET
data. The key difference is that, under AVETMIS, data relating to commencement of an
apprenticeship or traineeship is based on the ‘date of effect’ or actual date of
commencing the training. This data is recorded on a form sent from the employer to the
respective state training authority to establish an apprenticeship or traineeship.
The earlier DEET data for NSW and several other states were based on ‘date of
processing’ or the date on which the form sent from the employer was actually recorded
on the administrative system. Due to a combination of delays in processing by state
training authorities and tardiness on the part of employers in sending forms establishing
an apprenticeship or traineeship to training authorities, there could be delays of several
months or even longer between the date of effect and the date of processing. The different
systems for defining commencements give rise to substantial differences in annual totals
for commencements.
National database commencement figures are estimates subject to revision
Secondly, the earlier data based on date of processing was a ‘final’ figure and was not
retrospectively adjusted. The AVETMIS data, however, because it is based on date of
effect is retrospectively adjusted, as forms from employers are received sometimes many
months or even years after employment of the apprentice or trainee has actually
commenced. Accordingly, the NCVER issues a series of ‘preliminary’ figures for
commencements based on the cumulative receipt of forms from employers. This method
makes comparisons of the preliminary NCVER data with the DEET data problematic.
(Annual commencements based on date of processing can be adjusted by around 50-80
percent between one year and the next).

9
No separate apprenticeship data now kept nationally
Thirdly, from 1997-98 inclusive the NCVER has not separately identified apprenticeships
and traineeships. The rationale for this is that with ‘the introduction of New
Apprenticeships, the differences between apprenticeships and traineeship training are
being minimised’. Consequently, data on traineeships and apprenticeships ‘will not be
presented separately, as the historical distinction between them is no longer valid’
(NCVER 1998:8). This failure to separate traineeships and apprenticeships applies to
cumulative data for the period 1994-95 to 1996-97 received during and after 1997-98. In
other words, updated ‘preliminary’ data, for the period 1995-96 and 1996-97 have not
been separately classified to apprenticeships and traineeships.
The effect of these changes, notably the combined result of a shift to date of processing
and the failure to separate traineeships and apprenticeships, is to make the creation of a
systematic time series using both the older DEET and post 1994-95 NCVER data
difficult, if not impossible. In other words, since 1996-97 there is no reliable national data
base on the Australian apprenticeship system. This means that it is simply not possible to
accurately determine national trends with respect to skill formation in this key skilled
labour market. It follows therefore, that the task of comparing NSW and Australian
trends has been very difficult to fulfil.
However, it is possible to compare NSW DET data with the earlier DEET collection as
NSW continues to record and classify data consistent with the older system. (NSW also
provides ‘AVETMIS compliant’ data to NCVER).
Other anomalies eg inclusion of non-trade occupations in 3 years of national data
In addition, there are other anomalies with the NCVER data between 1994-95 and 1996-
97. NCVER data on apprenticeships cross-classified by the Australian Standard
Classification of Occupations (ASCO) includes a large number of entries outside the
‘trade occupations’. In 1994-95, for example, some 4 percent of all apprenticeship
commencements in NSW are classified to non-trade occupations such as managers, para-
professionals, and sales and personal service workers. Such anomalies are sufficiently
large to influence the interpretation of trends and therefore call into question the
reliability of the data.
Inadequate integration of NSW databases for on-the-job and off-the-job training data
The on-and off-the-job variable is relevant given the numerous studies indicating its
possible negative effect on both completion rates for traineeships and quality of training
provided. There are difficulties in accessing data on - and off-the-job training for
traineeships. The form for the registration of apprentices and trainees does not require
information on whether training is to be conducted on- or off-the-job. Consequently, the
unit record data does not contain this variable. The on-the-job training variable is

10
collected only on the database recording financial transactions and is not integrated with
the separate database recording training details.
These problems have been overcome in terms of the current research project, but only by
means of undertaking a one-off exercise. The problem of integration persists.
Consistency of sector classification
Information is available on the sector in which apprentices and trainees are employed.
‘Sectors’ include the private sector, public sector and Group Training Companies. The
classification of training data by sector is not consistent over time and some of the
classifications are not mutually exclusive. With respect to government agencies, it is not
clear on what basis data is classified to either the Government Business Enterprise or
State/Semi-Government categories. This is important, given the marked changes in the
role of the public sector as a direct employer of apprentices and trainees.

11
TRENDS IN NSW APPRENTICESHIPS
APPRENTICE APPROVALS
Figure 1 shows long-term movements in NSW apprenticeship annual approvals. The key
points are outlined below.
Figure 1
NSW Apprenticeship Original Applications
Approved 1985-86/1998-99
0
2000
4000
6000
8000
10000
12000
14000
16000
18000
20000
198
5-86
1986-
87
1987-
88
1988-
89
1989-
90
1990-
91
1991-
92
1992-
93
1993-
94
1994-
95
1995-
96
1996-
97
1997-
98
1998-
99
Source: derived from DET IVETS database
The data records original apprenticeship approvals, which are used here as a proxy for
commencements. It is well established that historically the peaks and troughs in
apprenticeship commencements are related to the general economic cycle (Scherer 1981;
Dandie 1996). For example, the peak in commencements in 1988-89 and 1989-90 is
linked to the buoyant resources and construction sectors. Similarly, the troughs are linked
to the very sharp and prolonged drop in output over the 1991-92 period. Of particular
note, the rate of change in the flows of new entrants into the trades (new and
recommencing apprentices) far exceeds the rate of change in the stock of employed
tradespersons in any given trade or industry.
The volatility in apprenticeship commencements from one year to the next can exceed 20
percent. The volatility in approvals leads subsequently to volatility in numbers
completing their apprenticeship. The number of approvals peaked in 1989-90 at 19,414
and reached a nadir in 1996-97 of 12,086. Between 1989-90 and 1991-92 apprenticeship
commencements declined by 33 percent. Over the 1990s the number of apprentice
approvals was comparatively low, as the number of approvals has not exceeded the level
in 1990-91.

12
Historically, apprenticeship commencements were linked to the level and rate of change
in general economic activity and trades employment in those industries which are
traditionally large employers of apprentices. However, it has been argued that these
historical links between output and trades employment on the one hand and apprentice
intake on the other have become attenuated over the 1990s (OTFE 1998:4; Smith
1999:10).
There would seem to be some evidence that this finding applies to NSW in the fact that
the sustained high rate of economic growth in NSW since the recovery began in 1992-93
has not been accompanied by a corresponding rise in apprenticeship commencements.
Between 1992-93 and 1997-98 the real value of production in NSW (Gross State
Product) increased by 21 percent, though the level of apprenticeship commencements
over the 1990s is below or similar to the level in the mid to late 1980s (ABS 5220.0
1997-98: Table 1). The strongest evidence for a major break in the relationship between
output and investment in apprentice training is the sustained decline in the training rate,
or the proportion of apprentices in training to the stock of existing employees in trade
occupations. This is examined in detail later.
APPRENTICE APPROVALS BY TRADE FIELDS
The results evident in Figure 1 are the sum of often quite divergent trends in the
component elements of the total. The following section provides a detailed account of
these elements. The key finding is that the traditional apprenticeship fields, construction,
electrical, metal and automotive, have experienced a major reduction in annual intake
over the 1990s. The other key traditional field, construction, has not experienced an
absolute reduction in the size of the annual intake, but the intake is at low levels given the
sustained high growth in construction output over the 1990s. Other fields, notably
horticulture and food, have had large increases in approvals over the 1990s.
Construction trades approvals show a marked 4-5 year cyclical pattern reflecting the
strong volatility in construction output (Figure 2). Construction trades approvals have a
far higher level of volatility than any other apprenticeship. Construction approvals can
show a variation of up to 30 percent between one year and the next and exceed 50 percent
over a cycle. It is of some concern that the level of construction approvals in 1998-99 is
significantly lower than that in 1988-89 and 1989-90, as the real level of construction
output in the late 1990s was over ten percent higher than in the late 1980s.
Figure 2

13
NS W C o nstruc tio n Tra d e s A p p re ntice A p p ro va ls
0
1 0 0 0
2 0 0 0
3 0 0 0
4 0 0 0
5 0 0 0
6 0 0 0
1985-86
1986-87
1987-88
1988-89
1989-90
1990-91
1991-92
1992-93
1993-94
1994-95
1995-96
1996-97
1997-98
1998-99
Electrical and electronic apprenticeship approvals over the 1990s have experienced a
marked and sustained decline compared to the 1980s (Figure 3). A significant contributor
to this decline has been the withdrawal of the public sector, notably the Government
Business Enterprises (GBEs) in NSW from the direct employment of apprentices. These
GBEs accounted for around 20 percent of annual electrical apprentice intake in the 1980s,
but now account for only a relatively small share of the annual intake.
Figure 3
NS W E lectrica l and E lectronic A pp rentice A pprova ls
0
5 0 0
1 0 0 0
1 5 0 0
2 0 0 0
2 5 0 0
3 0 0 0
1985
-86
1986
-87
1987
-88
1988
-89
1989
-90
1990
-91
1991
-92
1992
-93
1993
-94
1994
-95
1995
-96
1996
-97
1997
-98
1998
-99
Mechanical and fabrication apprentice approvals cover the major metal industry trades
for occupations such as welder, fitter and turner, tool maker, boiler maker and sheet metal

14
worker. As with the electrical apprentices there was a marked drop in intake in the early
1990s associated with the 1991-93 recession, the most severe economic contraction in
sixty years (Figure 4). This saw a significant reduction in manufacturing employment,
though the level of manufacturing employment has remained steady over the remainder
of the 1990s. The bulk of the decline was in metal fitting and machining apprenticeships
rather than fabrication trades.
Figure 4
NS W M echanica l and F ab rica tion A pp rentice A pp rova ls
0
5 0 0
1 0 0 0
1 5 0 0
2 0 0 0
2 5 0 0
3 0 0 0
3 5 0 0
4 0 0 0
1985-86
1986-87
1987-88
1988-89
1989-90
1990-91
1991-92
1992-93
1993-94
1994-95
1995-96
1996-97
1997-98
1998-99
Automotive apprentice intake declined by around 20-25 percent from the early 1990s
compared to the 1980s (Figure 5). Automotive encompasses a broad range of light and
heavy vehicle repair occupations such as bodybuilder/repair, diesel mechanic, light
automotive mechanic and automotive electrician. One factor in this decline has been the
improvement in the quality of motor vehicles, which require fewer repairs and less
frequent servicing. There has also been a change in repair methods in occupations such
as panel beating away from repair of damaged panels to replacement with new panels.

15
Figure 5
NSW Automotive Apprentice Approvals
0
500
1000
1500
2000
2500
3000
3500
4000
4500
1985
-86
1986
-87
1987
-88
1988
-89
1989
-90
1990
-91
1991
-92
1992
-93
1993
-94
1994
-95
1995
-96
1996
-97
1997
-98
1998
-99
'Other Trades' encompasses a broad range of diverse vocations including hairdressing,
upholstery, textile mechanic, boot making, sail making, printing, boat building, wood
turning and drafting (Figure 6). Hairdressing is the largest component of 'Other',
accounting for around 75 percent of the total. Given the diversity of occupations and
industries covered within the category, the influences upon each of these occupations are
certainly quite disparate. For example, the demand for textile mechanics has been
adversely effected by tariff reductions in this sector, while drafting has also been affected
by the wide spread use of computer aided design and drafting.
Figure 6
NS W O the r Trades A pp rentice A pp rova ls
0
5 0 0
1 0 0 0
1 5 0 0
2 0 0 0
2 5 0 0
3 0 0 0
1985-86
1986-87
1987-88
1988-89
1989-90
1990-91
1991-92
1992-93
1993-94
1994-95
1995-96
1996-97
1997-98
1998-99

16
Given the importance of hairdressing in the ‘Other Trade’ category and the fact that it is
the principal field of female apprenticeship, it has been separately analysed (Figure 7).
The hairdressing classification includes a number of apprenticeships such as female and
male hairdressing, beauty therapy and wig making. The major element, however, is
female hairdressing, which accounts for over 90 percent of total approvals. (The
description ‘female hairdressing’ relates to the apprenticeship or vocational title, it does
not imply that only females are engaged in the apprenticeship). Somewhat surprisingly,
there has been a decline of between 15-20 percent in the 1990s over 1980s apprentice
intake levels. All of the decline has occurred in female hairdressing, as beauty therapy
numbers have remained stable over the period .
Figure 7
NSW Hairdressing Apprentice Approvals
0
500
1000
1500
2000
1985
-86
1986
-87
1987
-88
1988
-89
1989
-90
1990
-91
1991
-92
1992
-93
1993
-94
1994
-95
1995
-96
1996
-97
1997
-98
1998
-99
Food apprenticeships have shown steady growth over most of the fourteen years in the
series, reflecting significant growth in the hotel, tourism and hospitality industries (Figure
8). In turn, the growth of these industries is due to factors such as rapid increases in
international in-bound tourism and rising domestic incomes. At a higher per capita
income, a larger share of domestic income is spent on services such as restaurants. Within
the broad category of food trades, there are divergent trends, with butchering, for
example, showing no growth in approvals (given the decline in many smaller retail
butcher shops), with most of the growth accounted for by cooking trades.
Figure 8

17
N S W F o o d Tra d e s A p p re ntic e A p p ro va ls
0
5 0 0
1 0 0 0
1 5 0 0
2 0 0 0
2 5 0 0
1985-86
1986-87
1987-88
1988-89
1989-90
1990-91
1991-92
1992-93
1993-94
1994-95
1995-96
1996-97
1997-98
1998-99
While there is some volatility in the trend, skilled agricultural apprenticeships have
maintained a steady long-term level. These trades include greenkeeping, landscape
gardening, nursery and gardening (Figure 9).
Figure 9
NSW Skilled Agricultural Apprentice Approvals
0
100
200
300
400
500
600
1985-86
1986-87
1987-88
1988-89
1989-90
1990-91
1991-92
1992-93
1993-94
1994-95
1995-96
1996-97
1997-98
1998-99
Conclusions/key points on apprentice approval trends
Apprenticeship approvals are subject to significant change, largely due to the general
business cycle. The relationship to the business cycle differs somewhat between industry
sectors with, for example, building trades being particularly volatile.

18
The number of approvals peaked in 1989-90 at 19,414 and reached a nadir in 1996-97 of
12,086. Reflecting the substantial recession in the early 1990s, between 1989-90 and
1991-92 apprenticeship approvals declined by 33 percent.
However, it would appear that during the 1990s the relationship with the business cycle
has weakened significantly. In particular, apprenticeship approvals do not reflect the
sustained high economic growth in NSW since the 1991-92 recession.
Over the 1990s the number of apprentice approvals was comparatively low, as the
number of approvals has not exceeded the level attained in 1990-91. The number of
approvals in 1998-99 was 14,742.
The trend of sustained and significant decline in many of the core traditional
apprenticeship fields, including, electrical, construction, metals and automotive has not
been offset by growth in the food trades and relatively steady approvals in skilled
agricultural trades. The net effect of these movements has been a significant and
sustained reduction in overall apprentice approval levels. As indicated above, the causes
of this decline are diverse and specific to the particular industries which are the
predominant employer of the specific trades experiencing decline in approvals. A detailed
consideration of these causes is given in Section V.
It is the key theme of this report, and of other literature on the topic, that the reduction in
apprentice intake has been much greater than that warranted by factors such as structural
and technical change, resulting in current and prospective skill shortages in many of the
traditional trades. The issue of skill shortage is considered in Section V
CHANGES IN THE LONG-TERM COMPOSITION OF APPRENTICESHIP APPROVALS
The large shifts in the level of different apprenticeship approvals over the last two
decades has resulted in large changes in the composition of NSW apprenticeship
approvals. Figure 10 indicates the principal changes. Construction trades increased their
share of approvals from 19 percent to 28 percent. This increase was not due to an
increase in the level of construction apprenticeships. Rather, the level has remained
relatively constant while the number of total apprentice approvals has declined, thus
increasing the proportional representation of this trade. Food increased from 9 to 14
percent, and agriculture increased from 2.5 to 3.3 percent. Metals (mechanical and
fabrication) fell from 18 to 10 percent, electrical and electronic fell from 15.5 to 13
percent, and automotive declined from 21 to 19 percent.

19
Figure 10
NSW Apprenticeship Approvals. Percent of Total.1985-86 and 1998-99
0
5
10
15
20
25
30
Auto
mot
ive
Con
stru
ctio
n
Ele
ctric
al
Food
Met
als
Oth
er
Agric
ultu
ral
Pe
rce
nt
1985-86 1998-99
PUBLIC AND PRIVATE SECTOR APPRENTICESHIP APPROVALS
A major dynamic in long-term apprenticeship trends has been the changing role of the
public sector in the direct employment of apprentices. Previous research has identified a
major reduction in the role of the public sector in the direct employment of apprentices
over the 1990s (Toner 1998). The public sector includes State, Commonwealth and Local
Governments as well as Government Business Enterprises (GBEs). It should be noted,
however, that the calculation of public and private shares is not straightforward. The
Federal Government category, following privatisation of Federal Government Business
Enterprises such as Qantas, is mostly made up of the Defence Force and is very cyclical.
The Defence Forces, for their own administrative ease, retain several years of apprentice
applications and submit them in a single period, resulting in very ‘lumpy’ approvals.
Secondly, there is some question over the reliability of coding of apprentice approvals to
the correct sector. For example, special labour market programs in the late 1990s to boost
the employment of aboriginal apprentices may have been classified to the public sector,
specifically GBEs, even though most of them were employed in the private sector.
Over the fourteen years 1984-85 to 1998-99, public sector apprentice intake reached a
peak of 15 percent in 1990-91, but has declined significantly, so that in 1996-97, for
example, it constituted only 5 percent of the total (see Table 1, A). (This is discussed later
in Section V). The contribution of the NSW Government, defined as State and Semi-
Government has declined from a peak of 1,455 apprentice intake in 1989-90 to 172 in
1998-99.
It is estimated that around one third of the long-term decline in the number of apprentice
approvals over the 1990s is due to the reduction in public sector intake.

20
GROUP TRAINING COMPANIES
Over the last ten years Group Training Companies (GTCs) have become increasingly
important in maintaining apprentice intake. In 1998-99 GTCs accounted for 15 percent of
total approvals (see Table 1, Appendix). One in every seven apprentices taken on in
1998-99 was employed by a GTC. It is difficult to determine the extent of net
‘additionality’ of training due to GTCs (ie what the level of training would be in their
absence), but it is probable that the level of apprentice training would be substantially
lower without their contribution.
APPRENTICESHIP COMPLETIONS
While trends in approvals or commencements are clearly important, it is only the
successful completion of an apprenticeship that, in general, constitutes a net addition to
the state’s stock of trade and technical skills. Trends in completions therefore, are equally
significant.
Given that the average duration of an apprenticeship is four years, the number of
completions in a given year is a lagged function of the number of commencements four
years earlier, plus re-commencements, minus the number of cancellations and expiries
and withdrawals in the intervening period. Figure 11 demonstrates that the cycles in
apprenticeship commencements translate into completion cycles. The relatively high
commencements in the late 1980s to 1989-90 produced the corresponding strong
completions from 1992-93 to 1994-95. The collapse in completions in 1995-96 is due to
the sharp drop in commencements in 1991-92.
Figure 11
NSW Total Apprentice Completions
0
2000
4000
6000
8000
10000
12000
14000
16000
1985/86 1987/88 1989/90 1991/92 1993/94 1995/96 1997/98
Source: Derived from DET IVETS database
One of the key points to emerge from the literature based on national data is that the
proportion of completions to approvals (lagged four years) is significantly lower over the
late 1980s and 1990s compared to the earlier period. “During the 1970s, on average, 19

21
percent of apprentices did not complete their training, in the 1990s this increased to
around 40 percent" (DEETYA 1998, Labour Market for Apprentices: 18). This implies
that not only will the supply of skilled labour in New South Wales be constrained by
comparatively low apprenticeship intake, it is also being constrained by rising rates of
non-completion. A DETYA report released at the end of February 2000 challenged these
results, as it found that for commencements in 1994-95 and 1995-96 there was likely to
be an upper limit of 30 percent attrition rate.
NSW apprenticeship completions, lagged four years, are shown in Figure 12. Over the
period 1988-89 to 1994-95 completions averaged 68 percent of the four-year lagged
approvals. There was a significant decline in completion rates over the period 1995-96 to
1997-98, when completion rates averaged only 57 percent of approvals. The decline in
completion rates is unlikely to be accounted for by a deterioration in economic conditions
after the apprentices were initially employed, as post 1991-92 the economy has enjoyed
historically high and sustained growth rates.
Figure 12
NSW Apprenticeship Completions as a Percent of Approvals
Lagged Four Years
0
10
20
30
40
50
60
70
80
1988-
89
1989-
90
1990-
91
1991-
92
1992-
93
1993-
94
1994-
95
1995-
96
1996-
97
1997-
98
1998-
99
Perc
ent
Source: derived from DET IVETS database
It is possible that the factors leading to a decline in apprenticeship approvals over the
1990s also led to the low completion rates in the mid to late 1990s. More precisely, the
factors affecting the low level of approvals from 1991-92 would appear to have
influenced the low rate of completions four years later. An important implication of this
is that the supply of skilled labour from the apprenticeship system is affected adversely in
two ways. Firstly, over the 1990s there was a significant reduction in the annual intake of
new apprentices. Secondly, the completion rate of these apprentices fell sharply in the
latter 1990s. The lift in the completion rate in the last year in the series is an encouraging
sign, but it may be linked to the comparatively high apprentice approvals in 1994-95.
There are some marked differences in completion rates across the trade groups. (A
completion rate is defined as apprenticeship completions as a percentage of

22
commencements in the previous four years). Over the period 1990-91 to 1996-97 the
highest completion rates were for electrical and metal trades, which average around 65
percent. The lowest completion rates were in hairdressing (30 percent) and food (40
percent). These results are broadly consistent with an earlier analysis of apprenticeship
completion rates conducted in the late 1980s, though the completion rates were higher in
this earlier period (NSW Department of Further Education, Training and Employment
1990, Appendix).
Key points on apprentice completion rates
The long-term non-completion rate for apprenticeships is 34 percent. Some areas such as
metals and electrical have significantly lower non-completion rates than service areas
such as hairdressing, food and hospitality. In the late 1990s there was an increase in the
non-completion rate of apprentices.
AN OVERVIEW OF APPRENTICES-IN-TRAINING AND APPRENTICE TRAINING RATES
This section describes long term changes in the NSW labour market, focussing on the
trades, apprentices in-training and movements in apprentice training rates.
Training rates are defined as the number of apprentices in-training (the total number of
apprentices in a particular trade field registered in NSW at a given time) as a proportion
of the total number of tradespersons and apprentices employed in that occupation at a
given time.
Table 2 (see Appendix) shows changes in the occupational structure of New South Wales
over the ten years to 1998-99. With respect to the trades, there was a 4.8 percent decline
in the total number of employed tradespersons over the decade. Of importance, however,
is that this decline occurred in the 1990-91 recession, the worst recession in sixty years in
Australia, and total trade employment has remained stable over the middle years of the
1990s and in fact increased in the latter part of the decade. Table 3 (see Appendix) and
Figure 13 below show that, as a result of relatively stable trades employment levels and
total employment increasing by nearly 10 percent over the decade, the trades share of
total employment declined from 14.7 percent in 1989-90 to 12.8 percent in 1998-99.
Nevertheless, the trades as a whole remain the third largest occupational group in NSW
after professionals, and intermediate sales and service.

23
Figure 13
Tradespersons as a Percent of Total Employment NSW
0
2
4
6
8
10
12
14
16
1989-
90
1990-
91
1991-
92
1992-
93
1993-
94
1994-
95
1995-
96
1996-
97
1997-
98
1998-
99
Perc
ent
Source: NSW Labour Force ABS 6101.1
The aggregate trends in trades employment are in general reflected in movements across
the individual trade fields. Table 4 (see Appendix) indicates the mechanical/fabrication
engineering trades experienced a marked slump in the early 1990s, but employment
levels have remained stable over the remainder of the decade. Food trades and skilled
agricultural and horticulture trades were the only trades to show trend increases over the
decade. These movements reflect the broader fortunes of the industries in which these
trade occupations are concentrated, with manufacturing experiencing stagnation in
employment and hospitality and personal services experiencing significant growth in
employment. The stagnation in manufacturing, however, also reflects large productivity
gains in this industry, as total real manufacturing output continues to experience steady
growth. In other words, it is high productivity growth in manufacturing which is
constraining employment growth, not declining output.
TOTAL APPRENTICES IN-TRAINING
In-training data offers a better understanding of movements in apprenticeship trends over
time, especially compared to volatile annual approval data, as it is, in effect, a four year
moving total of the number of apprentices registered with the NSW Department of
Education and Training at a given point in time.
The following in–training data shows different starting points for different trades, with
some trends commencing in 1978 and others in 1987 and 1989. This is due to differences
in data availability. Figure 14 shows annual movements in total apprentices in-training
from 1978 to 1998.

24
Figure 14
Total Apprentices In Training NSW. June of Each Year.
0
10000
20000
30000
40000
50000
60000
1978
1979
1980
1981
1982
1983
1984
1985
1986
1987
1988
1989
1990
19991
1992
1993
1994
1995
1996
1997
1998
Source: DEET Apprenticeships Statistics and DET
Key points on numbers of apprentices-in-training
The number of apprentices in-training in the late 1990s is identical to the level in
the late 1970s. Over the twenty-one years from 1978 to 1998 the number of
apprentices in-training has never experienced a period of such sustained low
levels as in the 1990s.
The number of apprentices-in-training is strongly cyclical. The peaks in the early
1980s and late 1980s and early 1990s reflect the rapid economic growth
associated with the ‘Resources Boom’ and ‘Building Boom’ respectively. It is
clear that the number of apprentices in-training has not responded, as it has in the
past, to the high and sustained rates of economic growth, such as those
experienced over the last eight years.
Figures 15 to 20 show long-term in-training trends for the principal trade areas.

25
Figure 15
Total Metal Trades In-Training. NSW.
June of Each Year.
0
2000
4000
6000
8000
10000
12000
1987
1988
1989
1990
1999
119
9219
9319
9419
9519
9619
9719
98
Source: DEET Apprenticeship Statistics and DET
Figure 16
Total Building Trades In-Training. NSW.
June of Each Year.
0
2000
4000
6000
8000
10000
12000
14000
1978
1979
1980
1981
1982
1983
1984
1985
1986
1987
1988
1989
1990
1999
1
1992
1993
1994
1995
1996
1997
1998
Source: DEET Apprenticeship Statistics and DET

26
Figure 17
Total Vehicle Trades In-Training. NSW.
June of Each Year.
0
1000
2000
3000
4000
5000
6000
7000
8000
9000
10000
1987 1988 1989 1990 19991 1992 1993 1994 1995 1996 1997 1998
Source: DEET Apprenticeship Statistics and DET
Figure 18
Total Electrical Trades In-Training. NSW.
June of Each Year.
0
1000
2000
3000
4000
5000
6000
7000
8000
9000
1978
1979
1980
1981
1982
1983
1984
1985
1986
1987
1988
1989
1990
1999
119
9219
9319
9419
9519
9619
9719
98
Source: DEET Apprenticeship Statistics and DET

27
Figure 19
Total Hairdressing Trades In-Training. NSW.
June of Each Year.
0
500
1000
1500
2000
2500
3000
3500
4000
4500
5000
1989 1990 19991 1992 1993 1994 1995 1996 1997 1998
Source: DEET Apprenticeship Statistics and DET
Figure 20
Total Food Trades In-Training. NSW.
June of Each Year.
0
1000
2000
3000
4000
5000
6000
7000
1978
1979
1980
1981
1982
1983
1984
1985
1986
1987
1988
1989
1990
1999
119
9219
9319
9419
9519
9619
9719
98
Source: DEET Apprenticeship Statistics and DET
Key points/conclusions on numbers of apprentices-in-training by trade
The sustained decline and/or plateauing of the number of apprentices in-training
in many traditional trades such as metal, vehicle and electrical over the 1990s.
The building trades showed some growth in the absolute level of apprentices in-
training in the middle 1990s, though it is important to note that the peak achieved
in the 1990s is around 20 percent lower than that achieved in the 1980s building
boom. This is despite the fact that the real level of activity is 11 percent higher in
the late 1990s than in the late 1980s.
The female-dominated hairdressing trade has not experienced the large
proportional declines of other trades, though in the late 1990s numbers have

28
dropped to the lowest levels in twelve years. This is an interesting development
given the rapid growth over the last two to three decades in the personal service
industry, of which hairdressing is a part.
The only major trade to show sustained growth, that is, a higher level of
apprentices in-training at each peak in the business cycle over the last three
decades, is the food trade. Apprentices in-training increased by 100 percent
between 1978 and 1998. This reflects changes in consumption patterns, with a
larger share of income spent on bought-in and restaurant meals at higher per
capita income levels, as well as the growth of tourism and hotels.
APPRENTICE TRAINING RATES
While most trades have experienced either declining or static in-training numbers, this
does not by itself tell us anything about the significance of these trends in terms of the
adequacy of current training levels to meet current and future skill demands. A key factor
in determining the adequacy of current training is an examination of training rates. As
described earlier, training rates are defined as apprentices in–training for a given period
as a proportion of total employment in the trade field.
As Figure 21 shows, over the nine years to 1998 the overall apprentice training rate has
declined from a peak of 15 percent in 1991 to low of 11 percent in 1998.
Figure 21
Total Apprentices In-Training as a Percent of Total Trades
Employed
0
2
4
6
8
10
12
14
16
1990 1991 1992 1993 1994 1995 1996 1997 1998
Pe
rce
nt
Source: ABS NSW Labour Force and DET

29
Conclusion/comment on overall apprentice training rate
We know from the previous analysis of the NSW labour market that the number of
tradespersons underwent an initial decline in the early 1990s, but subsequently remained
static over rest of the decade. The trend evident in Figure 21 implies that the employment
of apprentices, as measured by apprentices in-training, has declined at a faster rate than
that of tradespersons.
TRAINING RATES BY TRADE
Figures 22-27 plot training rates in different trades.
Figure 22
Metal Apprentices In-Training as a Percent of NSW Metal
Trades Employed
0
2
4
6
8
10
12
14
16
1990 1991 1992 1993 1994 1995 1996 1997 1998
Pe
rce
nt
Source: ABS NSW Labour Force and DET

30
Figure 23
Vehicle Apprentices In-Training as a Percent of NSW Vehicle
Trades Employed
0
2
4
6
8
10
12
14
16
18
20
22
1990 1991 1992 1993 1994 1995 1996 1997 1998
Perc
ent
Source: ABS NSW Labour Force and DET
Figure 24
Electrical Apprentices In-Training as a Percent of NSW
Electrical Trades Employed
0
2
4
6
8
10
12
14
16
1990 1991 1992 1993 1994 1995 1996 1997 1998
Perc
ent
Source: ABS NSW Labour Force and DET

31
Figure 25
Building Apprentices In-Training as a Percent of NSW Building
Trades Employed
0
2
4
6
8
10
12
14
16
1990 1991 1992 1993 1994 1995 1996 1997 1998
Pe
rce
nt
Source: ABS NSW Labour Force and DET
Figure 26
Food Apprentices In-Training as a Percent of NSW Food
Trades Employed
0
4
8
12
16
20
24
1990 1991 1992 1993 1994 1995 1996 1997 1998
Pe
rce
nt
Source: ABS NSW Labour Force and DET
32
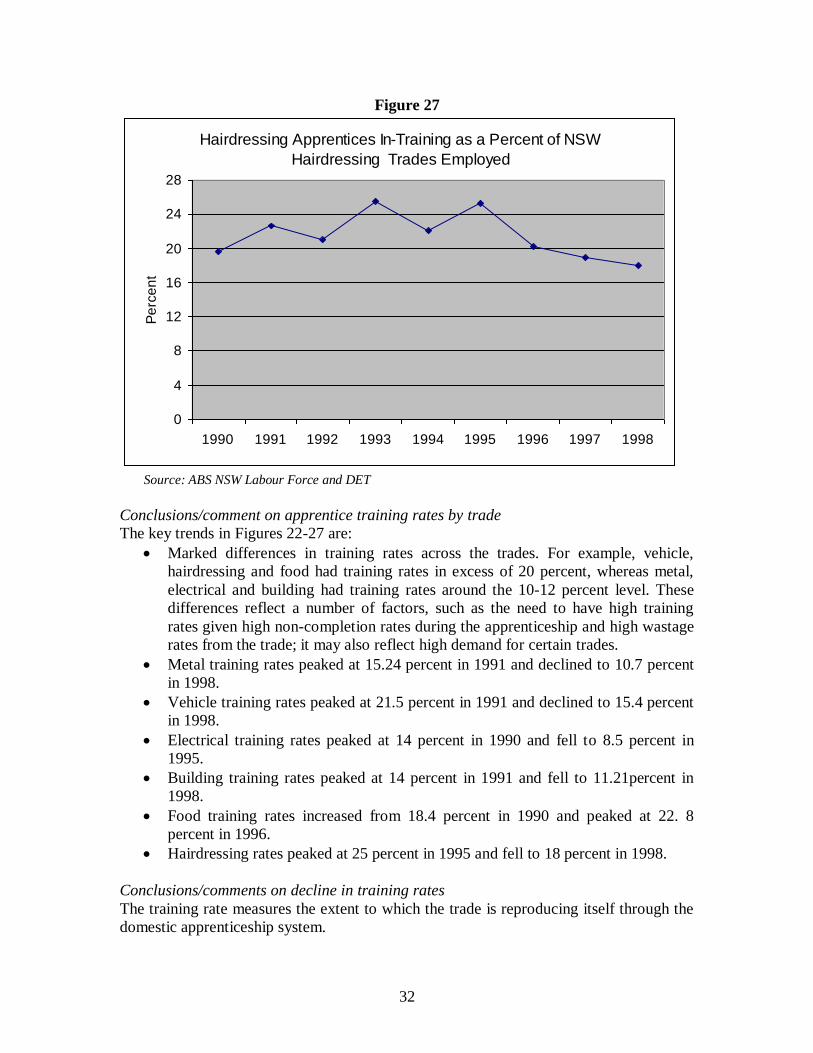
Figure 27
Hairdressing Apprentices In-Training as a Percent of NSW
Hairdressing Trades Employed
0
4
8
12
16
20
24
28
1990 1991 1992 1993 1994 1995 1996 1997 1998
Pe
rce
nt
Source: ABS NSW Labour Force and DET
Conclusions/comment on apprentice training rates by trade
The key trends in Figures 22-27 are:
Marked differences in training rates across the trades. For example, vehicle,
hairdressing and food had training rates in excess of 20 percent, whereas metal,
electrical and building had training rates around the 10-12 percent level. These
differences reflect a number of factors, such as the need to have high training
rates given high non-completion rates during the apprenticeship and high wastage
rates from the trade; it may also reflect high demand for certain trades.
Metal training rates peaked at 15.24 percent in 1991 and declined to 10.7 percent
in 1998.
Vehicle training rates peaked at 21.5 percent in 1991 and declined to 15.4 percent
in 1998.
Electrical training rates peaked at 14 percent in 1990 and fell to 8.5 percent in
1995.
Building training rates peaked at 14 percent in 1991 and fell to 11.21percent in
1998.
Food training rates increased from 18.4 percent in 1990 and peaked at 22. 8
percent in 1996.
Hairdressing rates peaked at 25 percent in 1995 and fell to 18 percent in 1998.
Conclusions/comments on decline in training rates
The training rate measures the extent to which the trade is reproducing itself through the
domestic apprenticeship system.

33
Over the nine years to 1998 the overall apprentice training rate has declined from a peak
of 15 percent in 1991 to low of 11 percent in 1998.
Since it is well-established that many of the key trades, such as metals, construction,
electrical and food are experiencing skill shortages, the overall trends observed in this
section are a matter of concern.
The overall decline in numbers of apprentices in-training, and the falls in particular trades
may not be significant if the training rate remains constant, that is, if the number of
employed tradespersons overall or in the particular trade under study have also declined
by the same proportion. It may also not be of concern if the declining training rate
actually reflects declining demand for tradespersons. That is to say, the more rapid
decline in the flow of new tradespersons compared to the decline in the stock of
tradespersons is justified if it is anticipated the stock of tradespersons will decline at an
accelerated rate in the future.
On the other hand, a declining training rate may point to significant problems in the
reproduction of trade skills and may presage future skills shortages or a worsening of
existing skill shortages, if they cannot be offset by the other means of sourcing the
required skills.
There are of course other means of sourcing skills, such as skilled migration; informal
upgrading through mechanisms like on-the-job learning; encouraging those who have left
the trade occupation to return, or inversely, to encourage a lower ‘wastage rate’ from the
trade. However, it should be noted that there are frequently large impediments to
meeting skill requirements through means other than the apprenticeships system. These
include:
an unwillingness or inability to increase trade wages or otherwise improve
conditions to attract people back to the trade or reduce wastage rates due to
increased competition in many product markets.
rapid technical change which has made some of the skill of ex-tradespersons
either redundant or may require the tradespersons to undergo additional training
before they can productively re-enter the labour market.
political opposition to sourcing a large share of trade skills through immigration
when unemployment rates are high.

34
APPRENTICESHIPS IN-TRAINING AND GENDER
Figure 28
Males as a Percentage of Total NSW Apprentices In-Training.
June of Each Year
80
82
84
86
88
90
92
94
96
98
100
1983
1984
1985
1986
1987
1988
1989
1990
1991
1992
1993
1994
1995
1996
1997
1998
Pe
rce
nt
Source: Derived from DEET Apprenticeship Statistics and DET
Conclusion/comment on trend in male share of apprenticeships
Figure 28 (above) indicates that over the sixteen years from 1983 to 1998 there has been
a long-term secular decline in the proportion of males among apprentices in-training.
Over the period, the male share of total apprentices in-training peaked at 92.5 percent in
1983 and stood at 87 percent in 1998
The cycles evident in the very early 1980s and early 1990s reflect the strong growth of
male dominated trades such as construction and metals and engineering which occurred
in this period.
Clearly, the apprenticeship system remains dominated by males.

35
Figure 29
Total Male and Female Apprentices In Training NSW. June of
Each Year.
0
10000
20000
30000
40000
50000
60000
1983
1984
1985
1986
1987
1988
1989
1990
1991
1992
1993
1994
1995
1996
1997
1998
Source: Derived from DEET Apprenticeship Statistics and DET
Conclusion/comment on total numbers of male and female apprentices
It is evident from Figure 29 that the reason for the declining male share is a combination
of declining numbers of males in-training and increasing female numbers. Numbers of
females in-training rose significantly, at least in proportional terms over the 1980s, but
plateaued in the 1990s.
Male/female apprentices-in-training by trade group
Table 5 (see Appendix) shows numbers of male and female apprentices in-training in the
key trade groups over the 1990s. The key points in the table are:
Females have not increased their share of traditional trades over the 1990s.
The apprentice labour market remains highly occupationally segmented. Females
are concentrated almost exclusively in two trade fields, food and hairdressing.
These two trades accounted for 89 percent of all female apprentices in-training in
1998. In 1998, females comprised 91 percent of all hairdressing apprentices in-
training and 23 percent of total food apprentices.
The high concentration of females in these two trades largely explains the
insulation of females from the long-term decline in apprentice intake experienced
by males. This is because, as shown earlier, food has had a long term rising
apprentice intake and hairdressing exhibited a relatively stable intake over the
long term.
DISTRIBUTION OF APPRENTICES BY REGION
Changes in the distribution of total apprentices in training by region reflect a large
number of factors, such as population size and differences in the industrial structure of
regions (Figure 30). For example, both the Hunter and Illawarra are major centres for the
metals industry, and this largely accounts for the disproportionate number of metals and

36
engineering apprentices in these regions. With the gradual decline of steel making in the
Hunter, however, other industries, such as coal mining and its associated repair and
maintenance industries, have compensated to some extent in fields such as electrical and
machinery maintenance. Population size is a key factor in construction industry, personal
services-related apprenticeships (hairdressing), and horticultural apprenticeships such as
gardening and greenkeeping.
Figure 30
Proportion of Total NSW Apprentices In-Training in Each
Region 1993 and 1998
0
10
20
30
40
50
60
70
Metrop Hunter Illawarra Other
Perc
ent
1993 1998 Source: Derived from DET data
Conclusion on regional distribution of apprentices in-training
Over the 1990s, notwithstanding large structural changes, the proportions of apprentices
in-training across the regions has remained quite stable. There was even a small rise in
the contribution of regions outside of Sydney to the total in-training effort.

37
TRENDS IN NSW TRAINEESHIPS
TRAINEESHIP COMMENCEMENTS
Figure 31
NSW Traineeship Commencements 1991-92/1998-99
0
5000
10000
15000
20000
25000
1991-92 1992-93 1993-94 1994-95 1995-96 1996-97 1997-98 1998-99
Source: derived from DET IVETS database
Traineeship commencements were relatively stable over the period 1991-92 to 1994-95,
but increased by around 420 percent over the following four years to 1998-99 (Figure
31). In 1998-99 traineeship approvals were 21,242 compared to 14,742 apprenticeship
approvals. Traineeship approvals exceeded apprenticeship approvals by 44 percent. The
rate of trainee commencements has accelerated over 1999-2000 in that there were 39,620
traineeship approvals to June 2000. This represents an increase of 87 percent over 1998-
99 commencements.
Discussion of traineeship commencement numbers increase
It would appear that the very rapid growth of traineeships is due to a range of factors.
These include:
the existence of a ‘training wage’ for these positions to reflect time in training.
financial incentives for the employment of trainees.
the active promotion of traineeships through New Apprenticeships Centres.
the fact that traineeships are concentrated in service industries such as retail and
hospitality which have experienced rapid growth in overall employment compared to
traditional apprenticeship areas such as manufacturing.
the availability of fully on-the-job training delivery for traineeships.
the extension of traineeships to ‘Existing Workers’.
the flexibility in hours of work and training providers in the traineeship system.
the potential substitution effect of traineeships for apprenticeships.
It is clear, however, both from the now extensive literature on the current vocational
education and training system, that some of the factors leading to the rapid growth of
trainee commencements have also produced poor quality training outcomes.

38
A very significant factor in the recent growth of traineeships has been the decision by the
Commonwealth to extend traineeships to existing workers. Existing Worker traineeships
were established in NSW at the end of March 1999. As at June 2000, of the 39,620
trainee approvals, 11,846, or 30 percent of total traineeships, were in the Existing Worker
category.
TRAINEESHIPS BY OCCUPATION
Tables 6 and 7 (see Appendix) provide a detailed account of both the occupational
structure of traineeships over the years and the change in the proportions of these
occupations in the total number of traineeships. The key trends in traineeship approvals
are:
A very large reduction in the share of intermediate clerical workers from 60 percent
in 1992-93 to 14 percent in 1998-99.
Elementary sales workers account for around 20 percent of intake, while there is
some variation from year to year.
There were large proportional rises in cleaners, factory labourers, intermediate sales
and intermediate service workers.
Conclusions/comments on traineeships by occupation
There has been a large shift in the distribution of traineeships across the different skill
levels over the years, with a large absolute and proportional rise in low skilled and
somewhat smaller rise in high skilled occupations.
It is of course the case that the objectives and target group of traineeships have changed
considerably over the years. Nevertheless, these trends in the occupational structure and
corresponding skill level are significant and relevant.
TRAINEESHIP SKILL LEVELS
Australian Standard Classification of Occupations
The basis for comparing skill levels is the Australian Standard Classification of
Occupations Second Edition (ASCO), which classified the nine Major Group occupations
into five separate skill levels. The criteria to measure skill levels are ‘formal education
and/or training and previous work experience usually required for entry to the
occupation’ (ASCO Second Edition:9).
ASCO uses the Australian Qualifications Framework to relate occupations and
qualifications. The basis for relating occupations, skill levels and qualifications is the
Ministerial Council on Employment, Education, Training and Youth Affairs
(MCEETYA) report Australian Qualifications Framework Implementation Handbook,
August 1995 (ASCO Second Edition:9). There are five skill levels, with the least skilled
occupations, that is Major Group 8 and 9 (Elementary Clerical, Sales and Service
Workers; and Labourers and Plant and Machinery Operators) classified to Skill Level
Five and the Major Groups 1 and 2 (Managers and Professionals) classified to Skill Level
1.

39
Traineeship concentration in low skill occupations
In 1998-99, 41 percent of traineeship approvals were in the lowest skill occupations. That
is to say, they are in Skill Level 5 according to the ASCO classification. These
occupations constituted 29 percent of the total in 1992-93. (This encompasses
occupations such as Cleaners, Elementary Sales Workers, Elementary Service Workers,
Factory Labourers). Skill Level 4 occupations comprised 44 percent of the total in 1998-
99. In 1992-93 they comprised 68.5 percent of the total. Most of this decline in the
proportion of Level 4 Skills is due to the rise in Level 5 Skills. Level 4 occupations
include Major Groups 6 and 7 (Intermediate Clerical, Sales and Service Workers and
Intermediate Production and Transport Workers).
Skill Level 3 occupations comprised 10 percent of total traineeships in 1998-99 and 3.2
percent in 1992-93. Skill Level 2 includes Major Group 3 occupations such as Associate
Professionals.1 It is important to note that this deterioration in skill levels is due only in
part to the growth of Existing Worker traineeships being concentrated in lower skill
occupations. In many occupations in which there are large numbers of New Entrant and
Existing Worker trainees, the share of Existing Workers is in approximate proportion to
their share of total traineeships.2
Policy questions raised
The very large numbers and rising proportion of low skill traineeships, which now
account for around 85 percent of trainee approvals, raise a number of important policy
issues for the NSW vocational training system. The principal policy question, is that,
given scarce resources for vocational training, is the expenditure of very considerable
sums on employment and training subsidies for trainees (and the considerable cost of the
attendant administrative apparatus for the system) actually meeting strategic skill
shortages?
Strategic skill shortages
This issue of strategic skill shortages is addressed in some detail in Section V. However,
to anticipate the discussion in this section, it is argued that current assessments from
industry and the Federal Government of vocational skill shortages indicate inadequate
skill formation in a variety of trade occupations, not in the low level skill occupations
which represent the bulk of traineeships.
It is important to note a crucial distinction between ‘strategic skills shortages’ and
training for ‘skills in demand’. Strategic skill shortages occur in occupations in which
1 Examples of these traineeships include Business and Administrative Associate Professional; Business and
Information Professional; Health and Welfare Associate Professional; Advanced Clerical; Other Associate
Professional; Science, Engineering Professional and Associate Professional; Social, Arts Professional and, Specialist Manager. 2 For the financial year to June 2000 this applies to Communications; Community Services and Health;
Finance, Insurance and Business Services; Primary Industry; Property Services; Retail and Wholesale; and
Tourism. The only field in which Existing Worker trainees are significantly over-represented is Transport
and Distribution where Existing Workers outnumbered New Entrants by 2:1.

40
there is a considerable period of on- and off-the-job preparation, say three to four years,
before minimum competency levels are attained and in which the shortages have
significant economic impacts.3 Skills in demand, by contrast, can be met with relatively
limited specific vocational preparation.
According to the ASCO Second Edition classification, occupations such as factory
labourer, contract cleaner, security guard and boning/slaughtering are classified to Skill
Level 5, for which the entry level is either Year 10 education or an AQF I formal
training. These occupations comprise around 40 percent of trainee intake. While it is the
case that frequently skills in demand occur in industries and occupations which are
experiencing rapid growth, such as hospitality, contract cleaning and transport, this does
not constitute, prima facie, a justification for the provision of scarce public funds for
vocational training in these fields.
Market demand and adequacy of skill formation
A related key policy issue for the NSW vocational training system is the extent to which
it follows private market signals in funding the training of particular occupations, or to
what extent it needs to adapt or direct, to varying degrees, vocational training. Another
way of expressing this is that the balance may have swung too far in the direction of
solely market-determined training outcomes, without regard to wider concerns regarding
the adequacy of the skill formation effort from a broader economic perspective. In
support of such a view are the significant skill shortages in the aforementioned fields and
the considerable literature on widespread market failures and externalities in vocational
training in the private sector.
PUBLIC AND PRIVATE SECTOR TRAINEESHIP APPROVALS
The trends in traineeship approvals by sector are shown in Table 8 (see Appendix) and
are broadly similar to those for apprenticeships.
Private sector
The private sector accounts for the overwhelming bulk of traineeships. In 1998-99 it
accounted for 75 percent directly of new approvals, and, if the Group Training Company
share is added (as the bulk of these are engaged in the private sector), then the private
sector share increases to around 90 percent. (Using the same method the private sector
accounted for 92 percent of apprenticeships in 1998-99).
Public sector
The Federal Government has always accounted for a very small proportion of approvals
(with the exception of 1992-93), with the State Government contribution falling steadily
over the years. Interestingly, State Government Business Enterprises have been steadily
increasing over the late 1990s. Local government has always employed a small
3 These effects include the delaying or cancelling of new investments, and rapidly rising wages, which flow
on to other industries and/or prevent introduction of the latest technologies.

41
proportion of total trainees, but has maintained its share over the years, implying a large
absolute increase in the number of trainee approvals in recent years.
Group Training Companies
Over the last eight years Group Training Companies (GTCs) have become increasingly
important in raising trainee intake. They currently account for over 15 percent of trainee
intake. The current GTC share of trainee approvals is nearly identical to the GTC share of
apprentice approvals.
TRAINEESHIP COMPLETIONS
The rapid rise in traineeship commencements is reflected in the rapid rise of traineeship
completions after 1995-96 (Figure 32).
Figure 32
NSW Traineeship Completions 1991-92/1998-99
0
1000
2000
3000
4000
5000
6000
7000
8000
9000
1991-92 1992-93 1993-94 1994-95 1995-96 1996-97 1997-98 1998-99
Source: derived from DET IVETS database
The duration of a traineeship is usually one year. The number of completions is always
significantly lower than the number of commencements in the preceding year, as
demonstrated in Figure 33, which shows overall traineeship completion rates.

42
Figure 33
NSW Traineeship Completions as a Percentage of Commencements
Lagged One Year
0
10
20
30
40
50
60
70
1992/93 1993/94 1994/95 1995/96 1996/97 1997/98 1998/99
Source: Derived from DET IVETS database
Figure 33 demonstrates that the NSW traineeship completion rate reached a peak of 65
percent in 1993-94 and has declined to its lowest point of 50 percent in 1998-99.
The reasons for and implications of the non-completion rate are examined in Section V.
TRAINEESHIP COMPLETIONS AND COMPLETION RATES CLASSIFIED BY THE AUSTRALIAN STANDARD CLASSIFICATION OF OCCUPATIONS
Table 9 (see Appendix) shows detailed traineeship completions classified by ASCO
(Second Edition).
Table 10 (see Appendix) shows NSW traineeship completions as a percentage of
approvals lagged one year.
The table results need to be treated with some caution as it does not include effects such
as individuals leaving a traineeship and recommencing in the same field, or the general
tendency for the duration of traineeships to extend from one to two years, as occurred in
the latter part of the 1990s. In addition, for some of the traineeships the total number of
approvals and commencements is very small, and this leads to quite wide swings in
annual percentage completions rates.
Key points on traineeship completion rates by occupation
For the largest traineeship categories, the key trends are:
Elementary sales workers, which accounted for 20 percent of trainee approval, had
above average completion rates over the period, with 58 percent completing in
1998-99.

43
Intermediate clerical workers, accounting for 14 percent of traineeship approvals, also
had substantially above average completion rates, with nearly 59 percent completing
in 1998-99.
Intermediate sales and intermediate service workers had 27 percent of all approvals
but less than average completion rates of 45 percent and 43 percent respectively.
Cleaners, which accounted for nearly 4 percent of traineeship approvals in 1998-99
had a completion rate of less than 30 percent.

44
IV SURVEY FINDINGS
Three surveys were undertaken for the project. They included extensive consultations
with key stakeholders in the NSW vocational education and training system, a mail
survey of current apprentices and trainees, and a telephone survey of NSW employers.
The purpose of the surveys was to gain qualitative information on the attitudes and
experiences of key stakeholders, employers, and apprentices and trainees of the NSW
vocational education and training system.
In general, these survey results support the other findings of the research project. These
include, for example, employers’ lack of knowledge of the major changes to the current
vocational education and training system. There is considerable uncertainty on the part of
employers as to whether the changes have improved the quality of training. Employers
and key stakeholders place much greater priority, in the selection of school leavers for
employment in vocational occupations, on literacy and numeracy attainments and general
interest in the occupation for which they are applying, rather than the completion of
vocational courses at school. There is some concern at the complexity of the system,
notably in the application for training subsidies. Apprentices and trainees were both
strongly supportive of their respective training systems.
Both employers and trainee surveys demonstrate that trainees operate under more formal
training arrangements than apprentices, though this is largely due to the higher proportion
of fully on-the-job training for trainees. Close to 100 percent of the off-the-job training of
apprentices is provided by TAFE NSW and 75 percent of the off-the-job training of
trainees is provided by TAFE NSW. There is strong support among employers and
apprentices and trainees for the on- and off-the-job training they receive. The employer
survey provided evidence that a very limited amount of substitution of trainees for
apprentices is occurring.
CONSULTATIONS WITH STAKEHOLDERS
Consultations were undertaken through interviews with key players in the vocational
education and training system in NSW on the topic of trends in apprenticeships and
traineeship training. This was designed to provide qualitative information to complement
the largely quantitative analysis and literature review provided in the first stage of the
research project. Thirty key stakeholders were interviewed, either in person or through
telephone interview.
In summary, the key points which emerged from the initial consultations were:
There was general support for apprenticeships and traineeships within the new system
as skill formation programs, as opposed to labour market unemployment programs.
There were widespread concerns about the complexity of the system, administrative
arrangements and the efficiency and effectiveness of New Apprenticeships Centres.
A clear distinction was retained by most stakeholders, in particular those in traditional
trade areas, between apprenticeships and traineeships.

45
There was general support, again particularly among those in traditional trade or
related areas, for the continuation of declared trades and callings and for the retention
of the NSW system of Vocational Training Orders as part of quality control.
Concerns were expressed about aspects of the quality of the accreditation system of
the National Training Framework, particularly in regard to the registration of
Registered Training Organisations.
Concerns were expressed that the structure of financial incentives (and
Commonwealth promotions) may not lead to optimal skill formation outcomes.
In general, the stakeholders affirmed many of the findings expressed elsewhere in this
report regarding the negative consequences of some aspects of the unregulated expansion
of the ‘training market’.
MAIL SURVEY OF APPRENTICES AND TRAINEES
A mail survey of 3,000 persons in training in the NSW training system was undertaken,
comprising 50 percent trainees and 50 percent apprentices. The purpose of the survey was
to assess the perceptions of apprentices and trainees regarding their experiences of the
vocational education and training system.
The key findings were:
Apprentices were younger on average (at 19 years) than trainees on average (at 29
years) although New Entrants (at 20 years) were more similar to apprentices than
were Existing Worker trainees (at 40 years). The difference in average age between
trainee school leavers and apprentice school leavers was due to the higher school
retention rate for females.
Apprentices were much more likely to be male (86 percent), whereas trainees were
more likely to be female (61 percent) rising to 67 percent in the New Entrant trainee
category.
New Entrant trainees had more years of schooling and were more likely to have
completed Year 12 (or equivalent) than apprentices or Existing Worker trainees.
Overall, 53.4 percent of New Entrant trainees had achieved Year 12 compared with
40.9 percent for apprentices and 28.6 percent for Existing Worker trainees.
Apprentices were more likely to have undertaken a practical course (31%) than
trainees (18%) although this is partially due to the older average age of trainees.
However, apprentices were still more likely to have undertaken some form of
vocational program at school than New Entrant trainees (24%) with a similar age
distribution.
Both apprentices and trainees supported their respective systems of training.
However both groups expressed greater support for the institution of traineeship or
apprenticeship than they did for their respective industry areas. Apprentices and New
Entrant trainees were similar in their attitudes, with 78.5 percent of apprentices and
77 percent of New Entrant trainees stating that they would recommend an
apprenticeship or traineeship in their industry area, and 93.3 percent of apprentices
and 94.5 percent of New Entrants stating that they would recommend apprenticeships
or traineeships in general. The percentages were lower, but still high, for Existing
46
Workers, with 74 percent recommending a traineeship in the same area and 80
percent recommending traineeships in general.
Apprentices were far more likely to be self-directed and proactive in seeking an
apprenticeship than trainees. Even when ‘current employer’ was removed from the
list of means of finding an apprenticeship or traineeship, apprentices were twice as
likely to have ‘asked employers’, searched newspapers or used family/friend
networks than trainees. Trainees, however, were more likely to have found their
traineeship through some form of labour market policy/program, such as using a job
placement agency or undertaking a prior (primarily) TAFE NSW preparation course.
There were major differences between the groups, with only 6.2 percent of
apprentices undertaking training fully on-the-job compared with 54.7 percent of
trainees. However, both groups expressed similar levels of general satisfaction with
training arrangements, with 85.6 percent of apprentices and 86.2 percent of trainees
either ‘very satisfied’ or ‘fairly satisfied’ with their training.
Both groups recorded similar levels of satisfaction with their off-the-job
arrangements (where applicable), with 87.7 percent of apprentices and 90.1 percent
of trainees either ‘satisfied’ or ‘very satisfied’ with their off-the-job training.
Trainees, however, were more likely to report that they were ‘very satisfied’ (57.4%)
than apprentices (45.7 percent).
There were similar levels of satisfaction with on-the-job training, although trainees
were slightly more likely to state that they were ‘satisfied’ or ‘very satisfied’ (88.1
percent) than apprentices (83.7 percent). Trainees were also significantly more likely
to be ‘very satisfied’ (52.5 percent) than apprentices (44.5 percent) who were also
more likely to report stronger dissatisfaction (15.3 percent) compared with trainees
(11.9 percent). Although numbers were small, dissatisfaction among trainees
appeared concentrated in fully on-the-job arrangements.
Trainees were more than twice as likely to have been formally assessed at work (36.2
percent) than apprentices (14.8 percent), with 26 percent of trainees claiming to have
been assessed by ‘an accredited workplace assessor’ and 10.2 percent by ‘some other
external person’. The respective figures for apprentices were 5.4 percent and 9.8
percent. Trainees were also much more likely to have heard of a ‘training plan’ (32
percent) than were apprentices (8 percent), with New Entrants (38 percent) also more
likely than Existing Worker trainees (28.2 percent) to have heard of a plan. Trainees
were also more likely to have such a plan (25.2 percent) than apprentices (6.9
percent).
Overall, trainees were slightly more likely to state they received adequate feedback
from their employer (63.2 percent) than apprentices (59.3 percent). However,
apprentices were more satisfied with the feedback from their training provider (77.5
percent) than were trainees (69.7 percent).
Apprentices were more likely to indicate that they would undertake future training in
the same area than were trainees on average, but with New Entrants more likely to
state they would train in the future than were Existing Workers. Both apprentices (63
percent) and New Entrant trainees (57 percent) indicated similar intentions with
respect to the current area of employment, but New Entrants were more definite (26
percent) than apprentices (14 percent) that they would undertake additional training
outside the current apprenticeship/traineeship area.

47
A much higher proportion of trainees than apprentices received fully on-the-job
training. Only 6.2 percent of apprentices undertook training fully on-the-job
compared with 54.7 percent of trainees. The formal training arrangements such as
training plans and assessments against competencies are provided for apprentices in
their off-the-job training received in training institutions such as TAFE NSW. With
apprenticeships, the knowledge transfer from the employer or co-workers to the
apprentice on-the-job is based more on implicit knowledge, as the apprentice is either
working directly with an employer who went through an apprenticeship or with co-
workers similarly trained.
However, both groups expressed similar levels of general satisfaction with training
arrangements, with 85.6 percent of apprentices and 86.2 percent of trainees either
‘very satisfied’ or ‘fairly satisfied’ with their training. Offsetting the generally similar
levels of satisfaction with training and overall employment arrangements by
apprentice and trainees is the fact that trainees have a far higher non-completion rate,
averaging around a 40 percent drop-out rate per annum. This compares with around
40 percent for the overall apprenticeship system or around 10 percent per annum.
EMPLOYERS’ SURVEY
The principal aim of the survey was to investigate employers’ perceptions of the quality
of training provision in NSW, identify the extent and type of on-the-job training and
assessment, explore employer preferences for nominal duration or time served for
vocational training, and gauge the extent of knowledge of employers of the training
system and recent changes to this system.
A telephone survey of employers was undertaken to investigate these issues. The survey
comprised two distinct sample frames. The first sample frame, called the study group,
included NSW employers registered with the NSW Department of Education and
Training as currently employing apprentices and/or trainees in a range of broad
occupations. The second sample frame, called the control group, was drawn from NSW
employers who had not employed apprentices or trainees for the past five years. Both
sample frames were stratified according to metropolitan or regional occupation and by
selected occupation. A total of 543 workplaces were included in the sample frame of
whom 332 workplaces responded, yielding an overall response rate of 61 percent. Of the
total responses, 163 were from the study group and 169 from the control group.
The key findings of the survey are:
39 percent of workplaces for the combined control and study group workplaces had
an accredited workplace trainer. There was no statistically significant difference in
the propensity to have a workplace trainer between the study and control groups.
29 percent of all workplaces had an accredited workplace assessor. There was no
statistically significant difference in the propensity to have an accredited workplace
assessor between the study and control groups.
The study group had more difficulty recruiting skilled workers compared to the
control group, with 51 percent of the study group reporting they had such recruitment
difficulties over the previous 12 months, compared to 39 percent of the control group

48
reporting such difficulties. This difference could be largely explained by the fact that
the study group experienced much greater employment growth over the previous 12
months compared to the control group. 36 percent of the study group reported
increased employment over the year compared to 22 percent of the control group.
A number of different strategies were used by workplaces to ensure a sufficient
supply of skilled labour. 21 percent of workplaces solely recruited skilled workers
rather than training existing or new workers. 9.7 percent of workplaces trained only
existing workers to meet skills needs. 9 percent of workplaces only trained new
workers to meet skills needs. 8.5 percent of workplaces used a combination of all
three strategies. 5.5 percent of workplaces relied solely on labour hire companies,
with a further 8.5 percent of firms using some other strategy in combination with
labour hire. In total, 14 percent of workplaces used labour hire as the sole strategy or
as a contribution to meeting skill shortages.
Employers generally had quite low assessments of their knowledge of the training
system and of recent changes to the system. As would be expected generally, the
knowledge of the training system was higher among the study group, that is, those
who employed either apprentices or trainees. The finding that employers rated their
knowledge of the training system quite low is consistent with earlier research reported
in this study that employers’ knowledge of the training market was thin.
A four point scale was used for employers to self-assess their level of knowledge. The
four points were ‘a lot’, ‘enough’, ‘a little’ and ‘don’t know’. The proportion of
employers in the study group who either knew ‘a little’ or indicated ‘don’t know’
about aspects of the training system included: 62 percent about Competency Based
Training; a similar percentage about the new Training Market; 67 percent about
Flexible Delivery; 72 percent about User Choice; 70 percent about New
Apprenticeships Centres; 66 percent about Training Packages; 70 percent about
Training Plans; 76 percent about the Australian Qualifications Framework; 37 percent
about Training Subsidies; 45 percent about Registered Training Organisations; and 18
percent about what was required of employers during the training of apprentices or
trainees.
Overall, employers rated the performance of their training providers positively. 52
percent of employers were ‘very satisfied’ and another 33 percent were ‘satisfied’
with their training provider. 15 percent were either ‘dissatisfied’ or ‘very dissatisfied’
with the performance of their training provider.
25 percent of employers found the current training arrangements to be relatively
complex, with another 3 percent rating the system ‘very complex’. This supports the
sentiments expressed in the project’s survey of vocational education and training
stakeholders. In addition, 40 percent of employers in the study group found the
experience of obtaining a training subsidy to be ‘relatively complex’ and a further 16
percent found it ‘very complex’. 44 percent found the process ‘fairly easy’.
On balance it would appear that the study group saw no change in the quality of the
training system over the last five years. 25 percent thought the quality was ‘higher’,
24 percent thought it ‘unchanged’ and 8 percent thought it was ‘lower’. 42 percent
were ‘not sure’ whether the quality had improved or declined.
When asked the most important criteria they used in selecting apprentices or trainees
directly from school, employers gave a number of responses. Interest in the

49
occupation, previous work experience, and literacy and numeracy were all identified
as important single criteria. Interestingly, vocational qualifications gained at school or
practical courses done at school rated quite low in employers’ selection criteria.
54 percent of the study group employers reported they were not aware of the
difference between time served and nominal duration for apprentice training. This is
consistent with the low percentage expressing knowledge of Competency Based
Training.
53 percent of employers in the study group favoured Competency Based Training
(CBT) over fixed period training. The interpretation of this result is somewhat
difficult given the finding that employers’ knowledge of CBT is limited.
Earlier in this report the possibility was raised that, with the extension of traineeships
into trade-based occupations, the substitution of trainees for apprentices might be
occurring and that this could contribute to the decline in apprentice training. The
Employers’ survey found only 3 percent stating they had employed a trainee in a
position previously filled by an apprentice.
Employers of trainees have a much greater propensity to use Group Training
Companies (GTCs) than employers of apprentices. 68 percent of employers of
trainees used GTCs for some or all of their trainees, compared to 48 percent of
employers of apprentices.
26 percent of firms employing apprentices had employed an adult apprentice over the
last five years, compared to 70 percent of firms employing trainees who had
employed an adult trainee.
Earlier in this report it was noted that trainees have a far higher non-completion rate
than apprentices. This finding is supported by the employers’ survey, with 45 percent
of employers of trainees reporting a trainee had failed to complete their training. 37
percent of employers of apprentices reported an apprentice had failed to complete
their training.
91 percent of apprentices received off-the-job training compared to 62 percent of
trainees. Close to 100 percent of apprentices’ off-the-job training is supplied by
TAFE NSW. Of trainees receiving off-the-job training, 75 percent was provided by
TAFE NSW. These estimates are similar to estimates of the extent of on-the-job
training provided by this project’s mail survey of apprentices and trainees.
A high proportion of employers (90 percent) reported that the training provided by
external training bodies, whether delivered on or off-the-job, was relevant to the trade
or traineeship.
One third of workplaces with apprentices did not have a copy of a Vocational
Training Order for the apprentice, compared to 17 percent of workplaces which did
not have a Vocational Training Order for the trainee.
The results of the employer survey support the earlier findings that employers of
trainees have a higher propensity to institute formal training arrangements in the
workplace compared to employers of apprentices. In turn, this reflects the fact that
38.3 percent of trainees received fully on-the-job training, compared to only 9 percent
of apprentices. 68 percent of employers of trainees had a training plan, compared to
31 percent of apprentices. For employers of trainees with a training plan, 83 percent
had competencies included in the training plan, compared to 50 percent of apprentice
training plans.

50
V LITERATURE REVIEW AND DISCUSSION OF ISSUES
This section summarises discussion in the literature on two sets of issues:
a) key issues identified from the researchers’ analysis of trends in apprenticeships and
traineeships in NSW.
b) a review of the literature on this topic.
The section also focuses on the issues for research as identified in the tender brief for this
project.
LOW APPRENTICESHIP COMMENCEMENT RATES
In the 1990s New South Wales and Australia experienced strong economic growth,
especially in sectors such as construction and, to a lesser extent, manufacturing. These
sectors have traditionally been large contributors to the apprenticeship system. The low
rate of apprenticeship approvals in New South Wales (and other states) during the period
of strong economic growth in the 1990s is, therefore, anomalous.
This issue of declining apprenticeship approvals is not isolated to Australia, but has been
a feature of many countries which have apprenticeship systems, including Great Britain
and the US. It has also been the subject of considerable international research (Gospel
1993, 1994).
EXPLANATIONS OFFERED FOR DECLINING APPRENTICESHIP RATES
The literature explaining the decline or stagnation of apprenticeship numbers can be
summarised as falling into two broad categories.
The first emphasises problems on the supply side of the training system, which are said to
inhibit employer investment in training. Problems cited include inflexibilities in the
system, such as in curriculum, delivery modes and administrative and regulatory
requirements, and declining quality of applicants.
The second category of literature on the subject emphasises demand side problems, such
as structural changes in the economy which reduce employer demand for training.
Changes cited include outsourcing, growth of labour hire, corporatisation of the public
sector and reductions in the average size of firms.
These differing broad interpretations of the causes of declining apprentice numbers have
significantly different implications for vocational education and training policy.
Those who criticise the supply side claim that further deregulation of labour markets and
training systems, breaking the historical connection between vocational training and
employment, increased firm-specific training and shifting the cost burden of training

51
from firms to individuals are necessary conditions to lift the quantity and quality of
training.
The policy responses from the demand-side perspective are somewhat less clear cut, but
involve measures to redress the problems such as minimum apprentice-trades ratios in
government contracts. There are also potential responses to lift the participation of
labour hire firms in training, to improve the quantity and quality of training in Group
Training Companies, and to re-introduce pre-apprenticeship programs.
CRITICISMS OF THE SUPPLY SIDE OF VOCATIONAL AND EDUCATION TRAINING
In Australia, critics of the supply side are represented by the Department of Education,
Training and Youth Affairs and by writers such as Sweet (1990, 1995), and the
Australian Industry Group (1999). They argue that the apprenticeship system is in
decline due to a combination of factors, including the high relative wages of apprentices
and the ‘inflexibility’ of the system. Inflexibility is argued notably in terms of mandated
course content and time frames for completion of training, lack of choice over training
delivery methods, lack of competition in the provision of training, and inadequate focus
on the specific training needs of firms. A declining supply of suitable applicants for
apprenticeships is also said to be a causal factor.
Argument for the training/employment linkage to be broken, institution-based learning and the transfer of training cost to the individual
This line of analysis leads to a view that the historical foundation of the system, that is,
the link between structured training and employment, needs to be broken or significantly
altered. There are two aspects to this line of thought.
Firstly, training could become institutionally based, whereby an individual can study for a
range of vocational occupations at private and public colleges without contemporaneous
employment in the field of study.
Argument for transfer of training cost to individual
Secondly, it is argued that the individual must assume more of the cost burden of
training. The basis of this is largely pragmatic: that, if employers are unwilling or unable
to fund an adequate quantum of training, then it is up to individual employees to directly
fund this quantum. One of the underlying arguments for this proposition is that, with an
increasing proportion of the workforce engaged on a part-time, casual or contract basis,
individuals need to assume far more financial responsibility for their training, as
employers invest far less in training these types of labour compared to full-time
employees.
Argument for further deregulation of the vocational education and training system and move to firm-specific training
Finally, it is argued that the system of training wages, training providers and employer
choice of training content requires further deregulation. In addition, this school of thought

52
advocates a shift in the balance of training strongly towards firm-specific as opposed to
general or industry-specific training as a means of increasing employer demand for
vocational education in general and apprenticeships in particular. That is to say, they
argue that the content and delivery methods should be tied more directly to the needs of
particular employers.
Alleged decline in quality of applicants for apprenticeships
Another aspect of the supply-side argument is offered by Marshman (1996:24) and
others, that the quality of applicants for apprenticeships is declining.
There is little hard evidence on the long-term quality of apprentice applicants. Sweet
(1990:233) notes that, while school retention rates to year 12 have increase markedly,
there has not been a corresponding proportional increase in Year 12 apprenticeship
commencements. This implies that more academically able students are remaining in the
education system rather than electing to enter an apprenticeship.
Smith (1998:ix) cites a number of studies indicating that apprentices and trainees have
‘inadequate language, literacy and general reasoning skills’. This decline in the quality of
applicants creates significant learning problems, especially with the move away from
face-to-face teaching and the increased use of computer based and distance learning. It
has not been demonstrated, however, whether apprenticeship difficulty with off-the-job
formal training is a recent development reflecting declining intake quality or a long term
problem with apprentice intake.
DISCUSSION OF THE CRITICISMS OF THE SUPPLY SIDE OF VOCATIONAL EDUCATION AND TRAINING
The above arguments may be rebutted on a number of grounds.
General, not firm-specific, skills required for labour market
While flexibility needs to be an important feature of any training system, it needs also to
be recognised that an undue emphasis on firm-specific training contradicts one of the key
economic rationales for the provision of public funds for vocational training. A key
rationale for the provision of public funds for vocational education and training is that
there are significant economic benefits to society as a whole in providing workers with
general and/or industry specific skills. General skills are the broad range of vocational
skills that are necessary for undertaking work either for a particular employer, for the
industry or even the economy as a whole. Individual employers, it is argued, will not
invest in general skills, as they will not necessarily reap the returns from such
investments since workers can freely contract with other employers. (Another way of
expressing this is that there is market failure in the private provision of general, as
opposed to firm-specific training). The benefits to society from the investment of public
funds in general skills are, firstly, an improvement in the quality and productivity of the
workforce and, secondly, an increase in the efficiency of the labour market by improving
the inter-firm and inter-industry mobility of labour. This mobility of labour is essential

53
for the economy to adjust in the face of structural change and gain the benefits of an
efficient allocation of labour resources.
The Australian labour market for trades has traditionally been one with high labour
mobility. This high intra- and inter-industry mobility is based on formal and informal
recognition of the equivalence of trades qualifications and experience by employers
(Curtain 1987:28-29). This essential aspect of the trades labour market could be lost if
training becomes overly firm-specific (Buchanan and Callus 1992). This mobile and
‘occupational’ labour market is due to a number of factors, notably the small size of
Australian firms, which has precluded the development in the private sector of extensive
‘internal’ labour markets (Curtain 1987).
Conclusion/comment
The promotion of increased firm-specific training could lead to reduced labour market
efficiency, since it creates barriers to labour mobility.
Individual’s interest dictates balance of firm-specific and general skills
Further, such a view is based solely on the interests of the employer and ignores the
interests of the apprentice or trainee. By accepting a 'training wage' the person
undergoing training is also investing considerable time and forgone earnings in the
acquisition of marketable skills.
It is only equitable that a person undergoing training receive an appropriate balance
between firm-specific and general skills, given that they can expect to have multiple
employers over their working life. The need for an appropriate balance has also been
recognised in the recent National Evaluation of User Choice Phase 2 (ANTA 1999).
Conclusion/comment
Given these traditional arguments for the provision of public funds for vocational
training, the view that training should become more focused on firm-specific training is
problematic.
Arguments against greater deregulation of training market to enhance employer choice of training provider and content
Arguments advocating the greater deregulation of the training market as a means of
encouraging the enhanced employer choice of training provider and training content are
also open to question. The decision of the Australian National Training Authority
Ministerial Council (MINCO) on User Choice Policy of May 1997 has been implemented
differently in different states. While the NSW approach has been relatively gradualist,
even cautious, compared to other states such as South Australia, a significant increase in
the choice of training provider available to NSW employers has occurred. The traineeship
market is a totally open market and in 1998 the apprenticeship training market for five
trade areas, automotive (light vehicle mechanical), carpentry and joinery, cookery,
electrical (fitter-mechanic), and plumbing, was opened up to competition in metropolitan
Sydney, the Illawarra and the Lower Hunter. Since January 2000 another five
apprenticeships have been added to the open market arrangements in the metropolitan

54
areas: automotive (panel beating), shop fitting and joinery, engineering (fabrication),
meat processing (retail) and bricklaying.
Limited entry by private providers into traditional trade training
Interviews conducted by the Australian Centre for Industrial Relations Research and
Training, University of Sydney, (ACIRRT) with manufacturing and engineering
employers in April and May 2000 indicated that their familiarity with private providers
was very limited indeed. Most believed that private providers would be very unlikely to
be able to provide comprehensive trade training owing to high capital costs and felt that
private providers had little potential role in metals and engineering trade training.
Employers’ impressions appear to be borne out by the available data. Very few private
providers are registered to provide even AQF level II traineeships in manufacturing or
engineering in NSW. For example the Certificate II in Engineering - Production has just
thirteen non-TAFE providers registered to provide that training in NSW. The Certificate
II in Engineering - Production Technology has just six. Of these private providers most
are either Group Training Companies, community based training providers or the training
sections of large employers, such as Email, providing in-house training to their own staff.
When it comes to manufacturing and engineering apprenticeships the presence of private
providers is even more limited.
Conclusion/comment
Despite this very marked movement toward user choice in the NSW training market there
is little evidence that a significant number of private providers have moved in to offer full
apprenticeship trade training or traineeship training in the traditional trade areas.
Flexibility in delivery already exists
Another argument closely allied with this first school of thought is that employers are
seeking greater flexibility in training content. However, a very high degree of flexibility
in tailoring apprenticeship training is already available as a result of the introduction of
Training Packages. The packages are designed to allow employers, in close collaboration
with public or private providers, to choose from a wide range of available Competency
Standards Units to customise a training program (or set of competencies) that best suits
the employers’ work environment and skill needs. Moreover, with the proliferation of
flexible delivery methods and the accent on workplace-based training within the
packages, employers are also able to choose where the training is delivered. Employers
can already choose full workplace-based delivery, with their own supervisors being
‘mentored’ by TAFE teachers, or provided by accredited in-house trainers, TAFE trainers
or private providers in addition to the more traditional delivery methods.
Conclusion/comment
In sum it is difficult to see that the current system is hamstrung by inflexibility or a lack
of choice over the timing and methods of training delivery.

55
Claimed decline in quality of apprentice and trainee applicants
Anecdotally, employers maintain that apprentice and trainee applicant quality remains a
significant problem. Almost half of the employer respondents to the AiG’s Training to
Compete survey commented on problems associated with the lack of quality of applicants
(AiG 2000:18).
On the other hand, there is evidence that while there may be shortages of quality
applicants in particular regions or particular trades, (notably hairdressing and food trades
- butchers and bakers), there are several suitable applicants for each vacancy (DEWRSB
1998).
Image of trades and improvement in quality of applicants
On balance, it is the case that many trade fields, such as metals and engineering, do have
an ‘image problem’ and ‘no doubt the size and quality of the apprentice applicant pool
could always be improved’ (Hall and Buchanan 2000:8).
Claimed decline in quality of applicants does not account for long-term decline in numbers
However, for the proposition that declining apprentice applicant quality accounts for the
decline in long-term apprentice intake one or both of the following would have to be
empirically proven: it would have to be shown that either a substantial number of
apprenticeship vacancies remain unfilled due to an inadequate quantity and quality of
applicants and/or that employers are declining to advertise vacancies due to recruitment
difficulties. Neither of these has been demonstrated. Consequently, it is difficult to
maintain that an insufficient quantity and quality of suitable applicants accounts for long-
term declining apprentice intake.
Argument against need for more flexibility in training market to counter declining numbers
Furthermore, the argument that lack of ‘flexibility’ in the ‘training market’ is the primary
cause of long-term declining apprenticeship commencements is contradicted by a number
of important facts.
In Victoria, where deregulation of the apprenticeship system and the extension of a
totally open training market for the training of apprentices has been in place for several
years, the trend in Victorian apprenticeship commencements is no better, and on some
measures worse, than the NSW trend. For example, Victorian apprenticeship
commencements peaked at 18,169 in 1988-89 and then gradually recovered to a high of
11,605 in 1998-99 or only 65 percent of the peak (derived from Schofield 2000:A-29).
In NSW by contrast, apprenticeship commencements peaked at 19,413 in 1989-90 and by
1998-99 had recovered to 14,751, or 76 percent of the peak.
Secondly, the advocates of the ‘inflexibility’ and supply-side explanation need to account
for widely diverging trends in commencements across a variety of apprenticeships. If the

56
absence of a robust apprentice training market in NSW, excessive apprentice wages and
declining applicant quality ‘explain’ declining apprentice intake in metals, vehicle and
hairdressing, why do these factors not apply in food, construction and horticulture? Food
has experienced rapid growth, with construction and horticulture having steady
commencements.
DEMAND-SIDE EXPLANATIONS OF DECLINING APPRENTICE NUMBERS
In contrast to the ‘supply-side’ deficiencies interpretation of declining apprentice
numbers, the ‘demand-side’ explanations emphasise the role of structural changes in the
economy in reducing employer investment in training in general and apprenticeship
training in particular. These changes include an interacting and reinforcing set of factors,
such as
greatly increased competition leading to downsizing of firms and contracting out of
work growth of labour hire companies
increase in the proportion of small firms, and
privatisation and corporatisation of public services.
As demonstrated earlier, the latter has led to a major reduction in the direct contribution
of the public sector to apprentice employment.
Some of the major structural changes include:
Corporatisation and privatisation of activities by all levels of government
Toner (1998) found that over the period 1986 to 1996, NSW Government (including
Government Business Enterprises) apprentice intake declined by 76 percent. The State
Government used to be a major trainer of electrical (21 percent of all apprentices in
1986), building (10 percent) and metal (9 percent). It was shown earlier that around 33
percent of the reduction in apprentice numbers over the 1990s was due to the large scale
withdrawal of all levels of government from apprentice training. The reason for this
withdrawal is largely due to the corporatisation or privatisation of state and
Commonwealth Government activities.
These changes in the ownership or legal structure of these entities led to changes in the
objectives of these entities away from a broad range of economic and social objectives to
a singular focus on improving the direct rate of return on the private or public funds
invested in the entity. Prior to corporatisation and privatisation many of the Government
Business Enterprises (GBEs), such as the Electricity Commission, Water Board,
Maritime Services Board, State Rail Authority and Qantas not only had extensive
apprentice training facilities, but saw it as their legitimate role to ‘train for their industry’
by employing more apprentices than would be offered positions at the expiry of their
indenture. Most of these would be subsequently employed in the private sector. Many
large private companies such as BHP and AGL adopted similar employment and training
practices in the regions in which they operated.

57
Growth of labour-hire and increased outsourcing of trades work
(ANTA 1998; Hall and Bretherton 2000; Construction Training Australia 1999). It has
been estimated that ‘the total number of workers working for labour hire operators could
be as high as 150,000’ (Hall and Bretherton 2000). Many of the industries which were
traditionally large employers of apprentices, such as manufacturing, construction, and
electricity gas and water are also disproportionately outsourcing production, maintenance
and other services (AWIRS95 Panel Data).
The significance of this outsourcing of trade–based work to labour hire companies is that
‘labour hire firms primarily rely upon the pool of skilled people in the labour market, and
are not large providers of formalised training of the type involved in the traditional
apprenticeship’ (ANTA 1998:1). The growth of labour hire, in turn, reflects increased
competition and the need to reduce costs. Related to this is the ‘downsizing’ of firms with
a smaller ‘core’ full-time workforce and the growth of a ‘peripheral’ workforce
comprised of labour hire employees and other part time or casual employees.
The labour hire industry in Australia has been estimated to be growing by 15-20 percent
per annum (Hartig 1999). In 1999 the AiG estimated that there were over 1,000 labour
hire firms operating in New South Wales, Queensland and Victoria with over 400 of
those in NSW alone (AiG 1999). The growth of labour hire is having a deleterious effect
on employer-funded trade level training. Research undertaken by ACIRRT (the
Australian Centre for Industrial Relations Research and Training at the University of
Sydney) in 1999 examining the effects of labour hire, outsourcing and contracting-out on
training has indicated that many employers are choosing to hire in skilled tradespeople as
they are needed rather than choosing to take on apprentices (Hall and Bretherton 2000).
This echoes the findings of earlier research (Marshman 1998:27). All the major
motivations for outsourcing or using labour hire - flexibility in meeting peaks in demand,
having access to specialist skills as required, introduction of greater ‘market discipline’
on a firms’ existing workforce, cost reduction and lower labour cost overheads
(Domberger 1998:51) - are consistent with an employer aversion to increasing training
expenditure.
Conclusion/comment
The growth of the labour hire industry, contracting-out of work and downsizing in the
private and public sectors are, at least in the medium term, mutually self-reinforcing in
that reducing a firm’s full-time core employment increases its demand for contract staff
and, on the supply-side, ‘downsizing and outsourcing means there has been an increase in
the number of skilled workers available to labour hire firms’ (ANTA 1998:46).
Nevertheless, in the longer term there is a very real danger that deficits in trade training
will lead to serious trade skill shortages. We face the prospect of ‘existing skill shortages
and skill gaps becoming much worse as the combined effects of declining apprenticeship
numbers, less formal structured training and the outsourcing of many skilled functions
impact on the labour market’ (Hall et al. 2000:viii).

58
Reduction in Firm Size
Downsizing and outsourcing The reduction in average firm size due to downsizing and the outsourcing of work to
smaller specialist firms is also directly linked to a reduction in investment in training.
Some indication of the growth of small firms is that between 1983-84 and 1994-95
firms with less than 20 employees contributed 53 percent of net employment growth.
This contribution to growth is much higher than the small business share of total
employment, which was 33 percent in 1994-95 (Industry Commission 1997:ix).
Effect on propensity to train and intensity of training The significance in the growth of small firms and the reduction in the average size of
firms in the economy is that both the propensity to train and the intensity of that
training increases with firm size.4 With respect to training intensity, in the private
sector in 1996, firms with more than 100 employees spent 3.4 times more on
structured training than firms with less than 20 employees. With respect to training
propensity, the proportion of firms providing structured training is 6.6 times greater in
larger firms than smaller firms (ABS 6353.0: Table 4.1).
Other research confirms the link between firm size and in-house formal training, in
particular, Wooden 1996. On the specific issue of the relation between firm size and
apprentice training, ‘it is well known that large firms are more likely to provide
formal training, and this extends to apprenticeship training. There is also a positive
correlation between firm size and the absolute number of apprentices employed’
(Dockery, Koshy and Stromback 1996:14).5
More small firms, fewer large firms in construction In the construction industry, for example, there has been a very substantial increase in
the share of employment and output from small specialist subcontractors. Over the
seven years to 1996-97 the share of total employment in firms employing less than
five persons increased from 42.6 to 68.6 percent. All of the employment growth over
the period occurred in businesses with less than five employees. Employment in
larger firms actually declined, with the level of employment in firms with 20 or more
employees falling by more than 50 percent.
Intake rates of construction apprentices Over the period 1985-86 to 1997-98, the flow of annual intake of construction
industry apprentices as a share of the stock of tradespersons in the Australian
construction industry averaged 3.34 percent. Over the more recent period 1994-95 to
1997-98 the annual construction industry apprentice intake as a proportion of total
4 Training propensity is the proportion of firms in a given firm size category (measured by the number of employees) who engage in structured training. Training intensity is a measure of training effort per
employee, measured by dollar expenditure or hours of structured training provided to each employee. 5 'However, for those firms which do train apprentices it is not clear that the number of apprentices trained
as a proportion of trade or total employment increases with firm size’ (Dockery, Koshy and Stromback
1996: 14).

59
employed tradespersons in the construction industry averaged only 2.4 percent. This
is approximately 30 percent less than the long-term average.
This reduction is anomalous, as the real level of construction output over the period
1994-95 to 1997-98 was higher than for any other four year period. The real level of
construction output in 1996-97 was 11 percent higher than that in 1988-89, though the
number of new building apprenticeship starts was 2.2 times greater in 1988-89 than in
1996-97.
Conclusion/comment on effect of reduction in firm size
It is argued that the reduction in firm size is a significant factor in the reduction in
apprenticeship training effort in the construction industry.
In addition, smaller specialist firms are unable to provide the range of work experience
necessary to create a well-rounded tradesperson. Such increases in specialisation are also
a factor in the reduced demand for apprentices (Toner 1999; Construction Training
Australia 1999).
Increased Competition
Shorter contract cycles Marshman (1996) and others have highlighted that, due to factors such as tariff
reduction and globalisation, the intensity of competition has increased, resulting in
‘unpredictable and shorter contract cycles. This has introduced uncertainty about the
future which makes employers reluctant to enter into the 3-5 year contract involved
in the employment of apprentices. Apart from not having the capacity to carry the
additional cost, they do not want to have to put them off if contracts do not
eventuate’ (Marshman 1996:12). Although not properly explained by Marshman and
others, the move to shorter contract cycles reflects a number of factors, with the most
important being widespread use of Just in Time (JIT) production methods.
Just-in-time production and delivery methods Under JIT suppliers of components and/or services enter into ‘open ended contracts’
in which there is no guarantee of a fixed quantity of work over a given period. JIT
offers considerable competitive advantage through cost savings, especially reduced
inventory holdings. It is also a method of shifting the risk of market fluctuations
from the purchaser of a good or a service onto the supplier, as the purchaser is not
locked into a long term contract. Such long term contracts may leave the purchaser
with unsold goods in the event of an economic downturn. However, JIT production
methods make it difficult to provide the continuity of work required for an
apprenticeship and they are also a factor in the growth of labour hire. Nearly 50
percent of employers identified meeting peak production demands as the main reason
for the use of labour hire (ANTA 1998:26).
Effect of globalisation and increased competition on profit margins Globalisation and the increasing intensity of competition has also had a very direct
effect on training expenditures. In trade-exposed areas of the economy, where the

60
effects of international competition and globalisation are most acutely felt, employers
have reported that tighter margins have simply left little capacity to invest in the level
of training (especially trade training) that they would like. A major study undertaken
by ACIRRT (the Australian Centre for Industrial Relations Research and Training at
the University of Sydney) into the effects of globalisation on training recently
concluded that one of the major problems was that ‘increasing competitive pressure
[was] exacerbating employers’ traditional failure to make an adequate commitment to
training and skills development’ (Hall et al 2000:viii).
Technological Change
There are some instances where technical change in the production process or longer
maintenance intervals due to improvements in the quality of products have reduced the
demand for skilled trades labour. Falling demand for certain trades in the printing
industry is an example of the former, while improvements in motor vehicle reliability is
an example of the latter.
Such technological change would appear to be a relatively minor element in the long-
term decline in overall apprentice intake.
Interestingly, there would appear, however, to be little evidence that the reduced
apprentice intake is due to technological ‘de-skilling’. Even in industries such as motor
vehicle repair, which requires less maintenance input per kilometre for newer than for
older cars, there has been significant changes in the specific skill requirements and even a
degree of ‘upskilling’, associated for example with the introduction of electronic fuel
injection (DEWRSB 1999a:4; DEWRSB 1999b:3).
Conclusion/comment on effect of technological change
Technological change may have reduced the demand for skilled trades labour in
particular occupations and industries.
On the other hand, there is some evidence that changes to work organisation and
industrial structure are resulting in reduced demand for trade skills. As indicated earlier,
this is the case in construction, where increased specialisation across firms is limiting the
scope of work available to a firm. This limitation makes it more economical to employ
trainees or semi-skilled workers, as the firm does not undertake a sufficiently broad range
of work to warrant employment of a tradesperson or provide a suitable training place for
a broader-based apprenticeship.
Growth of Casual and Part-Time Employment
In 1982, 13.3 percent of the workforce were casual employees, increasing to 26.4 percent
in 1999 (Campbell 2000). The significance of these changes in employment status for
training is that, even when one controls for a very wide range of personal, educational,
demographic, occupational and industrial variables, casual employees are much less
likely to have undertaken employer-provided training compared to full time employees
(VandenHeuvel and Wooden 1999:27, 43-45).

61
One consequence of these long term changes in labour market status of employees is that
'the growth of non-standard work implies that there may be a serious training deficit
emerging with respect to comprehensive trade and vocational training and more
generalist training’ (NCVER 1999:1).
Conclusion/comment on growth of casual and part-time employment
Significant growth of ‘non-standard’ working conditions such as rapid growth of part
time work, casualisation and multiple job holding have also restrained employer
investment in training (VandenHeuvel and Wooden 1999).
Substitution of Traineeships for Apprenticeships
Another possible factor in declining apprentice intake is the potential substitution of
traineeships for apprenticeships.
The NCVER (National Centre for Vocational Education Research) has noted that not
only has there been a massive recent increase in traineeships, but the huge increase in the
ASCO grouping “Labourers and Related Workers" is of particular significance as most of
the traineeships appearing in this group are trade-based. Some examples of trade-based
traineeships include automotive, painting, fitting, telecommunications installing,
slaughtering, printing, meat processing, carpet laying, panel beating and engineering
(NCVER 1998:7).
There has also been a very significant rise in trade-based traineeships in the construction
industry (Toner 1999).
It is not possible to quantify the growth of trade related traineeships. As explained earlier,
NCVER does not separately identify traineeships and apprenticeships in its data. DET
does not classify traineeships to trade ASCO classifications.
Traineeships may complement apprenticeships The increase in trade-based or trade-related traineeships does not, of course, prove
substitution. The relationship between growth of trade-related traineeships and
apprenticeships is likely to be complex. It could be that the growth in trade-related
traineeships is complementary to apprenticeships. This complementarity could take
two forms.
Firstly, the growth of traineeships could be leading to the extension of formal training
to workers who would otherwise not have received such training.
For example, within the Metals Industry Award, occupations classified to C14 and
C13, which includes persons such as trades assistants and process workers, can now
undertake training in Production Certificate AQF I or II. Workers could be receiving
both increased formal training and recognition of this training through the AQF
system.

62
It could also be complementary, in that employers may be using traineeships as a
means of assessing the quality and suitability of candidates for apprenticeship
training. If the worker successfully completes a lower level of training they may be
progressed through higher AQF levels. It could also be the case that the current
structure of subsidies creates an incentive for commencing a worker as a trainee and
progressing them through higher AQF levels, rather than commencing them at an
AQF IV or apprenticeship level. If this is the case, it may be that the decline in
apprenticeship intake may be corrected somewhat over time. This is discussed in
more detail in the section on Wages and Subsidies below.
Traineeships may reduce apprenticeships Alternatively, the increase in trainee numbers could be resulting in reduced apprentice
intake as employers decide to train only up to the level of skill required for their
particular workplace.
Prior to enhanced flexibility in the training system, if employers required a range of
trade and related skills, they were required to ‘purchase’ an indivisible block of
training as represented in a traditional apprenticeship. This could have resulted in
some employers over-investing in apprentice training. It is important, however, not to
over-estimate this effect as in many trade occupations there was both a considerable
amount of informal upgrading, as evidenced by the existence of classifications such
as second class metal tradespersons who acquired their skill on-the-job and the high
proportion of persons, up to 45 percent, working as construction tradespersons
without formal qualifications.
With the introduction of enhanced flexibility, however, the block of apprenticeship
skills has become divisible. If this is the case, it could be that more people are
receiving training and accreditation at a lower AQF and skill level.
Conclusion/comment on substitution of traineeships for apprenticeships
It is probable that all three effects may be occurring within and across industries. It may
be too early to fully determine what the net outcome of these effects may be. For
example, it could be that the reduction in training caused by the substitution of lower
level traineeships for apprenticeships (assuming it is occurring) is being offset by
employers ‘progressing’ trainees through higher AQF levels over time.
Apprentice/Trainee Wages and Subsidies
Apprentice/Tradesperson wage differential greater in Australia Sweet (1990, 1995) argued that apprentice wages in Australia are a relatively high
proportion of a tradesperson’s wage compared to other countries, such as Germany,
and this may account for the absence of significant long-term growth in apprentice
numbers in Australia.
In particular, Sweet argued that an expansion of the apprenticeship system outside of
the traditional trades, as for example occurs in Germany, may require a significant
widening of the apprentice tradesperson/adult worker wage differential in Australia.
63
Nevertheless, the argument is flawed in that the proportion of apprentices to
tradespersons in traditional fields, such as metals, is identical in Germany and
Australia (Sweet 1990:229).
Conclusion/comment on wage differential
In other words, the international differences in training rates in the traditional trades
fields do not appear to be affected by differences in wage differentials between
apprentices and tradespersons.
Measuring cost and benefits to employers of training apprentices There are also considerable methodological problems in accurately measuring the
costs and benefits of apprentice training.
A recent major study for example is based on the ‘[neo] classical assumption that
wages equal marginal product - we take the value of a tradesperson’s output as
equivalent to a tradesperson’s full wage (including on-costs and any allowances), and
the value of apprentice output as the respective proportion of this amount’ (Dockery
et. al. 1996:4). This approach led to the finding that over the full four years of an
apprenticeship the average net benefit to the employer from taking on an apprentice
was marginally over $1,000. For many trades, including building, printing and
horticulture, the apprentice over the full four years is a net cost.
These results, however, were contradicted by employers’ assessments of the cost or
benefit of employing an apprentice, with around 80 percent indicating that they
thought apprentices were a ‘net financial benefit over the full term’ (Dockery et al.
1996:8). Dockery notes that the reason for this discrepancy is mainly due to the
method used in the study for calculating the value of output of an apprentice. This
method, it is arguable, significantly under-estimates the value of the apprentice
output.
Furthermore, the ‘overwhelming response’ of employers was that they ‘would not
support a fall in apprentice wages’ on the basis of equity (they are already very low)
and a reduction in the quality of apprentice recruits that such a reduction would lead
to. (Dockery et al. 1996:8).
One might also note that studies such as this assume that the decision facing an
employer is either to employ an apprentice or no one else at all. They also assume
that an apprentice does only trades-related work. Anecdotally, in their first few years
an apprentice is expected to a do a broad range of cleaning, purchasing and some
labouring duties. It is possible that, even if no apprentice were employed, either an
existing tradesperson would be required to do these duties, which is a comparatively
inefficient use of their time, or a junior would need to be taken on to perform these
duties.

64
Thus, studies such as the above, which assume that the decision to employ an
apprentice is determined by wage relativities between apprentices and tradespersons
greatly over-simplify the multiple choices facing employers. Employers could, for
example, face a complex decision process entailing a choice between a skilled
labourer, an apprentice or a tradesperson, with multiple and over-lapping criteria for
selecting between these labour categories.
Effect of subsidies on decision to engage apprentices Another important finding was that, for private employers, subsidies had a very minor
effect on their willingness to engage an apprentice. A recent major report for the
former Federal Department of Employment, Education and Youth Affairs found that
variations in the level of ‘apprentices employed and apprenticeship commencements
… at the aggregate level is, at best, a small effect of the subsidies and this is in line
with previous studies’ (DEETYA 1997:103).
This study also confirmed the finding of many other similar studies that demand is the
dominant explanatory variable in employers’ decision to hire more labour. That is to
say, the firm has to have a level of output and sales to justify employing an additional
worker and, in most cases, the value of a subsidy is only a small proportion of the
direct and indirect costs of employment (Toner 1989).
Effect of subsidies on Group Training Companies A complicating factor is the effect of wage/training subsidies on Group Training
Companies (GTCs). Changes in the level of subsidies may have a much larger effect
on the capacity of GTCs to employ apprentices given that that subsidies represent a
much larger proportion of GTC income than an average private sector firm.
Effect of subsidies on engagement of existing worker trainees These findings regarding the effect of wage subsidies may assist to explain the very
rapid growth of Existing Worker traineeships. Since by definition the worker is
already employed, that is to say, the costs of the employee are fully covered by the
output of the employee, any wage or training subsidy represents a net benefit to the
employer.
Effect of subsidies on decision to employ trainees While it is the case that subsidies may have a relatively minor effect on the level of
apprentice intake, a recent study found that subsidies have a greater effect on the
decision to employ trainees (DEETYA 1997:104). This is probably due to the fact
that a subsidy of a given magnitude represents a much larger proportion of the total
costs of employment, the shorter the period of employment of the person receiving
the subsidy.
Conclusion/comment on effect of subsidies on employment of trainees.
The structure of subsidies creates an incentive to employ trainees, given that trainees and
apprentices receive the same commencement and completion subsidy.

65
For example, AQF II, III, and IV have the same subsidy even though an AQF II may be
completed in one year and an AQF IV may be completed in 4 years.
Non-economic motives for taking on apprentices Finally, studies of the factors leading to the employment of apprentices invariably
find that ‘firms appear strongly influenced in their decision to hire apprentices by
what may be termed social or community influences, such as a perceived obligation
to provide training for young people and a sense of obligation to the trade’ (DEETYA
1997:49).
Conclusion/comment on cost as a factor in the apprentice engagement decision
Given the consistent results of studies, which show a large element of altruism on the part
of employers to provide entry level training; an apparent disregard for a rational
assessment of the costs and benefits of such training and a low responsiveness of intake
levels to subsidies, one study concluded in frustration that ‘by and large, the way in
which recruitment decisions are made for apprentices and trainees remains a mystery’
(DEETYA 1997:100).
Reliance on Skilled Migration
An important dynamic in the supply of skilled trades and the meeting of skill shortages is
skilled overseas migration.
Table 11 (see Appendix ) shows annual total settler arrivals for NSW and Australia and
the number of settlers in the ASCO trade classification.
It should be noted that possession of trade qualifications or being classified to a trade
occupation does not necessarily imply that settlers will work in these occupations in
Australia. Secondly, given interstate movements after the initial place of arrival, the
contribution of settler arrivals to a particular state’s skill base is uncertain.
Nevertheless, the data does offer some broad indications of the contribution of settler
arrivals to the NSW trades skill base. Over the six years 1993-94 to 1998-99, new settler
arrivals contributed the equivalent of between 22 to 37 percent of total apprenticeship
completions. Over the six years 1993-94 to 1998-99, new settler arrivals contributed the
equivalent of between 16 to 21 percent of total apprenticeship approvals.
Conclusion/comment on effect of skilled migration
On the basis of these preliminary and aggregated results it is not clear, however, whether
the contribution of settler arrivals has increased over the long-term or whether it is
becoming more or less important in particular trade groups.
It is possible that employers are becoming more reliant on settler arrivals as a source of
skilled trades, and this may be contributing to reduced apprentice training rates. A
comprehensive assessment of this issue would require more detailed empirical
examination.

66
However, even if it is assumed that there is a high rate of non-trades employment among
settler arrivals classified as belonging to trades occupations, it is clear that migration
accounts for very significant share of the new entrants to the NSW trades skills base
Note: Further research on this topic was commissioned by the NSW Board of Vocational
Education and Training from Phillip Toner, Employment Studies Centre, University of
Newcastle, one of the authors of this report. The report on this subsequent research has
been published by the Board as Impact of Skill Migration on Skill Formation and the
Labour Market (ISBN 0 7310 7789 X) in the same series as this publication.
VOCATIONAL SKILLS SHORTAGES
EVIDENCE OF SKILL SHORTAGES
The literature contains considerable evidence that a combination of reduced apprentice
intake over the 1990s, rising non-completion rates of apprentices, continuing high
wastage rates from the trades (that is, trades employees electing to work in other
occupations) and sustained economic growth over the 1990s, has resulted in significant
trade skill shortages.
The economic implications of these shortages are severe. “Skill shortages, if extensive
and sustained, can limit investment and growth opportunities, give rise to upward
pressure on earnings and, thereby, dampen the pace of economic and jobs growth and
make it more difficult to reduce unemployment’ (DEWRSB 1999a:2).
One recent Federal Government study found that ‘unless the underlying causes of trades
shortages are dealt with, shortages of specific trades are expected to persist, with
shortages becoming more widespread if relatively strong economic growth is sustained
over the medium term’ (DEWRSB 1999b:5). The DEWRSB National Skills Shortage
List identifies shortages across all trade areas, with notable shortages in metal,
automotive, electrical and construction.
The pattern of skill shortages in NSW is similar to the national pattern, if a little more
acute.
A DEWRSB (NSW) study of Occupational Labour Markets in NSW reported skill
shortages across a large number of trades: mechanical and fabrication engineering trades
(toolmakers, boilermakers, first class welders, sheetmetal workers), automotive trades
(mechanics and electricians, panel beaters and vehicle painters), electrical trades
(electricians, refrigeration and airconditioning mechanics), construction trades
(carpenters, fibrous plasterers, bricklayers, plumbers), food trades (chefs and cooks), and
among hairdressers and furniture upholsterers (DEWRSB 1999c).
EVIDENCE OF SKILL SHORTAGES IN APPRENTICE AND TRADE FIELDS
The former Federal Department Education, Training and Youth Affairs established a
National Industry Skills Initiative in collaboration with key employer representatives. To
date three Working Groups have submitted substantial reports. What is highly significant

67
is that the three reports exclusively highlight skill shortages and training quality issues in
the apprentice and trade fields (DETYA National Industry Skills Initiative 2000).
Similar arguments have been made in the NSW Department of Education and Training’s
recent Submission to the Senate Inquiry Into the Quality of Vocational Education in
Australia. The Department noted that skill ‘shortages have been identified in automotive,
engineering and electrical skills (DET 2000:8).
Comment
Unfortunately, however, the Department also notes that the Federal Government has not
responded to these problems and has, in fact, contributed to them. The ‘Commonwealth
has substantially reduced apprenticeship subsidies at a time when it has significantly
expanded and marketed shorter term traineeships’ (DET 2000:26). While vocational
skills shortages have occurred in earlier periods of sustained high economic growth, what
distinguishes the present period is the absence of any large scale Commonwealth activity
to specifically redress these shortages.
SKILL SHORTAGES AS AN OUTCOME OF A MARKET-BASED TRAINING SYSTEM
Furthermore, it is arguable that, to some extent, both the skill shortages and the absence
of special measures to redress them are the inevitable outcome of moves over the last
decade to establish a market-based training system. By the term market-based training
system we mean a system in which expenditure on public subsidies for employment and
training and the types of occupations receiving such subsidies are determined almost
exclusively by private sector employers and job growth within the private sector.
As argued above, a major cause of trade skill shortages is economic restructuring within
the private sector, which is reducing its capacity and willingness to invest in trade
training.
Comment
In other words, with a market-based training system, existing market failures in
vocational training are reinforced and not remedied. Such a training system does not have
a significant capacity to respond to strategic skill shortages which arise within the private
sector
NEED FOR SYSTEM TO MEET BROADER SKILL NEEDS
Aside from the issue of trade skill shortages there is the issue of the role of the vocational
training system in meeting broader skills needs. DET has argued that:
“If Australia is to compete effectively in the global economy, it will need to
increase the proportion of its workforce in more highly skilled occupations. There
is strong support for the view that the vocational education and training sector
should contribute much more than it has to date to the development of
‘knowledge workers’ for the new economy’ (DET 2000:8).

68
“The so-called knowledge economy ‘encompasses the large share of the economy
engaged in managing, processing and distributing information, typified by
industries such as banking, insurance, advertising and telecommunications as well
as by industries education, medicine, and law. Even traditional economic activity
like manufacturing is subject to significant technical change and demands the
abilities to perform the new kind of work that the technology makes possible’
(DET 2000:13).
TRAINEESHIP CONCENTRATION IN LOWER-SKILL OCCUPATIONS
However, as described in Section 3, a very large share of traineeships are in low skill
occupations. Of the total number of traineeship approvals in 1998-99, 41 percent were in
the lowest skill level (Skill Level 5), which includes occupations such as cleaners,
elementary sales workers, elementary service workers and factory labourers. In 1998-99,
only 262 trainees commenced information technology traineeship, or 1.2 percent of the
total traineeship approvals in that year.
Comment
The predominance of lower skilled occupations in part reflects the pattern of economic
re-structuring. Over the last two decades there has been a bifurcation in the labour
markets of developed economies with a large increase in the demand for highly skilled
labour and a growing proportion of the workforce in lesser-skilled jobs. The latter have
static or falling real incomes (Reich 1991; Wood 1994).
DECLINE IN MIDDLE-SKILL OCCUPATIONS
One study in Australia found that, over the period 1993 to 1999, employment shares of
high and low-skilled occupations had increased and there was a marked decline in the
share of middle skill occupations.6 Employment growth has occurred among
professionals and associate professionals at one end and elementary and intermediate
clerical, sales and service workers at the other (Cully 1999:101). One reason for this
bifurcation in the labour market in terms of skills and earnings growth is a decline in the
absolute number of middle level skill jobs in manufacturing. Other factors include
reduced middle level employment in public administration and public utilities. Private
sector ‘down-sizing’, such as that occurring within the finance and insurance sector, has
also reduced middle level clerical and management occupations.
Comment
The significance of this hollowing out of middle level skills is that much of the
‘employment growth in Australia between 1985-86 and 1996-97 has been occurring in
industries that pay relatively low wages and … have low skill bases. Most of the
employment growth appears to have been in industries such as accommodation, cultural
6 Middle skill levels include tradespersons, advanced clerical and service workers. The basis for skill
comparisons is the Second Edition of the Australian Standard Classification of Occupations (ASCO),
which explicitly uses a notion of skill based either on qualifications as defined within the Australian
Qualifications Framework or a period of on-the-job work experience required for proficiency in a particular
occupation (Cully 1999).

69
and recreation and personal services, all of which pay relatively low average wages’
(Federal Department of Industry Science and Technology 1999:28).
TARGETING SOME TRAINEESHIPS TO HIGHER SKILL OCCUPATIONS
These developments have major policy implications for the traineeship program in NSW.
For example, if it is the goal of the vocational education and training system to actively
contribute to the growth of the ‘knowledge economy’, it may be that mechanisms other
than traineeships are the most efficient vehicle to achieve this goal. This is not only due
to the predominance of low skilled occupations in traineeships, but also because a move
to target higher skilled entry level occupations would clearly disadvantage those in the
youth labour market who, on account of, for example, poor educational attainment and/or
prior extended periods of unemployment, would be excluded from these higher level
positions.
Alternatively, some trade-off between equity and an active contribution to meeting the
skills of the knowledge economy may be acceptable.
Conclusion/recommendation
In this case the targeting of a certain number or proportion of traineeships for higher skill
fields may be appropriate.
OVERALL DISCUSSION OF VOCATIONAL SKILL SHORTAGES
As described above in Section III, the number of trainee approvals in NSW now exceeds
the number of apprentice commencements by around 44 percent.
It is interesting to note that a recent report on the apprenticeship and traineeship system in
Queensland put the case that ‘the current balance of apprentice and trainee numbers
[where trainees exceed apprentices] does not represent the most effective scenario for the
long term effectiveness of the Queensland workforce … the quantum of trainees in
Queensland has now reached a level that demands some informed policy decisions
regarding the allocation of future monies and effort’ (Smith 1998:28).
OVERALL CONCLUSION/RECOMMENDATION ON VOCATIONAL SKILL SHORTAGES
In the light of the significant decline in apprentices in-training and apprentice training
rates, and widespread trade skill shortages, consideration should be given to a re-
allocation of scarce educational resources from the traineeship system to improve the
intake and completion rates of apprentices.
(Measures to reduce the wastage rate of employed tradespeople are outside the scope of
this research project).

70
TRAINEESHIP NON-COMPLETION RATES
HIGH RATES OF TRAINEESHIP NON-COMPLETION
The high rates of traineeship non-completion noted above in Section III have been a
continuing feature of the traineeship system since its inception in 1985. Notwithstanding
the numerous changes in objectives, program design, target group and subsidies,
traineeship non-completion rates have been at or above 40 percent for the last fifteen
years (DEET 1993; DETYA 1999:1). A recent study of traineeship non-completion found
that the ‘rate of non-completion of traineeships is of the same order as the rate among the
general population for separation from employment within a year of commencing a job’
(DETYA 1999:14).
TRAINEE NON-COMPLETION RATES COMPARED WITH THOSE OF APPRENTICES
Nevertheless, traineeship non-completion rates are far higher than other forms of
education and training. For example, the annual drop-out rate of apprenticeships is
around 10-12 percent (DETYA 1999:14). The report found that the traineeship rate of
non-completion ‘is a cause for concern’, implying that a considerable number of
individuals who could benefit from traineeships fail to do so and/or that traineeship
intakes include a considerable number of individuals who are unsuited for traineeships
(DETYA 1999:17).
DETERMINANTS OF TRAINEESHIP NON-COMPLETION
The major determinants of traineeship non-completion are the personal characteristics of
trainees, especially low educational attainment, young age on commencement and prior
extended duration of unemployment (DETYA 1999:22).
Controlling for the personal characteristics of trainees, the ‘traineeship type’ is also an
important determinant of non-completion. There are very high non-completion rates for
small business, tourism and hospitality (DETYA 1999:26).
Another key variable is that both of these traineeships ‘allow training to be undertaken
entirely on-the-job’ (DETYA 1999:37). DETYA is currently investigating this variable. It
should be noted that as far back as 1993 DEET identified deficiencies with the quality of
traineeship training delivered in on-the-job mode (DEET 1993:viii).
It is important to note that that the 1999 evaluation found that, even after eliminating
those variables which most adversely affect completion rates, including personal
characteristics of trainees, traineeship types and the mode of delivery of training, the non-
completion rate of traineeships is still high (DETYA 1999: 23, 26). On the basis of the
DETYA study it is estimated that eliminating those variables which most adversely affect
completion rates would probably have improved completion rates by between 5 to 10
percent. (The DETYA study was based on a cohort of trainees for 1996 in which the
overall non-completion rate was 44 percent).

71
MEASURES TO IMPROVE COMPLETION RATES
DETYA identified a range of measures to improve completion rates that could usefully
be considered by the NSW Department of Education and Training. Some of these
include:
improved selection of trainees to exclude those at risk of non-completion
improved information for trainees on wage levels
improved information for trainees on and the nature of the work to be
undertaken, and
assistance with trainees in re-commencing their training after having left a
traineeship.
TRAINEESHIP TARGET GROUPS AND OBJECTIVES
The measures identified above to improve the completion rate of traineeships raise a
number of key issues regarding the target group and objectives of traineeships. It is
possible to improve completion rates by excluding those labour market groups, such as
youth with low educational attainment and prior extended periods of unemployment.
Such modifications of the intake of trainees, however, have clear equity implications.
INCREASE IN PARTICIPATION RATE OF OLDER TRAINEES
Other research has also identified a rapid rise in older age group (25 years plus)
participation in traineeships. ‘The percentage of trainees accounted for by younger age
groups (15-20) has fallen from 77% in 1989-90 to 32% in 1997-98. At the same time the
number of trainees aged 25 or older has risen by 438% - from 12.1% to 53%’ (Smith
1998:vii).
Comment
A plausible explanation offered for this increase is ‘the possibility that some employers
might be using traineeships as wage subsidies for existing workers’ (Smith 1998:vii).
This large shift in the demographic composition of trainees has important implications for
the objectives of the traineeship program.
NEED TO DEFINE TARGET GROUP AND ROLE OF TRAINEESHIPS
There would seem to be a consensus that there is an urgent need to define the precise
target group and role of traineeships. Are they primarily
a training program to meet the skill needs of employers or
an employment program for those disadvantaged in the labour market?
If they are primarily a training program to meet the skill needs of employers then it would
seem sensible to be far more selective about entrants to traineeships so as to exclude
those groups, especially disadvantaged groups, in the labour market who have a
substantially higher probability of non-completion.
Alternatively, if the objective is primarily an expansion of employment opportunities for
disadvantaged labour market groups, then it would seem traineeships are poorly targeted,
given that Existing Workers now constitute around 30 percent of all current trainees.

72
Further, the traineeship program has poor outcomes for disadvantaged groups, given the
high non-completion rates for these groups.
Moreover, as explained above, it is unlikely that current training arrangements can satisfy
the need for the trade and higher skills which the market mechanism finds difficulty in
supplying, without targeting or special incentives.
Conclusion/recommendation on traineeship program objective
The researchers concur with Schofield (1999:6) that the primary objective should be
training and only secondarily employment.
QUALITY OF TRAINING
Considerable concern has been expressed regarding the quality of vocational training,
especially, but not restricted to traineeships. Some of the problems identified with the
quality of training outcomes include:
EFFECT OF EMPLOYER SUBSIDIES ON QUALITY OF TRAINING
The incentive structure of subsidies to employers and payments to New Apprenticeships
Centres (NACs) creates an inducement for Registered Training Organisations (RTOs)
and NACs to ‘seek to minimise the training obligations of employers in order to
maximise the take-up of traineeships’ (Schofield 1999:iii).
The NSW Department of Education and Training states that ‘Commonwealth
Government policies, in terms of managing incentives for employers and funding to the
states have tended to focus on job creation and rapid take up of Training Packages rather
than quality. There is risk that some employers will perceive apprenticeships and
traineeships as devices to secure wage subsidies rather than as training arrangements
supported by incentives and that they will not appreciate the nature of their contractual
obligations in relation to training.’ (DET 2000: 37).
INADEQUATE MONITORING OF ACTIVITIES OF NEW APPRENTICESHIP CENTRES AND REGISTERED TRAINING ORGANISATIONS
On the basis of a survey of employers and trainees in Queensland, ‘19% of trainees
receive no training from their RTO and many RTOs are minimising their obligations in
terms of delivery and assessment’ (Schofield 1999:iii). An audit of 33 RTOs holding user
choice contracts revealed a large range of contract breaches (Schofield 1999:30).
POORER QUALITY OF FULLY ON-THE-JOB-TRAINING
Particular concerns are raised about the quantity and quality of training delivered in fully
on-the-job mode.
Such a mode is considered to be inappropriate for AQF II-III training (Schofield 1999).
‘Concerns have been raised nationally that often employers do not understand their
responsibilities to provide training on-the-job … and poor quality training can result.’

73
Fully on-the-job traineeships are also believed to have the lowest completion rates (DET
2000:37).
Schofield recommends the withdrawal of state training funds for fully on-the-job training
(Schofield 2000:xii).
EMPLOYERS NOT AWARE OF ALL TRAINING OPTIONS AVAILABLE
The system of user choice, and in particular the assumptions underlying and necessary for
the operation of an efficient ‘training market’ are not in place.
For example, in other states approximately ‘two-thirds of employers were not aware that
they have a choice of RTOs’ and ‘43 % of employers were not given a choice of training
methods by the RTO’ and the ‘majority of apprentices/ trainees and employers do not
understand how to use a Training Plan’ (Schofield 1999:31). ACIRRT (the Australian
Centre for Industrial Relations Research and Training at the University of Sydney) has
found that employer ignorance of the purpose and operation of the Training Packages is
very widespread (Hall et al 2000:viii-ix). In September 1998, ANTA referred to
‘confusion and a lack of awareness of changes in the [User Choice] policy on the part of
the employers’ (ANTA 1998:25). While by 1999 they found there had been increasing
recognition of the principles of User Choice among employers, ‘a more sophisticated
rendition of User Choice’ still needed to be promulgated among employers (ANTA
1999:2).
TRAINING QUALITY AS A FACTOR IN VOLUNTARY NON-COMPLETIONS
An evaluation of traineeship non-completion found that 55 percent of trainees who failed
to complete their employment did so voluntarily. Approximately one-third of those who
left voluntarily did so due to ‘insufficient training’ provided in the traineeship.
Insufficient training was of particular concern in those traineeships with training
delivered fully on-the-job (DETYA 1999:32).
MONITORING QUALITY OF TRAINING
The statistical database and record keeping with respect to trainees and apprentices in
state departments of training is inadequate for the purpose of evaluating training quantity
and quality and other aspects of vocational education and training performance. The huge
recent growth in traineeship commencements has not been matched by State Training
Authority resources devoted to monitoring quality issues.
POSSIBLE QUALITY DILUTION OF CERTAIN AUSTRALIAN QUALIFICATIONS FRAMEWORK STANDARDS
In Section III, reference was made to the Australian Qualifications Framework (AQF) in
terms of occupational and skill structure of traineeships.
The objective of the traineeship system is ‘to target genuine entry-level participants only.
Trainees must be new entrants into the industry or have been employed in the industry for

74
no more than three months full-time or twelve months part-time.’(DET Apprenticeship
and Traineeship Training Program Guidelines 2000:5).
PREPONDERANCE OF AQF III AND IV COURSES
An analysis of traineeship approval data reveals that a large proportion of trainees are
undertaking AQF III and IV level courses. The preponderance of these higher AQF
levels appears anomalous, as the objective of the traineeship program is to deliver entry-
level training.
LOW SKILL OCCUPATION/HIGH SKILL LEVEL QUALIFICATION
This preponderance of higher AQF levels applies equally to occupations traditionally
regarded as low skill occupations, such as factory labourer, contract cleaner, security
guard, elementary sales and service and boning/slaughtering. According to the
Australian Standard Classification of Occupations (ASCO), these occupations are
classified to Skill Level 5, for which the entry level is either Year 10 education or an
AQF I formal training (ASCO Second Edition:9). These Skill Level 5 occupations
comprise around 40 percent of trainee intake.
According to ASCO, the possession of an AQF III certificate or above would result in
these occupations being classified to a much higher skill level, in fact to Skill Level 3.
That is to say, the possession of an AQF III or IV raises these occupations to the skill
standard of the ASCO occupations ‘Tradespersons and Related Workers ‘and/or
‘Advanced Clerical and Service Workers’. Entry to these occupations requires ‘a skill
commensurate with an AQF Certificate III or IV or at least 3 years’ relevant experience.
In some instances relevant experience is required in addition to the formal qualification’
(ASCO Second Edition:9).
An important corollary of these data is that, notwithstanding the fact that a growing
proportion of traineeships are at AQF III and IV, the occupations to which traineeships
are classified have not been adjusted over the years to reflect the apparently higher skill
standards entailed in these traineeships. In other words, if the AQF levels on average are
rising, why are the apparent skill levels of traineeships (as indicated in the rising
proportion of low skill traineeship occupations) declining?
There are a number of interpretations which may be placed on these data. Either the
general level of AQF formal training is not consistent with the objective of the
traineeship system, which is to provide entry level training, or the level of formal training
required for entry level positions has risen dramatically over the last five years since the
Skill Level framework was developed for ASCO.
PROBABLE DILUTION OF QUALIFICATION STANDARDS
More probable, however, is that the AQF system is producing a dilution of qualification
standards, leading to an inflation in qualification attainment without a corresponding
increase in skill levels. This problem of dilution of qualification standards arises because
there are no external referents or standards for the granting of particular AQF levels for
75
particular training courses. That is to say, a course requiring a low level of difficulty may
be granted the same AQF as a course having a high level of difficulty. Each industry, in
effect, sets its own standards.
EFFECT ON ARTICULATION AND MARKET SIGNALS TO STUDENTS
This problem and its implications for the training sector have been recognised by both the
NSW Department of Education and Training and industry groups (DET 2000:34). Some
of these implications include increased uncertainty for the granting of course credits, and
undermining the recognition and articulation system. The dilution of AQF standards
poses major problems for the goal of establishing a smooth, seamless transfer based on
mutual recognition of qualifications between the training and higher education sectors.
Secondly, the dilution of AQF standards sends the wrong market signals to prospective
students. The Australian Industry Group (AiG)has concluded that, given disparities in the
ease of attaining the equivalent AQF level certification across different industries,
individuals may be selecting ‘softer options’ to achieve a given level of qualification.
‘Young people particularly have access to other industry areas [outside of metals and
engineering] that can offer the same levels of qualification for a lesser period of time in
training’ (AiG 2000, Skill Shortages in Engineering: 23). They argue that an
apprenticeship may be less attractive to young people who can achieve an ‘equivalent’
apprenticeship AQF IV level by undertaking a shorter traineeship.
POSSIBLE DISTORTION BY FINANCIAL INCENTIVES FOR TRAINING
It is possible the rise in AQF levels may be driven by the financial incentives for training.
This is due to the fact that payment for training in off-the-job institution training or
distance training is based on a certain number of scheduled, or set, hours for the delivery
of courses. The number of scheduled hours differs across traineeship types and AQF
levels. Generally, the higher the AQF level for a course, the higher the number of
scheduled hours of training. The number of scheduled hours, however, is a nominal
figure, as actual course hours depend on the students’ attainment of the requisite
‘competence’ as specified in the Training Package. The assessment of the successful
attainment of competence is the responsibility of the registered training organisation
(RTO) delivering the training and receiving the fee for the training. It has been suggested
that this system creates an incentive for RTOs to ‘push’ higher AQF level training to
employers.

76
VI FINDINGS AND RECOMMENDATIONS
TRENDS IN APPRENTICESHIP APPROVALS7
Between 1985 and 1999 annual NSW apprenticeship approvals reached a peak of 19,414
in 1989-90 and a low of 12,086 in 1996-97. In 1998-99, apprenticeship approvals totalled
14,742. The volatility of the apprentice intake can exceed 20 percent a year.
A major finding of this report, confirming findings elsewhere, is that the 1990s saw a
fundamental break in the earlier strong relationship, evident from the 1960s to the 1980s,
between economic growth and rising apprenticeship intake. Even though most of the
1990s was a period of sustained economic growth in NSW, the level of annual apprentice
intake in the 1990s was below that in the 1980s.
The decline is especially evident in traditional trade fields such as electrical, metals and
automotive. The level of annual construction apprentice intake was relatively constant
over the 1990s, but this was against a background of sustained high levels of construction
activity, greatly exceeding that of the 1980s, and large increases in total employment in
the industry. However, there was significant growth in food apprentice intake over the
1990s with the hairdressing and agriculture/horticulture intakes remaining steady.
It is a key theme of this report, and of other literature on the topic, that the reduction in
the apprentice intake is contributing to current and prospective skill shortages in many of
the traditional trades. In summary, the trend of sustained and significant decline in many
of the core traditional apprenticeship fields, including electrical, metals and automotive,
has not been offset by growth in the food trades and the relatively steady number of
approvals in construction and the skilled agricultural trades. The net effect of these
movements has been a significant and sustained reduction in overall apprentice approval
levels.
There have also been large shifts in the last two decades in the occupational composition
of the apprentice intake. Between 1985-86 and 1998-99 the metals (mechanical and
fabrication) share of the total annual intake fell from 18 to 10 percent, electrical and
electronic fell from 15.5 to 13 percent, and automotive declined from 21 to 19 percent.
Construction trades increased their share of the total apprentice intake from 19 percent to
28 percent. However, this increase was not due to a rise in the number of construction
apprenticeships. Rather, the construction intake has remained relatively constant, while
the overall apprentice intake has declined, thus increasing the proportional representation
of this trade. The food trades share of the total apprentice intake increased from 9 to 14
percent, while agriculture/horticulture increased its share from 2.5 to 3.3 percent.
7 Approvals are defined as original applications to establish an apprenticeship which have been formally
approved by the NSW Department of Education and Training.

77
The apprenticeship system remains highly segmented by gender, with 89 percent of
females in-training8 in 1998 concentrated in two industries, hairdressing and food. This
segmentation and the shift in the long-term occupational composition of the total number
of apprentices in-training are the main causes of only a small decline in the proportion of
males among total apprentices in-training. Between 1983 and 1998 the share of males
among total apprentices in-training declined from 92.5 percent to 87 percent. Females are
concentrated in trades that have experienced significant growth over the long term,
especially the food trades.
DECLINING APPRENTICE TRAINING RATES
The total number of apprentices in-training in the late 1990s was the same in absolute
terms as the total number in-training in the late 1970s. Over the twenty one years from
1978 to 1998, the number of apprentices in-training has never experienced a period of
such sustained low levels as in the 1990s. This trend is the outcome of the sustained low
annual apprentice intake in most trades over the last decade.
While many trades have experienced declining in-training numbers, this does not by itself
tell us anything about the significance of these trends in terms of the adequacy of current
training levels to meet current and future skill demands. The key factor in determining
the adequacy of current training is an examination of training rates9 which shows that
over the nine years to 1998, the overall apprentice training rate declined from a peak of
15 percent in 1991 to a low of 11 percent in 1998. This represents a decline of 27 percent.
This decline is the result of the fall in the number of apprentices in-training, as the
number of tradespersons employed in the NSW labour market remained static over most
of the 1990s. There are marked differences in training rates across the trades, reflecting
circumstances peculiar to particular occupations and industries.
CAUSES OF THE DECLINE IN APPRENTICE INTAKE
After reviewing and evaluating the arguments and evidence, it was found that structural
changes in the economy that are adversely affecting the capacity of employers to invest in
training generally, and apprentice training in particular, can account for almost all of the
decline in both apprentice intake and training rates over the last decade. These key
structural changes include:
CORPORATISATION AND PRIVATISATION OF PUBLIC SECTOR ACTIVITIES
Public sector activities across all levels of government, such as electricity generation and
distribution, water and sewerage, railways, roads, airlines, and certain defence-related
8 In-training is defined as the total number of apprentices, or apprentices in a trade field, at a given point in time. It is in effect a four year moving total of the number of apprentices in contracts of training. 9 Training rates are defined as the ratio of apprentices in–training to total employment in the trade field.
The training rate measures the extent to which the trade is reproducing itself through the domestic
apprenticeship system.

78
functions, have been progressively privatised or corporatised over the last decade or
more. Prior to these changes in ownership or legal structure, these activities employed
between 10-20 percent of traditional metal, building and electrical apprentices. They now
account for less than 5 percent of annual apprentice intake in these fields. The reduction
in public sector intake accounts for around one-third of the decline in apprentice intake
over the 1990s.
GROWTH OF LABOUR HIRE AND OUTSOURCING OF TRADES WORK
An increasing proportion of the workforce is employed by labour hire companies. These
companies supply labour to a broad range of industries, but are especially important in
manufacturing, construction and utilities such as electricity, gas and water. These are also
the industries which were previously large employers of apprentices but are now the main
industries involved in outsourcing production, maintenance and other services. The
significance of this outsourcing of trade-based work to labour hire companies is that
labour hire firms primarily rely upon the pool of skilled people in the labour market, and
are not large providers of formalised training of the type involved in the traditional
apprenticeship.
The growth of the labour hire industry, contracting-out and downsizing in the private and
public sectors are, at least in the medium term, mutually self-reinforcing in that reducing
a firm’s full-time core employment increases the firm’s demand for contract staff. The
reduction in core employees also increases the number of skilled workers available to
labour hire firms.
REDUCTION IN FIRM SIZE
There has been a large reduction in average firm size due to downsizing and the
outsourcing of work to smaller specialist firms and this is directly linked to a reduction in
investment in training. The significance of the growth of small firms in the economy is
that the propensity to train and the intensity of training is markedly lower for small firms
compared to larger firms.10
These results also apply to apprenticeship training. In
addition, smaller firms are more specialised in the range of activities they undertake and
the skills they require of employees. Such small firms often elect not to employ
apprentices as they cannot expose them to a broad range of the necessary tasks and skills.
There has been no compensating increase in the training rate of larger firms.
GROWTH OF CASUAL AND PART-TIME EMPLOYMENT
Significant growth of ‘non-standard’ working conditions such as rapid growth of part
time work, casualisation and multiple job holding have also restrained employer
investment in training, as such types of jobs receive significantly less employer
investment in training than full-time permanent positions. This has had an effect on
apprentice intake.
10 Training propensity is the proportion of firms in a given firm size category (measured by the number of
employees) who engage in structured training. Training intensity is a measure of training effort per
employee, measured by dollar expenditure or hours of structured training provided to each employee.

79
In addition, there were a number of frequently cited arguments, relating to the analysis of
declining apprentice intake, for which the study found little supporting empirical
evidence. One argument proposed further labour and training market deregulation and the
other concerned the declining quality of applicants.
LABOUR AND TRAINING MARKET DEREGULATION
An important finding is that there was little evidence for the view that deregulation of the
training system and labour market has promoted apprenticeships or that additional
deregulation is a solution to declining intake in traditional trade fields. Employers
reported that apprentice wage levels were not an impediment to hiring and indeed did not
support apprentice wage reductions, as this would adversely affect applicant quality.
Similarly, there was no support for the argument that previous or current arrangements in
the apprentice labour market or training result in ‘inflexibilities’ which cause declining
apprenticeship levels. Such arguments are inconsistent with the fact that some
apprenticeships, notably in the food industry, have experienced sustained increases in
intakes. These apprenticeships are subject to the same type and level of regulation as
other apprenticeships which have experienced decline.
In addition, states such as Victoria, that have most fully implemented labour and training
market deregulation, have a trend of apprentice intake over the last decade that is not
significantly different from the NSW trend. This project’s surveys of employers and key
vocational education and training stakeholders found that the current training system is
not regarded as superior to previous training regimes and that there is, on balance, no
evidence of an improvement in the quality of training.
DECLINING QUALITY OF APPLICANTS
There are anecdotal reports of a decline in applicant quality for apprentice vacancies due,
for example, to a higher proportion of school leavers entering university study and the
poor image of some traditional industries. This is a difficult issue on which to gain
conclusive evidence. Contrary to the anecdotal reports, a Federal Government study
found that employers, in general, receive several suitable applicants for each
apprenticeship vacancy11
. (This issue is taken up below in the recommended measures for
lifting apprentice training rates).
TRADE SKILL SHORTAGES
As a result of declining apprentice intake, and, especially, declining apprentice training
rates, labour market assessments by the Federal Government indicate that the economy is
confronted with shortages of trade and technical skills. These skill shortages can act as a
brake on investment and growth opportunities and place significant upward pressure on
wages. Without measures to redress the causes of the decline in training rates there will
be increased reliance on skilled migration and work organisation changes, such as
11 Federal Department of Employment, Workplace Relations and Small Business (1998) The Labour
Market for Apprentices in NSW, 1998

80
increased specialisation of tasks, to reduce the skill content of jobs. (This is further
discussed below).
RECOMMENDATIONS TO IMPROVE APPRENTICE TRAINING RATES
Given the structural causes of the decline in training rates identified above, solutions need
to be directed at these causes. Possible solutions include:
ENFORCEMENT OF CURRENT POLICIES
Ensure enforcement of current policies relating to larger government contracts requiring
contractors to establish Training Plans for their employees and sub-contractors.12
The
Training Plans requirement for longer-term contracts should include appropriate ratios of
apprentices to on-site tradespersons. In addition, to assist enforcement there should be
regular public reporting of the outcomes of these policies.
CHANGES TO GOVERNMENT FINANCIAL INCENTIVES
This project’s survey of key NSW vocational education and training stakeholders
strongly suggested that the current system of Federal Government incentives for the
commencement and completion of apprentices and trainees must be modified. Currently,
the same level of subsidy applies to the commencement and completion of traineeships
(which may be of one to two years’ duration) and to four year apprenticeships. The
structure of incentives makes the employment of trainees more financially attractive than
apprenticeships.
While the project’s employers’ survey and other studies have indicated financial
incentives operate only at the margin in terms of decisions to employ apprentices, the
current structure of incentives clearly discriminates against apprenticeships. This
discrimination is especially important for Group Training Companies for whom such
payments are an important source of revenue and are influential in decisions to employ
either apprentices or trainees.
RE-INTRODUCE PRE-APPRENTICESHIPS
Re-introduction of pre-apprenticeship courses would not necessarily act to increase
intakes, but it would increase the completion rates of apprentices. It would do this since
those who complete the one year course have a demonstrated commitment to their chosen
trade. Earlier research found those who complete pre-apprenticeship courses have a lower
drop-out rate in later years of their apprenticeship than other apprentices.
Secondly, an apprentice who has completed a pre-apprenticeship course (equivalent to
the first two years of the off-the-job training course) is more attractive to an employer,
since they will be more productive than those who have not undertaken such a course.
12 NSW Department of Public Works and Services (1999) Implementation Guidelines for NSW Government
Procurement

81
Given the potential cost of this measure, it should be targeted to trades which have a
demonstrated long-term low retention rate in the first year of the apprenticeship.
(Apprenticeships have the highest drop-out rate in the first year).
INCREASED ROLE FOR GROUP TRAINING COMPANIES
Group Training Companies (GTCs) have increased their share of apprentice employment
from 2-3 percent in the early 1980s to over 15 percent currently. Much of this growth is
accounted for by the structural changes identified above, especially the reduction in
average firm size. Given that the structural changes (which are adverse for employer
investment in training) will continue, increased support for labour market intermediaries
such as GTCs is warranted.
An additional reason for expanded support for GTCs is that the project’s surveys of key
NSW vocational education and training stakeholders and employers both indicated that
changes to the vocational education and training system, such as the introduction of User
Choice, Competency Based Training and changed administrative arrangements, such as
those applying to subsidies, apprentice registration and the involvement of New
Apprenticeships Centres, had increased the complexity of the system from an employer’s
perspective. The role of GTCs in managing these arrangements is the main reason
identified by employers for their use of GTC services.
IMPROVE THE IMAGE OF THE TRADES
While the issue of declining quality of applicants for apprenticeships is, on balance,
problematic, there is a case for measures to improve the image of trades for young
people. This would entail highlighting the advanced technologies employed in many
trade fields and the above-average labour market outcomes in terms of wages and career
progression for persons with trade qualifications.
TRENDS IN TRAINEESHIP APPROVALS
Long-term traineeship commencements were relatively stable over the period 1991-92 to
1994-95 but increased by around 420 percent over the following four years to 1998-99.
During the same period, apprenticeship intake increased by just over 6 percent. In 1998-
99 traineeship approvals were 21,242, compared to 14,742 apprenticeship approvals.
Traineeship approvals exceeded apprenticeship approvals by 44 percent. The rapid
growth in traineeship intake reflects:
financial incentives for the employment of trainees
the active promotion of traineeships through New Apprenticeships Centres
the concentration of traineeships in service industries such as retail, transport,
hospitality and communications, which have experienced rapid growth in overall
employment, especially compared to traditional apprenticeship industries
the availability of fully on-the-job training delivery for traineeships
the extension of traineeships from new entrants to the labour market to ‘Existing
Workers’ and
the potential substitution effect of traineeships for apprenticeships.

82
Overall the evidence regarding the traineeship system from the project’s surveys and the
broader literature is that trainees are satisfied or very satisfied with the training they
receive and that there are positive employment outcomes for trainees who complete their
training. Similar levels of support for the training system were also found among
apprentices.
CONCERNS ABOUT THE TRAINEESHIP SYSTEM
Notwithstanding the satisfaction expressed by trainees with the training system, there are
some concerns regarding particular aspects of the traineeship system. Three areas of
concern regarding the design and/or implementation of traineeships were prominent in
the project’s survey results and the broader literature:
LOW SKILL LEVELS OF TRAINEESHIPS
The project’s survey of key NSW vocational education and training stakeholders found
growing concern about the low skill level of the occupations which form the bulk of
traineeship intake. The National Centre for Vocational Education Research (NCVER) has
also raised concerns about the extension of apprenticeship-type training arrangements to
low skill occupations for which only very short-term, on-the-job training is required.13
In
1998-99, 41 percent of traineeship approvals were in the lowest skilled occupations.
These are Australian Standard Classification of Occupation (ASCO) Major Groups 8-9
Elementary Clerical, Sales and Service Workers, and Labourers. Examples include sales
assistants, security guards, service station attendants, telemarketers, and laundry workers.
According to the Australian Bureau of Statistics, these occupations have a skill level
commensurate with either Year 10 education or an Australian Qualifications Framework
(AQF) Certificate I.
Another 44 percent of traineeship intake is in slightly higher skilled occupations having a
skill level commensurate with either AQF Certificate II or at least 1 year’s relevant
experience. These occupations are Major Groups 6 and 7, intermediate clerical, sales and
service workers, and intermediate production and transport workers. Examples of
intermediate production and transport occupations include storepersons, delivery drivers,
truck and train drivers, mobile construction plant operators, and miners. Examples of
intermediate clerical, sales and service occupations include waiters, sales representatives,
general clerks, child care workers, retail and checkout supervisors, dental assistants, and
library assistants.
The very large numbers and rising proportion of low skill traineeships, which now
account for nearly half of all trainee approvals, raises a number of important policy issues
for the NSW vocational training system. The principal policy questions, given finite
resources for vocational training, are:
13 National Centre for Vocational Education Training (2001) Australian Apprenticeships: Facts, fiction and
future, Adelaide

83
a) is the expenditure of very considerable sums on employment and training subsidies for
trainees and administration of the system commensurate with the skill and training
required for the traineeships?
b) is the traineeship system actually meeting strategic skill needs?
QUALITY OF TRAINEESHIP TRAINING
The project’s surveys of key NSW vocational education and training stakeholders and
employers raised a number of concerns regarding quality of traineeship training. These
concerns included:
a) the quality of training delivered in fully on-the-job mode, where the balance between
work and training is believed to be tilted too much towards the former. Fully on-the-job
training for traineeships is very common, with 55 percent of trainees reporting they
receive only on-the-job training and 38 percent of employers reporting fully on-the-job
training for their trainees. (By contrast only a very small percentage of apprentices
receive fully on-the-job training).
b) employers in general reported having a low level of knowledge of the many substantial
changes to the training system over the last five years. This raises some concerns about
the ability of employers to make informed decisions regarding, for example, the selection
of registered training organisations in a deregulated training market.
LOW COMPLETION RATES
NSW traineeship completion rates are substantially lower than for apprenticeships. While
there is considerable variation across apprenticeships and traineeships in completion
rates, on average the respective attrition rates for apprentices and trainees is 8-10 percent
per year and 20-25 percent per year. These attrition rates also vary across the business
cycle. The completion rate over the life of a four-year apprenticeship on average is
around 65 percent. For trainees, the average completion rate over a two-year traineeship
is 40-50 percent with some traineeships having completion rates as low as 10-30 percent.
Other research has indicated that traineeships in which training is provided fully on-the-
job have a much lower completion rate than those receiving off-the-job training and that
non-completing trainees identify inadequate training as a major cause for their
withdrawal from the traineeship. These results add considerable weight to the research
identified above concerning the particular problems with fully on-the-job training.
RECOMMENDATIONS TO IMPROVE THE TRAINEESHIP SYSTEM
REVIEW LOW-SKILL TRAINEESHIP VOCATIONS
The recent very large growth in traineeship intake, especially in low skilled occupations,
has resulted in very large increases in both State and Federal Government expenditure on
training and employment subsidies. No coherent rationale has been provided for the
extension of apprentice-type training arrangements to these low skill occupations. This is
especially the case for those lower skilled occupations which, prior to the introduction of
84
traineeships, and concurrently with the new system, have already established entry-level
training systems and licensing arrangements. It is recommended that traineeships in the
occupations “Labourer and Related” and “Elementary Clerical” be evaluated with regard
to the appropriateness of the training periods and the level of financial incentives.
ADDRESS TRAINEESHIP NON-COMPLETION
A substantial body of research has been undertaken on this topic, identifying the types of
traineeship subject to high non-completion and some of the causes of this non-
completion. The major determinants of traineeship non-completion are the personal
characteristics of trainees, the particular type of traineeship (e.g. small business, tourism
and hospitality), and mode of training delivery (i.e. training delivered entirely on-the-job
is frequently associated with poor completion rates).
Practical initiatives suggested by the research need to be implemented to address these
findings. Research by the former Federal Department of Education, Training and Youth
Affairs14
identified a range of measures to improve completion rates that could usefully
be considered by the NSW Department of Education and Training. Some of these include
improved selection of trainees to exclude those at risk of non-completion, improved
information for trainees on wage levels and the nature of the work to be undertaken, and
assistance with trainees in re-commencing their training after having left a traineeship.
CLEARER DEFINITION OF THE ROLE AND TARGET GROUPS OF TRAINEESHIPS
The recommendations to improve the skill level and completion rate of traineeships raise
a more fundamental issue regarding the target group and objectives of traineeships.
Evidence from research suggests that it is possible to improve completion rates by
excluding some labour market groups, such as young people with low educational
attainment and prior extended periods of unemployment. (These factors are positively
correlated with higher non-completion rates). Such modifications of the intake of
trainees, however, have clear equity implications.
There would seem to be a consensus that there is an urgent need to define the precise
target group and role of traineeships. Are they primarily a training program to meet skill
needs or an employment program for those disadvantaged in the labour market? If they
are primarily a training program to meet the skill needs of employers then it would seem
sensible to be far more selective about entrants to traineeships so as to exclude those
groups, especially disadvantaged groups in the labour market, who have a substantially
higher probability of non-completion.
Alternatively, if the objective is primarily an expansion of employment opportunities for
disadvantaged labour market groups, then it would seem traineeships are poorly targeted,
given that Existing Workers now constitute around 30 percent of all trainees. Further, the
14 Federal Department of Education, Training and Youth Affairs (1999) Traineeship Non-Completion,
Research and Evaluation Branch

85
traineeship program has poor outcomes for disadvantaged groups, given the high non-
completion rates for these groups.
Moreover, as explained above, it is unlikely current training arrangements can fully
satisfy the skill needs of industry without targeting or special incentives for redressing
those trade and other higher skills shortages which, for a variety of reasons, the
deregulated labour market and training system finds difficulty in addressing. The
researchers concur with Schofield that the primary objective of the traineeship system
should be training and only secondarily, employment.15
15
Schofield K. (1999) Independent Investigation Into the Quality of Training in Queensland’s Traineeship
System, Qld Department of Employment, Training and Industrial Relations

86
VII REFERENCES
Australian Bureau of Statistics, Australian National Accounts. State Accounts 1997-98
Cat. No. 5220.0
Employer Training Expenditure. July to September 1996, Cat. No. 6353.0
Australian Standard Classification of Occupations (Second Edition)
Australian Industry Group (1999) Training to Compete. The Training Needs of Industry
(2000) Engineering Skills Shortages: National Forum Discussion Paper, 10
March
ANTA (1998) National Evaluation of User Choice – Phase 1: Evaluation Framework.
KPMG Consulting/ANTA.
ANTA (1999) National Evaluation of User Choice – Phase 2: Overview Report. KPMG
Consulting/ANTA.
Buchanan J and Callus R. (1992) Economic Inefficiencies, Enterprise Bargaining and the
Need for Multi-employer Co-ordination in the Labour Market, in Issue in Enterprise
Bargaining, EPAC Background paper No.22
Campbell I. (2000) The Spreading Net: Age and Gender in the Process of Casualisation
in Australia, Journal of Australian Political Economy, No. 45, 68-98
Construction Training Australia (1999), Building and Construction Workforce 2005-
Strategic Initiatives, Melbourne
Cully M. (1999) A More or Less Skilled Workforce? Changes in the Occupational
Composition of Employment, 1993-1999, Australian Bulletin of Labour, Vol 25, No.2,
96-104
Curtain R (1987) Skill Formation and the Enterprise, Labour & Industry, Vol.1 No.1, 8-
38
Dandie S. (1996) Economic Analysis of Employment Based Entry Level Training. An
Analysis of Trends in Apprenticeship Training, Centre for Labour Market Research,
Curtin University of Technology

87
Department of Employment, Education and Training Annual Apprenticeship Statistics
(various years), AGPS, Canberra
Department of Further Education, Training and Employment (1990) Apprenticeship
Separation Analysis
Department of Employment, Education and Training (1993) Australian Traineeship
System Consolidated Evaluation Report, Evaluation and Monitoring Branch
Department of Employment, Education, Training and Youth Affairs (1997) Evaluation of
the Impact of Financial Incentives on the Recruitment of Entry Level Trainees, Centre for
Labour Market Research
Department of Education, Training and Youth Affairs (1999) Traineeship Non-
Completion, Research and Evaluation Branch
(2000) Attrition in Apprenticeships. An analysis of apprentices commencing
between July 1994 and June 1996, Research and Evaluation Branch
(2000) National Industry Skills Initiative.
Skills Shortages in the Retail Motor Industry
Skills Shortages in Engineering
Skills Shortages in Electrotechnology
Department of Employment, Education, Training and Youth Affairs (1998) Labour
Market for Apprentices, Analysis and Evaluation Division, Analytical Series No.98/1
Department of Employment, Workplace Relations and Small Business (1998) The
Labour Market for Apprentices in NSW, 1998
(1999a) Skill Shortages in the Trades - An Employment Perspective, Labour
Market Policy Group
(1999b) Status of Skill Shortages in the Trades, Labour Market Policy Group
(1999c) Occupational Labour Markets in NSW. NSW State Office. January.
Dockery A.M., Koshy P., and Stromback T. (1996) The Cost to Employers of
Apprenticeship Training in Australia, Centre for Labour Market Research, Curtin
University of Technology
Domberger, S. (1998) The Contracting Organisation: A Strategic Guide to Outsourcing.
Oxford: Oxford University Press.
88
Gospel H (1993) Whatever Happened to Apprenticeship Training, Australian Centre for
Industrial Relations Research and Training, University of Sydney (ACIRRT) Working
Paper No.28, July.
(1994) The Survival of Apprenticeship Training in Australia, The Journal of
Industrial Relations, March, 37-56
Hall, R., Buchanan, J., Bretherton, T., van Barneveld, K. and Pickersgill, R. (2000).
Making the Grade?: Globalisation and the Training Market in Australia. Volumes 1 and
2. Adelaide: National Centre for Vocational Education Research (NCVER).
Hall, R. and Bretherton, T. (2000). ‘It’s Not My Problem’: The Growth of Non-Standard
Work and Its Impact on Vocational Education and Training in Australia. Seminar
Presentation to School of Work and Organisational Studies, University of Sydney, May.
Hall R. and Buchanan J. (2000) The Characteristics of Applicants for Metal and
Engineering Apprenticeships and Traineeships, Report for the Manufacturing,
Engineering and Related Services Industry Training Advisory Body, Australian Centre
for Industrial Relations Research and Training (ACIRRT)
Hartig M. (1999) A New World at Work: A Labour Hire Perspective. Paper presented to
the Australian Centre for Industrial Relations Research and Training, University of
Sydney (ACIRRT) Conference, Managing A Blended Workforce, Sydney, 26 November.
Industry Commission (1997) Small Business Employment, Staff Research Paper,
Canberra
Marshman and Associates (1996) The Employment of Apprentices. The Barriers,
Australian National Training Authority, Brisbane
Marshman and Associates (1998) On the Brink of Crisis? Report to Engineering Skills
Training Board (Vic) Inc.
National Centre for Vocational Education and Research Ltd. (1998) Apprentices and
Trainees in Australia 1985 to 1997
New South Wales Department of Public Works and Services (1999) Implementation
Guidelines for NSW Government Procurement
New South Wales Department of Employment and Training (2000) Submission to the
Senate Inquiry Into the Quality of Vocational Education in Australia
Apprenticeship and Traineeship Training Program Guidelines 2000
Office of Training and Further Education (1998) Apprenticeships and Traineeships-
Victorian Trends, State Training Board of Victoria

89
Reich R. (1991) The Work of Nations, Simon & Schuster Ltd, London
Schofield K. (1999) Independent Investigation Into the Quality of Training in
Queensland’s Traineeship System, Department of Employment, Training and Industrial
Relations
(1999) Review of the Quality of Tasmania’s Traineeship System
(2000) Delivering Quality. Report of the Independent Review of the Quality of
Training in Victoria’s Apprenticeship and Traineeship System, Office of Post
Compulsory Education, Training and Employment
Scherer P.A. (1981) Apprenticeship Training and its Effects on the Labour Market, in
Baird C.E., Gregory R.G. and Gruen F.H. (eds) Youth Employment, Education and
Training, Centre for Economic Policy Research, Australian National University
Smith L. (1998) Apprenticeships and Traineeships- Queensland Trends, Department of
Employment, Training and Industrial Relations
(1999) Apprenticeships and Traineeships- Queensland Trends, Department of
Employment, Training and Industrial Relations
Sweet R. (1990) Initial Vocational Preparation Facts and Issues: Costs and Benefits,
Training Costs of Award Restructuring. Report of the Training Costs Review Committee
Vol. 2 Supplementary papers: 223-251
(1995) The Naked Emperor: Training Reform, Initial Vocational Preparation and
Youth Wages, Australian Economic Review, Vol.110, April/June
Toner P. (1985) Public Sector and Private Sector Employment Programs as Competing
Solutions to Unemployment, Australian Journal of Social Issues,
Vol. 20. No.1, 56- 71
(1998) Trends in NSW Government Apprenticeship Intake: Causes and
Implications, Australian Bulletin of Labour, Vol. 24, no.2, June, 141-157.
(2000) Trade Apprenticeships in the Australian Construction Industry, Labour
and Industry, Vol. 11, No.2, December, 39-58
VandenHeuval A. and Wooden, M. (1999) Casualisation and Outsourcing: Trends and
Implications for Work Related Training, National Centre for Vocational Education
Research (NCVER), Adelaide.
Wood A. (1994) North-South Trade, Employment and Inequity: Changing Fortunes in a
Skill-Driven World, Oxford University Press, Oxford

90
Wooden M. (1996) Firm Size and the Provision of Employee Training: An Analysis of
the 1994 Survey of Training and Education, Australian and New Zealand Journal of
Vocational Education Research, Vol. 4, No.2, 89-120

91
VIII APPENDIX - TABLES
Top Related