


Languages
Pages
Legal

Carl E. Enomoto, Karl R. Geisler ISSN 2071-789X
INTERDISCIPLINARY APPROACH TO ECONOMICS AND SOCIOLOGY
Economics & Sociology, Vol. 10, No. 3, 2017
281
Carl E. Enomoto, New Mexico State University, Las Cruces, NM, U.S.A, E-mail: [email protected]
CULTURE AND PLANE CRASHES: A CROSS-COUNTRY TEST
OF THE GLADWELL HYPOTHESIS Karl R. Geisler, New Mexico State University, Las Cruces, NM, U.S.A, E-mail: [email protected] Received: February, 2017 1st Revision: June, 2017 Accepted: August, 2017
DOI: 10.14254/2071-789X.2017/10-3/20
ABSTRACT. Early studies found evidence of a positive correlation between Hofstede’s power distance scores, which measure the extent to which those without power defer to those with it, and plane accidents in different countries. However, these studies did not control for the level of economic activity (Gross Domestic Product-GDP) and severe weather conditions in these countries. This paper uses regression analysis to estimate the effects of number of flights, GDP, severe weather conditions, and culture on plane crashes in sixty eight countries. It is found that per-capita GDP and country scores on the cultural dimension of individualism are inversely related to plane accidents while power distance scores and number of flights are directly related to plane accidents. Continued training for pilots and copilots in direct cockpit communication can help overcome cultural barriers and reduce plane accidents.
JEL Classification: Z1, Z13 Keywords: plane accidents; culture; power distance; miscommunication
Introduction
The kinds of errors that cause plane crashes are invariably errors of teamwork and
communication. One pilot knows something important and somehow doesn’t tell the
other pilot. One pilot does something wrong, and the other pilot doesn’t catch the
error. A tricky situation needs to be resolved through a complex series of steps – and
somehow the pilots fail to coordinate and miss one of them.
“The whole flight deck design is intended to be operated by two people, and that
operation works best when you have one person checking the other, or both people
willing to participate”, says Earl Weener, who was for twenty years chief engineer for
safety at Boeing. Airplanes are very unforgiving if you don’t do things right. And for a
long time it’s been clear that if you have two people operating the airplane
cooperatively, you will have a safer operation than if you have a single pilot flying the
plane and another person who is simply there to take over if the pilot is incapacitated.
(Gladwell, 2008, pp. 184-5)
Gladwell (2008) cited several cases where plane crashes were a result of poor communication
between the pilot and copilot or between the pilots and air traffic control. Copilots may often
use what Gladwell referred to as “mitigated speech”, a term borrowed from linguists.
Mitigated speech is a form of communication that is watered down to take the edge taken off
so as to avoid conflict with another individual. Rather than commanding another person to
take an action, a polite request is made in its place which may be interpreted as a request that
Enomoto, C. E., Geisler, K. R.. (2017). Culture and Plane Crashes: A Cross-Country Test of The Gladwell Hypothesis. Economics and Sociology, 10(3), 281-293. doi:10.14254/2071-789X.2017/10-3/20

Carl E. Enomoto, Karl R. Geisler ISSN 2071-789X
INTERDISCIPLINARY APPROACH TO ECONOMICS AND SOCIOLOGY
Economics & Sociology, Vol. 10, No. 3, 2017
282
does not require immediate attention. This could lead to serious consequences in the case of a
copilot communicating with the pilot or air traffic control.
Why is it that some pilots and copilots have had difficulty in communicating between
themselves and air traffic control? Gladwell suggested that it has something to do with
culture. Geert Hofstede, a Dutch psychologist, sociologist, and anthropologist, and his
colleagues came up with several dimensions of culture which have been used by researchers
worldwide (Wu, 2006). These dimensions include power distance, uncertainty avoidance,
individualism, and masculinity. If a country ranks high in power distance, the order of
inequality and hierarchy is well defined and one’s place in society is known and accepted. In
such a society individuals are deferential to their leaders and have a high regard for them. If a
country ranks high in individualism, there is a greater emphasis in that society on individual
achievement and rewards and less of an emphasis on team decisions and achievements. If a
nation ranks high in uncertainty avoidance, society prefers formal rules and structure while
change is not readily accepted. If a nation ranks high in masculinity, that society is generally
more competitive and assertive in nature. Gladwell noted that in many cases involving plane
accidents, the flight crew was from a high power distance country. In such cases, he found
that the copilot spoke using culturally-accepted mitigated speech in order to show deference
and respect to authority. Herein lays the problem. When faced with a crisis in the cockpit,
what is needed is strong and direct communication between the pilot, copilot, and air traffic
control. The mitigated language and deference to one’s elders typically found in high power
distance societies do not sufficiently convey enough correct information about the urgency of
the problem at hand.
Previous studies have established that there is a strong correlation between culture and
plane crashes, though they do not control for other important factors such aviation
infrastructure or severe weather. Using regression analysis, this paper confirms the previous
work that culture affects the number of airline accidents while also highlighting other
important factors. In the next section, a review of the literature will be presented, followed by
a model of information given by the copilot to correct a mistake or oversight of the pilot. The
empirical findings will then be discussed, followed by the conclusions and a summary.
1. Literature review
Gorodnichenko and Roland (2011) gave a brief history of the development and use of
the Hofstede dimensions of culture. They stated that Hofstede started with a survey of IBM
employees in 30 countries to analyze cultural differences. With additional sampling and
surveys, almost 80 countries are now ranked by Hofstede and his colleagues according to the
dimensions of power distance, individualism, uncertainty avoidance, and masculinity. The
country rankings were accomplished using factor analysis on survey questions.
Gorodnichenko and Roland (2011) explained that individualism is typified by high values on
“individual freedom, opportunity, achievement, advancement, and recognition” while
discounting “harmony, cooperation, and relations with superiors” (p. 492). They find
individualism strongly and negatively correlated with power distance, which measures the
extent to which “power is distributed unequally” between junior and senior members of
society (p. 493).
These dimensions of culture defined by Hofstede have been previously shown to be
correlated with airline accidents. A 1993 Boeing study initially linked culture with aviation
accident rates.1 It found that high power distance countries had high rates of airline accidents,
while countries with high individualism had lower accident rates.
1 This study has been often cited, including by Phillips (1994) and Gladwell (2008).
Carl E. Enomoto, Karl R. Geisler ISSN 2071-789X
INTERDISCIPLINARY APPROACH TO ECONOMICS AND SOCIOLOGY
Economics & Sociology, Vol. 10, No. 3, 2017
283
Soeters and Boer (2000) obtained comparable findings when looking at military
flights. Analyzing losses from military aviation accidents per 10,000 flying hours from air
forces of 14 NATO countries, they found: 1) a negative correlation between individualism
and accidents; 2) a positive correlation between power distance and accidents, and; 3) a
positive correlation between uncertainty avoidance and accidents. When the authors
controlled for the percent of mechanical failures, similar results were obtained.
Using online data on the number of plane crashes involving a fatality, Jing, Lu, and
Peng (2001) also found culture to be linked to aviation accidents.2 They used several survey
questions to represent cultural variables, with the percentage who responded in specific ways
from different countries then used in regressions where the dependent variable was plane
accident rates. This process led the authors to conclude that “authoritarianism”, which
represents the degree of submission to authority, was the most important cultural variable
explaining plane accident rates.
While the effect of culture on aircraft accidents has been looked at, it has not yet been
statistically explored in context with other significant contributing factors. Shappell and
Wiegmann (1997) pointed out that human error alone rarely causes aviation accidents.
Typically these accidents “involve a complex interaction of several factors” (Shappell and
Wiegmann, 1997, p. 271). Similarly, Hutchins, Holder, and Perez (2002) argued that aviation
accidents are not caused by culture alone but rather by the broadly-defined aviation
infrastructure. This aviation infrastructure includes the “…regulatory structure, facilities
(airports, navigation and approach systems, etc.), weather forecasting, charts, mail services (to
deliver charts), education, maintenance, and more” (Hutchins, Holder, and Perez, 2002,
p. 50). The combination of physical and social infrastructure that forms aviation infrastructure
can be considered a sociotechnical system. Strauch (2010) defined sociotechnical systems as
systems involving the interaction between people (socio) and machines or technology
(technical). Such systems included the generation of electricity and the transport of people.
While research has shown that culture does make a difference when it comes to perception,
neural processing, and cognition, not much work has been done on sociotechnical systems
according to the author. The cultural research that has been done has most often cited
Hofstede’s work. Some of these studies have shown that culture can and does affect team
performance, especially when the team members are under pressure and in a stressful
situation.
Another third significant factor to consider in airline crashes is weather. Luers and
Haines (1983) noted that in spite of improvements to aviation infrastructure related to
forecasting and communicating severe weather, “weather remains a cause or related factor in
a high percentage of aircraft accidents” (p. 187). It is the complex interaction between the
aviation environment, weather, and culture that sets up what the 1993 Boeing study refers to
as the ‘accident chain’. Should any link be broken, an accident can be avoided. At the critical
point when the weather and the aviation environment are aligned to enable an accident, the
reactions of pilots – including communication – become the difference between life and
death.
In the next section, a model of how culture affects the amount and quality of
information given by the copilot to the pilot is outlined. The results of the model will show
how the skill and training of the flight crew, maintenance and safety features of the aircraft,
aviation infrastructure, weather, and culture all interact to affect plane accidents across
countries.
2 Jing, Lu, and Peng (2001) used data from planecrashinfo.com.
Carl E. Enomoto, Karl R. Geisler ISSN 2071-789X
INTERDISCIPLINARY APPROACH TO ECONOMICS AND SOCIOLOGY
Economics & Sociology, Vol. 10, No. 3, 2017
284
2. Methodological approach
To model the effects of culture on plane accidents, it is assumed that the flight crew
consists of a junior copilot (the first officer) and a senior pilot (the captain). The junior copilot
benefits from correcting an improper action initiated by the senior pilot since a plane crash
may be avoided and lives saved. However, there is also a psychic cost to the junior co-pilot
who may perceive that he or she is questioning the actions of a superior.
In countries with a high power distance ranking where inequality is well defined and
the less experienced defer to older more-experienced leaders, the psychic cost of more direct
communication is high to the junior copilot. In low power distance countries, the psychic cost
of direct communication is much lower. Assuming the benefit to the junior pilot from direct
communication with the pilot is the same for all cultures, the junior pilot who performs a
benefit-cost analysis would find it in is his/her interest to communicate more directly with the
pilot when both are from a low power distance country.
Combining this framework of psychic cost with the findings of past studies and other
theoretically important factors in crashes, the number of plane accidents in a country can now
be specified as follows:
( , , , , , ) ,accidents f F S M R W x ε (1)
where “accidents” represents the number of plane accidents in a country, F represents the
number of flights in a country, S represents the skills, training, and experience of the flight
crew, M represents maintenance of the aircraft and any other safety features of the plane, R
represents up-to-date runways and air traffic control systems, W represents weather
conditions, x represents the amount and quality of information communicated by the copilot
to the pilot to coordinate actions of the flight crew and is related to culture, and ε, is the
stochastic disturbance term reflecting the effects of hijackings, birds, or other random factors
that may affect flights.
In this equation it is expected that the number of plane accidents experienced by a
country are inversely related to the skills of the flight crew, the maintenance of the aircraft
and its inherent safety features, modern aviation systems, and the ability of the copilot to
successfully communicate, coordinate, and correct the pilot which is a function of culture.
Severe weather conditions and number of flights are expected to be positively related to plane
accidents. In the next section, equation (1) will be estimated.
3. Conducting research and results
The number of plane accidents for 68 countries from 1970 to 2012 was collected from
Aviation Safety Network at the website www.aviation-safety.net/database/country. The dataset
includes accidents for airliners, cargo planes, corporate jets and military transport aircraft. The
plane accidents are categorized as either A1 for damaged beyond repair or A2 for substantial
airplane damage. Both types of accidents were recorded in this study as plane accidents.
Incidents that were not used in this study included: aircraft explosions caused by grenades,
airplanes being fired upon from the ground, aircraft destroyed by a nation’s air force that was
suspected of drug trafficking, hijacking incidents, aircraft damaged by colliding with another
aircraft on the runway, and aircraft damaged by engine fire during maintenance work.
As a proxy for number of flights in each country over the period 1970-2012, the
number of departures which were “domestic takeoffs and takeoffs abroad of air carriers
registered in the country” was taken from the World Bank Development Indicators which
Carl E. Enomoto, Karl R. Geisler ISSN 2071-789X
INTERDISCIPLINARY APPROACH TO ECONOMICS AND SOCIOLOGY
Economics & Sociology, Vol. 10, No. 3, 2017
285
come from the International Civil Aviation Organization, Civil Aviation Statistics of the
World, and ICAO staff estimates.
As noted by Hutchins, Holder, and Perez (2002), aviation accidents are caused in part
by a complex interaction of physical and social factors which comprise aviation
infrastructure. They stated that poor nations may have higher accident rates because they lack
the wherewithal to support a first-rate aviation infrastructure. To date, all previous cross-
country studies involving plane accidents have lacked data involving the investments that
countries make in physical airport infrastructure, maintenance expenditures, and education.
These factors are all critical components of aviation infrastructure. One reason that previous
studies may have excluded the inclusion of aviation infrastructure is data availability;
although data for these factors exist for some counties, it does not exist for all.
The OECD publishes data on airport investment and maintenance for selected
countries (OECD, 2013). Data on investment in physical airport infrastructure was available
for 24 of the 68 countries used in the dataset for this study, while data on maintenance
expenditures for airports was available for 15 of the 68 countries. While these numbers are
too small to allow for reliable regression estimation, their correlation with Gross Domestic
Product adjusted for purchasing power parity (GDP) demonstrated in Table 1 means that we
can use GDP as a proxy for these physical aspects of aviation infrastructure.
Data was collected for per-capita GDP in constant 2011 dollars adjusted for
purchasing power parity for the countries of interest. This data was obtained from the World
Bank Development Indicators. The average of the per-capita GDP figures from 1990-2012
was used for each country (with some exceptions outlined in the footnotes to the data table
provided in Appendix 1).
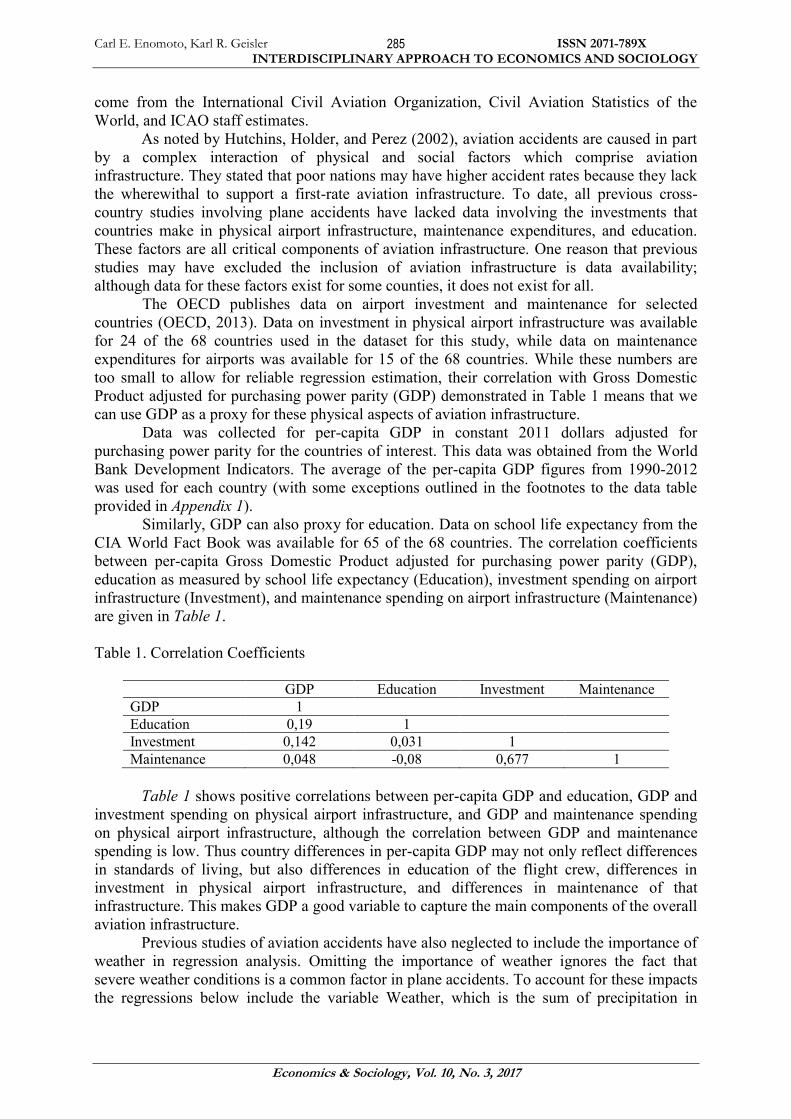
Similarly, GDP can also proxy for education. Data on school life expectancy from the
CIA World Fact Book was available for 65 of the 68 countries. The correlation coefficients
between per-capita Gross Domestic Product adjusted for purchasing power parity (GDP),
education as measured by school life expectancy (Education), investment spending on airport
infrastructure (Investment), and maintenance spending on airport infrastructure (Maintenance)
are given in Table 1.
Table 1. Correlation Coefficients
GDP Education Investment Maintenance
GDP 1
Education 0,19 1
Investment 0,142 0,031 1
Maintenance 0,048 -0,08 0,677 1
Table 1 shows positive correlations between per-capita GDP and education, GDP and
investment spending on physical airport infrastructure, and GDP and maintenance spending
on physical airport infrastructure, although the correlation between GDP and maintenance
spending is low. Thus country differences in per-capita GDP may not only reflect differences
in standards of living, but also differences in education of the flight crew, differences in
investment in physical airport infrastructure, and differences in maintenance of that
infrastructure. This makes GDP a good variable to capture the main components of the overall
aviation infrastructure.
Previous studies of aviation accidents have also neglected to include the importance of
weather in regression analysis. Omitting the importance of weather ignores the fact that
severe weather conditions is a common factor in plane accidents. To account for these impacts
the regressions below include the variable Weather, which is the sum of precipitation in

Carl E. Enomoto, Karl R. Geisler ISSN 2071-789X
INTERDISCIPLINARY APPROACH TO ECONOMICS AND SOCIOLOGY
Economics & Sociology, Vol. 10, No. 3, 2017
286
freezing months for each nation. This quantity, measured in inches, was compiled using data
from the website weatherbase.com.
The Hofstede scores for the dimensions of power distance, individualism, uncertainty
avoidance, and masculinity were used as the culture variables and were obtained from
www.harzing.com/download/hgindices.xls. It should be noted that these dimensions of
culture are not independent of one another. A nation ranking low in power distance may rank
high in individualism since in highly individualistic societies, individuals seek recognition
and achievement. As a result they may be less willing to defer to authority figures. Similarly,
a nation ranking high in masculinity where assertiveness and competitiveness are stressed
may rank low in uncertainty avoidance where change is not desired. Because dimensions of
culture are interrelated, they will be entered into the model separately. The data used for this
study (68 country observations) appear in Appendix 1.
3.1. Application of multiple linear regression analysis
The model of plane accidents in equation (1) was estimated using ordinary least-
squares where the dependent variable was plane accidents from 1970 to 2012 by country and
the independent variables included: 1) Number of flights from 1970 to 2012 by country
(Flights); 2) Per-capita GDP in constant 2011 dollars adjusted for PPP (GDP) as an
approximate measure of the overall aviation infrastructure, including education and training
of the flight crew (S), maintenance of airport infrastructure and aircraft (M), and investment
in airport infrastructure (R); 3) The sum of precipitation in freezing months (Weather) to
represent severe weather conditions; and, 4) One of Hofstede’s dimensions of culture [either
power distance (PD), uncertainty avoidance (UA), individualism (IND), or masculinity
(MAS)] to represent communication and coordination in the cockpit (x). The regression
results are presented in Table 2.
In Table 2, four versions of equation (1) were estimated. In the first model, the cultural
dimension of power distance was included. In Models 2 through 4, the cultural dimensions of
individualism, uncertainty avoidance, and masculinity were included, respectively. The
variance inflation factors (VIFs) for all models were low (less than 2.5) indicating that
multicollinearity among the regressors was not a problem. Furthermore, all four models were
estimated using White’s robust standard errors.
In all models, the number of flights in a country is significant; the more flights, the
more plane accidents. The results indicate that for every million flights, the number of plane
accidents increases on average by five. It was also found that per-capita GDP was negatively
related to plane accidents in all models as expected. Richer nations have more resources to
allocate to aviation infrastructure including better runways, air traffic control support,
education of pilots and airport staff, maintenance of aircraft, and a host of other factors that
make air travel safer.
Carl E. Enomoto, Karl R. Geisler ISSN 2071-789X
INTERDISCIPLINARY APPROACH TO ECONOMICS AND SOCIOLOGY
Economics & Sociology, Vol. 10, No. 3, 2017
287
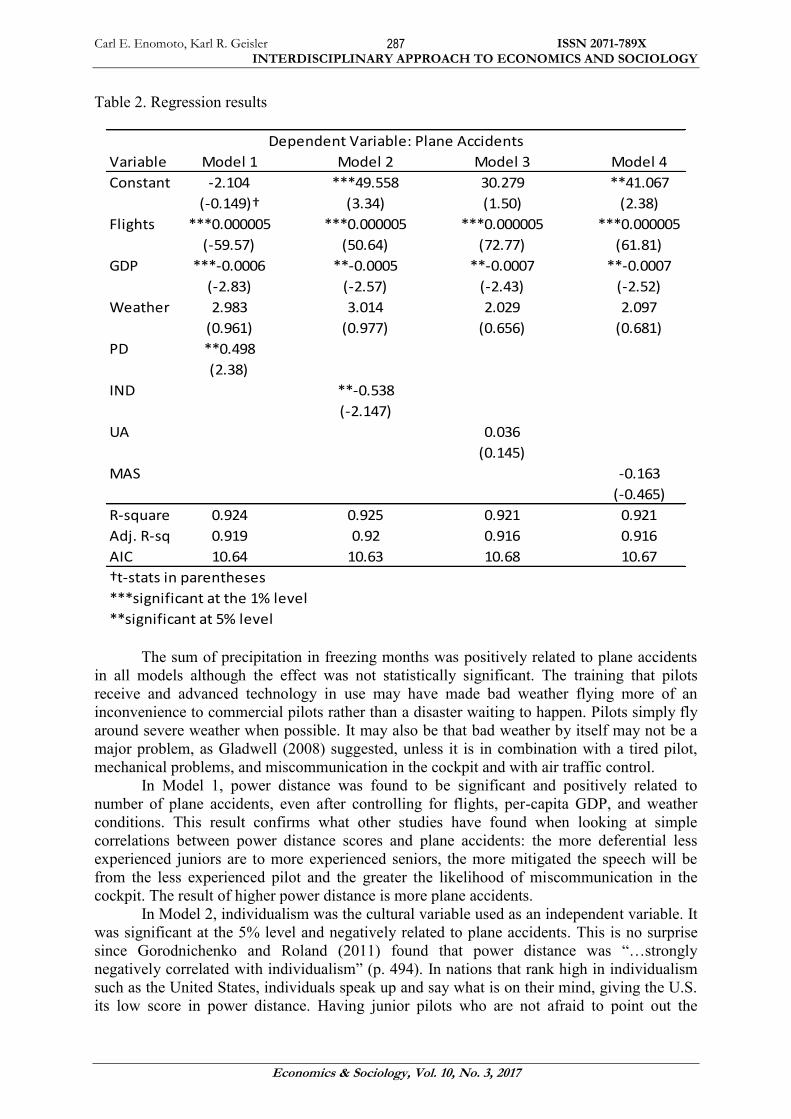
Table 2. Regression results
Variable Model 1 Model 2 Model 3 Model 4
Constant -2.104 ***49.558 30.279 **41.067
(-0.149)† (3.34) (1.50) (2.38)
Flights ***0.000005 ***0.000005 ***0.000005 ***0.000005
(-59.57) (50.64) (72.77) (61.81)
GDP ***-0.0006 **-0.0005 **-0.0007 **-0.0007
(-2.83) (-2.57) (-2.43) (-2.52)
Weather 2.983 3.014 2.029 2.097
(0.961) (0.977) (0.656) (0.681)
PD **0.498
(2.38)
IND **-0.538
(-2.147)
UA 0.036
(0.145)
MAS -0.163
(-0.465)
R-square 0.924 0.925 0.921 0.921
Adj. R-sq 0.919 0.92 0.916 0.916
AIC 10.64 10.63 10.68 10.67
†t-stats in parentheses
***significant at the 1% level
**significant at 5% level
Dependent Variable: Plane Accidents
The sum of precipitation in freezing months was positively related to plane accidents
in all models although the effect was not statistically significant. The training that pilots
receive and advanced technology in use may have made bad weather flying more of an
inconvenience to commercial pilots rather than a disaster waiting to happen. Pilots simply fly
around severe weather when possible. It may also be that bad weather by itself may not be a
major problem, as Gladwell (2008) suggested, unless it is in combination with a tired pilot,
mechanical problems, and miscommunication in the cockpit and with air traffic control.
In Model 1, power distance was found to be significant and positively related to
number of plane accidents, even after controlling for flights, per-capita GDP, and weather
conditions. This result confirms what other studies have found when looking at simple
correlations between power distance scores and plane accidents: the more deferential less
experienced juniors are to more experienced seniors, the more mitigated the speech will be
from the less experienced pilot and the greater the likelihood of miscommunication in the
cockpit. The result of higher power distance is more plane accidents.
In Model 2, individualism was the cultural variable used as an independent variable. It
was significant at the 5% level and negatively related to plane accidents. This is no surprise
since Gorodnichenko and Roland (2011) found that power distance was “…strongly
negatively correlated with individualism” (p. 494). In nations that rank high in individualism
such as the United States, individuals speak up and say what is on their mind, giving the U.S.
its low score in power distance. Having junior pilots who are not afraid to point out the
Carl E. Enomoto, Karl R. Geisler ISSN 2071-789X
INTERDISCIPLINARY APPROACH TO ECONOMICS AND SOCIOLOGY
Economics & Sociology, Vol. 10, No. 3, 2017
288
mistakes of their superiors, makes for safer flying. Finally, uncertainty avoidance and
masculinity had no significant effects on plane accidents as shown in Models 3 and 4 in
Table 2.
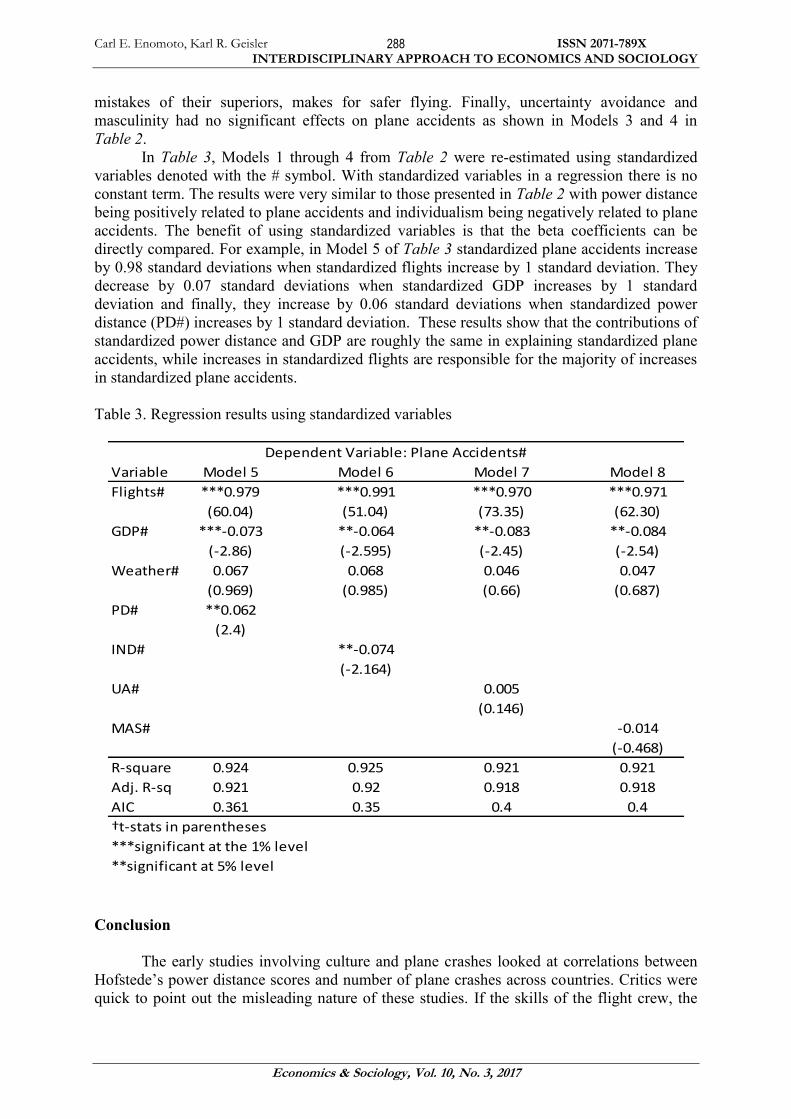
In Table 3, Models 1 through 4 from Table 2 were re-estimated using standardized
variables denoted with the # symbol. With standardized variables in a regression there is no
constant term. The results were very similar to those presented in Table 2 with power distance
being positively related to plane accidents and individualism being negatively related to plane
accidents. The benefit of using standardized variables is that the beta coefficients can be
directly compared. For example, in Model 5 of Table 3 standardized plane accidents increase
by 0.98 standard deviations when standardized flights increase by 1 standard deviation. They
decrease by 0.07 standard deviations when standardized GDP increases by 1 standard
deviation and finally, they increase by 0.06 standard deviations when standardized power
distance (PD#) increases by 1 standard deviation. These results show that the contributions of
standardized power distance and GDP are roughly the same in explaining standardized plane
accidents, while increases in standardized flights are responsible for the majority of increases
in standardized plane accidents.
Table 3. Regression results using standardized variables
Variable Model 5 Model 6 Model 7 Model 8
Flights# ***0.979 ***0.991 ***0.970 ***0.971
(60.04) (51.04) (73.35) (62.30)
GDP# ***-0.073 **-0.064 **-0.083 **-0.084
(-2.86) (-2.595) (-2.45) (-2.54)
Weather# 0.067 0.068 0.046 0.047
(0.969) (0.985) (0.66) (0.687)
PD# **0.062
(2.4)
IND# **-0.074
(-2.164)
UA# 0.005
(0.146)
MAS# -0.014
(-0.468)
R-square 0.924 0.925 0.921 0.921
Adj. R-sq 0.921 0.92 0.918 0.918
AIC 0.361 0.35 0.4 0.4
†t-stats in parentheses
***significant at the 1% level
**significant at 5% level
Dependent Variable: Plane Accidents#
Conclusion
The early studies involving culture and plane crashes looked at correlations between
Hofstede’s power distance scores and number of plane crashes across countries. Critics were
quick to point out the misleading nature of these studies. If the skills of the flight crew, the
Carl E. Enomoto, Karl R. Geisler ISSN 2071-789X
INTERDISCIPLINARY APPROACH TO ECONOMICS AND SOCIOLOGY
Economics & Sociology, Vol. 10, No. 3, 2017
289
expenditures put into air traffic control support, maintenance of the aircraft, up-to-date flight
systems and runways, government regulations and oversight and weather are not controlled
for, the correlations between Hofstede scores of cultural dimensions and plane accidents have
little meaning. To overcome this criticism, this study has made the following contributions to
the literature. (1) The effects of investment in aviation infrastructure including physical
airport infrastructure and the education of airport personnel have been accounted for by the
use of per-capita GDP adjusted for purchasing power parity. (2) The effects of severe weather
on plane accidents have been controlled for by using the sum of precipitation in freezing
months. (3) The complete dataset used for this study has been included in the paper to enable
researchers to replicate the results and extend them.
This study found that many of the early studies were correct in their conclusions even
if important variables were not included. In particular, high power distance nations have more
plane accidents, ceteris paribus, while nations ranking high in individualism tend to have
fewer plane accidents. Culture remains important even when aviation infrastructure and
weather are accounted for in regression models.
Aviation infrastructure represented by per-capita GDP is also important in determining
plane accidents. In all regression models, nations with higher levels of per-capita GDP tended
to have fewer plane accidents. In Table 2, the U.S. has by far, the largest number of plane
accidents of any country. It also has the most flights giving it a low plane accident rate
(4.47 accidents per million flights from 1970 to 2012). The U.S. is also a leader in aviation
infrastructure (high per capita GDP) and it ranks the highest in individualism and very low in
power distance. By way of contrast, Nigeria has a relatively high plane accident rate
(75.6 accidents per million flights from 1970 to 2012). It has a relatively low level of per-
capita GDP, a high power distance score and one of the lowest scores in individualism.
Malaysia Airlines flight 370 has been missing since 2014 and the reasons for its
disappearance are still unknown. However, Malaysia is ranked as the highest power distance
country.
Other than improving a nation’s aviation infrastructure, this study reinforces what
major airlines have been doing; training pilots and copilots in communication to overcome
cultural barriers – “Crew Resource Management” (Gladwell, 2008, p. 197). Gladwell cites
examples of where pilots remind their copilots that the pilots need help in flying a
sophisticated aircraft when malfunctions occur. It is only when the entire crew are working
together as equals, will the chance of success be greatest.
Limitations of study and future research
In this study, simple OLS models were estimated to determine the effects of number of
flights, GDP, weather and culture, on plane accidents for 68 countries. The reason OLS was
chosen as a technique was to keep the results of this study comparable to what others have
done. The OLS methodology has been used consistently throughout the plane accident
literature. However, this is not to say that this is the best method available. In future studies,
more sophisticated estimation techniques may be employed. For example, Bayesian
regression models which make use of prior distributions for the parameters may yield
valuable insights.
Another limitation of this study and all studies investigating plane accidents is lack of
detailed airport infrastructure data for the majority of countries. If this data becomes available
it would not have to be represented by a proxy variable such as GDP.
Finally, culture has been proven time and time again to have a major influence on
behavior. Nations in Latin America, Africa, and the Far East are known to have collectivist
societies where individualism and individual achievement are not emphasized. However, it is
Carl E. Enomoto, Karl R. Geisler ISSN 2071-789X
INTERDISCIPLINARY APPROACH TO ECONOMICS AND SOCIOLOGY
Economics & Sociology, Vol. 10, No. 3, 2017
290
certainly true that individuals within these societies vary significantly in their attitudes and
behavior. Perhaps in the future cultural studies will collect more data to capture these nuances
in individual behavior and action.
References
Boeing Commercial Airplane Company (1993). Accident Prevention Strategies: Removing
Links in the Accident Chain. Seattle, WA.
Gladwell, M. (2008). Outliers: The story of success. New York, Boston, London: Little,
Brown and Company.
Gorodnichenko, Y., & Roland, G. (2011). Which dimensions of culture matter for long-run
growth? American Economic Review: Papers & Proceedings, 101(3), 492-498.
Hofstede, G. (2001). Culture’s consequences: Comparing values, behaviors, institutions, and
organizations across nations (2nd ed.). Thousand Oaks, CA: Sage Publications.
Hutchins, E., Holder, B. E. & Perez, R. A. (2002). Culture and fight deck operations.
University of California San Diego, Sponsored Research Agreement 22-5003. Available
at: http://hci.ucsd.edu/media/uploads/hci_papers/EH2002-2.pdf
Jing, H-S., Lu, C. J. & Peng, S-J. (2001). Culture, authoritarianism and commercial aircraft
accidents. Human Factors and Aerospace Safety, 1(4), 341-359.
Luers, J., & Haines, P. (1983). Heavy Rain Influence on Airplane Accidents. Journal of
Aircraft, 20(2), 187-191.
OECD (2013). International Transport Forum: Spending on Transport Infrastructure 1995-
2011. Trends, Policies, Data.
Phillips, D. (1994). Culture may play role in flight safety – Boeing study finds higher aviation
accident rates among nations where individualism not the norm. The Seattle Times,
August 22.
Soeters, J. L., & Boer, P. C. (2000). Culture and flight safety in military aviation. The
International Journal of Aviation Psychology, 10(2), 111-133.
Strauch, B. (2010). Can cultural differences lead to accidents? Team cultural differences and
sociotechnical system operations. Human Factors: The Journal of the Human Factors
and Ergonomics Society, 52(2), 246-263.
Shappell, S. A., & Wiegmann, D. A. (1997). A Human Error Approach to Accident
Investigation: The Taxonomy of Unsafe Operations. International Journal of Aviation
Psychology, 7(4), 269-291.
Wu, M. (2006). Hofstede’s cultural dimensions 30 years later: A study of Taiwan and the
United States. Intercultural Communication Studies, XV(1), 33-41.
Carl E. Enomoto, Karl R. Geisler ISSN 2071-789X
INTERDISCIPLINARY APPROACH TO ECONOMICS AND SOCIOLOGY
Economics & Sociology, Vol. 10, No. 3, 2017
291
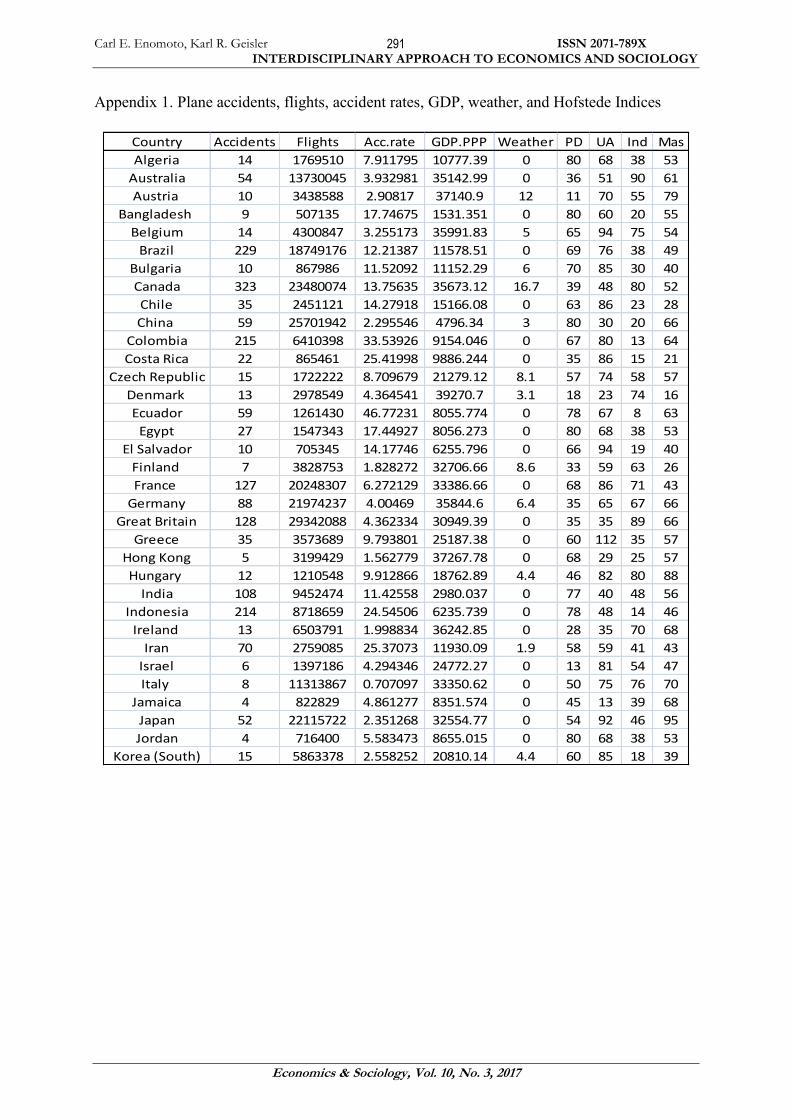
Appendix 1. Plane accidents, flights, accident rates, GDP, weather, and Hofstede Indices
Country Accidents Flights Acc.rate GDP.PPP Weather PD UA Ind Mas
Algeria 14 1769510 7.911795 10777.39 0 80 68 38 53
Australia 54 13730045 3.932981 35142.99 0 36 51 90 61
Austria 10 3438588 2.90817 37140.9 12 11 70 55 79
Bangladesh 9 507135 17.74675 1531.351 0 80 60 20 55
Belgium 14 4300847 3.255173 35991.83 5 65 94 75 54
Brazil 229 18749176 12.21387 11578.51 0 69 76 38 49
Bulgaria 10 867986 11.52092 11152.29 6 70 85 30 40
Canada 323 23480074 13.75635 35673.12 16.7 39 48 80 52
Chile 35 2451121 14.27918 15166.08 0 63 86 23 28
China 59 25701942 2.295546 4796.34 3 80 30 20 66
Colombia 215 6410398 33.53926 9154.046 0 67 80 13 64
Costa Rica 22 865461 25.41998 9886.244 0 35 86 15 21
Czech Republic 15 1722222 8.709679 21279.12 8.1 57 74 58 57
Denmark 13 2978549 4.364541 39270.7 3.1 18 23 74 16
Ecuador 59 1261430 46.77231 8055.774 0 78 67 8 63
Egypt 27 1547343 17.44927 8056.273 0 80 68 38 53
El Salvador 10 705345 14.17746 6255.796 0 66 94 19 40
Finland 7 3828753 1.828272 32706.66 8.6 33 59 63 26
France 127 20248307 6.272129 33386.66 0 68 86 71 43
Germany 88 21974237 4.00469 35844.6 6.4 35 65 67 66
Great Britain 128 29342088 4.362334 30949.39 0 35 35 89 66
Greece 35 3573689 9.793801 25187.38 0 60 112 35 57
Hong Kong 5 3199429 1.562779 37267.78 0 68 29 25 57
Hungary 12 1210548 9.912866 18762.89 4.4 46 82 80 88
India 108 9452474 11.42558 2980.037 0 77 40 48 56
Indonesia 214 8718659 24.54506 6235.739 0 78 48 14 46
Ireland 13 6503791 1.998834 36242.85 0 28 35 70 68
Iran 70 2759085 25.37073 11930.09 1.9 58 59 41 43
Israel 6 1397186 4.294346 24772.27 0 13 81 54 47
Italy 8 11313867 0.707097 33350.62 0 50 75 76 70
Jamaica 4 822829 4.861277 8351.574 0 45 13 39 68
Japan 52 22115722 2.351268 32554.77 0 54 92 46 95
Jordan 4 716400 5.583473 8655.015 0 80 68 38 53
Korea (South) 15 5863378 2.558252 20810.14 4.4 60 85 18 39
Carl E. Enomoto, Karl R. Geisler ISSN 2071-789X
INTERDISCIPLINARY APPROACH TO ECONOMICS AND SOCIOLOGY
Economics & Sociology, Vol. 10, No. 3, 2017
292
Country Accidents Flights Acc.rate GDP.PPP Weather PD UA Ind Mas
Kuwait 2 675173 2.962204 88437.06 0 80 68 38 53
Lebanon 4 635551 6.293751 13205.12 0 80 68 38 53
Luxemburg 5 859476 5.817498 77700.6 8.4 40 70 60 50
Malaysia 5 5991126 0.834568 16135.52 0 104 36 26 50
Malta 0 381275 0 23976.02 0 56 96 59 47
Mauritania 6 165935 36.15874 2434.473 0 80 68 38 53
Mexico 146 9302458 15.69478 14197.43 0 81 82 30 69
Morocco 15 1358859 11.03867 4994.853 0 70 68 46 53
Netherlands 23 6959329 3.304916 38009.12 1.9 38 53 80 14
New Zealand 25 6421338 3.89327 28024.18 0 22 49 79 58
Nigeria 71 938922 75.61863 3616.708 0 77 54 2 46
Pakistan 34 2252798 15.09234 3595.248 0 55 70 14 50
Panama 30 898982 33.37108 10114.87 0 95 86 11 44
Peru 73 1670794 43.6918 7564.794 0 64 87 16 42
Philippines 86 3185669 26.9959 4561.865 0 94 44 32 64
Poland 48 1987531 24.15057 14900.05 7.5 68 93 60 64
Portugal 23 3214894 7.154202 23739.64 0 63 104 27 31
Qatar 3 1064088 2.819316 128224.2 0 80 68 38 53
Romania 31 1074316 28.85557 12478.56 4.3 90 90 30 42
Saudi Arabia 21 4212759 4.984857 39006.93 0 80 68 38 53
Singapore 5 2291753 2.181736 52759.27 0 74 8 20 48
South Africa 45 4013779 11.21138 10195.28 0 49 49 65 63
Spain 86 14014911 6.136322 29144.48 0 57 86 51 42
Sudan 51 376720 135.3791 2475.099 0 80 68 38 53
Surinam 7 117024 59.81679 11446.53 0 85 92 47 37
Switzerland 24 6617002 3.62702 46874.84 16.7 34 58 68 70
Thailand 47 3397749 13.83269 9901.468 0 64 64 20 34
Trinidad 0 812928 0 20778.29 0 47 55 16 58
Tunisia 2 684581 2.921495 8032.142 0 80 68 38 53
Turkey 43 4204368 10.22746 13723.33 6.5 66 85 37 45
Uruguay 8 340986 23.46137 12676.59 0 61 100 36 38
United States 1335 298387856 4.474043 44806.29 0 40 46 91 62
Venezuela 90 4521515 19.90483 15456.48 0 81 76 12 73
Yemen 19 475578 39.95139 3959.68 0 80 68 38 53
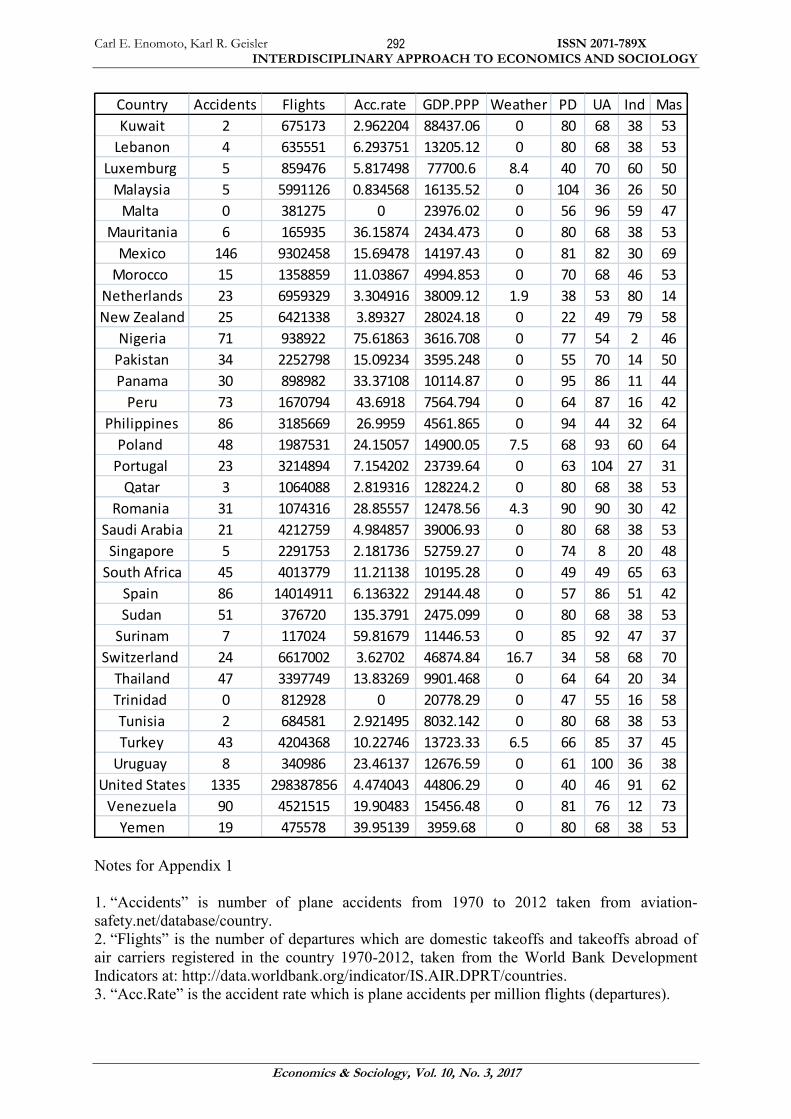
Notes for Appendix 1
1. “Accidents” is number of plane accidents from 1970 to 2012 taken from aviation-
safety.net/database/country.
2. “Flights” is the number of departures which are domestic takeoffs and takeoffs abroad of
air carriers registered in the country 1970-2012, taken from the World Bank Development
Indicators at: http://data.worldbank.org/indicator/IS.AIR.DPRT/countries.
3. “Acc.Rate” is the accident rate which is plane accidents per million flights (departures).
Carl E. Enomoto, Karl R. Geisler ISSN 2071-789X
INTERDISCIPLINARY APPROACH TO ECONOMICS AND SOCIOLOGY
Economics & Sociology, Vol. 10, No. 3, 2017
293
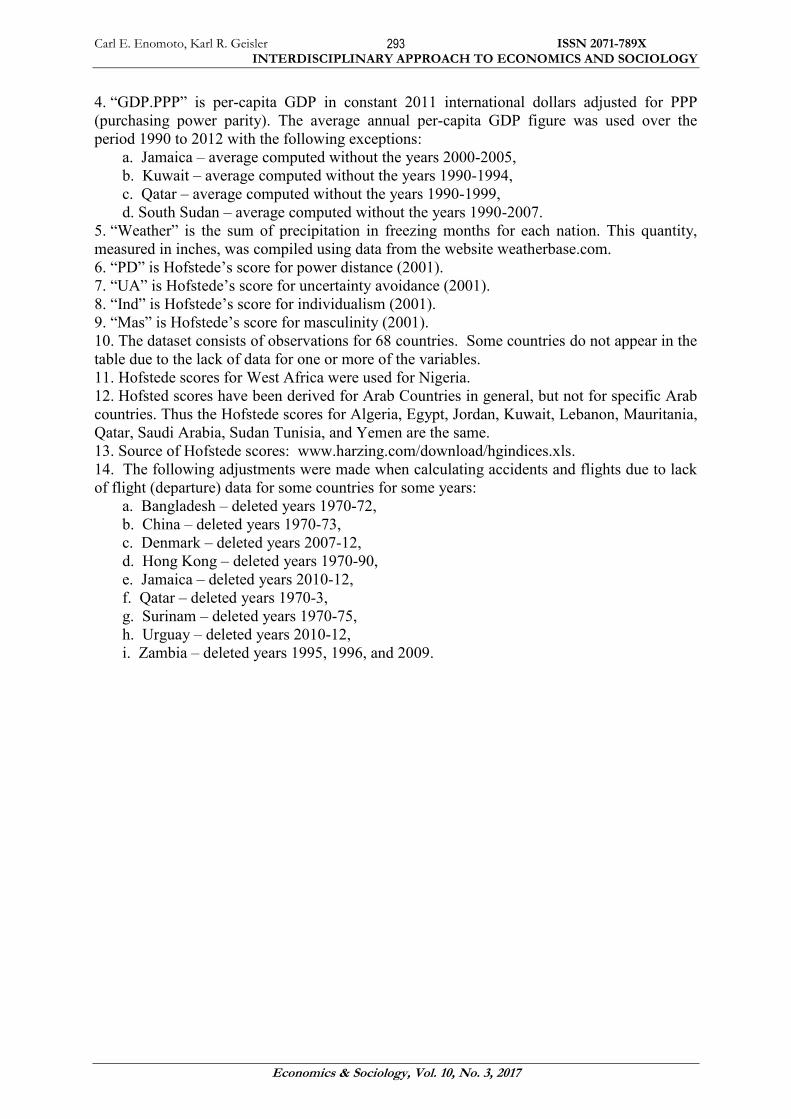
4. “GDP.PPP” is per-capita GDP in constant 2011 international dollars adjusted for PPP
(purchasing power parity). The average annual per-capita GDP figure was used over the
period 1990 to 2012 with the following exceptions:
a. Jamaica – average computed without the years 2000-2005,
b. Kuwait – average computed without the years 1990-1994,
c. Qatar – average computed without the years 1990-1999,
d. South Sudan – average computed without the years 1990-2007.
5. “Weather” is the sum of precipitation in freezing months for each nation. This quantity,
measured in inches, was compiled using data from the website weatherbase.com.
6. “PD” is Hofstede’s score for power distance (2001).
7. “UA” is Hofstede’s score for uncertainty avoidance (2001).
8. “Ind” is Hofstede’s score for individualism (2001).
9. “Mas” is Hofstede’s score for masculinity (2001).
10. The dataset consists of observations for 68 countries. Some countries do not appear in the
table due to the lack of data for one or more of the variables.
11. Hofstede scores for West Africa were used for Nigeria.
12. Hofsted scores have been derived for Arab Countries in general, but not for specific Arab
countries. Thus the Hofstede scores for Algeria, Egypt, Jordan, Kuwait, Lebanon, Mauritania,
Qatar, Saudi Arabia, Sudan Tunisia, and Yemen are the same.
13. Source of Hofstede scores: www.harzing.com/download/hgindices.xls.
14. The following adjustments were made when calculating accidents and flights due to lack
of flight (departure) data for some countries for some years:
a. Bangladesh – deleted years 1970-72,
b. China – deleted years 1970-73,
c. Denmark – deleted years 2007-12,
d. Hong Kong – deleted years 1970-90,
e. Jamaica – deleted years 2010-12,
f. Qatar – deleted years 1970-3,
g. Surinam – deleted years 1970-75,
h. Urguay – deleted years 2010-12,
i. Zambia – deleted years 1995, 1996, and 2009.
Top Related