


Languages
Pages
Legal


Independent market research and
competitive analysis of next-generation
business and technology solutions for
service providers and vendors
CSP Revenue Management:
Enabling the Digital Service
Provider Evolution A Heavy Reading white paper produced for
AUTHOR: JAMES CRAWSHAW, SENIOR ANALYST, HEAVY READING

© HEAVY READING | NOVEMBER 2017 | CSP REVENUE MANAGEMENT 2
EXECUTIVE SUMMARY
In the last decade, the telecom market has changed dramatically, with the rise of a new
generation of cloud-native businesses that interact with their customers exclusively via the
Internet. The rapid migration of content (OTT video), applications (enterprise SaaS) and
services (storage) to the cloud has driven widespread network transformation.
Communications service providers (CSPs) have spent billions upgrading their networks to
deliver the bandwidth that consumers and enterprises demand. However, many CSPs con-
tinue to operate with the same business support systems (BSS) they employed in the era of
telephony and Web browsing.
Without modern revenue management capabilities, CSPs cannot properly monetize their
assets. This applies to their established communications services, such as voice, as well as
emerging digital ones, such as e-health and the connected home.
Those limitations make CSPs unattractive to potential partners such as content providers.
Digital service providers are looking for CSPs that can provide a reliable platform through
which they can offer multiple services and, more importantly, collect revenue.
The ability to rate service, charge precisely and bill accurately are table stakes for revenue
management. To truly add value, revenue management systems must enable the rapid
launch of innovative new services, monetize them simply, and support an engaging user
experience for consumers and enterprises.
CSPs need to evolve their revenue management systems to become monetization platforms
that provide agile service innovation and superior customer experience with greater cost-
efficiency. By doing so, CSPs can position themselves as enablers of digital commerce,
providing a platform play for the digital revolution for which they have laid the groundwork.
In October 2017, Heavy Reading conducted an online survey of 100 CSP representatives
working for around 75 different organizations across the globe. The questionnaire assessed
the current state of CSP revenue management systems and explored their priorities for
modernization.
The body of this report contains the responses to the 25 multi-part questions related to rev-
enue management. The survey highlights where CSPs are focusing their efforts, what capa-
bilities they believe are important and where the greatest benefits can be achieved from
revenue management modernization.
ONLINE SURVEY ANALYSIS
Research Methodology
The research for this report was carried out in October 2017 and consisted of a Web ques-
tionnaire composed in conjunction with the sponsor. Email invitations were sent to contacts
in the Heavy Reading database. After culling disqualified and incomplete entries, we were
left with 100 valid service provider responses from 76 discrete companies worldwide. This
section provides detailed analysis of the data from this survey.

© HEAVY READING | NOVEMBER 2017 | CSP REVENUE MANAGEMENT 3
Online Survey Demographics
The largest constituent group of respondents worked for converged operators with both
fixed and mobile infrastructure. The next largest group were mobile network operators, fol-
lowed by fixed-line operators. Others include MVNOs and enterprise-only service providers.
Example companies participating in this survey include AT&T, Bell Canada, CenturyLink,
Comcast, Cox, Orange, Telefónica and Verizon.
Figure 1: What Type of Communications Service Provider Do You Work For?
Source: Heavy Reading survey, October 2017, n=100
Slightly more than half of respondents work in the North America region, and nearly a fifth
work in Europe. The next largest regions were Latin America and Asia/Pacific, followed by
Africa and Middle East.
Figure 2: Which Is the Main Region in Which You Personally Work?
Source: Heavy Reading survey, October 2017, n=100
Converged operator
(fixed and mobile) 40%
Mobile network
operator 32% Fixed-line
network operator21%
Other
7%
U.S.
45%
Europe
19%
Central/South
America10%
Asia/Pacific
10%
Canada
9%
Africa
4%
Middle East
3%

© HEAVY READING | NOVEMBER 2017 | CSP REVENUE MANAGEMENT 4
A Blend of Perspectives Across IT & Business
The largest group of respondents work in IT engineering and planning, closely followed by
those working for the CTO office, including R&D. There were similar sized groups from sales
and marketing, executive management and IT operations. CIO office workers and those in
product/service management constituted the remainder.
Figure 3: What Is Your Primary Job Function?
Source: Heavy Reading survey, October 2017, n=100
Main Survey
A Mishmash of Aging Systems
We asked the survey participants whether their organization used 1, 2 to 4, 5 to 10 or
more than 10 different systems for each of 6 system categories (Billing, Invoicing, Rating,
Mediation, Charging, Analytics). We also asked about the average age of these systems for
each category: less than 2 years, 2-5 years, or more than 5 years. For presentation below
we estimated, based on the survey responses, the average number of systems for each
category and their average age.
We found that the average number of revenue management systems for each category was
around 5, with slightly more billing and charging systems than average and slightly fewer
rating and mediation systems. The average age of revenue management systems overall
was around 4 years, with billing systems being significantly (25%) older than average and
analytics systems being significantly (24%) younger.
Figure 4: Average Number & Age of Revenue Management Systems
System Average # of Systems Average Age
Billing 5.2 5.2
Invoicing 4.7 4.7
IT engineering
& planning27%
R&D, CTO office
22%Sales & marketing
12%
Executive
management 12%
IT, data center, or
cloud operations 11%
CIO office
9%
Product/service
management 7%
© HEAVY READING | NOVEMBER 2017 | CSP REVENUE MANAGEMENT 5
System Average # of Systems Average Age
Rating 4.4 3.7
Mediation 4.2 3.9
Charging 5.1 4.4
Analytics 4.9 3.2
Average 4.8 4.2
Source: Heavy Reading survey, October 2017, n=100
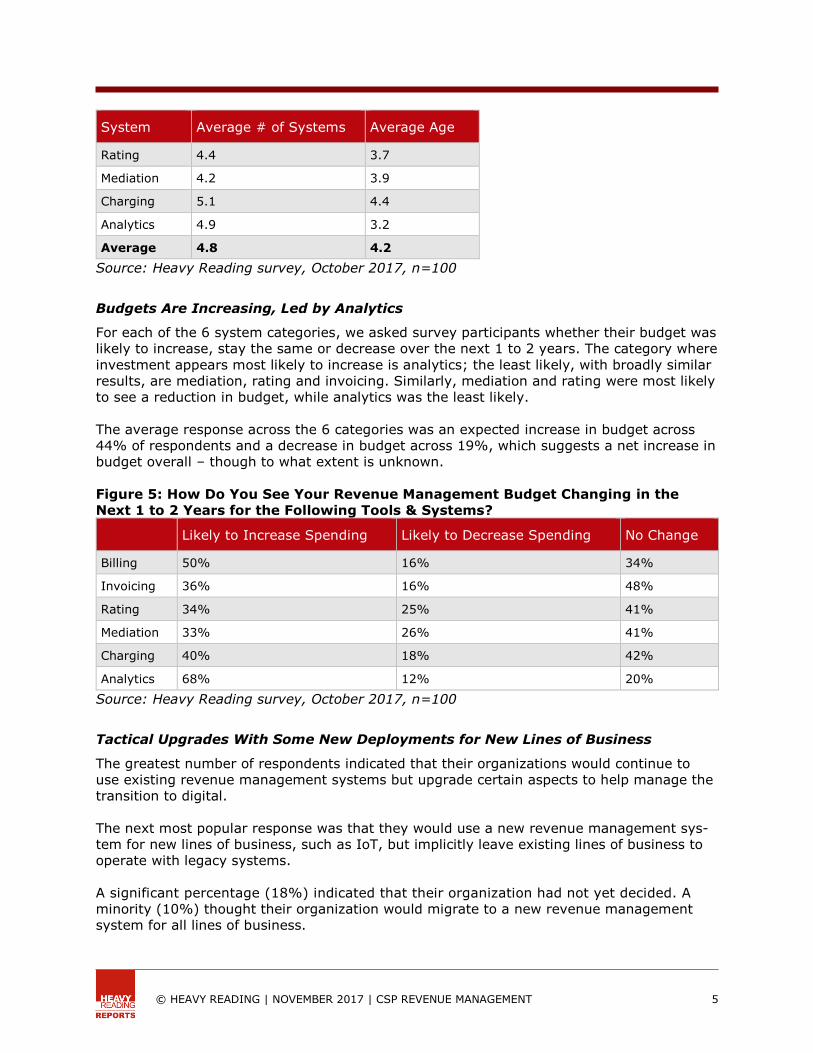
Budgets Are Increasing, Led by Analytics
For each of the 6 system categories, we asked survey participants whether their budget was
likely to increase, stay the same or decrease over the next 1 to 2 years. The category where
investment appears most likely to increase is analytics; the least likely, with broadly similar
results, are mediation, rating and invoicing. Similarly, mediation and rating were most likely
to see a reduction in budget, while analytics was the least likely.
The average response across the 6 categories was an expected increase in budget across
44% of respondents and a decrease in budget across 19%, which suggests a net increase in
budget overall – though to what extent is unknown.
Figure 5: How Do You See Your Revenue Management Budget Changing in the
Next 1 to 2 Years for the Following Tools & Systems?
Likely to Increase Spending Likely to Decrease Spending No Change
Billing 50% 16% 34%
Invoicing 36% 16% 48%
Rating 34% 25% 41%
Mediation 33% 26% 41%
Charging 40% 18% 42%
Analytics 68% 12% 20%
Source: Heavy Reading survey, October 2017, n=100
Tactical Upgrades With Some New Deployments for New Lines of Business
The greatest number of respondents indicated that their organizations would continue to
use existing revenue management systems but upgrade certain aspects to help manage the
transition to digital.
The next most popular response was that they would use a new revenue management sys-
tem for new lines of business, such as IoT, but implicitly leave existing lines of business to
operate with legacy systems.
A significant percentage (18%) indicated that their organization had not yet decided. A
minority (10%) thought their organization would migrate to a new revenue management
system for all lines of business.

© HEAVY READING | NOVEMBER 2017 | CSP REVENUE MANAGEMENT 6
Figure 6: How Do You Plan to Upgrade Your Revenue Management Systems to
Support Business Transformation?
Source: Heavy Reading survey, October 2017, n=99
Shortcomings of Existing BSS
Respondents were asked to assign an importance score to 5 shortcomings. We weighted
these responses as follows: 100% for a 5, 63% for a 4, 38% for a 3, 13% for a 2 and 0%
for a 1. Figure 7 is sorted by this score, showing that configurability is the most important
shortcoming, while integration between policy management and billing is the least.
Figure 7: Shortcomings of Your Current BSS
Shortcoming 2017
Importance
2017
Ranking
2013
Ranking
Very difficult to configure & launch new offers 54% 1 5
Post-paid systems are not real-time 52% 2 4
Difficulty enforcing network policies associated with data packages
50% 3 3
Siloed BSS systems resulting in redundancy & complexity 49% 4 2
Lack of integration & synchronization between policy man-agement & billing systems
47% 5 1
Source: Heavy Reading survey, October 2017, n=98. 2013 data is from the Heavy Reading
report "Monetizing Data: The Role of BSS in the Digital Revolution," November 2013
The right-hand column gives the rankings of these shortcomings according to a survey
Heavy Reading conducted in 2013 with the same question. Surprisingly, the rankings are
completely inverted: The shortcomings that were highest priority in 2013 are now the least
important, and vice versa. This may reflect the fact that operators have solved a lot of the
technical challenges that they faced 4 years ago, such as system integration, but they still
haven't solved the challenge of making the business more agile to improve customer experi-
ence and reduce cost.
We will continue to use
our existing revenue
management systems but will upgrade aspects
to help manage transition to digital
41%
We will use a new
revenue management system for new lines of business such as IoT
31%
We will migrate to a new
revenue management system for all our lines
of business 10%
We haven't
decided yet 18%

© HEAVY READING | NOVEMBER 2017 | CSP REVENUE MANAGEMENT 7
Lack of Real-Time Capabilities Still Restricts BSS
Respondents were asked to assign an importance score to 8 limitations. We weighted these
responses as follows: 100% for a 5, 63% for a 4, 38% for a 3, 13% for a 2 and 0% for a 1.
Figure 8 is sorted by this score, showing that slow time to market is the most important
limitation, while inability to provide loyalty programs is the least.
Figure 8: Limitations That Result From a Lack of "Real-Time" Capability in Your BSS
Limitation 2017
Importance
2017
Ranking
2013
Ranking
Slow time to market with product launches & changes to plans 59.6% 1 1
Inability to convert huge amounts of data into real-time actiona-ble insights
51.1% 2 5
Inability to provide customers with self-controlled spending limits 50.8% 3 4
Inability to allow customers to change their service plans them-selves
50.7% 4 8
Inability to provide creative charging packaging for advanced
data services
50.5% 5 3
Inability to provide creative package bundles 48.7% 6 6
Inability to provide real-time upsell of services 48.6% 7 2
Inability to provide effective loyalty programs 41.3% 8 7
Source: Heavy Reading survey, October 2017, n=98. 2013 data is from the Heavy Reading
report "Monetizing Data: The Role of BSS in the Digital Revolution," November 2013
The right-hand column gives the rankings of these shortcomings according to a survey
Heavy Reading conducted in 2013 with the same question. Time to market was also the key
limitation in the 2013 survey, and loyalty programs were considered less important. However,
the rankings of many of the other factors have changed noticeably: For example, customer
empowerment features jumped from last to fourth. This may reflect users' increased expecta-
tions about self-service from their experience using digital services such as Uber and Netflix.
Importance of a Unified Approach to Converged Billing
Respondents were asked to assign an importance score to nine benefits. We weighted these
as follows: 100% for a 5, 63% for a 4, 38% for a 3, 13% for a 2 and 0% for a 1. Figure 9
is sorted by this score, showing that operational efficiency and time to market are the most
important benefits, while marketing flexibility and prepaid customer care are the least.
Figure 9: Potential Benefits of Unified Approach to Converged Billing for BSS
Benefit 2017
Importance
2017
Ranking
2013
Ranking
Operational efficiency resulting from fewer systems 61.8% 1 1
Centralized product & offer definition in one place for fast time to market
61.1% 2 3
Ability to deliver relevant, usage-driven offers to increase spend 58.5% 3 6

© HEAVY READING | NOVEMBER 2017 | CSP REVENUE MANAGEMENT 8
Benefit 2017
Importance
2017
Ranking
2013
Ranking
Consistent & complete customer information available through any touchpoint for consistent customer experience
57.4% 4 9
Real-time rating for postpaid subscribers for credit control & "bill shock" prevention
56.5% 5 2
Ability to support family plans that mix prepaid & postpaid models for customer satisfaction & marketing flexibility
55.2% 6 7
Tight linkage with policy to support differentiated charging schemes (e.g., by service, website, etc.) & capture revenue
54.0% 7 5
Rich customer care options & loyalty plans to prepaid subscribers for customer satisfaction
52.7% 8 4
No limits or restrictions on what can be sold (any combination of service & payment type), increasing marketing flexibility
51.7% 9 8
Source: Heavy Reading survey, October 2017, n=98. 2013 data is from the Heavy Reading report "Monetizing Data: The Role of BSS in the Digital Revolution," November 2013 The right-hand column gives the rankings of these shortcomings according to a survey Heavy Reading conducted in 2013 with the same question. Operational efficiency and time to market were also considered important back then.
Cost Reduction & Revenue Generation: The Key Drivers for Modernization
Respondents were asked to rank 5 reasons from 5 (most important) to 1 (least). Figure 10 shows the average ranking for each reason. The most popular reason was cost reduction, closely followed by revenue generation. Revenue assurance was deemed less important, and cost reduction by moving to software-as-a-service (SaaS) was considered the least important reason. Figure 10: Which of the Following Reasons to Modernize Your Organizations' Revenue Management Systems Is Most Important?
Source: Heavy Reading survey, October 2017, n=94
2.3
2.8
3.3
3.4
3.5
2.0 2.5 3.0 3.5 4.0
Cost reduction by moving to SaaS
Revenue assurance/fraud management
Revenue generation through increased agility –the ability to bring new offerings to market
more quickly
Revenue generation – find new customersand new product/service offerings through
innovations such as real-time/online charging
Cost reduction through consolidating existing systems (e.g., separate prepaid and postpaid systems, separate fixed/mobile/TV systems)

© HEAVY READING | NOVEMBER 2017 | CSP REVENUE MANAGEMENT 9
Key System Capabilities: Complex Accounts & Personalized Offers
Respondents were asked to rank 7 services from 7 (most important) to 1 (least). Figure
11 shows the average ranking for each service. The most popular response was "Complex
account relationships and hierarchies." This was closely followed by personalized, context-
aware offers and IoT services. Ad-sponsored services (including zero-rating) were the least
popular response, followed by VoLTE.
Figure 11: Which of the Following Services That a Modernized Revenue Management
System Enables Is Most Important to Your Organization?
Source: Heavy Reading survey, October 2017, n=91
* enabling direct sales (digital and physical goods), sales through resellers, billing on behalf
of third parties and other B2B2X permutations
Key Revenue Management Features
Respondents were asked whether they deemed 13 different aspects to be high, medium or
low priority, and whether they already had this capability. Figure 12 shows the percentage
of "high priority" minus "low priority" responses in the middle column. The right-hand column
shows how many indicated that they already have this capability. We have sorted the table
by the middle column to highlight those aspects that are considered the most important.
Figure 12: Which of These Aspects of a Revenue Management Solution Are Im-
portant to Your Organization & Which Do You Currently Have?
Aspects High Minus Low Priority Have?
Real-time policy enforcement 46% 46%
Single charging engine for prepaid and postpaid 44% 57%
Real-time balance management and notifications 39% 45%
Flexible pricing, bundling, and discounting 39% 43%
Integrated charging and policy management 38% 51%
5.0
4.8
4.7
4.4
3.8
3.4
2.8
2.0 2.5 3.0 3.5 4.0 4.5 5.0 5.5
Complex account relationships and hierarchies*
Personalized, context aware offers (e.g.,
location- or data-usage-profile-based)
IoT services (including connected home,
car, etc.)
Bundling offers from third-party content
providers such as video and music streaming
Time-based bundles instead of minute- or
data-limited bundles
VoLTE
Ad-sponsored services (including zero-rating)

© HEAVY READING | NOVEMBER 2017 | CSP REVENUE MANAGEMENT 10
Aspects High Minus Low Priority Have?
Accounts receivable, payments processing, and taxation 36% 48%
Embedded analytics for customer insight 33% 29%
Integrated real-time offer management capability 32% 31%
Support QoS-driven offers 24% 34%
Integrated, centralized catalog 17% 27%
Support partner settlement and contract management 16% 40%
Hot billing 7% 35%
Support loyalty points -2% 41%
Source: Heavy Reading survey, October 2017, n=96
Real-time policy enforcement and a single charging engine for pre- and post-paid are con-
sidered the most important aspects, closely followed by real-time balance management,
flexible pricing and integrated charging and policy management. Loyalty points and "hot
billing" were not considered to be a high priority by most respondents.
We have plotted the two columns above on an X-Y axis in Figure 13. There is a general
correlation between aspects being considered high priority and operators already having
these capabilities. Loyalty points is an outlier, in that it is of low importance relative to its
actual deployment. Conversely, analytics for customer insight, real-time offers, flexible
pricing and real-time policy are slightly less prevalent relative to their importance.
Figure 13: Importance of Revenue Management Features vs. Existence
Source: Heavy Reading survey, October 2017
Single charging engine
Charging & policymanagement
Accountsreceivable Policy
enforcementBalancemanagement
FlexiblepricingLoyalty
points Partnersettlement
Hotbilling QoS-driven
offers
Offer management
Embedded analyticsCentralized
catalog25%
30%
35%
40%
45%
50%
55%
60%
-10% 0% 10% 20% 30% 40% 50%
Cu
rren
tly H
ave T
his
Cap
ab
ilit
y
High Priority Minus Low Priority
© HEAVY READING | NOVEMBER 2017 | CSP REVENUE MANAGEMENT 11
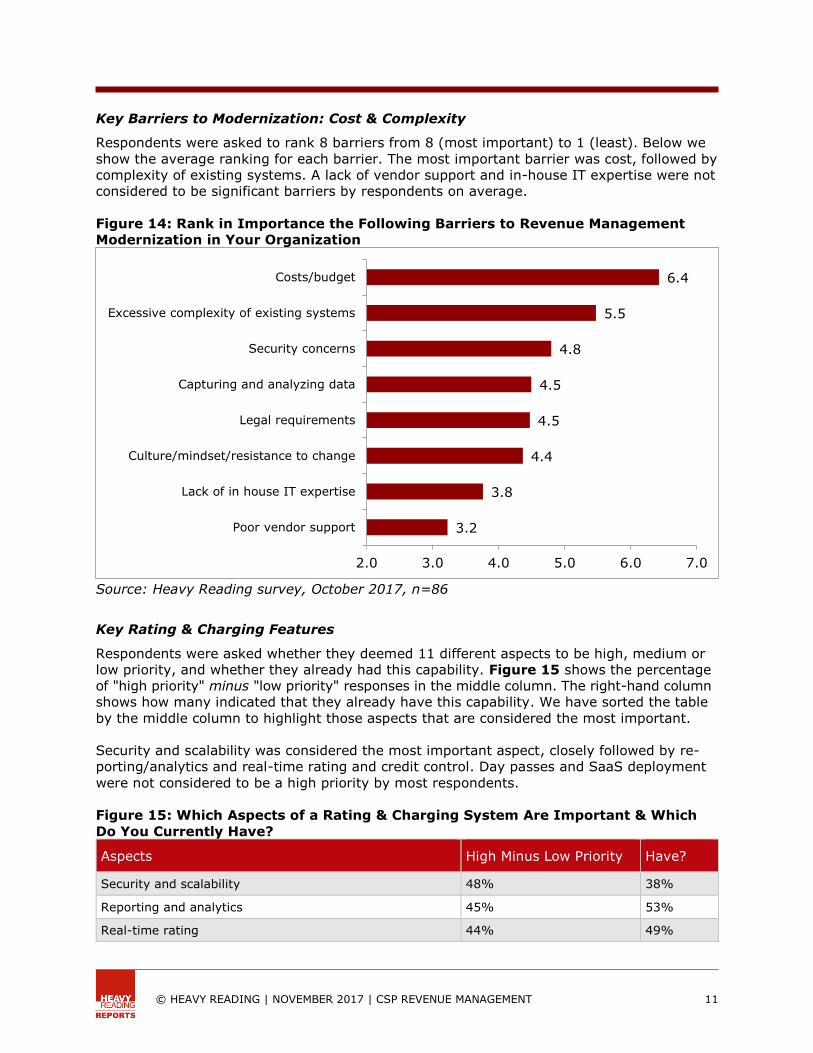
Key Barriers to Modernization: Cost & Complexity
Respondents were asked to rank 8 barriers from 8 (most important) to 1 (least). Below we
show the average ranking for each barrier. The most important barrier was cost, followed by
complexity of existing systems. A lack of vendor support and in-house IT expertise were not
considered to be significant barriers by respondents on average.
Figure 14: Rank in Importance the Following Barriers to Revenue Management
Modernization in Your Organization
Source: Heavy Reading survey, October 2017, n=86
Key Rating & Charging Features
Respondents were asked whether they deemed 11 different aspects to be high, medium or
low priority, and whether they already had this capability. Figure 15 shows the percentage
of "high priority" minus "low priority" responses in the middle column. The right-hand column
shows how many indicated that they already have this capability. We have sorted the table
by the middle column to highlight those aspects that are considered the most important.
Security and scalability was considered the most important aspect, closely followed by re-
porting/analytics and real-time rating and credit control. Day passes and SaaS deployment
were not considered to be a high priority by most respondents.
Figure 15: Which Aspects of a Rating & Charging System Are Important & Which
Do You Currently Have?
Aspects High Minus Low Priority Have?
Security and scalability 48% 38%
Reporting and analytics 45% 53%
Real-time rating 44% 49%
6.4
5.5
4.8
4.5
4.5
4.4
3.8
3.2
2.0 3.0 4.0 5.0 6.0 7.0
Costs/budget
Excessive complexity of existing systems
Security concerns
Capturing and analyzing data
Legal requirements
Culture/mindset/resistance to change
Lack of in house IT expertise
Poor vendor support

© HEAVY READING | NOVEMBER 2017 | CSP REVENUE MANAGEMENT 12
Aspects High Minus Low Priority Have?
Real-time credit control for postpaid customers 40% 44%
Segmented tariff plans 29% 41%
Tiered usage rating and notifications 24% 36%
Usage sharing and pooling options 21% 34%
Custom usage mediation 17% 43%
Hybrid accounts that combine pre- & post-paid elements 14% 26%
New service offerings such as day passes 8% 26%
SaaS deployment -4% 21%
Source: Heavy Reading survey, October 2017, n=94
We have plotted the two columns above on an X-Y axis in Figure 16. There is a general
correlation between aspects being considered high priority and operators already having
these capabilities. Custom usage mediation is an outlier, in that it is of low importance rela-
tive to its actual deployment. Conversely, security and scalability are less prevalent relative
to their importance.
Figure 16: Importance of Rating & Charging Features vs. Existence
Source: Heavy Reading survey, October 2017
Reporting &analytics
Real-timerating
Real-timecredit control
Custom usage mediation
Segmentedtariff plans
Security &scalabilityTiered
usage ratingUsage sharing &
pooling
New serviceofferings
Hybridaccounts
SaaS
20%
25%
30%
35%
40%
45%
50%
55%
-10% 0% 10% 20% 30% 40% 50% 60%
Cu
rren
tly H
ave T
his
Cap
ab
ilit
y
High Priority Minus Low Priority

© HEAVY READING | NOVEMBER 2017 | CSP REVENUE MANAGEMENT 13
Key Billing Features
Respondents were asked whether they deemed 17 different billing aspects to be high, me-
dium or low priority, and whether they already had this capability. Figure 17 shows the
percentage of "high priority" minus "low priority" responses in the middle column. The right-
hand column shows how many indicated that they already have this capability. We have
sorted the table by the middle column to highlight those aspects that are considered the
most important.
Electronic bill presentment was considered the most important aspect by a significant
margin. Roaming self-administration and SaaS deployment were not considered to be a
high priority by most respondents.
Figure 17: Which Aspects of a Billing System Are Important & Which Do You Cur-
rently Have?
Aspects High Minus Low Priority Have?
Electronic bill presentment 56% 62%
Mobile payments 46% 46%
Ability to manage complex account hierarchies 45% 42%
Security and scalability 45% 43%
Shared plans (e.g., family) 43% 51%
Reporting and analytics 42% 53%
Bundled (rolled-up) billing 39% 48%
Bill cycle dashboards and configurable bill frequencies 37% 41%
Balance management (including transfers) 32% 42%
Direct carrier billing enablement 32% 32%
Bill shock prevention 28% 35%
ERP/financial management integration 27% 33%
Split billing e.g. wholesale services with multiple parties 24% 32%
Debt/dunning management 14% 35%
Ability to support consumer-to-consumer business models 13% 24%
Roaming self-administration 1% 31%
SaaS deployment 0% 22%
Source: Heavy Reading survey, October 2017, n=96
We have plotted the two columns above on an X-Y axis in Figure 18. There is a general
correlation between aspects being considered high priority and operators already having
these capabilities.
Roaming self-administration is an outlier, in that it is of low importance relative to its actual
deployment. Conversely, the ability to manage complex account hierarchies and security/
scalability are less prevalent relative to their importance.

© HEAVY READING | NOVEMBER 2017 | CSP REVENUE MANAGEMENT 14
Figure 18: Importance of Billing Features vs. Existence
Source: Heavy Reading survey, October 2017
Key Product Catalog & Price Plan Features
Respondents were asked whether they deemed 10 different product catalog and price plan
features to be high, medium or low priority and whether they already had this capability.
Figure 19 shows the percentage of "high priority" minus "low priority" responses in the
middle column. The right-hand column shows how many indicated that they already have this
capability. We have sorted the table by the middle column to highlight those aspects that are
considered the most important. Security and scalability was considered the most important
aspect. SaaS deployment was not considered to be a high priority by most respondents.
Figure 19: Which Aspects of a Product Catalog & Price Plan System Are Important
& Which Do You Currently Have?
Aspects High Minus Low Priority Have?
Security and scalability 55% 40%
Recurring subscriptions can be monthly, quarterly, or annual 48% 56%
Can configure, test, and implement new service offerings quickly through configurability (not coding)
45% 28%
Reporting and analytics 45% 51%
Electronic bill presentment
Reporting & analyticsShared plans
Bundled billing
Mobile payments
Security &scalability
Accounthierarchies
Balancemanagement
Bill cycledashboards
Debt/dunning management
Bill shock preventionERP/financial management Direct carrier billing
Split billingRoaming
self-admin.
Consumer-to-consumer business
modelsSaaS
20%
25%
30%
35%
40%
45%
50%
55%
60%
65%
0% 10% 20% 30% 40% 50% 60%
Cu
rren
tly H
ave T
his
Cap
ab
ilit
y
High Priority Minus Low Priority

© HEAVY READING | NOVEMBER 2017 | CSP REVENUE MANAGEMENT 15
Aspects High Minus Low Priority Have?
Usage-based contracts 40% 48%
Enables one-time purchases 36% 50%
Ability to offer free trials, add-ons, discounts/promotions, and tiered pricing
32% 43%
Can be configured by customer tier, region, country, etc., with support for multiple languages, currencies and taxation rules
29% 33%
Enables account representatives to create personalized offers 23% 33%
SaaS deployment 2% 22%
Source: Heavy Reading survey, October 2017, n=92
We have plotted the two columns above on an X-Y axis in Figure 20. There is a general
correlation between aspects being considered high priority and operators already having these
capabilities. The ability to implement new service offerings quickly through configurability
(as opposed to coding) is an outlier, in that its availability is low relative to its importance.
Figure 20: Importance of Product Catalog & Price Plan Features vs. Existence
Source: Heavy Reading survey, October 2017
Post/Pre-Paid Billing Is Converged, but Subscriber Management Not Yet Centralized
Respondents were presented with the seven statements below and asked whether they to-
tally agreed, partly agreed, partly disagreed, totally disagreed or didn't know/weren't sure.
For ease of presentation, Figure 21 shows the percentage of respondents agreeing (either
totally or partly) minus those disagreeing with the statements.
Recurring subscriptions
Reporting &analyticsOne-time
purchasesUsage-based contracts
Free trials,add-ons, etc.
Security &scalability
Personalizedoffers
Configureby region,
country, etc.
Rapid configurability (not coding)
SaaS20%
25%
30%
35%
40%
45%
50%
55%
60%
0% 10% 20% 30% 40% 50% 60%
Cu
rren
tly H
ave T
his
Cap
ab
ilit
y
High Priority Minus Low Priority

© HEAVY READING | NOVEMBER 2017 | CSP REVENUE MANAGEMENT 16
Respondents were most emphatic about the convergence of post- and prepaid billing (65%
agreed with this statement), closely followed by rate plan flexibility (64% agreed that they
were taking full advantage of this to launch new offers). There was the least conviction
about centralization of subscriber management information (36% disagreed with the state-
ment) and unified product and service catalogs (32% disagreed).
Figure 21: To What Degree Would You Agree With the Following Statements?
Agree-
Disagree
We have fully converged our post-paid batch billing and real-time prepaid billing systems 45%
We are taking full advantage of the rate plan flexibility that rule-based rating enables to launch innovative new tariffs 43%
We have completely unified Account Balance management for prepaid and postpaid 30%
We have significantly reduced the time it takes to launch new products and services 26%
Our revenue management system is seamlessly integrated with CRM and ERP 19%
We have completely unified our product and service catalogs 18%
Our subscriber management is fully centralized (info is no longer held in separate silos) 12%
Source: Heavy Reading survey, October 2017, n=99
On-Premises Remains the Default Deployment Option for Revenue Management
On-premises appears to be the most popular choice for revenue management system deploy-
ment, with an average of 82% seeing this as likely, versus 76% for private cloud and just
25% for public cloud. Public cloud was relatively more popular for analytics than other appli-
cations. Billing was the least likely option for public cloud, with 80% seeing this as unlikely.
Figure 22: Is It Likely That Your Organization Uses the Following Deployment
Options for These Revenue Management Systems in the Next 1 to 2 Years?
% Answering "Likely" On-Premises Private Cloud Public Cloud
Billing 83% 81% 20%
Invoicing 81% 77% 23%
Rating 83% 70% 28%
Mediation 75% 68% 22%
Charging 84% 77% 25%
Analytics 84% 83% 32%
Average 82% 76% 25%
Source: Heavy Reading survey, October 2017, n=69
Operators Mostly Supporting IoT With Existing Billing Systems
Around half of respondents expect to upgrade or adapt their existing billing systems to sup-
port new IoT services. Of the remainder, around two thirds expect to implement a new billing
system for IoT on-premises, and the remainder expect a new system delivered via SaaS.

© HEAVY READING | NOVEMBER 2017 | CSP REVENUE MANAGEMENT 17
Figure 23: How Will You Support Billing for New IoT Services?
Source: Heavy Reading survey, October 2017, n=98
Time to Market Has Reduced
We asked participants how long it generally takes to introduce a new offer, such as a data
plan. Below we compare the results with those of the survey we conducted in 2013. Note in
2013 we had three options: 1 to 3 months, 3 to 6 months, and 6 to 9 months. The survey in
2013 did not even contemplate time scales of less than 1 month.
Although the 2017 survey had different response options, making it difficult to compare
directly with the 2013 study, it is clear that a significantly higher percentage of respondents
consider their systems capable of introducing new offers in less than 3 months, with nearly
a quarter indicating a lead time of under a week and around half under a month.
The percentage of respondents indicating lead times of 3 to 6 months has dropped from
54% to 12%, and those waiting more than 6 months has dropped from 26% to 16%.
Figure 24: How Long Does It Take to Introduce a New Offer (e.g., Data Plan) Today?
2017 Study 2017 Responses 2013 Study 2013 Responses
1 to 2 days 14%
3 to 6 days 9%
1 to 4 weeks 25%
1 to 2 months 23%
Subtotal 72% 1 to 3 months 20%
3 to 6 months 12% 3 to 6 months 54%
> 6 months 16% 6 to 9 months 26%
Source: Heavy Reading
Upgrade/adapt
existing billing system52%
Implement a new
billing system for
IoT – on-premises32%
Implement a new
billing system for IoT – SaaS
16%

© HEAVY READING | NOVEMBER 2017 | CSP REVENUE MANAGEMENT 18
Bottlenecks to New Plan Introduction: Bureaucracy, Complexity & Cost
We asked respondents to identify the biggest bottlenecks in the introduction of new plans.
Of the 89 free-text responses, 60 of them are categorized in Figure 25.
Management bureaucracy was the top complaint, including comments such as "red tape,"
"conservatism of leadership," and "inability for management to see how time to market and
flexibility are crucial to winning."
The complexity and age of billing systems was the next most popular category, with com-
ments such as "system very complicated, a lot of dependencies," "right product configura-
tion may require vendor intervention for code change," and "configurations on multiple in-
terconnected systems."
Costs and justifying the business case was also popular, with comments such as "determining
margin impact and revenue per user of potential plans under consideration" and "creating
the business case and adapting the billing system for it."
Figure 25: What Is the Biggest Bottleneck in the Process of Introducing New Plans?
Bottleneck # of Respondents
Management/bureaucracy 14
Complexity/age of billing systems 11
Costs/business case 11
Integration 7
Processes 7
Employee skills 6
Competition 2
Regulation, legal, security 2
Other 29
Total 89
Source: Heavy Reading or Company
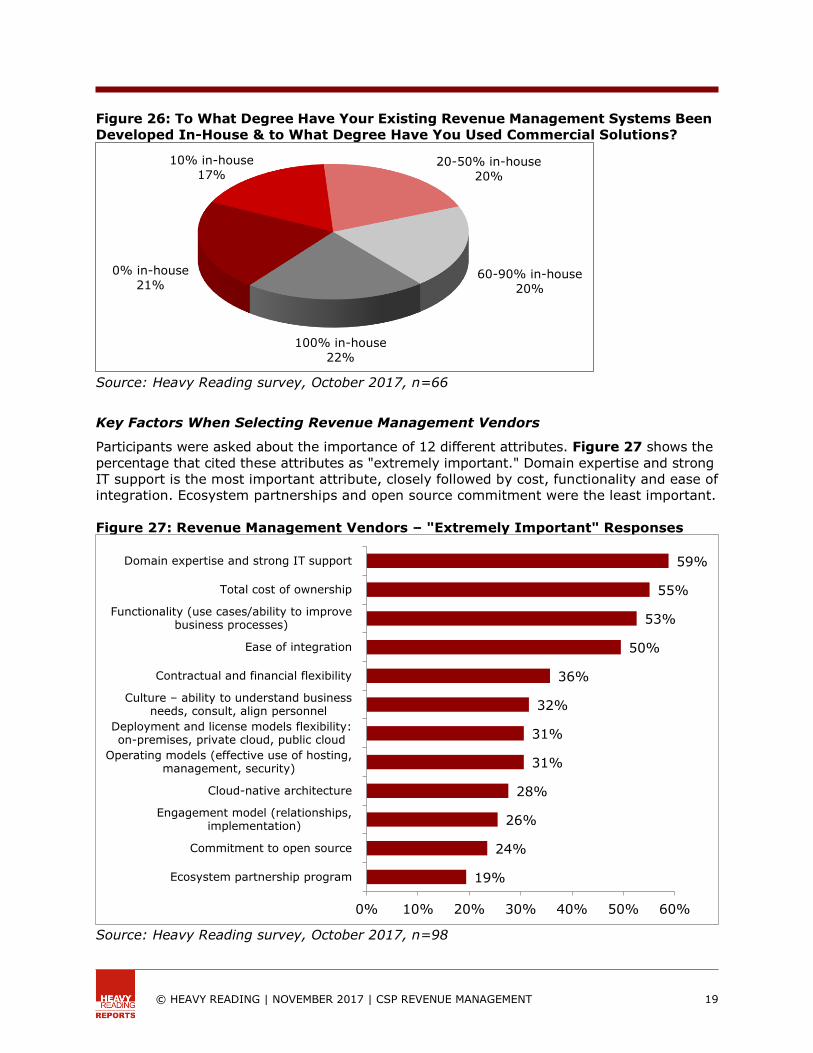
A Mixture of In-House Development & Commercial Solutions
We asked participants: "To what degree have your existing revenue management systems
been developed in-house and to what degree have you used commercial solutions?." Of the
84 free-text responses to this question, we have categorized 60 of them into broadly equal
cohorts, as shown in Figure 26. The remaining responses were either ambiguous or "don't
knows." Around a fifth of responses indicated their solutions were entirely commercial, and
a similar percentage claimed they were entirely developed in-house.
Many responses indicated a mixture of in-house and off-the-shelf solutions, with comments
such as "base software from commercial solutions and extensive add-ons and customiza-
tions developed in-house." Some comments indicated a trend toward adoption of more
commercial solutions in future such as "legacy are a mix of in-house and COTS, strategic
is to use COTS."
© HEAVY READING | NOVEMBER 2017 | CSP REVENUE MANAGEMENT 19
Figure 26: To What Degree Have Your Existing Revenue Management Systems Been
Developed In-House & to What Degree Have You Used Commercial Solutions?
Source: Heavy Reading survey, October 2017, n=66
Key Factors When Selecting Revenue Management Vendors
Participants were asked about the importance of 12 different attributes. Figure 27 shows the
percentage that cited these attributes as "extremely important." Domain expertise and strong
IT support is the most important attribute, closely followed by cost, functionality and ease of
integration. Ecosystem partnerships and open source commitment were the least important.
Figure 27: Revenue Management Vendors – "Extremely Important" Responses
Source: Heavy Reading survey, October 2017, n=98
0% in-house
21%
10% in-house
17%20-50% in-house
20%
60-90% in-house
20%
100% in-house
22%
59%
55%
53%
50%
36%
32%
31%
31%
28%
26%
24%
19%
0% 10% 20% 30% 40% 50% 60%
Domain expertise and strong IT support
Total cost of ownership
Functionality (use cases/ability to improvebusiness processes)
Ease of integration
Contractual and financial flexibility
Culture – ability to understand businessneeds, consult, align personnel
Deployment and license models flexibility:on-premises, private cloud, public cloud
Operating models (effective use of hosting, management, security)
Cloud-native architecture
Engagement model (relationships, implementation)
Commitment to open source
Ecosystem partnership program

© HEAVY READING | NOVEMBER 2017 | CSP REVENUE MANAGEMENT 20
CONCLUSIONS
CSPs Are Stuck in a Vicious Cycle of Patching Instead of Transforming
When we asked survey participants, "How do you plan to upgrade your revenue manage-
ment systems to support business transformation?" around 40% indicated they would
continue to use existing revenue management systems but upgrade certain aspects to
help manage the transition to digital. Around 30% said they would use a new revenue
management system for new lines of business such as IoT, but leave existing lines of busi-
ness to operate with legacy systems. Just 10% thought their organization would migrate
to a new revenue management system for all lines of business, and the remaining 20%
were undecided.
The overall trend is that operators continue to make tactical upgrades to existing systems,
with some new system deployments for new lines of business.
Number & Age of Systems Leads to Inefficient Operations
This trend has resulted in a plethora of systems that operators must maintain and integrate.
Our survey found that operators had around 5 different systems for each of 6 separate rev-
enue management categories (Billing, Invoicing, Rating, Mediation, Charging and Analytics),
giving a total of 30 systems on average.
These are a mixture of in-house and commercial solutions accumulated over the years
through M&A and as operators have added services such as Internet connectivity, IPTV and
mobile to their legacy fixed-line telephony offering. In-house systems carry the risk that,
as key individuals retire, the knowledge of how to maintain and update these systems dis-
appears. Operators can face a similar risk with commercial systems if these have been
purchased from smaller vendors that subsequently run into financial difficulties.
The complexity and age of systems was identified as a key bottleneck to the introduction of
new tariffs and plans, with comments such as "system very complicated, a lot of dependen-
cies," "right product configuration may require vendor intervention for code change," and
"configurations on multiple interconnected systems." Siloed systems result in complexity and
integration challenges, which in turn lead to inflexibility and a bloated cost base. Incremen-
tal upgrades on top of legacy systems exacerbate this problem.
Time to Market Has Been Reduced, but Not Enough
However, there are signs that progress has been made. Given the statement, "We have sig-
nificantly reduced the time it takes to launch new products and services," 56% of respond-
ents agreed, while just 30% disagreed and the remainder were unsure. When asked about
time to market, more than 70% of respondents think their revenue management systems
can deliver a new offer in less than 3 months, compared to just 20% in 2013.
Even those respondents who have reduced their time to market probably still have signifi-
cant room for improvement. A comparison of survey results about BSS shortcomings be-
tween 2013 and 2017 suggests that CSPs may have solved a lot of the technical challenges
that they faced 4 years ago, such as system integration, but that they still haven't solved
the challenge of making the business more agile to improve the customer experience and
reduce cost.

© HEAVY READING | NOVEMBER 2017 | CSP REVENUE MANAGEMENT 21
The Case for More Radical Modernization
BSS modernization can lower costs and boost revenue potential for CSPs by making them
better able to exploit new business opportunities, such as IoT. But the complexity of exist-
ing systems is trapping CSPs in a vicious cycle of making ad hoc patches without solving
the real business issues.
Justifying the investment case for more radical revenue management modernization is often
the main roadblock. Respondents commented that "determining margin impact and revenue
per user of potential plans under consideration" was a challenge, as was "creating the busi-
ness case and adapting the billing system for it."
To break the cycle, CSPs must take a more radical approach to revenue management mod-
ernization that can:
• Deliver the agility required to capture new market opportunities, such as IoT
• Enable a more personalized and engaging customer experience
• Simultaneously reduce the cost of operations
Self-Care Drives Need for Real-Time Capability
Another key finding from the survey is the increasing importance of real-time capabilities
in BSS. A lack of real-time capability for postpaid systems ranked second out of five BSS
shortcomings in the survey, while it ranked just fourth in 2013.
Real-time policy enforcement was identified as the most important feature in a list of 13
revenue management features, and real-time balance management was ranked third. Simi-
larly, from a list of 11 features of rating and charging systems, real-time rating was the third
most important feature, and real-time credit control was the fourth most important.
One of the survey questions asked about the key limitations from the lack of real-time capa-
bility. Two of the responses mapped to the ability to offer self-serve capabilities to customers.
As Figure 28 shows, one of the responses was about self-controlled spending limits. The
other was about allowing customers to change their own service plans via an app or online,
rather than having to go through a call center. Both of these options have increased in im-
portance from the 2013 to the 2017 survey.
Figure 28: Limitations That Result From a Lack of "Real-Time" Capability in BSS
Ranking (out of 8) 2013 2017
Inability to provide customers with self-controlled spending limits 4th 3rd
Inability to allow customers to change their service plans themselves 8th 4th
Source: Heavy Reading survey, October 2017
Consumers are used to self-serve with providers such as Google, Netflix or Uber. No one
expects to have to call a contact center to change their Spotify service. Telecom operators
must be as easy to transact with as the OTT players if they are to successfully transform
themselves from communication service providers to digital service providers.

© HEAVY READING | NOVEMBER 2017 | CSP REVENUE MANAGEMENT 22
SaaS Is Just a Delivery Option, Not a Panacea
Another observation that stood out from the survey was a relatively low interest in SaaS
deployment for revenue management. As Figure 29 shows, SaaS deployment was the least
important out of 17 billing features, 11 rating and charging features, and 10 product catalog
features that respondents were asked to rank. Interestingly, around 20% of respondents
indicated that their revenue management systems already had a SaaS delivery option.
Figure 29: Little Interest in SaaS Deployment
SaaS Deployment High Minus Low Priority Ranking Have?
Billing 0% Lowest of 17 features 22%
Rating & charging -4% Lowest of 11 features 21%
Product catalog 2% Lowest of 10 features 22%
Source: Heavy Reading survey, October 2017
There was a similar skepticism toward public cloud deployment. On average, 82% of respond-
ents thought it likely that they would deploy revenue management systems on-premises,
and 76% thought it likely that they would deploy on private cloud, but just 25% thought
public cloud was a likely option.
Operators are generally keen to move to a subscription model for commercial software, as
opposed to paying steep up-front licenses. However, delivering the software as a service
running in the public cloud seems less popular than on-premises or private cloud deploy-
ment. This may be due to perceptions about data governance risks with public cloud. Billing
data is highly sensitive, which may explain the reluctance to manage this on public cloud
(only 20% thought this likely). Analytics can also be sensitive, but the variability in work-
loads makes it a more likely candidate for public cloud deployment (32% thought it likely).
Arguably the distinction between on-premises and private cloud is moot. By employing
techniques such as virtualization and automated management, IT staff can evolve the inter-
nal data center into a private cloud that offers many of the performance, scalability and
cost-saving benefits associated with public cloud, but without the data security and sover-
eignty concerns.
FOR FURTHER INFORMATION
To see a Light Reading webinar presentation of this survey, recorded on November 8, 2017,
please visit: http://www.lightreading.com/webinar.asp?webinar_id=1045
For other Huawei webinars on the topic of digital revenue management, please visit:
http://carrier.huawei.com/minisite/huawei-revenue-management/index.html
To contact a Huawei representative directly, please email: [email protected]
Top Related
