


Languages
Pages
Legal

Agenda
Quick summary Henrik Clausen, CEO
Financials Terje Borge, CFO
Updates & Outlook Henrik Clausen, CEO
Q&A
Investor Update
Q112 Earnings Conference Call
25th April 2012

3
Q1 – sustained top-line growth with stable margin
maintained revenue growth in a seasonally low quarter
stable EBITDA margin on continued good cost control
5.9 sen net /share 1st interim dividend*
proposed new capital management initiative
* Dividend adjusted for 10-for-1 share split
4
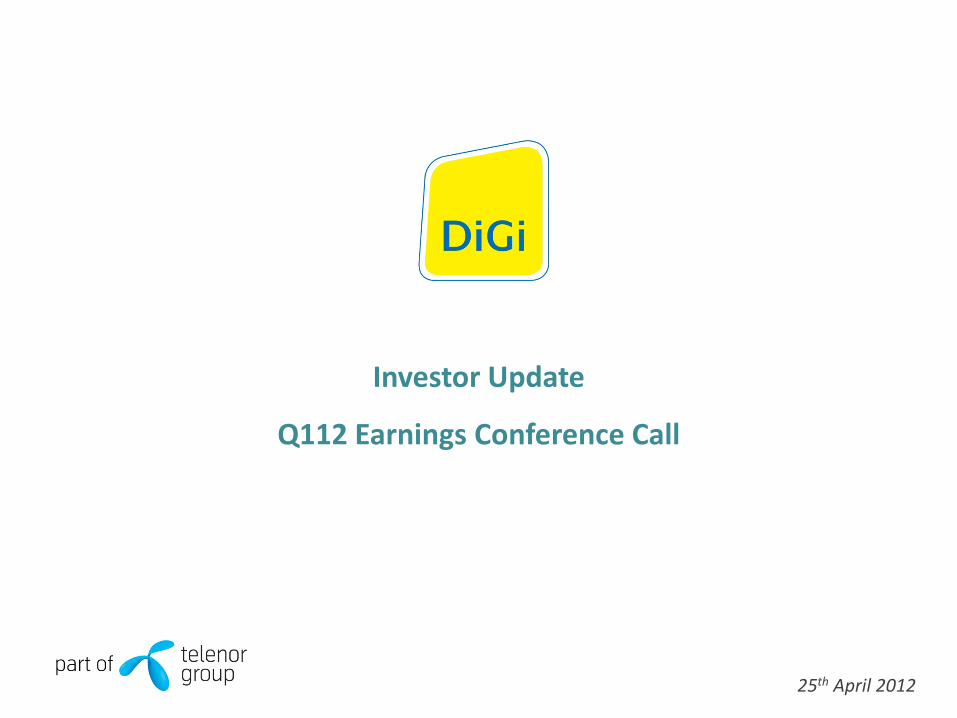
Q1 financial highlights
+1.6% q-o-q revenue growth
+9.6% y-o-y
47.0% EBITDA margin
+1.1ppt y-o-y
-18.5% q-o-q PAT decline
-3.0% y-o-y
RM619mil OpCF
+7.7% y-o-y
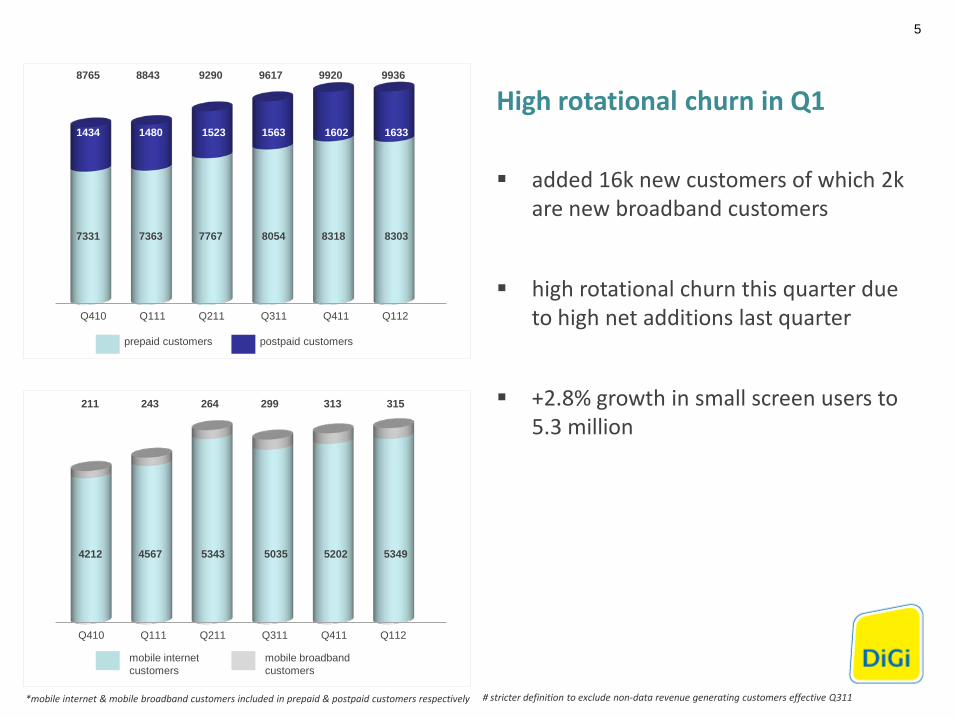
High rotational churn in Q1
added 16k new customers of which 2k are new broadband customers
high rotational churn this quarter due to high net additions last quarter
+2.8% growth in small screen users to 5.3 million
prepaid customers postpaid customers
mobile internet customers
mobile broadband customers
*mobile internet & mobile broadband customers included in prepaid & postpaid customers respectively
5
4212 4567 5343 5035 5202 5349
211 243 264 299 313 315
Q410 Q111 Q211 Q311 Q411 Q112
7331 7363 7767 8054 8318 8303
1434 1480 1523 1563 1602 1633
8765 8843 9290 9617 9920 9936
# stricter definition to exclude non-data revenue generating customers effective Q311
Q410 Q111 Q211 Q311 Q411 Q112
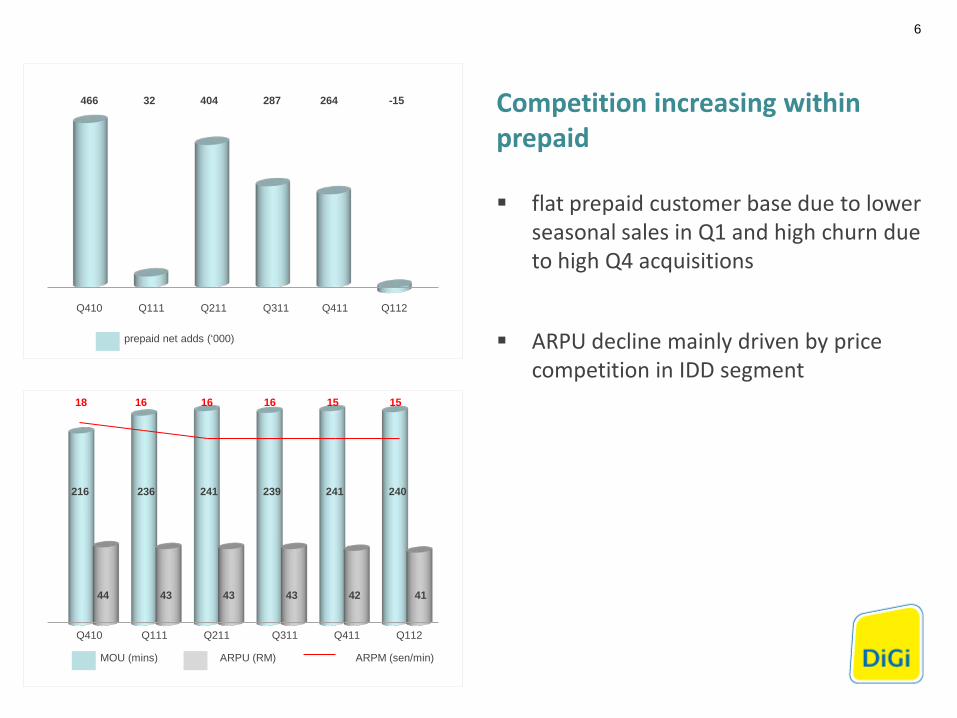
Competition increasing within prepaid
flat prepaid customer base due to lower seasonal sales in Q1 and high churn due to high Q4 acquisitions
ARPU decline mainly driven by price competition in IDD segment
MOU (mins)
prepaid net adds (‘000)
ARPU (RM) ARPM (sen/min)
6
Q410 Q111 Q211 Q311 Q411 Q112
466 32 404 287 264 -15
216 236 241 239 241 240
44 43 43 43 42 41
Q410 Q111 Q211 Q311 Q411 Q112
18 16 16 16 15 15
MOU (mins)
postpaid net adds (‘000)
ARPU (RM) ARPM (sen/min)
7
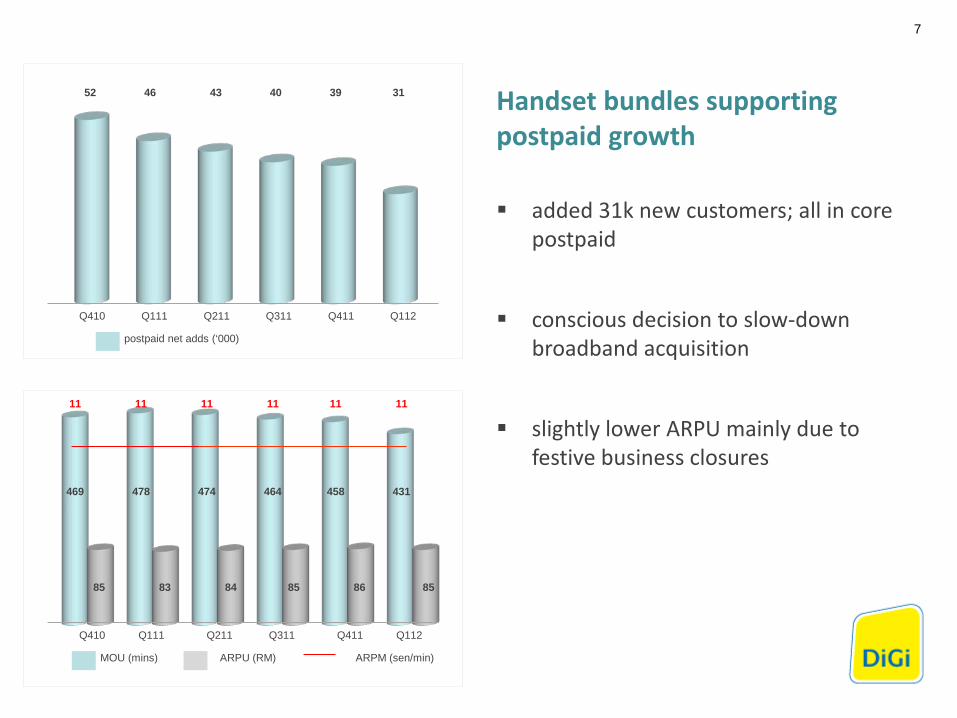
52 46 43 40 39 31
Q410 Q111 Q211 Q311 Q411 Q112
469 478 474 464 458 431
85 83 84 85 86 85
Q410 Q111 Q211 Q311 Q411 Q112
11 11 11 11 11 11
Handset bundles supporting postpaid growth
added 31k new customers; all in core postpaid
conscious decision to slow-down broadband acquisition
slightly lower ARPU mainly due to festive business closures
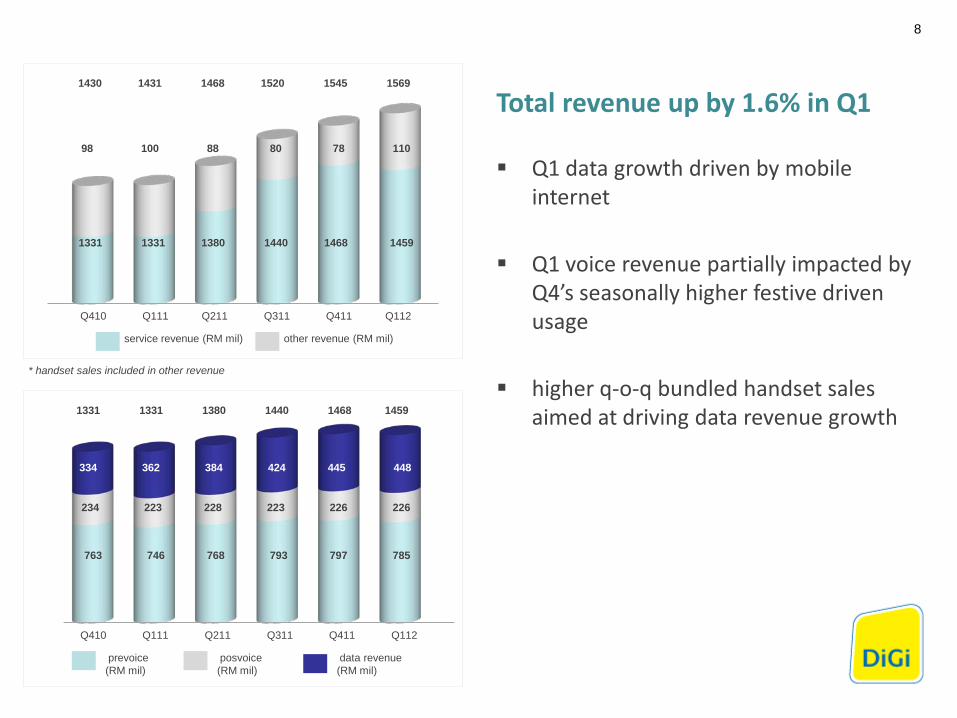
Total revenue up by 1.6% in Q1
Q1 data growth driven by mobile internet
Q1 voice revenue partially impacted by Q4’s seasonally higher festive driven usage
higher q-o-q bundled handset sales aimed at driving data revenue growth
prevoice (RM mil)
service revenue (RM mil)
posvoice (RM mil)
data revenue (RM mil)
other revenue (RM mil)
* handset sales included in other revenue
8
1331 1331 1380 1440 1468 1459
98 100 88 80 78 110
763 746 768 793 797 785
234 223 228 223 226 226
334 362 384 424 445 448
1430 1431 1468 1520 1545 1569
Q410 Q111 Q211 Q311 Q411 Q112
Q410 Q111 Q211 Q311 Q411 Q112
1331 1331 1380 1440 1468 1459
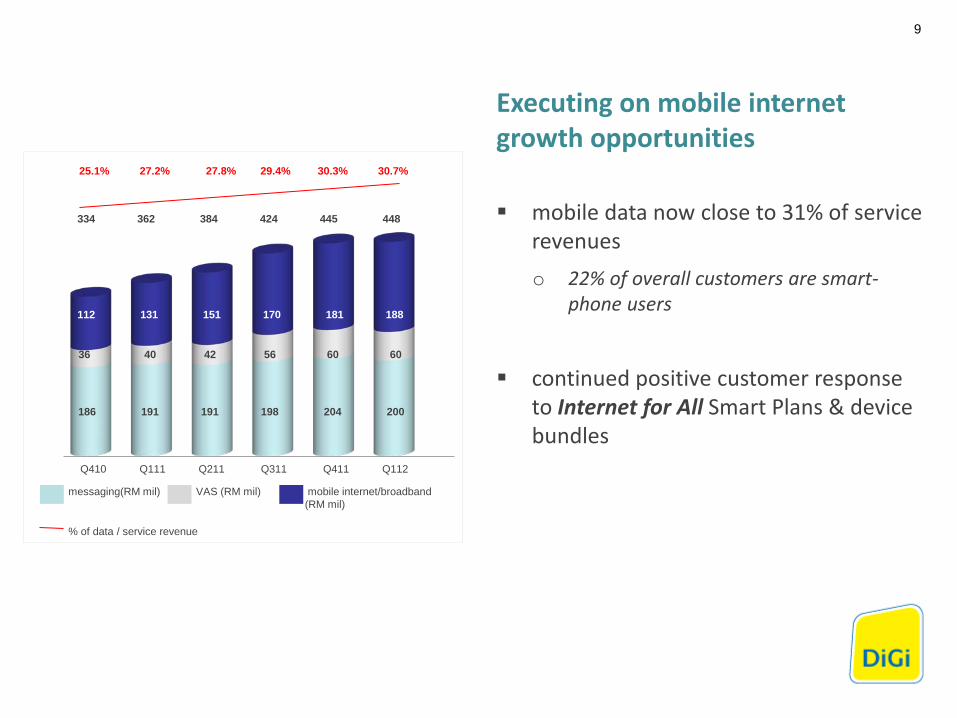
Executing on mobile internet growth opportunities
mobile data now close to 31% of service revenues o 22% of overall customers are smart-
phone users
continued positive customer response to Internet for All Smart Plans & device bundles
messaging(RM mil) VAS (RM mil)
45 51 71 90 112 xxx
mobile internet/broadband (RM mil)
25.1% 27.2% 27.8% 29.4% 30.3% 30.7%
% of data / service revenue
9
186 191 191 198 204 200
36 40 42 56 60 60
112 131 151 170 181 188
334 362 384 424 445 448
Q410 Q111 Q211 Q311 Q411 Q112
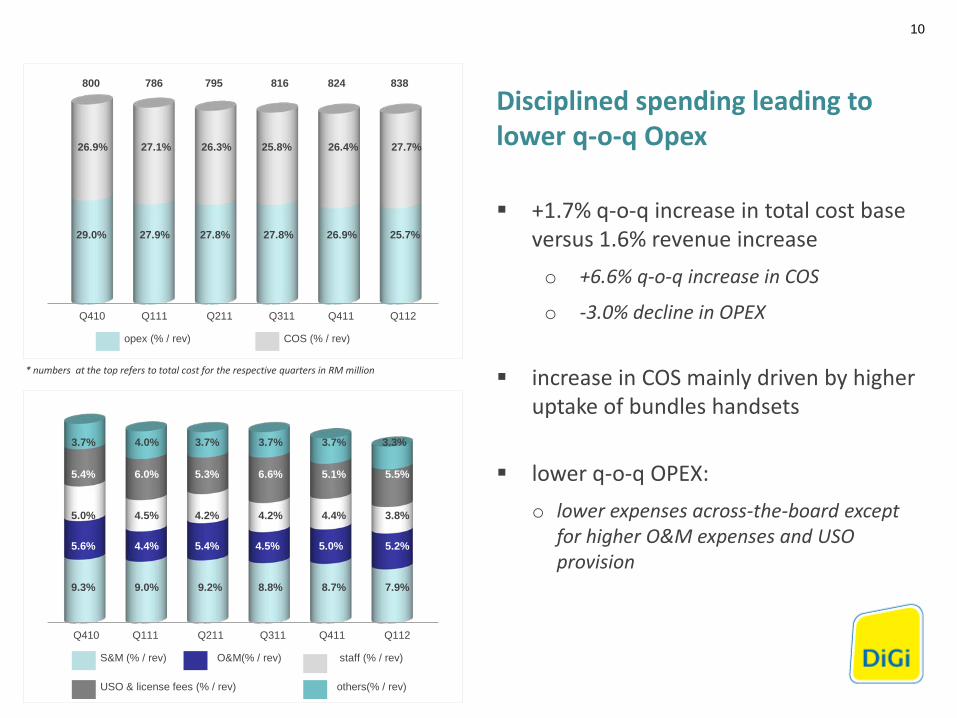
Disciplined spending leading to lower q-o-q Opex
+1.7% q-o-q increase in total cost base versus 1.6% revenue increase o +6.6% q-o-q increase in COS
o -3.0% decline in OPEX
increase in COS mainly driven by higher uptake of bundles handsets
lower q-o-q OPEX: o lower expenses across-the-board except
for higher O&M expenses and USO provision
S&M (% / rev)
opex (% / rev)
O&M(% / rev) staff (% / rev)
COS (% / rev)
USO & license fees (% / rev) others(% / rev)
10
9.4% 9.4% 9.3% 9.0% 9.2% 8.8%
* numbers at the top refers to total cost for the respective quarters in RM million
5.0% 4.5% 4.2% 4.2% 4.4% 3.8%
3.7% 4.0% 3.7% 3.7% 3.7% 3.3%
9.3% 9.0% 9.2% 8.8% 8.7% 7.9%
5.6% 4.4% 5.4% 4.5% 5.0% 5.2%
5.4% 6.0% 5.3% 6.6% 5.1% 5.5%
26.9% 27.1% 26.3% 25.8% 26.4% 27.7%
29.0% 27.9% 27.8% 27.8% 26.9% 25.7%
800 786 795 816 824 838
Q410 Q111 Q211 Q311 Q411 Q112
Q410 Q111 Q211 Q311 Q411 Q112

Stable sequential EBITDA margin
+1.2% q-o-q improvement in EBITDA ; stable margin
lower PAT in Q1 vis-à-vis the exceptionally high Q4 PAT o mobile broadband tax incentives resulted
in significantly lower effective tax rate in Q4
depreciation & amortisation charges in-line with guidance
EBITDA (RM mil) EBITDA margin (%)
PAT (RM mil) dep & amort (RM mil)
11
Q410 Q111 Q211 Q311 Q411 Q112
653 657 672 708 728 737
45.7% 45.9% 45.8% 46.6% 47.1% 47.0%
332 331 236 292 394 321
193 200 324 306 337 330
Q410 Q111 Q211 Q311 Q411 Q112
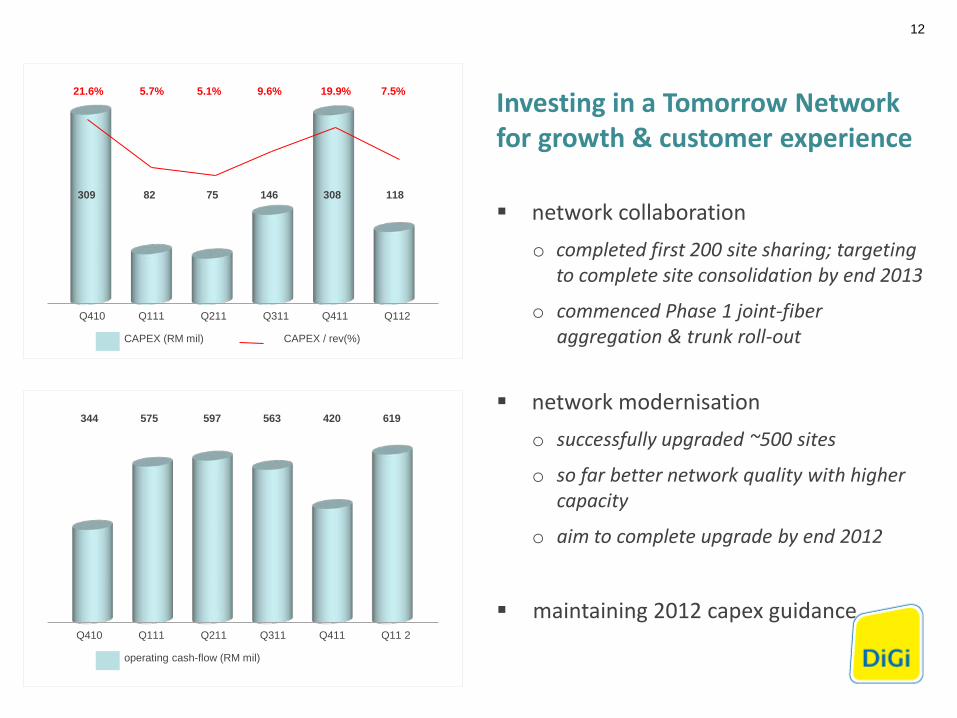
CAPEX (RM mil) CAPEX / rev(%)
operating cash-flow (RM mil)
12
309 82 75 146 308 118
21.6% 5.7% 5.1% 9.6% 19.9% 7.5%
Q410 Q111 Q211 Q311 Q411 Q112
Investing in a Tomorrow Network for growth & customer experience
network collaboration o completed first 200 site sharing; targeting
to complete site consolidation by end 2013
o commenced Phase 1 joint-fiber aggregation & trunk roll-out
network modernisation o successfully upgraded ~500 sites
o so far better network quality with higher capacity
o aim to complete upgrade by end 2012
maintaining 2012 capex guidance
344 575 597 563 420 619
Q410 Q111 Q211 Q311 Q411 Q11 2
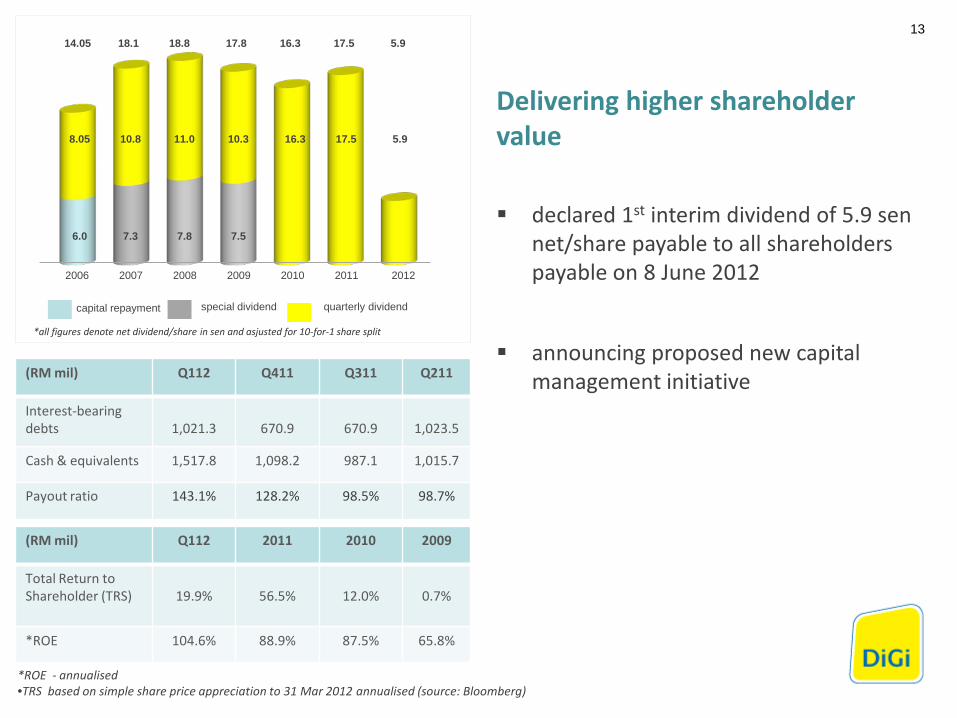
(RM mil) Q112 Q411 Q311 Q211
Interest-bearing debts
1,021.3
670.9
670.9
1,023.5
Cash & equivalents 1,517.8 1,098.2 987.1 1,015.7
Payout ratio 143.1% 128.2% 98.5% 98.7%
*all figures denote net dividend/share in sen and asjusted for 10-for-1 share split
Delivering higher shareholder value
declared 1st interim dividend of 5.9 sen net/share payable to all shareholders payable on 8 June 2012
announcing proposed new capital management initiative
13 14.05 18.1 18.8 17.8 16.3 17.5 5.9
8.05 10.8 11.0 10.3 16.3 17.5 5.9
6.0 7.3 7.8 7.5
(RM mil) Q112 2011 2010 2009
Total Return to Shareholder (TRS)
19.9%
56.5%
12.0%
0.7%
*ROE 104.6% 88.9% 87.5% 65.8%
*ROE - annualised •TRS based on simple share price appreciation to 31 Mar 2012 annualised (source: Bloomberg)
capital repayment special dividend quarterly dividend
2006 2007 2008 2009 2010 2011 2012
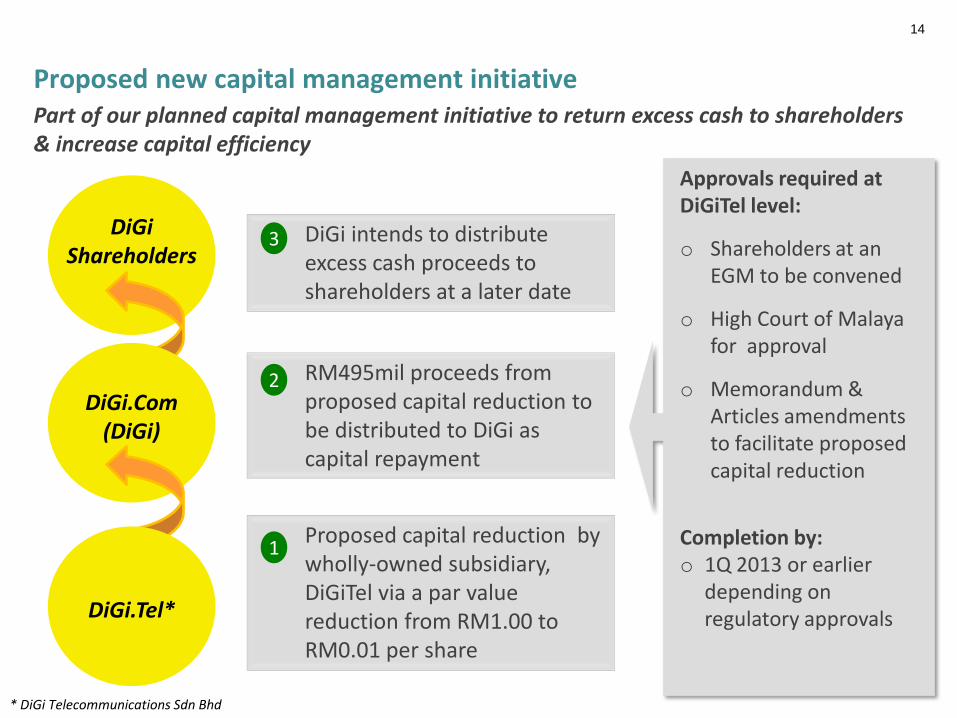
Proposed new capital management initiative Part of our planned capital management initiative to return excess cash to shareholders & increase capital efficiency
Proposed capital reduction by wholly-owned subsidiary, DiGiTel via a par value reduction from RM1.00 to RM0.01 per share
RM495mil proceeds from proposed capital reduction to be distributed to DiGi as capital repayment
DiGi intends to distribute excess cash proceeds to shareholders at a later date
1
2
3
Approvals required at DiGiTel level:
o Shareholders at an EGM to be convened
o High Court of Malaya for approval
o Memorandum & Articles amendments to facilitate proposed capital reduction
Completion by: o 1Q 2013 or earlier
depending on regulatory approvals
* DiGi Telecommunications Sdn Bhd
DiGi Shareholders
DiGi.Com (DiGi)
DiGi.Tel*
14
15
Other updates
Regulatory o spectrum
o access pricing
16
2012 opportunities & priorities
defend strongholds & fully capitalize on mobile data opportunities
build network capabilities to support mobile data growth
further explore industry collaboration/partnerships
continue to leverage on ‘Group’ scale & global initiatives
optimising shareholder returns
17
2012 outlook maintained
mid-to-high single digit revenue growth
sustained EBITDA & operating cash-flow margins
capex RM700 million - RM750 million

Q & A

Appendices

Y-o-Y key numbers
Customer base
Revenue
EBITDA
EBITDA margin
Profit After Tax
Operating CF
9.9 mil
RM1,569 mil
RM737 mil
47.0%
RM321 mil
RM619 mil
8.8 mil
RM1,431 mil
RM657 mil
45.9%
RM331 mil
RM575 mil
+12.5%
+9.6%
+12.2%
+1.1ppt
-3.0%
+7.7%
Q112 Q111 Q-o-Q vs 2011
20
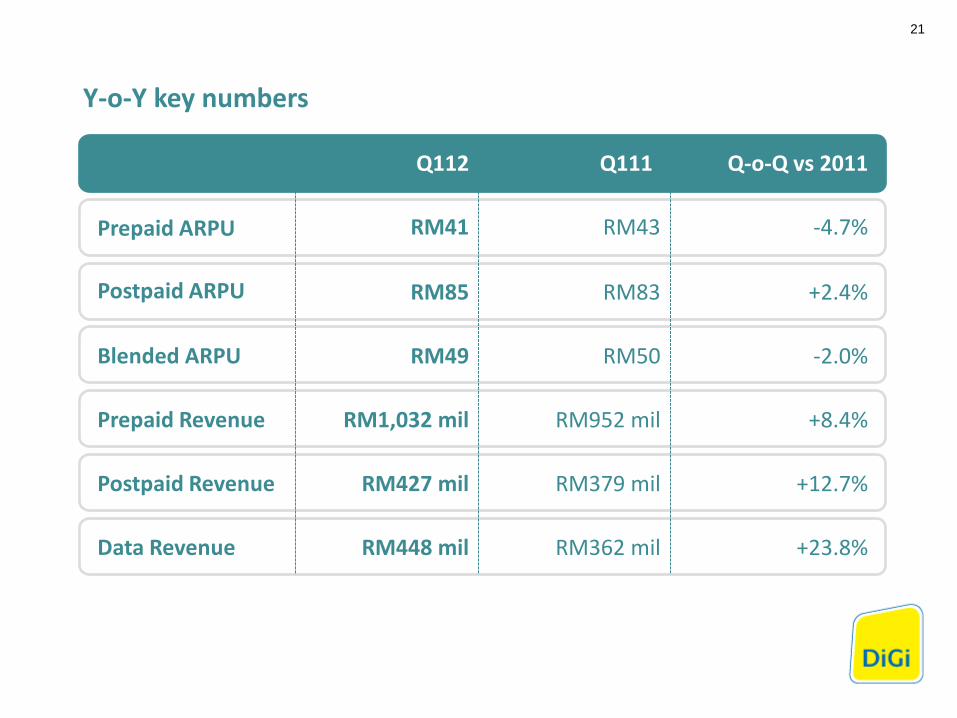
Y-o-Y key numbers
Prepaid ARPU
Postpaid ARPU
Blended ARPU
Prepaid Revenue
Postpaid Revenue
Data Revenue
RM41
RM85
RM49
RM1,032 mil
RM427 mil
RM448 mil
RM43
RM83
RM50
RM952 mil
RM379 mil
RM362 mil
-4.7%
+2.4%
-2.0%
+8.4%
+12.7%
+23.8%
Q112 Q111 Q-o-Q vs 2011
21

255 274 277 273 274 270
blended MOU (mins)
22
Blended MOU, ARPU & ARPM
51 50 50 50 50 49 16 15 15 15 14 14
Q410 Q111 Q211 Q311 Q411 Q112 Q410 Q111 Q211 Q311 Q411 Q112
blended ARPU (RM) blended ARPM (sen/min)
Q410 Q111 Q211 Q311 Q411 Q112
(RM mil)
Q112
Q411
Q311
Q211
Q111
Q410
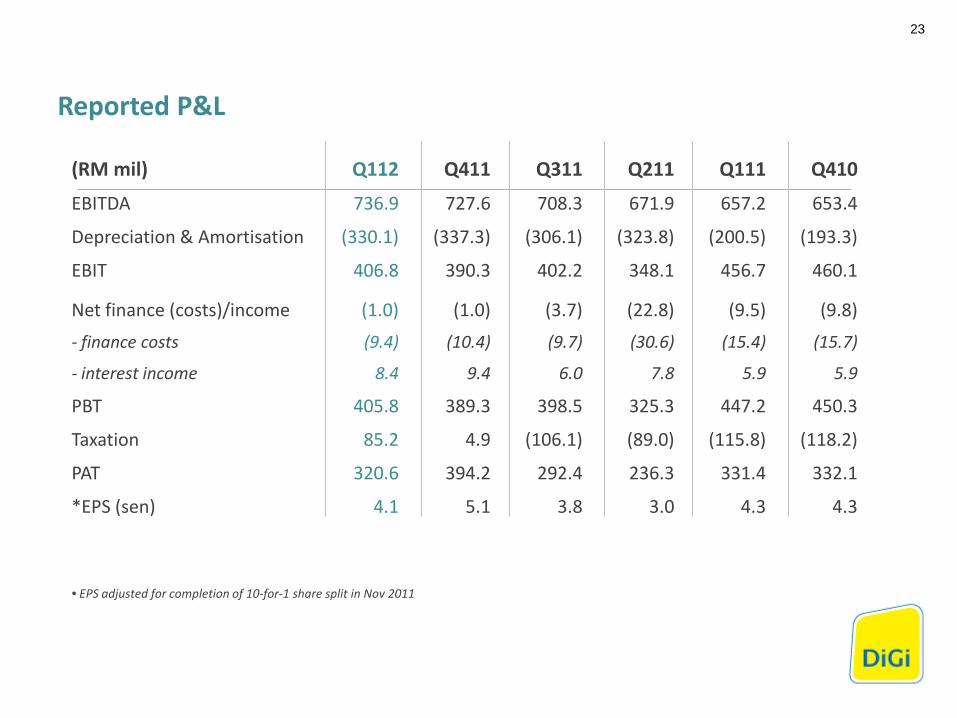
EBITDA 736.9 727.6 708.3 671.9 657.2 653.4
Depreciation & Amortisation (330.1) (337.3) (306.1) (323.8) (200.5) (193.3)
EBIT 406.8 390.3 402.2 348.1 456.7 460.1
Net finance (costs)/income
- finance costs
- interest income
PBT
Taxation
PAT
*EPS (sen)
(1.0)
(9.4)
8.4
405.8
85.2
320.6
4.1
(1.0)
(10.4)
9.4
389.3
4.9
394.2
5.1
(3.7)
(9.7)
6.0
398.5
(106.1)
292.4
3.8
(22.8)
(30.6)
7.8
325.3
(89.0)
236.3
3.0
(9.5)
(15.4)
5.9
447.2
(115.8)
331.4
4.3
(9.8)
(15.7)
5.9
450.3
(118.2)
332.1
4.3
23
Reported P&L
• EPS adjusted for completion of 10-for-1 share split in Nov 2011
(RM mil)
Q112
Q411
Q311
Q211
Q111
Q410
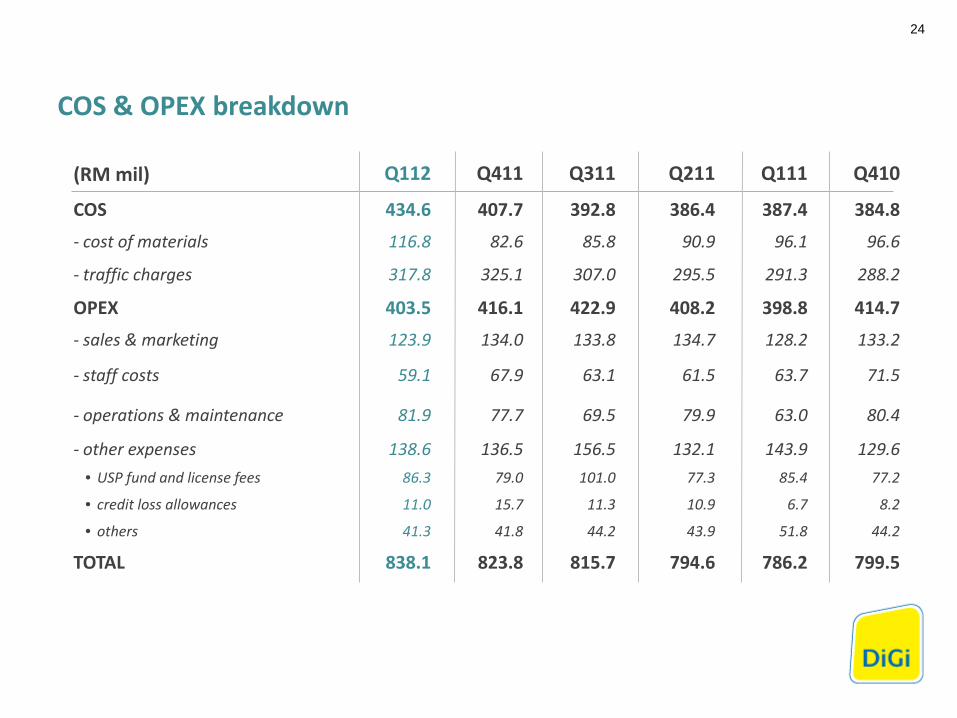
COS
- cost of materials
434.6
116.8
407.7
82.6
392.8
85.8
386.4
90.9
387.4
96.1
384.8
96.6
- traffic charges 317.8 325.1 307.0 295.5 291.3 288.2
OPEX
- sales & marketing
403.5
123.9
416.1
134.0
422.9
133.8
408.2
134.7
398.8
128.2
414.7
133.2
- staff costs 59.1 67.9 63.1 61.5 63.7 71.5
- operations & maintenance 81.9 77.7 69.5 79.9 63.0 80.4
- other expenses • USP fund and license fees
• credit loss allowances
• others
TOTAL
138.6 86.3
11.0
41.3
838.1
136.5 79.0
15.7
41.8
823.8
156.5 101.0
11.3
44.2
815.7
132.1 77.3
10.9
43.9
794.6
143.9 85.4
6.7
51.8
786.2
129.6 77.2
8.2
44.2
799.5
24
COS & OPEX breakdown
(RM mil)
Q112
Q411
Q311
Q211
Q111
Q410
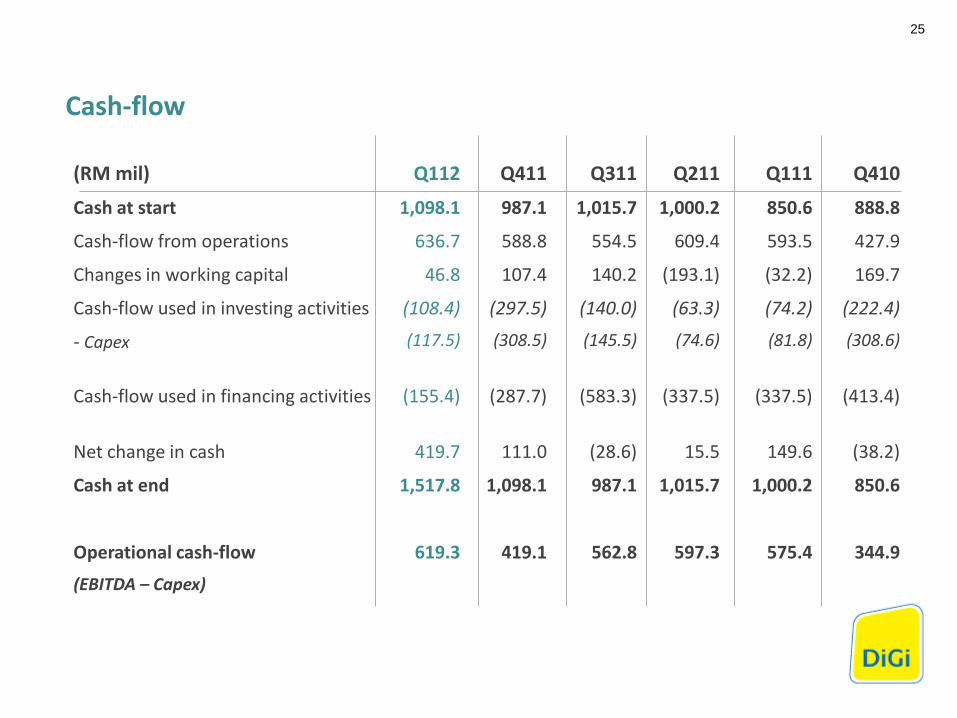
Cash at start 1,098.1 987.1 1,015.7 1,000.2 850.6 888.8
Cash-flow from operations 636.7 588.8 554.5 609.4 593.5 427.9
Changes in working capital 46.8 107.4 140.2 (193.1) (32.2) 169.7
Cash-flow used in investing activities
- Capex
(108.4)
(117.5)
(297.5)
(308.5)
(140.0)
(145.5)
(63.3)
(74.6)
(74.2)
(81.8)
(222.4)
(308.6)
Cash-flow used in financing activities (155.4) (287.7) (583.3) (337.5) (337.5) (413.4)
Net change in cash 419.7 111.0 (28.6) 15.5 149.6 (38.2)
Cash at end 1,517.8 1,098.1 987.1 1,015.7 1,000.2 850.6
Operational cash-flow
(EBITDA – Capex)
619.3
419.1
562.8
597.3
575.4
344.9
25
Cash-flow
This presentation and the following discussion may contain forward looking statements by DiGi.Com Berhad (“DiGi”) related to financial trends for future periods. Some of the statements contained in this presentation or arising from this discussion which are not of historical facts are statements of future expectations with respect to financial conditions, results of operations and businesses, and related plans and objectives. Such forward looking statements are based on DiGi’s current views and assumptions including, but not limited to, prevailing economic and market conditions and currently available information. These statements involve known and unknown risks and uncertainties that could cause actual results, performance or achievements to differ materially from those in the forward looking statements. Such statements are not and, should not be construed, as a representation as to future performance or achievements of DiGi. In particular, such statements should not be regarded as a forecast or projection of future performance of DiGi. It should be noted that the actual performance or achievements of DiGi may vary significantly from such statements.
Disclaimer
thank you
see you next quarter
Further enquiries: Head of Investor Relations Audrey Ho @ sfho@ digi.com.my
Top Related