


Languages
Pages
Legal


1
Critical synergistic concentration of lecithin phospholipids improve the antimicrobial 2
activity of eugenol against Escherichia coli 3
4
Haoshu Zhanga, Edward G. Dudley
a, b, and Federico Harte
#a 5
a Department of Food Science and
b Center for Molecular Immunology and Infectious Disease, 6
Pennsylvania State University, University Park, PA, USA 7
8
# Address correspondence to Federico Harte, [email protected] 9
AEM Accepted Manuscript Posted Online 25 August 2017Appl. Environ. Microbiol. doi:10.1128/AEM.01583-17Copyright © 2017 American Society for Microbiology. All Rights Reserved.
on March 31, 2020 by guest
http://aem.asm
.org/D
ownloaded from
Abstract 10
In this study, the effect of individual lecithin phospholipids on the antimicrobial 11
properties of eugenol against E. coli C600 was investigated. We tested five major phospholipids 12
common in soy or egg lecithin (DPPC, DSPC, DPPE, DPPA and DPPS) and one synthetic 13
cationic phospholipid (EPC 18:0). Among six phospholipids, DPPC, DSPC, DPPE, DPPA, and 14
the cationic 18:0 EPC showed critical synergistic concentrations that significantly improve the 15
inactivation effect of eugenol against E. coli after 30 min of exposure. At the critical synergistic 16
concentration, an additional ca. 0.4-1.9 log reduction (ca. 0.66-2.17 log CFU/mL reduction) in 17
microbial population was observed when compared to eugenol-only (control) treatments (ca. 18
0.25 log reduction). In all cases, increasing the phospholipid amount above the critical 19
synergistic concentration (different for each phospholipid) resulted in antimicrobial properties 20
similar to eugenol-only (control) treatments. DPPS did not affect the antimicrobial properties of 21
eugenol at the tested concentrations. The critical synergistic concentration of phospholipids was 22
correlated to their critical micelle concentrations (CMC). 23
Importance 24
Essential oils (EOs) are naturally occurring antimicrobials, with limited use in food due to their 25
hydrophobicity and strong aroma. Lecithin is used as a natural emulsifier to stabilize EOs in 26
aqueous systems. We previously demonstrated that within a narrow critical concentration 27
window, lecithin can synergistically enhance the antimicrobial properties of eugenol. Since 28
lecithin is a mixture of different phospholipids, we aimed to identify which phospholipids are 29
crucial for the observed synergistic effect. This research studies the bioactivity of lecithin 30
phospholipids, contributing to a rational design when using lecithin to effectively control 31
foodborne pathogens in foods. 32
on March 31, 2020 by guest
http://aem.asm
.org/D
ownloaded from

Introduction 33
In United State alone, foodborne diseases cause ca. 48 million illnesses, 128,000 34
hospitalizations and ca. 3,000 death every year (1). Among all the foodborne disease agents, the 35
World Health Organization (WHO) reports that pathogenic E. coli significantly contributes to 36
this burden (2). The Centers for Disease Control and Prevention (CDC) estimated 265,000 shiga-37
toxin-producing E. coli (STEC) infections, 3,600 U.S. hospitalizations and 30 deaths every year 38
(3). 39
Essential oils (EOs) extracted from plants (e.g., eugenol, carvacrol, thymol) continue to 40
gain attention as natural antimicrobials due to their ‘green’ and ‘clean label’ image (4). EOs are 41
generally recognized as safe (GRAS) but found limited use in food systems due to their 42
hydrophobicity and strong aroma. Many studies showed that after encapsulating EOs in 43
emulsifier micelles or liposomes, both the stability and the antimicrobial properties of the EO 44
improve (4-6). Donsì and co-workers found an increase in D-limonene antimicrobial activity 45
against Lactobacillus delbrueckii and Saccharomyces cerevisiae when encapsulated in the 46
emulsifiers Tween 20 and glycerol monooleate. Lecithin has been widely used in foods (e.g., 47
infant formula and chocolate) as a natural emulsifier (7) to improve physical stability. However, 48
previous reports showed that the antimicrobial properties of EO against E. coli were not 49
enhanced when EOs were combined with lecithin (8, 9) or observed that water-insoluble 50
surfactants (including lecithin) in nanoemulsions diminished the antimicrobial efficacy of EOs 51
(10). On the contrary, we previously reported that the antimicrobial properties of eugenol were 52
significantly improved when lecithin was added at a critical low concentration (11). Nanoscale 53
aggregates (<50 nm) were observed when eugenol was mixed with critical synergistic 54
concentration of lecithin and it was suggested that electrostatic interactions between charged 55
on March 31, 2020 by guest
http://aem.asm
.org/D
ownloaded from

phospholipids and the negatively charged bacterial cell membrane were responsible of the 56
improved antimicrobial properties. 57
Lecithin is a mixture of various phospholipids including phosphatidylcholine (PC), 58
phosphatidylethanolamine (PE), phosphatidic acid (PA) and phosphatidylserine (PS) (7, 12). Due 59
to the amphiphilic nature of these phospholipids, lamellar aggregates and other structures (e.g., 60
hexagonally arranged rods and tubes) have been reported to form depending on concentration 61
and temperature (13-15). Lecithin phospholipids differ in charged head groups (Table 1), lipid 62
chain length, and degree of saturation (16), resulting in distinct molecular conformations, CMC, 63
and phase transition behaviors (15, 17). Moreover, phospholipids are major components of 64
bacterial cell membrane (18) and previous reports showed that the interaction between bacterial 65
cell and essential oil depended on the cell membrane phospholipid composition (19). Therefore, 66
we hypothesize that not all phospholipids in lecithin are responsible for the enhanced 67
antimicrobial activity of essential oil against bacteria. The aim of this study was to identify the 68
effect of six single phospholipids on the antimicrobial effect of eugenol against E. coli C600, 69
leading to a rational use of phospholipid-based natural antimicrobial systems. 70
Materials and methods 71
Phospholipids 72
From the myriad phospholipids in lecithin, we selected DPPC (1,2-dipalmitoyl-sn-73
glycero-3-phosphocholine), DPPE (1,2-dipalmitoyl-sn-glycero-3-phosphoethanolamine), DSPC 74
(1,2-distearoyl-sn-glycero-3-phosphocholine), DPPA (1,2-dipalmitoyl-sn-glycero-3-phosphate 75
sodium salt) and DPPS (1,2-dipalmitoyl-sn-glycero-3-phospho-L-serine sodium salt) (Avanti, 76
Alabaster, AL; Table 1) to conduct further experiments on the basis of being the major 77
on March 31, 2020 by guest
http://aem.asm
.org/D
ownloaded from

components in both soy and egg lecithin. The cationic 18:0 EPC (1,2-distearoyl-sn-glycero-3-78
ethylphosphocholine chloride salt) was also obtained from Avanti Polar Lipids, Inc to study the 79
effect of phospholipid charge on the synergistic effect when combined with eugenol. 80
Bacterial strain 81
E. coli C600 (20) was obtained from the Yale E. coli Genetic Stock Center. It is a 82
prophage-cured derivative of E. coli K-12 (21), that showed a positive response to eugenol-83
lecithin buffered systems in a previous study (11). After growing in tryptic soy broth (TSB; 84
Difco, Sparks, MD) under aerobic conditions at 37⁰C for 24 hours, a glycerol stock was made by 85
mixing 1 mL culture aliquots with 0.3 mL 50% v/v glycerol in water solution. The stock was 86
stored in a 2 mL centrifuge tube at -80⁰C until needed for experiments. To make a working 87
culture, the stock culture was grown in TSB under the same condition as previously described 88
until the optical density at 610nm (OD610) reached ca. 0.9, monitored using a DU730 89
spectrophotometer (Beckman Coulter, Pasadena, CA). 90
Eugenol-Phospholipid Preparations 91
The procedure to prepare the eugenol-phospholipid samples followed our previous 92
method (11) with minor modifications. Ten mg/100mL phospholipid stock solutions were 93
prepared by boiling 10 mg each phospholipid in 100mL phosphate buffered saline (PBS; pH ca. 94
7.20) for 7 min and then homogenizing (Ultra-Turrax IKA T-18 basic, Staufen, Germany) at 95
11,000 rpm for 1 min. The solution was then cooled to room temperature and sterile deionized 96
water was added to bring the solution back to 100mL. The stock solution was diluted in PBS 97
subsequently to reach the final phospholipid concentration ranging from 0 to 80 μM. A 0.043% 98
v/v eugenol (previously shown to reduce the population of E. coli C600 at least 0.2 log CFU/mL 99
after a 30 minutes exposure,(11)) dispersed in PBS-phospholipid was prepared by suspending 43 100
on March 31, 2020 by guest
http://aem.asm
.org/D
ownloaded from
μL eugenol (Acros Oganics, Fairlawn, NJ) in 99 mL dilute phospholipid solution, followed by 101
rotary homogenization (Ultra-Turrax IKA T-18 basic, Staufen, Germany) at 11,000 rpm for 3 102
min. 103
Quantification of bactericidal activity of eugenol-lecithin mixtures 104
After mixing 1 mL working culture (without washing) with 99 mL eugenol-phospholipid 105
mixtures (initial inoculum concentration ca. 6 log CFU/mL; phospholipid concentration refers to 106
the concentration after adding 1 mL working culture), one sample was taken immediately (t=0 107
min) to determine the original inoculum concentration and after 30 minutes (t=30 min) 108
incubation at 37⁰C in a shaking incubator (N1570, Sheldon Manufacturing, Inc., OR) with a 109
speed of 300 rpm to determine the final concentration. No appreciable phase separation was 110
observed in any sample during the time span of the treatments. Each sample (0.1mL) taken at t=0 111
min and t=30 min was serially diluted, plated onto two separate tryptic soy agar plates (TSA; 112
Difco, Sparks, MD), grown overnight at 37⁰C, and counted. Inactivation [Log (CFU/mL)] was 113
calculated followed the equation (1) and plotted versus each phospholipid concentration. Similar 114
experiments without eugenol (phospholipid only) were conducted as controls. Three independent 115
trials at each phospholipid concentration with one replication per trial (measured on duplicate 116
plates) were conducted to quantify the bactericidal activity. 117
Inactivation [Log (CFU/mL)] = Log (CFU/mL)𝑡=0𝑚𝑖𝑛– Log (CFU/mL)𝑡=30𝑚𝑖𝑛 Equation (1) 118
Critical micelle concentration of phospholipids 119
Pyrene was used as a fluorescent probe to measure the CMC of DPPC, DSPC, DPPA and 120
DPPE, following previously reported methods with modifications (22, 23). Serial dilutions were 121
done to the target phospholipid concentrations ranging from 10-11
M to 10-2
M and 2 μM pyrene 122
on March 31, 2020 by guest
http://aem.asm
.org/D
ownloaded from

(from a stock 0.4 mM pyrene in ethanol solution) was added to the phospholipid-PBS solution. 123
Fluorescence measurements were conducted using a Fluorolog-3 spectrofluorometer (Horiba 124
Scientific, Edison, NJ) with the excitation wavelength set at 331 nm and a fixed scan time at 0.8 125
s. The emission spectra were obtained in the 341-450 nm wavelength range. The ratio of first 126
peak intensity (I1 at around 372nm) and third vibrational peak intensity (I3 at around 383nm) was 127
used as a parameter to indicate the polarity of pyrene’s environment (22). Two independent 128
samples (replicates) were prepared for each phospholipid concentration to measure the 129
fluorescence intensity. 130
Statistical Analysis 131
For all microbial studies, the inactivation (log CFU/mL) after 30 minutes exposure to 132
eugenol-single phospholipid treatment was the response variable. All experiments were analyzed 133
as completely randomized experimental designs with three replicates, except for CMC where 134
two replicates were used. Means were separated using LSD (α=0.05) when ANOVA showed 135
significant treatment effects using Minitab V. 15 (Minitab, State College, PA). 136
Results 137
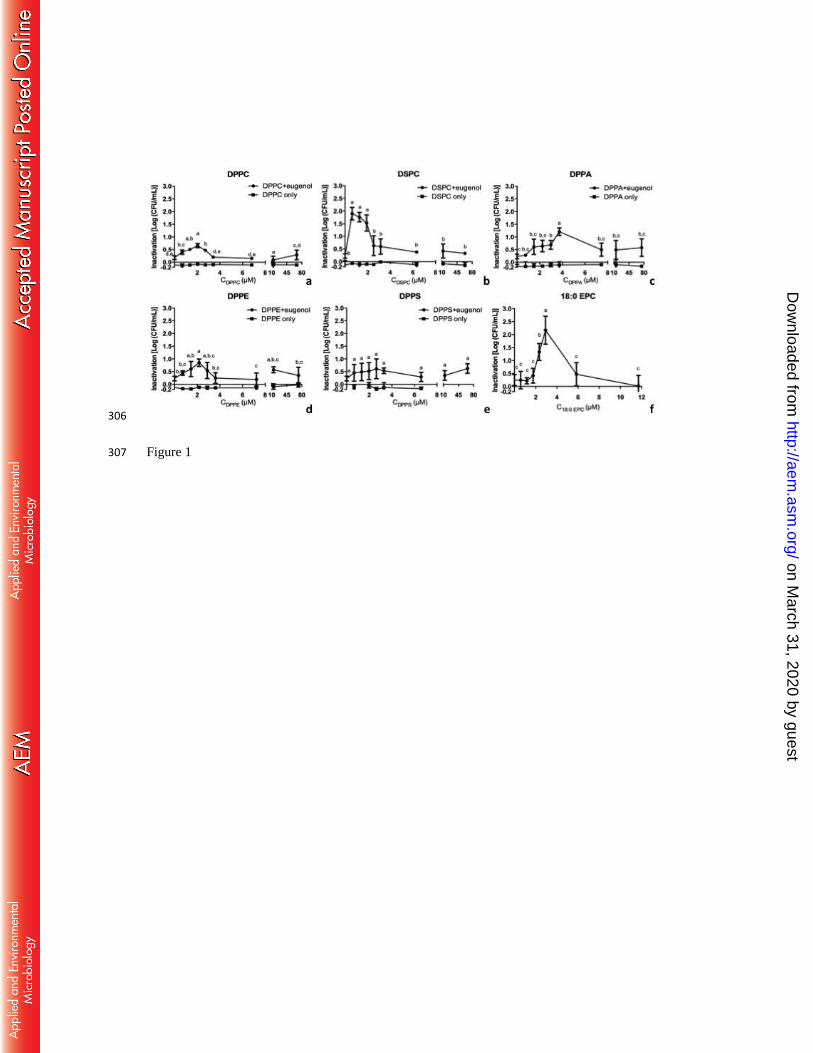
The inactivation of E. coli C600 after a 30 minutes exposure to a buffer system 138
containing a 0.043% v/v eugenol without (control) or with various concentrations of each 139
phospholipid is shown in Figure 1a-e for DPPC, DSPC, DPPA, DPPE, and DPPS, respectively. 140
Four phospholipids (DPPC, DSPC, DPPA and DPPE) showed similar patterns of bioactivity, i.e., 141
adding the phospholipid to a specific low critical concentration improved the bactericidal effect 142
of eugenol. Beyond this critical synergistic concentration, the synergistic effect was diminished 143
and the microbial inactivation was significantly reduced to levels not significantly different from 144
on March 31, 2020 by guest
http://aem.asm
.org/D
ownloaded from
eugenol-only control samples. DPPS was the only phospholipid that did not exhibit a critical 145
concentration. When DPPS was added at a 3 log concentration range (from 0.66 μM to 66.97 146
μM), the inactivation effect of eugenol against E. coli was not significantly different from 147
samples containing eugenol-only (p=0.576). 148
The critical synergistic concentration for bioactivity varied with each phospholipid. 149
Adding 1.36 μM to 2.72 μM DPPC to the system significantly improved (p<0.05) the 150
antimicrobial effect of eugenol against E. coli C600 by an additional ca. 0.5 log cycle reduction. 151
Similarly, an additional ca. 1.5 log cycle reduction in E. coli C600 (p<0.05) was obtained with 152
0.63 to 1.90 μM DSPC added. For DPPE, the maximum additional microbial inactivation was 153
reached when 2.17 μM DPPE was introduced to the system, and an additional 1 log cycle 154
reduction was observed when 3.73 μM DPPA was added. Experiments were also conducted 155
using 18:0 EPC, a cationic derivative of DSPC. Figure 1f shows that adding 18:0 EPC below 156
2.34 μM or above 2.93 μM did not change the antimicrobial properties of eugenol. However, at 157
the critical synergistic concentration of 2.34 μM to 2.93 μM, an additional ca. 1.9 log cycle 158
inactivation of E. coli at the same eugenol concentration was found after 30 min of exposure to 159
eugenol. Phospholipid-only experiments (no eugenol) at various concentrations were conducted 160
as negative controls to discard any potential bioactive effect of the phospholipids on E. coli. In 161
all cases, no significant effect of any phospholipid at any concentration was observed on the final 162
microbial population, when compared to the bacterial populations suspended in PBS for 30 min 163
(Figure 1a-e). Based on consistent negative results obtained with all tested phospholipids, we 164
assumed no antimicrobial effect of 18:0 EPC and no control experiment (18:0 EPC only) was 165
conducted (Figure 1f). 166
on March 31, 2020 by guest
http://aem.asm
.org/D
ownloaded from

Table 1 also shows the critical synergistic concentration and maximum additional 167
antimicrobial effect caused by the various phospholipids tested in this study. The critical 168
synergistic concentration depended on the type of phospholipid and the additional inactivation 169
effect when mixing eugenol together with the phospholipids at the critical synergistic 170
concentration ranged from ca. 0.5 to 2 log CFU/mL. 171
Pyrene was used as a probe to measure the CMC of DPPC, DSPC, DPPE and DPPA, 172
indicating their structure in PBS. The ratio of the first peak (I1) and third peak (I3) in each 173
spectrum was calculated. Figure 2a shows a decrease in the I1/I3 of pyrene when the DPPC was 174
around 1.34x10⁻⁶
M which may indicate the CMC of DPPC in PBS. Similarly, results in Figure 175
2b indicated a decrease of I1/I3 started at ca. 1.27x10⁻⁹
M for DSPC. There was no clear change in 176
I1/I3 over the tested DPPA concentrations (Figure 2c). In Figure 2d, the I1/I3 of DPPE declined at 177
around 1.45x10⁻⁵
M. 178
Discussion 179
Eugenol-only control samples showed lower overall reduction (around 0.2 log CFU/mL), 180
compared to results in our previous study (ca. 2 log CFU/mL (11)), suggesting lower eugenol 181
antimicrobial power. However, the synergistic effect of lecithin was consistent with previous 182
results, i.e., the synergistic effect was observed regardless of the antimicrobial power of the 183
eugenol for results shown in Figures 1a-f. Among the five natural phospholipids tested, DPPC, 184
DSPC, DPPE and DPPA showed synergistic effect with eugenol at critical phospholipid 185
concentrations. The enhanced antimicrobial potency of eugenol was diminished with adding 186
phospholipids to concentration above or below the critical synergistic concentrations. These 187
results were consistent with our previous finding where using lecithin within a narrow 188
concentration window improved the antimicrobial efficacy of eugenol against E. coli. The 189
on March 31, 2020 by guest
http://aem.asm
.org/D
ownloaded from

mechanism (or mechanisms) behind the observed inactivation patterns are not known. Based on 190
previous Cryo-TEM observations and fluorescence studies, we proposed that the enhanced 191
antimicrobial activity was due to the formation of nano-scale structures (diameter<50 nm) when 192
lecithin was added at critical synergistic concentrations. At the critical phospholipid 193
concentration, the amphiphilic phospholipids self-assembled from monomers to small aggregates 194
where eugenol could favorably partition. These small aggregates with large net surface area and 195
containing positively charged phospholipid head groups would in turn enhance the interaction 196
between eugenol and negatively charged E. coli cell membranes. Adding phospholipids well 197
above the critical synergistic concentration caused the formation of large micron-scale network 198
that could block the net contact between eugenol and target cell membranes and in turn diminish 199
the enhanced antimicrobial properties. 200
Since phospholipids are amphiphilic molecules, they self-assemble to thermodynamically 201
stable structures in aqueous systems. The CMC of phospholipids varies with both the 202
phospholipid’s head group and acyl chain length (24-26). Several studies demonstrated the 203
temperature- and concentration- dependent architectures when phospholipids were suspended in 204
water (27, 28). Even though the conformation of these phospholipids at critical synergistic 205
concentrations was not determined, the CMC of for DPPS, DSPC, DPPE and DPPA was tested 206
as an indicator for the formation of specific structure leading to potential synergistic effect with 207
eugenol. Both surface tension (pendant drop) and pyrene fluorescent probe methods were used to 208
determine the critical micelle concentration of the various phospholipids. However, large 209
variability was found in the surface tension measurement, probably due to the very low 210
phospholipid concentration needed to synergistically improve the antimicrobial properties of 211
eugenol (results not shown). With increasing concentration of each of the tested phospholipids, 212
on March 31, 2020 by guest
http://aem.asm
.org/D
ownloaded from

the ration I1/I3 of pyrene fluorescence signal was expected to decrease as the CMC was 213
approached, indicating the transferring of the pyrene probe into a more hydrophobic micellar 214
environment vs. water (22, 29). As shown in Figure 2a-d, the CMC for DPPC, DSPC, DPPA and 215
DPPE was ca. 1.36 x10⁻⁶
M, ca. 1.27x10⁻⁹
M, > 1.49X10⁻⁴
M, and ca. 14.5 x10⁻⁶
M, respectively. 216
The CMC of DSCP was ca. 3 log cycles below that of DPPC, which may due to the longer 217
hydrocarbon chains in DSPC (30). This was consistent with previous reports by Ross and co-218
workers where the ln(CMC) linearly decreased with increasing in phosphatidylcholine 219
hydrocarbon tail length. In their study, calculated phosphatidylcholine with two fifteen-carbon 220
acyl chains had a larger ln(CMC) value (-24.6) than that of DPPC (sixteen-carbon acyl chain; -221
25.5) (31). The CMC of DPPC in PBS obtained in this study differs from the CMC of DPPC in 222
water (4.6 ± 0.5 x10⁻¹⁰
M) reported previously (31). Since the ionic environment influences 223
micelle formation in an aqueous solution (32, 33), the presence of PBS may explain the 224
discrepancy between the observed vs. reported critical micelle concentration for DPPC. The 225
negatively charged DPPA was expected to show higher CMC consistent with more hydrophilic 226
phosphatides. For instance, the CMC of the zwitterionic spin-labeled lauroylphosphatidylcholine 227
(0.1 mM) is ca. 6 times lower than that of the negatively charged spin-labeled 228
lauroylphosphatidic acid (0.77 mM) in 0.1 M unbuffered NaCl solution (34). 229
With respect to the distinct difference in the CMC of tested phospholipids, it is reasonable 230
to see their different critical synergistic concentrations. Interestingly, the critical synergistic 231
concentration was correlated to critical micelle concentration (Table 1). Both critical synergistic 232
concentration and CMC were in the order: DPPA>DPPE>DPPC>DSPC. The correlation 233
between log (critical synergistic concentration) and log (CMC) was r=0.976 (p<0.01). This 234
supported our hypothesis as discussed above. The synergistic effect between eugenol and 235
on March 31, 2020 by guest
http://aem.asm
.org/D
ownloaded from

phospholipids may be related to the specific structure formation when adding phospholipids at 236
critical synergistic concentrations. However, for DPPE and DPPC, critical synergistic 237
concentrations were below their CMC. On the contrary, for DSPC and DPPA, critical synergistic 238
concentrations were above their CMC. This indicates that there could be more than one 239
mechanism behind the enhanced antimicrobial property of eugenol when a phospholipid is used. 240
When critical synergistic concentrations were above the CMC, the enhanced antimicrobial 241
property of eugenol may due to the encapsulation of eugenol into phospholipid micelles. 242
However, below the CMC, the phospholipid may form phospholipid-rich ‘patches’ on the 243
eugenol droplets as discussed in our previous study (11). The partition of phospholipids into the 244
E. coli cell membrane and therefore the modification of the membrane fluidity and permeability 245
for hydrophilic compounds is another mechanism that we plan to investigate (35). 246
However, critically thinking about the CMC study, we should notice that the phase 247
behavior of amphiphilic molecules like phospholipids is dynamic and complicated. Recent 248
studies suggest the occurrence of more than one CMC (36) or several “critical aggregation 249
concentrations” (CAC) instead of a single CMC (37). For example, Jana and co-workers stated 250
that after the first change in fluorescence signals indicating a CMC, further phase transition from 251
micelle to liposomes caused additional shifts in the I1/I3 fluorescence signal indicating further 252
aggregation patterns or CAC (37). The CMC value in this study may indicate a specific 253
phospholipid aggregation formation instead of just micelle formation. 254
In contrast with DPPC, DSPC, DPPE, and DPPA, DPPS did not exhibit a synergistic effect 255
on the antimicrobial properties of eugenol against E. coli. The reason is not clear. It is possible 256
that the two negatively charged groups in the polar head of DPPS caused electrostatic repulsion, 257
blocking potential absorption by negatively charged E. coli cell membranes. Even though the 258
on March 31, 2020 by guest
http://aem.asm
.org/D
ownloaded from

overall net charge of DPPS is the same as DPPA, a previous study showed that zwiterionic 259
phospholipids in water expose charged polar head group outside the self-assembled phospholipid 260
bilayers (38). As a consequence, zwiterionic phospholipid could favorably bind ions with 261
opposite charge. Therefore, two negative charged groups on the polar head of DPPS would 262
potentially cause strong repulsion between eugenol-DPPS aggregates and E. coli cell membranes 263
diminishing the antimicrobial effect. 264
The antimicrobial potency of eugenol with a stable cationic phospholipid 18:0 EPC was 265
tested to further elucidate the effect of charge on the phospholipid synergistic effect. 18:0 EPC 266
has the same acyl chain length and head group than DSPC. The only difference is that 18:0 EPC 267
does not have a negatively charged -O- head group, so it carries positive charges only. We 268
hypothesized that 18:0 EPC at critical synergistic concentration would induce a significantly 269
higher antimicrobial effect of eugenol against E. coli compared to DSPC. However, Table 1 270
showed that the synergistic antimicrobial effects from 18:0 EPC and DSPC were not 271
significantly different so the number of negatively charged group was not important in changing 272
the electrostatic interactions between aggregates and between eugenol-phospholipid and bacterial 273
cells. The electrostatic attraction between eugenol-phospholipid aggregates and E. coli cells may 274
not play a major role in determining the synergistic effect. 275
Furthermore, that maximal inactivation effects achieved by adding DPPC, DSPC, DPPE, 276
DPPA and 18: 0 EPC respectively to the eugenol-in-water system were not the same. 277
Interestingly, what drew our attention was that eugenol with two phospholipids (DSPC and 18:0 278
EPC) containing 18 carbon acyl chains showed significantly higher antimicrobial property 279
against E. coli. This was in consistent with observations by Donsì and co-workers who 280
on March 31, 2020 by guest
http://aem.asm
.org/D
ownloaded from

concluded that the increase of essential oil antimicrobial activity depended on both concentration 281
and type of the emulsifiers (9). 282
Conclusion 283
According to our findings, not all phospholipids in lecithin synergistically enhance the 284
antimicrobial effect of eugenol. Among all the suggested mechanisms for the enhanced 285
antimicrobial effect of eugenol by adding critical low concentration of phospholipids, the 286
electrostatic interaction between eugenol-phospholipid aggregates and E. coli cells may not be 287
the main mechanism of action, as DSPC and the cationic 18:0 EPC showed similar synergistic 288
action. In terms of designing a more effective antimicrobial delivery system, the most important 289
factor is suggested to be the chain length of phospholipids, as (DSPC) 18:0 showed increased 290
synergistic action vs. DPPC (16:0). However, more sensitive techniques need to be used to 291
characterize the eugenol-phospholipids structure as well as their interactions with E. coli cells to 292
elucidate the mechanisms behind the observed synergistic effect. Until now we are limited by the 293
detection limit of many structure characterization techniques due to the very low concentration 294
of phospholipids leading to synergism.295
on March 31, 2020 by guest
http://aem.asm
.org/D
ownloaded from

Figure legends: 296
Fig. 1. Inactivation of E. coli C600 after 30 minutes exposure to constant eugenol concentration 297
(0.043 % v/v) and increasing levels of phospholipids ( ) and phospholipid-only controls (298
). All controls showed no inactivation effect. Means followed by a different letter are 299
significantly different using LSD (α<0.05). Error bars are standard deviations for the mean of 300
three independent replicates. 301
Fig. 2. Pyrene 1:3 ratio (I1/I3) versus phospholipids at different concentrations in PBS buffer 302
system. Error bars are standard deviations for the mean of two independent replicates. 303
Table. 1. Chemical structure, highest inactivation, critical synergistic concentrations (CSC) and 304
critical micelle concentrations (CMC) of tested phospholipids. 305
on March 31, 2020 by guest
http://aem.asm
.org/D
ownloaded from
306
Figure 1 307
on March 31, 2020 by guest
http://aem.asm
.org/D
ownloaded from

308
Figure 2 309 on March 31, 2020 by guest
http://aem.asm
.org/D
ownloaded from

Table 1 310
Name Acronym CAS
number
MW
(Da) Structure
CSC
(μM) CMC
(μM) Highest
Inactivation
[log(CFU/mL
)] 1,2-dihexadecanoyl-sn-
glycero-3-
phosphocholine
DPPC
PC(16:0/16:0) 63-89-8 734.0
2.04 ca. 13.6 0.657±0.08c
1,2-dioctadecanoyl-sn-
glycero-3-
phosphocholine
DSPC
PC(18:0/18:0) 816-94-4 790.1
0.63 ca.
1.27x10⁻³
1.898±0.247a
1,2-dihexadecanoyl-sn-
glycero-3-phosphate
(sodium salt)
DPPA
PA(16:0/16:0) 169051-60-9 670.9
3.73 > 1.49
x102
1.207±0.152b
1,2-dihexadecanoyl-sn-
glycero-3-
phosphoethanolamine
DPPE
PE(16:0/16:0)
923-61-5 692.0
2.17 ca. 14.5 0.850±0.145b,c
1,2-dihexadecanoyl-sn-
glycero-3-phospho-L-
serine
DPPS
PS(16:0/16:0)
145849-32-7 757.9
None Not
measured
None
1,2-dioctadecanoyl-sn-
glycero-3-
ethylphosphocholine
18:0 EPC 328268-13-9 854.7
2.92 Not
measured
2.168±0.540a
311
on March 31, 2020 by guest
http://aem.asm
.org/D
ownloaded from
312
References 313
1. Control CfD, Prevention, Control CfD, Prevention. 2011. Estimates of foodborne illness in the 314 United States. Internet Address: http://www cdc gov/foodborneburden/2011-foodborne-315 estimates html Accessed Nov. 316
2. Organization WH. 2015. WHO estimates of the global burden of foodborne diseases. WHO: 317 Geneva, Switzerland. 318
3. Control CfD, Prevention. 2014. Reports of selected E. coli outbreak investigations. 319 4. Burt S. 2004. Essential oils: their antibacterial properties and potential applications in foods—a 320
review. International journal of food microbiology 94:223-253. 321 5. Gaysinsky S, Davidson PM, Bruce BD, Weiss J. 2005. Growth inhibition of Escherichia coli O157: 322
H7 and Listeria monocytogenes by carvacrol and eugenol encapsulated in surfactant micelles. 323 Journal of Food Protection® 68:2559-2566. 324
6. Gaysinsky S, Davidson PM, Bruce BD, Weiss J. 2005. Stability and antimicrobial efficiency of 325 eugenol encapsulated in surfactant micelles as affected by temperature and pH. Journal of food 326 protection 68:1359-1366. 327
7. Van Nieuwenhuyzen W. 1981. The industrial uses of special lecithins: a review. Journal of the 328 American Oil Chemists Society 58:886-888. 329
8. Donsì F, Annunziata M, Vincensi M, Ferrari G. 2012. Design of nanoemulsion-based delivery 330 systems of natural antimicrobials: effect of the emulsifier. Journal of biotechnology 159:342-331 350. 332
9. Donsì F, Annunziata M, Sessa M, Ferrari G. 2011. Nanoencapsulation of essential oils to 333 enhance their antimicrobial activity in foods. LWT-Food Science and Technology 44:1908-1914. 334
10. Chang Y, McLandsborough L, McClements DJ. 2012. Physical properties and antimicrobial 335 efficacy of thyme oil nanoemulsions: influence of ripening inhibitors. Journal of agricultural and 336 food chemistry 60:12056-12063. 337
11. Zhang H, Dudley EG, Davidson PM, Harte F. 2017. Critical concentration of lecithin enhances 338 the antimicrobial activity of eugenol against Escherichia coli. Applied and Environmental 339 Microbiology 83:e03467-03416. 340
12. Rydhag L, Wilton I. 1981. The function of phospholipids of soybean lecithin in emulsions. 341 Journal of the American Oil Chemists’ Society 58:830-837. 342
13. Siegel DP. 1986. Inverted micellar intermediates and the transitions between lamellar, cubic, 343 and inverted hexagonal lipid phases. II. Implications for membrane-membrane interactions and 344 membrane fusion. Biophysical journal 49:1171-1183. 345
14. Polozova AI, Dubachev GE, Simonova TN, Barsukov LI. 1995. Temperature-induced micellar-346 lamellar transformation in binary mixtures of saturated phosphatidylcholines with sodium 347 cholate. FEBS letters 358:17-22. 348
15. Schurtenberger P, Peng Q, Leser M, Luisi P-L. 1993. Structure and phase behavior of lecithin-349 based microemulsions: a study of the chain length dependence. Journal of colloid and interface 350 science 156:43-51. 351
16. Koivusalo M, Haimi P, Heikinheimo L, Kostiainen R, Somerharju P. 2001. Quantitative 352 determination of phospholipid compositions by ESI-MS: effects of acyl chain length, 353 unsaturation, and lipid concentration on instrument response. Journal of Lipid Research 42:663-354 672. 355
17. Sun W, Tristram-Nagle S, Suter R, Nagle J. 1996. Structure of gel phase saturated lecithin 356 bilayers: temperature and chain length dependence. Biophysical journal 71:885-891. 357
on March 31, 2020 by guest
http://aem.asm
.org/D
ownloaded from

18. Mileykovskaya E, Dowhan W. 2000. Visualization of phospholipid domains inEscherichia coli by 358 using the cardiolipin-specific fluorescent dye 10-N-nonyl acridine orange. Journal of bacteriology 359 182:1172-1175. 360
19. Cristani M, D'Arrigo M, Mandalari G, Castelli F, Sarpietro MG, Micieli D, Venuti V, Bisignano G, 361 Saija A, Trombetta D. 2007. Interaction of four monoterpenes contained in essential oils with 362 model membranes: implications for their antibacterial activity. Journal of Agricultural and Food 363 Chemistry 55:6300-6308. 364
20. Appleyard R. 1954. Segregation of new lysogenic types during growth of a doubly lysogenic 365 strain derived from Escherichia coli K12. Genetics 39:440. 366
21. Pósfai G, Plunkett G, Fehér T, Frisch D, Keil GM, Umenhoffer K, Kolisnychenko V, Stahl B, 367 Sharma SS, De Arruda M. 2006. Emergent properties of reduced-genome Escherichia coli. 368 Science 312:1044-1046. 369
22. Ananthapadmanabhan K, Goddard E, Turro N, Kuo P. 1985. Fluorescence probes for critical 370 micelle concentration. Langmuir 1:352-355. 371
23. Ray GB, Chakraborty I, Moulik SP. 2006. Pyrene absorption can be a convenient method for 372 probing critical micellar concentration (cmc) and indexing micellar polarity. Journal of colloid 373 and interface science 294:248-254. 374
24. Heerklotz H, Epand RM. 2001. The enthalpy of acyl chain packing and the apparent water-375 accessible apolar surface area of phospholipids. Biophysical journal 80:271-279. 376
25. Marsh D. 1990. CRC handbook of lipid bilayers. 377 26. Kleinschmidt JH, Tamm LK. 2002. Structural transitions in short-chain lipid assemblies studied 378
by 31 P-NMR spectroscopy. Biophysical journal 83:994-1003. 379 27. Siegel D. 1986. Inverted micellar intermediates and the transitions between lamellar, cubic, and 380
inverted hexagonal amphiphile phases. III. Isotropic and inverted cubic state formation via 381 intermediates in transitions between Lα and HII phases. Chemistry and physics of lipids 42:279-382 301. 383
28. Harlos K, Eibl H. 1981. Hexagonal phases in phospholipids with saturated chains: 384 phosphatidylethanolamines and phosphatidic acids. Biochemistry 20:2888-2892. 385
29. Aguiar J, Carpena P, Molina-Bolıvar J, Ruiz CC. 2003. On the determination of the critical micelle 386 concentration by the pyrene 1: 3 ratio method. Journal of Colloid and Interface Science 258:116-387 122. 388
30. Marsh D, King MD. 1986. Prediction of the critical micelle concentrations of mono-and di-acyl 389 phospholipids. Chemistry and physics of lipids 42:271-277. 390
31. Smith R, Tanford C. 1972. The critical micelle concentration of l-α-391 dipalmitoylphosphatidylcholine in water and water/methanol solutions. Journal of molecular 392 biology 67:75-83. 393
32. Huang Y-X, Tan R-C, Li Y-L, Yang Y-Q, Yu L, He Q-C. 2001. Effect of salts on the formation of C8-394 lecithin micelles in aqueous solution. Journal of colloid and interface science 236:28-34. 395
33. Maiti K, Mitra D, Guha S, Moulik SP. 2009. Salt effect on self-aggregation of sodium 396 dodecylsulfate (SDS) and tetradecyltrimethylammonium bromide (TTAB): Physicochemical 397 correlation and assessment in the light of Hofmeister (lyotropic) effect. Journal of Molecular 398 Liquids 146:44-51. 399
34. King MD, Marsh D. 1987. Head group and chain length dependence of phospholipid self-400 assembly studied by spin-label electron spin resonance. Biochemistry 26:1224-1231. 401
35. Keweloh H, Diefenbach R, Rehm H-J. 1991. Increase of phenol tolerance of Escherichia coli by 402 alterations of the fatty acid composition of the membrane lipids. Archives of microbiology 403 157:49-53. 404
on March 31, 2020 by guest
http://aem.asm
.org/D
ownloaded from

36. Danino D, Abezgauz L, Portnaya I, Dan N. 2016. From Discs to Ribbons Networks: The Second 405 Critical Micelle Concentration in Nonionic Sterol Solutions. The journal of physical chemistry 406 letters 7:1434-1439. 407
37. Burdíková J, Mravec F, Pekař M. 2016. The formation of mixed micelles of sugar surfactants and 408 phospholipids and their interactions with hyaluronan. Colloid and Polymer Science 294:823-831. 409
38. Fukuma T, Higgins MJ, Jarvis SP. 2007. Direct imaging of lipid-ion network formation under 410 physiological conditions by frequency modulation atomic force microscopy. Physical review 411 letters 98:106101. 412
413
on March 31, 2020 by guest
http://aem.asm
.org/D
ownloaded from
Top Related