


Languages
Pages
Legal

CRISIL IERIndependentEquityResearch
Enhancing investment decisions
Responsive Industries Ltd
Q3FY13 Results Update
CRISIL IERIndependentEquityResearch
Explanation of CRISIL Fundamental and Valuation (CFV) matrix
The CFV Matrix (CRISIL Fundamental and Valuation Matrix) addresses the two important analysis of an investment making process – Analysis
of Fundamentals (addressed through Fundamental Grade) and Analysis of Returns (Valuation Grade) The fundamental grade is assigned on a
five-point scale from grade 5 (indicating Excellent fundamentals) to grade 1 (Poor fundamentals) The valuation grade is assigned on a five-
point scale from grade 5 (indicating strong upside from the current market price (CMP)) to grade 1 (strong downside from the CMP).
CRISIL
Fundamental Grade Assessment
CRISIL
Valuation Grade Assessment
5/5 Excellent fundamentals 5/5 Strong upside (>25% from CMP)
4/5 Superior fundamentals 4/5 Upside (10-25% from CMP)
3/5 Good fundamentals 3/5 Align (+-10% from CMP)
2/5 Moderate fundamentals 2/5 Downside (negative 10-25% from CMP)
1/5 Poor fundamentals 1/5 Strong downside (<-25% from CMP)
About CRISIL Limited
CRISIL is a global analytical company providing ratings, research, and risk and policy advisory services. We are India's leading ratings agency.
We are also the foremost provider of high-end research to the world's largest banks and leading corporations.
About CRISIL Research
CRISIL Research is India's largest independent and integrated research house. We provide insights, opinions, and analysis on the Indian
economy, industries, capital markets and companies. We are India's most credible provider of economy and industry research. Our industry
research covers 70 sectors and is known for its rich insights and perspectives. Our analysis is supported by inputs from our network of more
than 4,500 primary sources, including industry experts, industry associations, and trade channels. We play a key role in India's fixed income
markets. We are India's largest provider of valuations of fixed income securities, serving the mutual fund, insurance, and banking industries.
We are the sole provider of debt and hybrid indices to India's mutual fund and life insurance industries. We pioneered independent equity
research in India, and are today India's largest independent equity research house. Our defining trait is the ability to convert information and
data into expert judgments and forecasts with complete objectivity. We leverage our deep understanding of the macro economy and our
extensive sector coverage to provide unique insights on micro-macro and cross-sectoral linkages. We deliver our research through an
innovative web-based research platform. Our talent pool comprises economists, sector experts, company analysts, and information
management specialists.
CRISIL Privacy
CRISIL respects your privacy. We use your contact information, such as your name, address, and email id, to fulfill your request and service
your account and to provide you with additional information from CRISIL and other parts of The McGraw-Hill Companies, Inc. you may find of
interest. For further information, or to let us know your preferences with respect to receiving marketing materials, please visit
www.crisil.com/privacy. You can view McGraw-Hill’s Customer Privacy Policy at http://www.mcgrawhill.com/site/tools/privacy/privacy_english.
Last updated: April 30, 2012
Analyst Disclosure
Each member of the team involved in the preparation of the grading report, hereby affirms that there exists no conflict of interest that can bias
the grading recommendation of the company.
Disclaimer:
This Company-commissioned CRISIL IER report is based on data publicly available or from sources considered reliable. CRISIL Ltd.
(CRISIL) does not represent that it is accurate or complete and hence, it should not be relied upon as such. The data / report is subject to
change without any prior notice. Opinions expressed herein are our current opinions as on the date of this report. Nothing in this report
constitutes investment, legal, accounting or tax advice or any solicitation, whatsoever. The subscriber / user assume the entire risk of any use
made of this data / report. CRISIL especially states that, it has no financial liability whatsoever, to the subscribers / users of this report. This
report is for the personal information only of the authorised recipient in India only. This report should not be reproduced or redistributed or
communicated directly or indirectly in any form to any other person – especially outside India or published or copied in whole or in part, for any
purpose.
Responsive Industries Ltd
Strong revenue growth
Fundamental Grade 4/5 (Superior fundamentals)
Valuation Grade 4/5 (CMP has upside)
Industry Materials
1
March 01, 2013
Fair Value ₹117
CMP ₹94
For detailed initiating coverage report please visit: www.ier.co.in
CRISIL Independent Equity Research reports are also available on Bloomberg (CRI <go>) and Thomson Reuters.
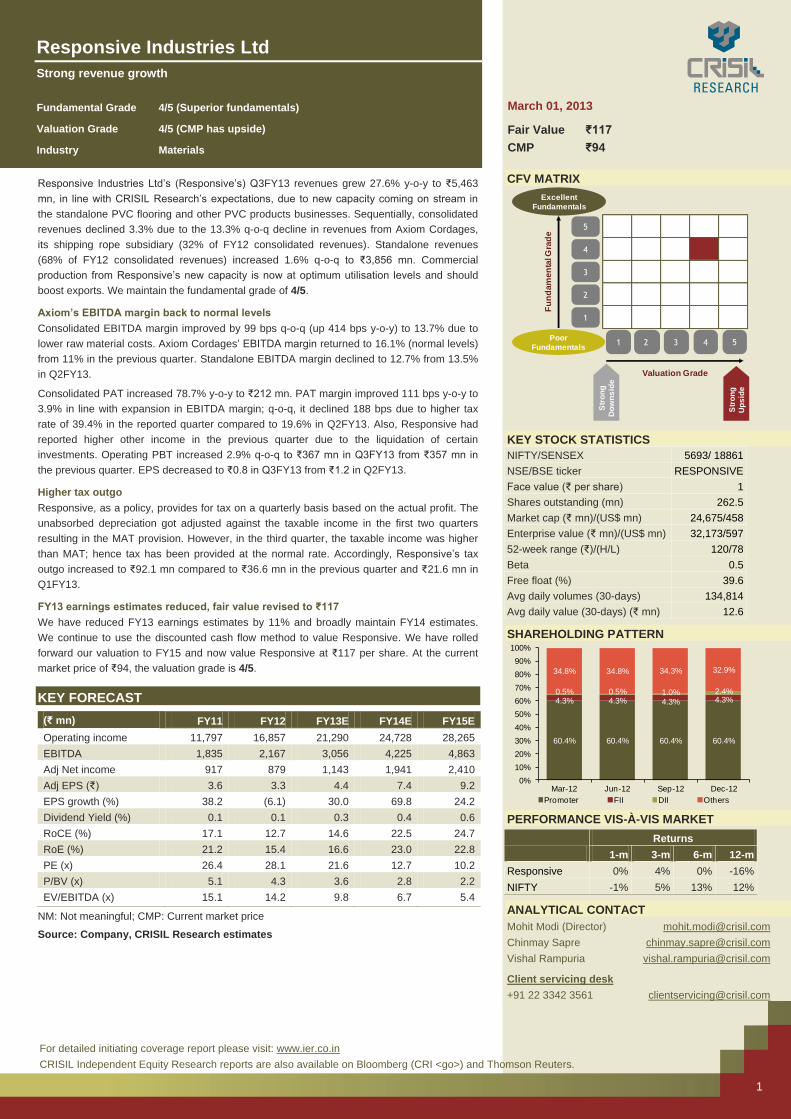
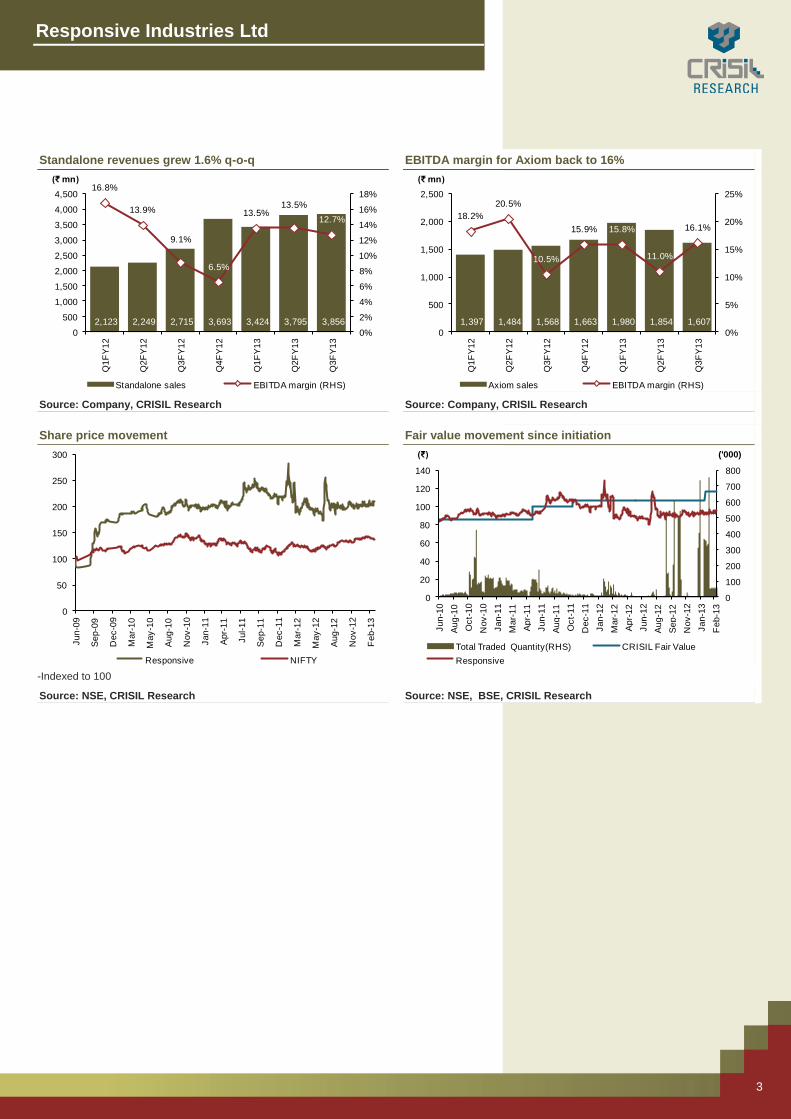
Responsive Industries Ltd’s (Responsive’s) Q3FY13 revenues grew 27.6% y-o-y to ₹5,463
mn, in line with CRISIL Research’s expectations, due to new capacity coming on stream in
the standalone PVC flooring and other PVC products businesses. Sequentially, consolidated
revenues declined 3.3% due to the 13.3% q-o-q decline in revenues from Axiom Cordages,
its shipping rope subsidiary (32% of FY12 consolidated revenues). Standalone revenues
(68% of FY12 consolidated revenues) increased 1.6% q-o-q to ₹3,856 mn. Commercial
production from Responsive’s new capacity is now at optimum utilisation levels and should
boost exports. We maintain the fundamental grade of 4/5.
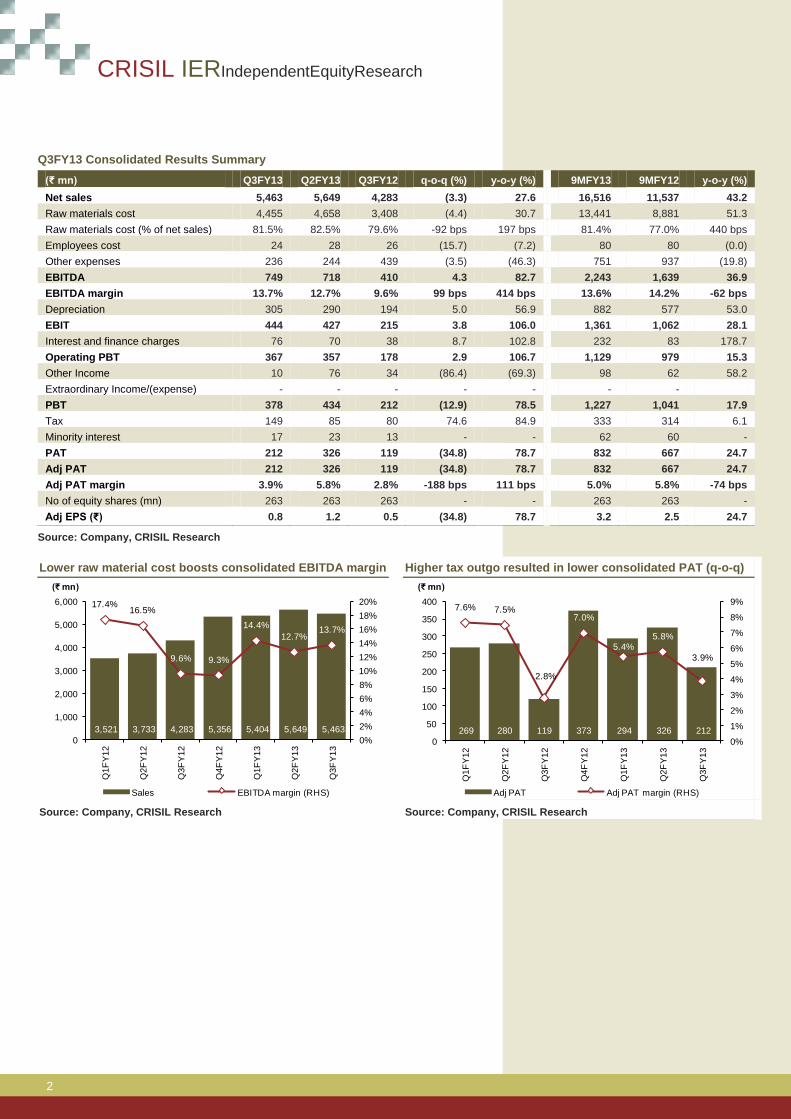
Axiom’s EBITDA margin back to normal levels
Consolidated EBITDA margin improved by 99 bps q-o-q (up 414 bps y-o-y) to 13.7% due to
lower raw material costs. Axiom Cordages’ EBITDA margin returned to 16.1% (normal levels)
from 11% in the previous quarter. Standalone EBITDA margin declined to 12.7% from 13.5%
in Q2FY13.
Consolidated PAT increased 78.7% y-o-y to ₹212 mn. PAT margin improved 111 bps y-o-y to
3.9% in line with expansion in EBITDA margin; q-o-q, it declined 188 bps due to higher tax
rate of 39.4% in the reported quarter compared to 19.6% in Q2FY13. Also, Responsive had
reported higher other income in the previous quarter due to the liquidation of certain
investments. Operating PBT increased 2.9% q-o-q to ₹367 mn in Q3FY13 from ₹357 mn in
the previous quarter. EPS decreased to ₹0.8 in Q3FY13 from ₹1.2 in Q2FY13.
Higher tax outgo
Responsive, as a policy, provides for tax on a quarterly basis based on the actual profit. The
unabsorbed depreciation got adjusted against the taxable income in the first two quarters
resulting in the MAT provision. However, in the third quarter, the taxable income was higher
than MAT; hence tax has been provided at the normal rate. Accordingly, Responsive’s tax
outgo increased to ₹92.1 mn compared to ₹36.6 mn in the previous quarter and ₹21.6 mn in
Q1FY13.
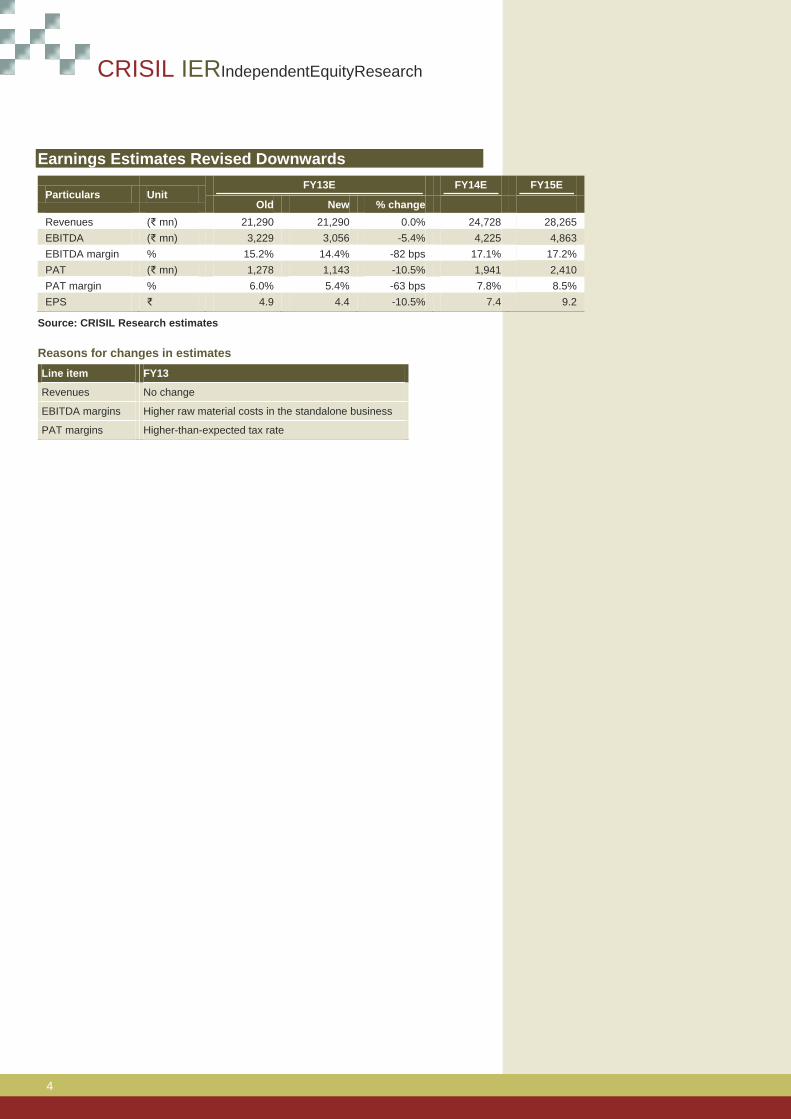
FY13 earnings estimates reduced, fair value revised to ₹117
We have reduced FY13 earnings estimates by 11% and broadly maintain FY14 estimates.
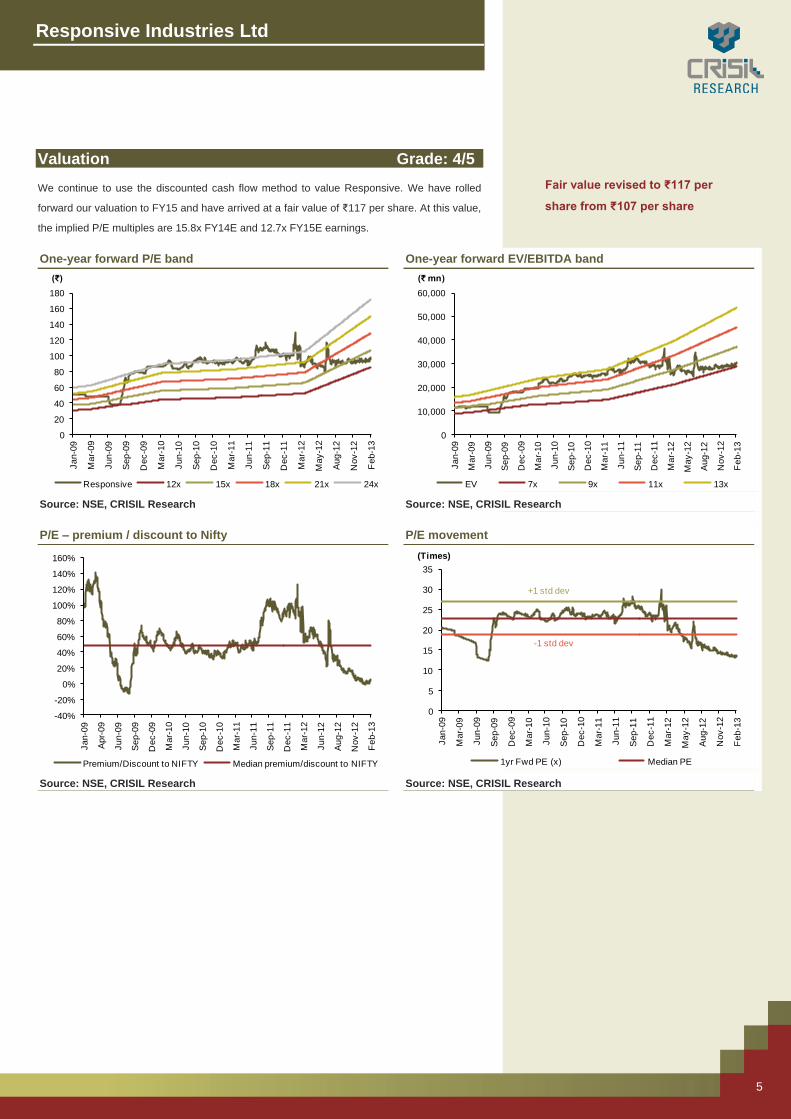
We continue to use the discounted cash flow method to value Responsive. We have rolled
forward our valuation to FY15 and now value Responsive at ₹117 per share. At the current
market price of ₹94, the valuation grade is 4/5.
KEY FORECAST
(₹ mn) FY11 FY12 FY13E FY14E FY15E
Operating income 11,797 16,857 21,290 24,728 28,265
EBITDA 1,835 2,167 3,056 4,225 4,863
Adj Net income 917 879 1,143 1,941 2,410
Adj EPS (₹) 3.6 3.3 4.4 7.4 9.2
EPS growth (%) 38.2 (6.1) 30.0 69.8 24.2
Dividend Yield (%) 0.1 0.1 0.3 0.4 0.6
RoCE (%) 17.1 12.7 14.6 22.5 24.7
RoE (%) 21.2 15.4 16.6 23.0 22.8
PE (x) 26.4 28.1 21.6 12.7 10.2
P/BV (x) 5.1 4.3 3.6 2.8 2.2
EV/EBITDA (x) 15.1 14.2 9.8 6.7 5.4
NM: Not meaningful; CMP: Current market price
Source: Company, CRISIL Research estimates
CFV MATRIX
KEY STOCK STATISTICS
NIFTY/SENSEX 5693/ 18861
NSE/BSE ticker RESPONSIVE
Face value (₹ per share) 1
Shares outstanding (mn) 262.5
Market cap (₹ mn)/(US$ mn) 24,675/458
Enterprise value (₹ mn)/(US$ mn) 32,173/597
52-week range (₹)/(H/L) 120/78
Beta 0.5
Free float (%) 39.6
Avg daily volumes (30-days) 134,814
Avg daily value (30-days) (₹ mn) 12.6
SHAREHOLDING PATTERN
PERFORMANCE VIS-À-VIS MARKET
Returns
1-m 3-m 6-m 12-m
Responsive 0% 4% 0% -16%
NIFTY -1% 5% 13% 12%
ANALYTICAL CONTACT
Mohit Modi (Director) [email protected]
Chinmay Sapre [email protected]
Vishal Rampuria [email protected]
Client servicing desk
+91 22 3342 3561 [email protected]
1 2 3 4 5
1
2
3
4
5
Valuation Grade
Fu
nd
am
en
tal G
rad
e
Poor
Fundamentals
Excellent
Fundamentals
Str
on
g
Do
wn
sid
e
Str
on
g
Up
sid
e60.4% 60.4% 60.4% 60.4%
4.3% 4.3% 4.3% 4.3%0.5% 0.5% 1.0% 2.4%
34.8% 34.8% 34.3% 32.9%
0%
10%
20%
30%
40%
50%
60%
70%
80%
90%
100%
Mar-12 Jun-12 Sep-12 Dec-12
Promoter FII DII Others
CRISIL IERIndependentEquityResearch
2
Q3FY13 Consolidated Results Summary
(₹ mn) Q3FY13 Q2FY13 Q3FY12 q-o-q (%) y-o-y (%) 9MFY13 9MFY12 y-o-y (%)
Net sales 5,463 5,649 4,283 (3.3) 27.6 16,516 11,537 43.2
Raw materials cost 4,455 4,658 3,408 (4.4) 30.7 13,441 8,881 51.3
Raw materials cost (% of net sales) 81.5% 82.5% 79.6% -92 bps 197 bps 81.4% 77.0% 440 bps
Employees cost 24 28 26 (15.7) (7.2) 80 80 (0.0)
Other expenses 236 244 439 (3.5) (46.3) 751 937 (19.8)
EBITDA 749 718 410 4.3 82.7 2,243 1,639 36.9
EBITDA margin 13.7% 12.7% 9.6% 99 bps 414 bps 13.6% 14.2% -62 bps
Depreciation 305 290 194 5.0 56.9 882 577 53.0
EBIT 444 427 215 3.8 106.0 1,361 1,062 28.1
Interest and finance charges 76 70 38 8.7 102.8 232 83 178.7
Operating PBT 367 357 178 2.9 106.7 1,129 979 15.3
Other Income 10 76 34 (86.4) (69.3) 98 62 58.2
Extraordinary Income/(expense) - - - - - - -
PBT 378 434 212 (12.9) 78.5 1,227 1,041 17.9
Tax 149 85 80 74.6 84.9 333 314 6.1
Minority interest 17 23 13 - - 62 60 -
PAT 212 326 119 (34.8) 78.7 832 667 24.7
Adj PAT 212 326 119 (34.8) 78.7 832 667 24.7
Adj PAT margin 3.9% 5.8% 2.8% -188 bps 111 bps 5.0% 5.8% -74 bps
No of equity shares (mn) 263 263 263 - - 263 263 -
Adj EPS (₹) 0.8 1.2 0.5 (34.8) 78.7 3.2 2.5 24.7
Source: Company, CRISIL Research
Lower raw material cost boosts consolidated EBITDA margin Higher tax outgo resulted in lower consolidated PAT (q-o-q)
Source: Company, CRISIL Research Source: Company, CRISIL Research
3,521 3,733 4,283 5,356 5,404 5,649 5,463
17.4%16.5%
9.6% 9.3%
14.4%
12.7%13.7%
0%
2%
4%
6%
8%
10%
12%
14%
16%
18%
20%
0
1,000
2,000
3,000
4,000
5,000
6,000
Q1F
Y1
2
Q2F
Y1
2
Q3F
Y1
2
Q4F
Y1
2
Q1F
Y1
3
Q2F
Y1
3
Q3F
Y1
3
(₹ mn)
Sales EBITDA margin (RHS)
269 280 119 373 294 326 212
7.6% 7.5%
2.8%
7.0%
5.4%5.8%
3.9%
0%
1%
2%
3%
4%
5%
6%
7%
8%
9%
0
50
100
150
200
250
300
350
400
Q1
FY
12
Q2
FY
12
Q3
FY
12
Q4
FY
12
Q1
FY
13
Q2
FY
13
Q3
FY
13
(₹ mn)
Adj PAT Adj PAT margin (RHS)
Responsive Industries Ltd
3
Standalone revenues grew 1.6% q-o-q EBITDA margin for Axiom back to 16%
Source: Company, CRISIL Research Source: Company, CRISIL Research
Share price movement Fair value movement since initiation
-Indexed to 100
Source: NSE, CRISIL Research Source: NSE, BSE, CRISIL Research
2,123 2,249 2,715 3,693 3,424 3,795 3,856
16.8%
13.9%
9.1%
6.5%
13.5%13.5%
12.7%
0%
2%
4%
6%
8%
10%
12%
14%
16%
18%
0
500
1,000
1,500
2,000
2,500
3,000
3,500
4,000
4,500
Q1F
Y1
2
Q2F
Y1
2
Q3F
Y1
2
Q4F
Y1
2
Q1F
Y1
3
Q2F
Y1
3
Q3F
Y1
3
(₹ mn)
Standalone sales EBITDA margin (RHS)
1,397 1,484 1,568 1,663 1,980 1,854 1,607
18.2%
20.5%
10.5%
15.9% 15.8%
11.0%
16.1%
0%
5%
10%
15%
20%
25%
0
500
1,000
1,500
2,000
2,500
Q1F
Y1
2
Q2F
Y1
2
Q3F
Y1
2
Q4F
Y1
2
Q1F
Y1
3
Q2F
Y1
3
Q3F
Y1
3
(₹ mn)
Axiom sales EBITDA margin (RHS)
0
50
100
150
200
250
300
Jun
-09
Se
p-0
9
Dec-0
9
Mar-
10
May-1
0
Au
g-1
0
Nov-1
0
Jan
-11
Apr-
11
Jul-
11
Se
p-1
1
Dec-1
1
Ma
r-1
2
May-1
2
Au
g-1
2
Nov-1
2
Feb
-13
Responsive NIFTY
0
100
200
300
400
500
600
700
800
0
20
40
60
80
100
120
140
Jun-1
0
Au
g-1
0
Oc
t-1
0
Nov
-10
Jan-1
1
Mar-
11
Ap
r-1
1
Jun-1
1
Au
g-1
1
Oc
t-1
1
Dec
-11
Ja
n-1
2
Mar-
12
Ap
r-1
2
Jun-1
2
Au
g-1
2
Se
p-1
2
Nov
-12
Ja
n-1
3
Feb-1
3
('000)(₹)
Total Traded Quantity(RHS) CRISIL Fair Value
Responsive
CRISIL IERIndependentEquityResearch
4
Earnings Estimates Revised Downwards
Particulars Unit FY13E FY14E FY15E
Old New % change
Revenues (₹ mn) 21,290 21,290 0.0% 24,728 28,265
EBITDA (₹ mn) 3,229 3,056 -5.4% 4,225 4,863
EBITDA margin % 15.2% 14.4% -82 bps 17.1% 17.2%
PAT (₹ mn) 1,278 1,143 -10.5% 1,941 2,410
PAT margin % 6.0% 5.4% -63 bps 7.8% 8.5%
EPS ₹ 4.9 4.4 -10.5% 7.4 9.2
Source: CRISIL Research estimates
Reasons for changes in estimates
Line item FY13
Revenues No change
EBITDA margins Higher raw material costs in the standalone business
PAT margins Higher-than-expected tax rate
Responsive Industries Ltd
5
Valuation Grade: 4/5
We continue to use the discounted cash flow method to value Responsive. We have rolled
forward our valuation to FY15 and have arrived at a fair value of ₹117 per share. At this value,
the implied P/E multiples are 15.8x FY14E and 12.7x FY15E earnings.
One-year forward P/E band One-year forward EV/EBITDA band
Source: NSE, CRISIL Research Source: NSE, CRISIL Research
P/E – premium / discount to Nifty P/E movement
Source: NSE, CRISIL Research Source: NSE, CRISIL Research
0
20
40
60
80
100
120
140
160
180
Jan-0
9
Mar-
09
Ju
n-0
9
Sep
-09
Dec-0
9
Mar-
10
Ju
n-1
0
Sep
-10
Dec-1
0
Mar-
11
Ju
n-1
1
Sep
-11
Dec-1
1
Mar-
12
May-1
2
Aug
-12
Nov-1
2
Fe
b-1
3
(₹)
Responsive 12x 15x 18x 21x 24x
0
10,000
20,000
30,000
40,000
50,000
60,000
Jan-0
9
Mar-
09
Jun-0
9
Se
p-0
9
Dec
-09
Ma
r-1
0
Jun-1
0
Se
p-1
0
Dec
-10
Mar-
11
Jun-1
1
Se
p-1
1
De
c-1
1
Ma
r-1
2
May-1
2
Au
g-1
2
Nov
-12
Feb-1
3
(₹ mn)
EV 7x 9x 11x 13x
-40%
-20%
0%
20%
40%
60%
80%
100%
120%
140%
160%
Jan-0
9
Ap
r-0
9
Ju
n-0
9
Se
p-0
9
Dec-0
9
Mar-
10
Ju
n-1
0
Se
p-1
0
Dec-1
0
Mar-
11
Jun-1
1
Se
p-1
1
Dec-1
1
Mar-
12
Jun-1
2
Au
g-1
2
Nov-1
2
Feb
-13
Premium/Discount to NIFTY Median premium/discount to NIFTY
0
5
10
15
20
25
30
35
Jan
-09
Mar-
09
Jun
-09
Se
p-0
9
Dec-0
9
Ma
r-1
0
Jun
-10
Se
p-1
0
Dec-1
0
Ma
r-1
1
Jun
-11
Se
p-1
1
Dec-1
1
Mar-
12
Ma
y-1
2
Au
g-1
2
Nov-1
2
Feb-1
3
(Times)
1yr Fwd PE (x) Median PE
+1 std dev
-1 std dev
Fair value revised to ₹117 per
share from ₹107 per share
CRISIL IERIndependentEquityResearch
6
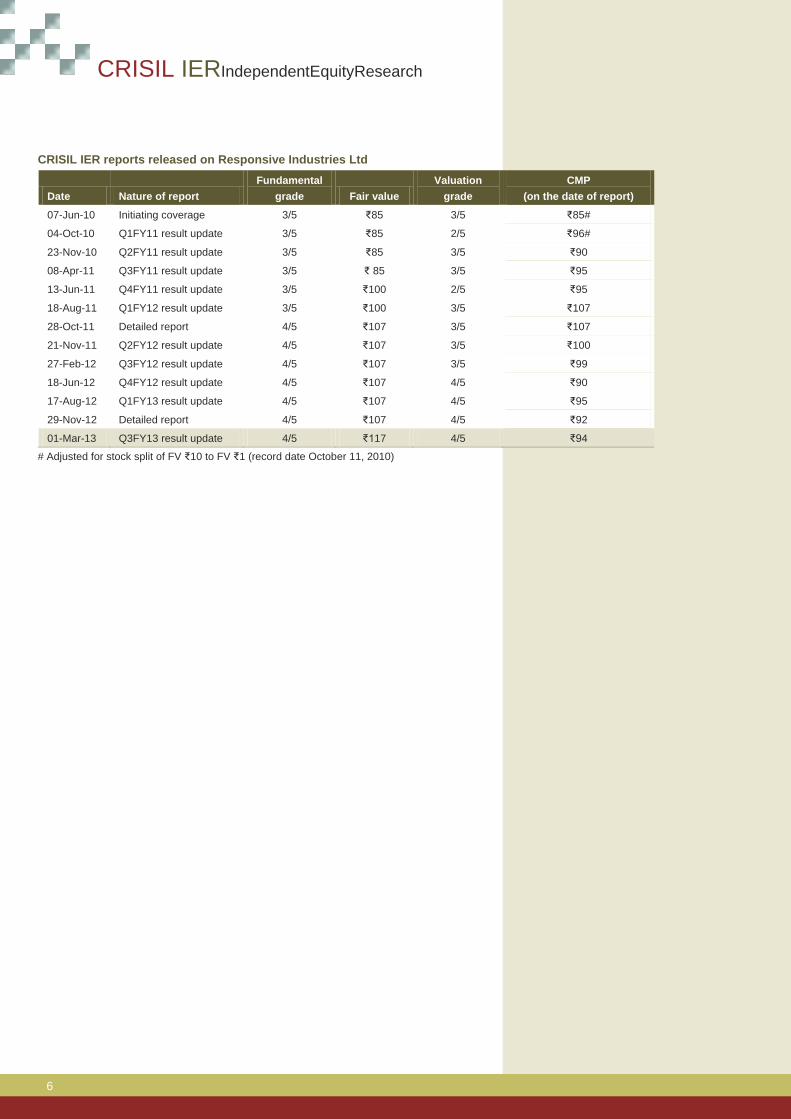
CRISIL IER reports released on Responsive Industries Ltd
Date Nature of report
Fundamental
grade Fair value
Valuation
grade
CMP
(on the date of report)
07-Jun-10 Initiating coverage 3/5 ₹85 3/5 ₹85#
04-Oct-10 Q1FY11 result update 3/5 ₹85 2/5 ₹96#
23-Nov-10 Q2FY11 result update 3/5 ₹85 3/5 ₹90
08-Apr-11 Q3FY11 result update 3/5 ₹ 85 3/5 ₹95
13-Jun-11 Q4FY11 result update 3/5 ₹100 2/5 ₹95
18-Aug-11 Q1FY12 result update 3/5 ₹100 3/5 ₹107
28-Oct-11 Detailed report 4/5 ₹107 3/5 ₹107
21-Nov-11 Q2FY12 result update 4/5 ₹107 3/5 ₹100
27-Feb-12 Q3FY12 result update 4/5 ₹107 3/5 ₹99
18-Jun-12 Q4FY12 result update 4/5 ₹107 4/5 ₹90
17-Aug-12 Q1FY13 result update 4/5 ₹107 4/5 ₹95
29-Nov-12 Detailed report 4/5 ₹107 4/5 ₹92
01-Mar-13 Q3FY13 result update 4/5 ₹117 4/5 ₹94
# Adjusted for stock split of FV ₹10 to FV ₹1 (record date October 11, 2010)
Responsive Industries Ltd
7
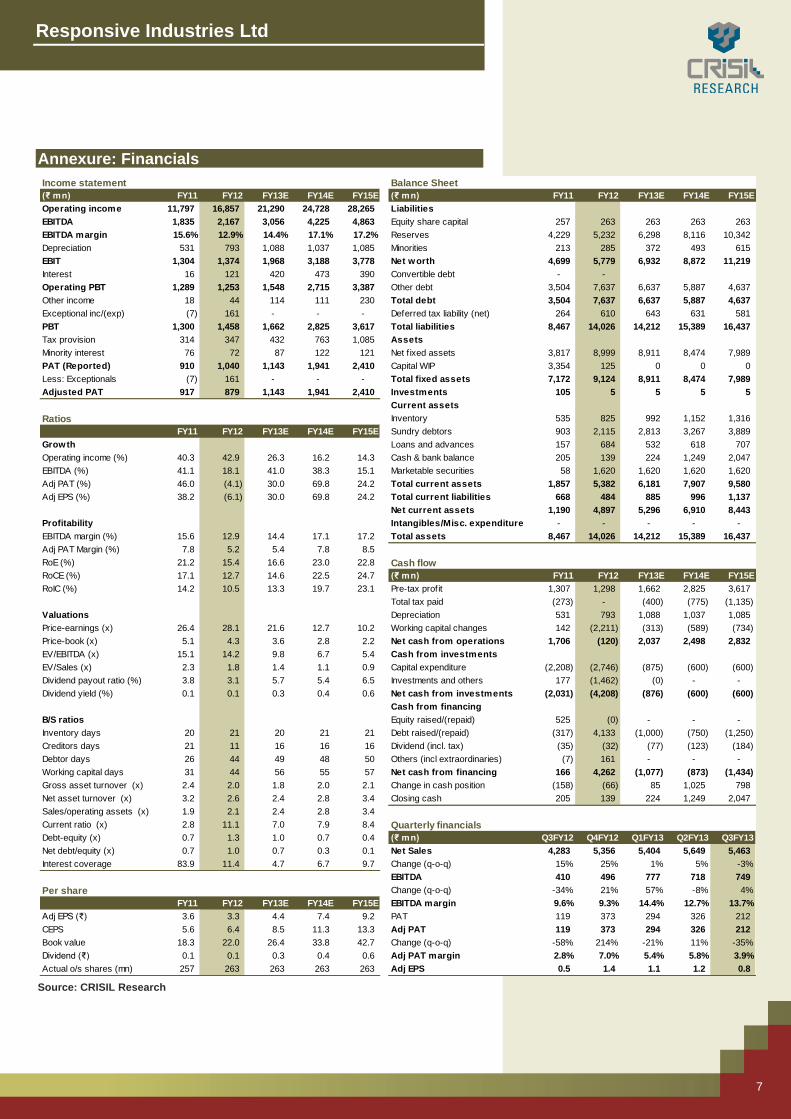
Annexure: Financials
Source: CRISIL Research
Income statement Balance Sheet
(₹ mn) FY11 FY12 FY13E FY14E FY15E (₹ mn) FY11 FY12 FY13E FY14E FY15E
Operating income 11,797 16,857 21,290 24,728 28,265 Liabilities
EBITDA 1,835 2,167 3,056 4,225 4,863 Equity share capital 257 263 263 263 263
EBITDA margin 15.6% 12.9% 14.4% 17.1% 17.2% Reserves 4,229 5,232 6,298 8,116 10,342
Depreciation 531 793 1,088 1,037 1,085 Minorities 213 285 372 493 615
EBIT 1,304 1,374 1,968 3,188 3,778 Net worth 4,699 5,779 6,932 8,872 11,219
Interest 16 121 420 473 390 Convertible debt - -
Operating PBT 1,289 1,253 1,548 2,715 3,387 Other debt 3,504 7,637 6,637 5,887 4,637
Other income 18 44 114 111 230 Total debt 3,504 7,637 6,637 5,887 4,637
Exceptional inc/(exp) (7) 161 - - - Deferred tax liability (net) 264 610 643 631 581
PBT 1,300 1,458 1,662 2,825 3,617 Total liabilities 8,467 14,026 14,212 15,389 16,437
Tax provision 314 347 432 763 1,085 Assets
Minority interest 76 72 87 122 121 Net f ixed assets 3,817 8,999 8,911 8,474 7,989
PAT (Reported) 910 1,040 1,143 1,941 2,410 Capital WIP 3,354 125 0 0 0
Less: Exceptionals (7) 161 - - - Total fixed assets 7,172 9,124 8,911 8,474 7,989
Adjusted PAT 917 879 1,143 1,941 2,410 Investments 105 5 5 5 5
Current assets
Ratios Inventory 535 825 992 1,152 1,316
FY11 FY12 FY13E FY14E FY15E Sundry debtors 903 2,115 2,813 3,267 3,889
Growth Loans and advances 157 684 532 618 707
Operating income (%) 40.3 42.9 26.3 16.2 14.3 Cash & bank balance 205 139 224 1,249 2,047
EBITDA (%) 41.1 18.1 41.0 38.3 15.1 Marketable securities 58 1,620 1,620 1,620 1,620
Adj PAT (%) 46.0 (4.1) 30.0 69.8 24.2 Total current assets 1,857 5,382 6,181 7,907 9,580
Adj EPS (%) 38.2 (6.1) 30.0 69.8 24.2 Total current liabilities 668 484 885 996 1,137
Net current assets 1,190 4,897 5,296 6,910 8,443
Profitability Intangibles/Misc. expenditure - - - - -
EBITDA margin (%) 15.6 12.9 14.4 17.1 17.2 Total assets 8,467 14,026 14,212 15,389 16,437
Adj PAT Margin (%) 7.8 5.2 5.4 7.8 8.5
RoE (%) 21.2 15.4 16.6 23.0 22.8 Cash flow
RoCE (%) 17.1 12.7 14.6 22.5 24.7 (₹ mn) FY11 FY12 FY13E FY14E FY15E
RoIC (%) 14.2 10.5 13.3 19.7 23.1 Pre-tax profit 1,307 1,298 1,662 2,825 3,617
Total tax paid (273) - (400) (775) (1,135)
Valuations Depreciation 531 793 1,088 1,037 1,085
Price-earnings (x) 26.4 28.1 21.6 12.7 10.2 Working capital changes 142 (2,211) (313) (589) (734)
Price-book (x) 5.1 4.3 3.6 2.8 2.2 Net cash from operations 1,706 (120) 2,037 2,498 2,832
EV/EBITDA (x) 15.1 14.2 9.8 6.7 5.4 Cash from investments
EV/Sales (x) 2.3 1.8 1.4 1.1 0.9 Capital expenditure (2,208) (2,746) (875) (600) (600)
Dividend payout ratio (%) 3.8 3.1 5.7 5.4 6.5 Investments and others 177 (1,462) (0) - -
Dividend yield (%) 0.1 0.1 0.3 0.4 0.6 Net cash from investments (2,031) (4,208) (876) (600) (600)
Cash from financing
B/S ratios Equity raised/(repaid) 525 (0) - - -
Inventory days 20 21 20 21 21 Debt raised/(repaid) (317) 4,133 (1,000) (750) (1,250)
Creditors days 21 11 16 16 16 Dividend (incl. tax) (35) (32) (77) (123) (184)
Debtor days 26 44 49 48 50 Others (incl extraordinaries) (7) 161 - - -
Working capital days 31 44 56 55 57 Net cash from financing 166 4,262 (1,077) (873) (1,434)
Gross asset turnover (x) 2.4 2.0 1.8 2.0 2.1 Change in cash position (158) (66) 85 1,025 798
Net asset turnover (x) 3.2 2.6 2.4 2.8 3.4 Closing cash 205 139 224 1,249 2,047
Sales/operating assets (x) 1.9 2.1 2.4 2.8 3.4
Current ratio (x) 2.8 11.1 7.0 7.9 8.4 Quarterly financials
Debt-equity (x) 0.7 1.3 1.0 0.7 0.4 (₹ mn) Q3FY12 Q4FY12 Q1FY13 Q2FY13 Q3FY13
Net debt/equity (x) 0.7 1.0 0.7 0.3 0.1 Net Sales 4,283 5,356 5,404 5,649 5,463
Interest coverage 83.9 11.4 4.7 6.7 9.7 Change (q-o-q) 15% 25% 1% 5% -3%
EBITDA 410 496 777 718 749
Per share Change (q-o-q) -34% 21% 57% -8% 4%
FY11 FY12 FY13E FY14E FY15E EBITDA margin 9.6% 9.3% 14.4% 12.7% 13.7%
Adj EPS (₹) 3.6 3.3 4.4 7.4 9.2 PAT 119 373 294 326 212
CEPS 5.6 6.4 8.5 11.3 13.3 Adj PAT 119 373 294 326 212
Book value 18.3 22.0 26.4 33.8 42.7 Change (q-o-q) -58% 214% -21% 11% -35%
Dividend (₹) 0.1 0.1 0.3 0.4 0.6 Adj PAT margin 2.8% 7.0% 5.4% 5.8% 3.9%
Actual o/s shares (mn) 257 263 263 263 263 Adj EPS 0.5 1.4 1.1 1.2 0.8
CRISIL IERIndependentEquityResearch
CRISIL Research Team
President
Mukesh Agarwal CRISIL Research +91 22 3342 3035 [email protected]
Analytical Contacts
Prasad Koparkar Senior Director, Industry & Customised Research +91 22 3342 3137 [email protected]
Binaifer Jehani Director, Customised Research +91 22 3342 4091 [email protected]
Manoj Mohta Director, Customised Research +91 22 3342 3554 [email protected]
Sudhir Nair Director, Customised Research +91 22 3342 3526 [email protected]
Mohit Modi Director, Equity Research +91 22 4254 2860 [email protected]
Jiju Vidyadharan Director, Funds & Fixed Income Research +91 22 3342 8091 [email protected]
Ajay D'Souza Director, Industry Research +91 22 3342 3567 [email protected]
Ajay Srinivasan Director, Industry Research +91 22 3342 3530 [email protected]
Rahul Prithiani Director, Industry Research +91 22 3342 3574 [email protected]
Business Development
Siddharth Arora Director, Customised Research +91 22 3342 4133 [email protected]
Sagar Sawarkar Associate Director, Equity Research +91 22 3342 8012 [email protected]
Deepak Mittal Associate Director, Funds & Fixed Income Research +91 22 3342 8031 [email protected]
Prosenjit Ghosh Associate Director, Industry & Customised Research +91 22 3342 8008 [email protected]
Business Development – Equity Research
Ahmedabad / Mumbai
Vishal Shah – Regional Manager, Business Development
Email : [email protected] I Phone : +91 9820598908
Bengaluru / Chennai / Hyderabad
Shweta Adukia – Regional Manager, Business Development
Email : [email protected] I Phone : +91 9987855771
Delhi / Mumbai
Arjun Gopalkrishnan – Regional Manager, Business Development
Email : [email protected] I Phone : +91 9833364422
Kolkata
Priyanka Murarka – Regional Manager, Business Development
Email : [email protected] I Phone : +91 9903060685
Our Capabilities
Making Markets Function Better
Economy and Industry Research
▪ Largest team of economy and industry research analysts in India
▪ Coverage on 70 industries and 139 sub-sectors; provide growth forecasts, profitability analysis, emerging trends,
expected investments, industry structure and regulatory frameworks
▪ 90 per cent of India’s commercial banks use our industry research for credit decisions
▪ Special coverage on key growth sectors including real estate, infrastructure, logistics, and financial services
▪ Inputs to India’s leading corporates in market sizing, demand forecasting, and project feasibility
▪ Published the first India-focused report on Ultra High Net-worth Individuals
▪ All opinions and forecasts reviewed by a highly qualified panel with over 200 years of cumulative experience
Funds and Fixed Income Research
▪ Largest and most comprehensive database on India’s debt market, covering more than 14,000 securities
▪ Largest provider of fixed income valuations in India
▪ Value more than ₹33 trillion (USD 650 billion) of Indian debt securities, comprising 85 per cent of outstanding
securities
▪ Sole provider of fixed income and hybrid indices to mutual funds and insurance companies; we maintain 12
standard indices and over 80 customised indices
▪ Ranking of Indian mutual fund schemes covering 71 per cent of average assets under management and
₹4.7 trillion (USD 94 billion) by value
▪ Retained by India’s Employees’ Provident Fund Organisation, the world’s largest retirement scheme covering
over 50 million individuals, for selecting fund managers and monitoring their performance
Equity and Company Research
▪ Largest independent equity research house in India, focusing on small and mid-cap companies; coverage
exceeds 100 companies
▪ Released company reports on all 1,401 companies listed and traded on the National Stock Exchange; a global
first for any stock exchange
▪ First research house to release exchange-commissioned equity research reports in India
▪ Assigned the first IPO grade in India
Our Office
Ahmedabad
706, Venus Atlantis
Nr. Reliance Petrol Pump
Prahladnagar, Ahmedabad, India
Phone: +91 79 4024 4500
Fax: +91 79 2755 9863
Hyderabad
3rd Floor, Uma Chambers
Plot No. 9&10, Nagarjuna Hills,
(Near Punjagutta Cross Road)
Hyderabad - 500 482, India
Phone: +91 40 2335 8103/05
Fax: +91 40 2335 7507
Bengaluru
W-101, Sunrise Chambers,
22, Ulsoor Road,
Bengaluru - 560 042, India
Phone:+91 80 2558 0899
+91 80 2559 4802
Fax: +91 80 2559 4801
Kolkata
Horizon, Block 'B', 4th Floor
57 Chowringhee Road
Kolkata - 700 071, India
Phone: +91 33 2289 1949/50
Fax: +91 33 2283 0597
Chennai
Thapar House,
43/44, Montieth Road, Egmore,
Chennai - 600 008, India
Phone:+91 44 2854 6205/06
+91 44 2854 6093
Fax: +91 44 2854 7531
Pune
1187/17, Ghole Road,
Shivaji Nagar,
Pune - 411 005, India
Phone: +91 20 2553 9064/67
Fax: +91 20 4018 1930
Gurgaon
Plot No. 46
Sector 44
Opp. PF Office
Gurgaon - 122 003, India
Phone: + 91 124 6722 000
CRISIL Ltd is a Standard & Poor's company
CRISIL Limited
CRISIL House, Central Avenue,
Hiranandani Business Park, Powai, Mumbai – 400076. India
Phone: +91 22 3342 3000 | Fax: +91 22 3342 8088
www.crisil.com
Top Related