

![Overview Neighborhood graph Search Quantization Application · [1] Trinary-Projection Trees for Approximate Nearest Neighbor Search. Jingdong Wang, Naiyan Wang, You Jia, Jian Li,](https://static.fdocuments.us/doc/165x107/5e9dc1c628894a4e8b7c87f2/overview-neighborhood-graph-search-quantization-application-1-trinary-projection.jpg)


Languages
Pages
Legal


CRANFIELD UNIVERSITY
WANG JIAN
AIRCRAFT HYDRAULIC POWER SYSTEM DIAGNOSTICS, PROGNOSTICS AND HEALTH MANAGEMENT
SCHOOL OF ENGINEERING MSc by Research
MSc Academic Year: 2011 - 2012
Supervisor: Dr. Craig Lawson January 2012


CRANFIELD UNIVERSITY
SCHOOL OF ENGINEERING MSc by Research
MSc
Academic Year 2011 - 2012
WANG JIAN
Aircraft Hydraulic Power System Diagnostics, Prognostics and Health Management
Supervisor: Dr. Craig Lawson January 2012
This thesis is submitted in partial fulfilment of the requirements for
the degree of Master of Science
© Cranfield University 2012. All rights reserved. No part of this publication may be reproduced without the written permission of the
copyright owner.


i
ABSTRACT This Individual Research Project (IRP) is the extension research to the group design
project (GDP) work which the author has participated in his Msc programme. The GDP
objective is to complete the conceptual design of a 200-seat, flying wing civil airliner—
FW-11. The next generation aircraft design demands higher reliability, safety and
maintainability.
With the development of the vehicle hydraulic system technology, the equipment and
systems become more and more complex, their reliability and maintenance become
more difficult for designers, manufacturers and customers. To improve the mission
reliability and reduce life cycle cost, there is strong demand for the application of health
management technology into airframe system design.
In this research, the author introduced diagnostic, prognostic and health management
(DPHM) concept into the aircraft hydraulic power system development. As a brand new
technology, it is a challenge to apply the DPHM techniques to on-board system. Firstly,
an assumed hydraulic power system was designed for FW-11 by the author and used as
the case in his IRP research. Then the crucial components and key parameters needed to
be monitored were obtained based on Function Hazard Analysis and Failure Modes
Effects Analysis of this system. The writer compared a few diagnostic and prognostic
methods in detail, and then selected suitable ones for a hydraulic power system. A
diagnostic process was applied to the hydraulic power system using a Case-based
reasoning (CBR) approach, whilst a hybrid prognostic method was suggested for the
system. After that, a diagnostic, prognostic and health management (DPHM)
architecture of the hydraulic power system was designed at system level based on the
diagnostic and prognostic research. The whole research work provided a general and
practical instruction for hydraulic system design by means of DPHM application.
Keywords: Hydraulic, FMEA, CBR, DPHM, diagnostic, prognostic


iii
ACKNOWLEDGEMENTS I would like to take this opportunity to personally thank my supervisor Dr. Craig
Lawson and other staff from Department of Aerospace Engineering, for their advices,
encouragements and supports all along the IRP and GDP period.
I really appreciate to my sponsors, The First Aircraft Institute, AVIC and China
Scholarship Council.
I would like also to say thanks to my friends Yang Yang, Shi Zhijun, Pang Huahua and
Zhou Weiguo, for their support and friendship during this year in Cranfield.
A special thanks to Mrs Michèle and Mr Maurice for their kind help on my English
writing.
Finally, the last words are for my families, especially my wife Sun Min and my
daughter Wang Yinhan, for their understanding, encouragements and “on-line” support
during my oversea study this year.


v
TABLE OF CONTENTS
ABSTRACT ...................................................................................................................... iACKNOWLEDGEMENTS ............................................................................................ iiiLIST OF FIGURES ........................................................................................................ viiLIST OF TABLES .......................................................................................................... ixLIST OF EQUATIONS ................................................................................................... xiLIST OF ABBREVIATIONS ....................................................................................... xiii1 Introduction ................................................................................................................... 1
1.1 Introduction ............................................................................................................ 11.2 Background ............................................................................................................. 11.3 Status and Questions ............................................................................................... 21.4 Research Objectives and Scope .............................................................................. 31.5 Methodology ........................................................................................................... 4
2 Literature review ............................................................................................................ 72.1 PHM Technology History and Status ..................................................................... 72.2 PHM Function and Benefits ................................................................................... 92.3 Classification of diagnostics technologies ............................................................ 11
2.3.1 Rule-based Expert System ............................................................................. 122.3.2 Case-Based Reasoning .................................................................................. 132.3.3 Model-Based Reasoning ................................................................................ 142.3.4 Learning Systems .......................................................................................... 15
2.4 Classification of Prognostic Technologies ........................................................... 152.4.1 Model-based Prognostic ................................................................................ 152.4.2 Probability-based Prognostics ....................................................................... 162.4.3 Data-driven Prediction Approach .................................................................. 17
2.5 Summary ............................................................................................................... 183 Hydraulic Power system Functional and Failure Modes Analysis .............................. 21
3.1 FW-11 Hydraulic Power System Design .............................................................. 213.1.1 Design Requirement ...................................................................................... 213.1.2 Hydraulic System Architecture ..................................................................... 233.1.3 Hydraulic Power System Functions .............................................................. 27
3.2 Hydraulic Power System Functional Hazard Assessment .................................... 293.2.1 Introduction ................................................................................................... 293.2.2 Failure Condition Severity and Effect Classifications .................................. 293.2.3 FHA Summary ............................................................................................... 31
3.3 Hydraulic Power System FMECA ....................................................................... 313.3.1 Introduction ................................................................................................... 313.3.2 FMECA Approaches and Process ................................................................. 323.3.3 FMECA Summary ......................................................................................... 34
3.4 Hydraulic Power System Fault Tree Analysis ...................................................... 343.4.1 Introduction ................................................................................................... 34

vi
3.4.2 Definition of FTA symbols ........................................................................... 353.4.3 FTA Probability Calculation ......................................................................... 353.4.4 FTA Summary ............................................................................................... 36
3.5 Summary ............................................................................................................... 364 Diagnostics Research for a Hydraulic Power System ................................................. 39
4.1 Choice of Diagnostic Methods ............................................................................. 394.2 Case-based Reasoning Approach ......................................................................... 40
4.2.1 Introduction ................................................................................................... 404.2.2 CBR Diagnosis Process ................................................................................. 404.2.3 Constituent Elements of CBR ....................................................................... 41
4.3 Design of CBR for a Hydraulic Power System .................................................... 444.4 Case study ............................................................................................................. 46
4.4.1 Introduction to EMP ...................................................................................... 464.4.2 Pump Failure Analysis and Detection ........................................................... 484.4.3 Diagnostic Process ......................................................................................... 49
4.5 Summary and Discussion ..................................................................................... 515 Prognostic Research for Hydraulic Power System ...................................................... 53
5.1 Prognostics Methods Investigation ....................................................................... 535.2 Prognostic Application for Hydraulic Power system ........................................... 555.3 Case Discussion .................................................................................................... 575.4 Summary ............................................................................................................... 61
6 Hydraulic Power System DPHM Architecture ............................................................ 636.1 Hydraulic Power System DPHM Framework ...................................................... 636.2 Functional Classification of DPHM ..................................................................... 656.3 Operating Process of DPHM ................................................................................ 656.4 Benefits and Challenges of DPHM Application ................................................... 666.5 Summary ............................................................................................................... 68
7 Conclusions and Further Work .................................................................................... 697.1 Conclusions .......................................................................................................... 697.2 Future Work .......................................................................................................... 71
REFERENCES ............................................................................................................... 73APPENDICES ................................................................................................................ 79Appendix A: Group Design Project Report………………………………………79 Appendix B: Hydraulic Power system FHA Summary…………………………117 Appendix C: Hydraulic Power system FMECA Summary……………………123 Appendix D: Hydraulic Power system FTA Summary…………………………139

vii
LIST OF FIGURES Figure 1-1: A typical functional flow of a DPHM system [2] ..........................................2
Figure 2-1: F-35 PHM Architecture [8] ............................................................................9
Figure 2-2 A typical PHM cycle [6] ................................................................................10
Figure 2-3 General process of diagnosis [12] ..................................................................11
Figure 2-4 Model-based and data-driven diagnosis techniques [6] .................................12
Figure 2-5 reasoning chaining of rule-based expert system [12] ....................................13
Figure 2-6 Case-based Reasoning System cycle [13] .....................................................14
Figure 2-7 A Model-based Reasoning approach [6] .......................................................15
Figure 2-8 A typical example of Model-based prognostic approach [15] .......................16
Figure 2-9 Probability-based prognostic approach [16] ..................................................17
Figure 2-10 The ANN prognostic paradigm [6] ..............................................................18
Figure 2-11 Prognostic technical approaches [6] ............................................................19
Figure 3-1 FW-11 control surface ...................................................................................22
Figure 3-2 FW-11 Hydraulic System Functional Diagram .............................................24
Figure 3-3 LEFT or RIGHT hydraulic power system schematic ....................................25
Figure 3-4 CENTRE hydraulic power system schematic ................................................26
Figure 3-5 FMECA process .............................................................................................33
Figure 4-1 CBR diagnosis cycle [6] ................................................................................41
Figure 4-2 a simple case structure [35] ...........................................................................42
Figure 4-3 CBR Diagnostics workflow for hydraulic power system ..............................45
Figure 4-4 AC Motor pump [43] .....................................................................................47
Figure 4-5 Cross section view of piston pump [44] ........................................................47
Figure 4-6 Examples of case-base and the EMP failure ase-structure ............................50
Figure 5-1 Failure Progression Timeline [38] .................................................................53
Figure 5-2 Prognosis Approaches Application [2] ..........................................................55
Figure 5-3 A fusion prognosis workflow for pumps .......................................................58
Figure 5-4 Fluid Property Sensors [41] ...........................................................................60
Figure 5-5 Ferrous wear debris sensor [42] .....................................................................60
Figure 6-1 FW-11 Hydraulic Power System DPHM Framework ...................................64


ix
LIST OF TABLES
Table 2-1 Evolution of Health Management Technologies [7]......................................... 7
Table 2-2 Advantages and disadvantages of diagnostics methods [17] ..........................18
Table 3-1 Hydraulic power system components list .......................................................27
Table 3-2 Failure Condition Severity and Effect Classifications [2] ..............................30
Table 3-3 Overview of failure classification and safety objectives [25] .........................30
Table 3-4 Hydraulic power System Severe Failure Condition Summary .......................31
Table 3-5 Definition of FTA symbols [26] .....................................................................35
Table 3-6 FHA, FMECA and FTA results ......................................................................37
Table 4-1 Summary of FHA, FMEA ...............................................................................48
Table 4-2 Pump failure detection ....................................................................................49
Table 4-3 Sensors and features look up table ..................................................................50
Table 5-1 Hydraulic power system prognostic methods .................................................56


xi
LIST OF EQUATIONS Equation 3-1 ……………………………………………………………………. 35
Equation 3-2 ……………………………………………………………………. 35
Equation 3-3 ……………………………………………………………………. 35
Equation 3-4 ……………………………………………………………………. 36
Equation 3-5 ……………………………………………………………………. 36
Equation 4-1 ……………………………………………………………………. 43


xiii
LIST OF ABBREVIATIONS
ACMP Alternating current motor pumps
ADP Air Driven Pump
ANN Artificial neural network
CAAC Civil Aviation Administration of China
CBM Condition-based maintenance
CBR Case-based reasoning
DoD Department of Defense
DPHM Diagnostics, prognostics and health management
EASA European Aviation Safety Agency
EDP Engine Driven Pump
EHA Electrical-Hydrostatic Actuator
EMA Electromechanical Actuator
EMP Electronic Electric Motor Pump
EPS Electrical Power System
FAA Federal Aviation Administration
FHA Functional hazard Assessment
FMECA Failure modes effect and criticality analysis
FTA Fault Tree Analysis
HSMU Hydraulic System Management Unit
IRP Individual Research Project
IVHM Integrated Vehicle Health Management
LRU Line Replaceable Unit
MBR Model-based reasoning
OMS On-board Maintenance Systems
PDFs Probability density functions
PHM Prognostic and health management
RAT Ram Air Turbine
RUL Remaining useful life
SOV Shut-off Valve


1
1 Introduction
1.1 Introduction This thesis consists of the Individual Research Project (IRP) and a Group Design
Project (GDP) in which the author has participated during the current academic year.
The GDP is to design a Flying wing civil aircraft—FW-11 which, in its conceptual
phase, is a long range, 250-seat, next generation airliner. The IRP is an extension
research of the GDP, which aims to incorporate diagnostics, prognostics and health
management (DPHM) concepts into the FW-11 hydraulic power system. The research
also contributes to the design target of the GDP work.
In this chapter, the background and problem statement are presented first to demonstrate
the purpose of this project. It is followed by the research objectives and methodology of
this thesis.
1.2 Background An aircraft’s hydraulic power system is one of the essential secondary power systems
which transfer mechanical energy from engines to actuators by pressurised fluid.
Hydraulic power for aircraft first appeared in the 1930s and has remained an effective
solution for over seventy years. With the development of hydraulic system technologies,
the equipment and systems have become increasingly complex. This means in turn that
system fault detecting and failure predicting is complex. At the same time, new
investment in research and development has resulted in the intensification of
competition in the civil aviation market. To gain a competitive advantage, future aircraft
design aims for improved reliability and safety. The DPHM technology is a new
philosophy in airframe systems design which aims to scientifically improve system
reliability and maintainability. It can also enhance economic efficiency in the product
life-cycle.
The Health Management concept is the capability to make appropriate decisions about
maintenance actions based on real-time monitoring, diagnosis and prognosis
information, available resources, and operational demand [1]. The main functions of
PHM technique incorporate three aspects: Real-time monitoring, Diagnostics and

2
Prognostics. The first primarily aims to acquire system or components status by
advanced sensor technologies and related software in real time. Diagnostic is a fault
identification and failure detection process based on the monitoring parameters and
historgraphic data. The Prognosis process predicts the state of health and remaining life
or the appropriate operating time span of systems and components. From the “Engine
monitoring system” of the A-7 in the 1970s to the JSF PHM application in recent years,
prognostics and health management (PHM) techniques have gradually developed into a
complete concept. Figure 1-1 shows a typical DPHM functional flow.
Figure 1-1: A typical functional flow of a DPHM system [2]
1.3 Status and Questions With new technologies such as Fly-by-Wire, Electric Air Conditioning and
Electromechanical Actuator (EMA) applied to aircraft systems, traditional energy
systems, including hydraulic power, faced greater challenges. It can be seen from more
and more publications and sci-tech articles that aircraft will incorporate more-electric
systems and even all-electric system instead of hydraulically powered systems. This
will undoubtedly simplify the system architecture and reduce system failure modes.
Currently, neither the Airbus A380 nor Boeing B787, those new generation airplanes,
can operate without a hydraulic power system. [3][4]In current technical conditions,

3
hydraulic power has significant advantages because of its higher power to weight ratio,
especially in large power actuation mechanisms. [25] However, how is the position of
hydraulic power in aircraft system to be maintained? How can we reduce the hydraulic
power system failure rate to improve aircraft safety and reliability? How can we detect
potential hydraulic hardware faults and failures and avoid catastrophic accidents? How
can the maintenance workload be simplified to reduce life cycle costs?
There is, therefore, a strong demand for the incorporation of prognostic and health
management technology into aircraft hydraulic power systems.
1.4 Research Objectives and Scope This research aims to develop a prognostic and health management approach to a flying
wing aircraft hydraulic power system as an extension of the Group Design Project
(GDP). Aircraft systems with PHM technology will make the new airliner designed in
the GDP more competitive in a future aviation market.
The GDP design process was divided into three phases. For the each phase, the task and
objective were as follow:
Phase-I: Data collection and market analysis to establish specific design
requirements
Phase-II: Utilize existing aircraft design methods to complete a conventional
aircraft conceptual design as a baseline
Phase-III: Develop a flying wing aircraft for comparison with the baseline to
see the benefits and challenges of the new concept
By means of individual research as part of this thesis, the appropriate PHM methods for
the hydraulic system had to be studied in depth. The following objectives will be
achieved through this research:
Understanding development, status and the main function of PHM.
Familiarisation with the characteristics and operational principles of different
diagnostics and prognostic methods.
To design a hydraulic power system for the FW-11 aircraft.
To establish the main failure modes of the hydraulic power system through

4
safety analysis.
Use of appropriate diagnostic and prognostic methods in hydraulic power
system design.
To design a suitable DPHM architecture for the hydraulic power system based
on its features and the above approaches.
Therefore, this research first focuses on designing a hydraulic power system for the FW-
11 aircraft. Then the studies concentrate on the main functions of DPHM——
diagnostic and prognostic approaches and the concept of DPHM framework building.
Nevertheless, the signal detection and measurement techniques, such as sensors and
probes, are less involved in this thesis due to limited time. The whole research work
aims to improve the hydraulic power system design by means of DPHM application.
1.5 Methodology In Group Design Project, 22 students work as a team to finish the conceptual design of
FW-11aricraft. In this phase, the author mainly contributed to the mass estimations and
landing gear design of the aircraft. A summary of the GDP work and the author’s
contributions are presented in Appendix A.
In the IRP research, the author attempts to develop a generic DPHM methodology for
aircraft hydraulic power systems.
A literature review of PHM technologies will be given at first, which includes the
histories and status of PHM, PHM functions and PHM methods classification.
Then the author will establish an hydraulic power system architecture for the FW-11
aircraft as a case study .The system function will then be briefly described.
Prior to the application work of DPHM, a set of safety analysis methods are employed
to determine which components and system parameters are essential. Functional hazard
Assessment (FHA) is conducted for the whole system to identify hazardous function
failure conditions and associated hazard levels. The failure modes effect and criticality
analysis (FMECA) will be performed for each component of the hydraulic power
system to identify the critical components and their potential failure modes. Fault Tree
Analysis (FTA) for the selected failure modes which have higher hazard levels is

5
carried out in order to determine the possible cause and the probabilities of failure. All
of these analyses are the fundamentals of the following work.
Based on the analyses results, suitable diagnosis and prognosis methods are chosen for
the appropriate components of the hydraulic power system. The diagnostic and
prognostic applications are then the subject of research and in-depth discussion
The hydraulic power system DPHM architecture is included in the next chapter. It is the
integration of the above diagnostics and prognostics research and the interface between
the hydraulic power system and the aircraft level IVHM system.
Finally, the conclusions of all research work and future work are discussed.


7
2 Literature review
2.1 PHM Technology History and Status PHM technology, such as Built-in test (BIT), diagnostics, condition-based maintenance
and prognostic, has been incorporated in industrial applications since the 1970s. As a
typical milestone of early PHM technology, the Engine Monitoring System was applied
to the A-7 in the mid 1970’s. “Recently, stringent advanced diagnostic, prognostics, and
health management capability requirements have begun to be placed on some of the
more sophisticated new applications.” [6]
The evolution of aircraft system health management technology developed by the
Department of Defense (DoD) and NASA is shown below.
Table 2-1 Evolution of Health Management Technologies [7]
The table shows health management developed from system test and monitoring
technologies. In the early stages, aircraft fault diagnosis relied mainly on ground testing.

8
However, faults could not be precisely detected due to the limitations of measurement
instrumentation and methods. Some failure mode will not recur during ground operation.
Modeling and simulation were applied in fault analysis from the 1960s, but aircraft
testing was still carried out externally.
When BIT was employed in avionic systems in the 1970s, system monitoring and fault
diagnosis was brought to an on-board stage. In the next decade, BIT techniques were
incorporated into different aircraft systems. At the same time, testability, reliability and
maintainability were put onto the same level as system design. Testability was
considered as a separate discipline which can be seen in MLT -STD-2165 issued by
United States Department of Defense in 1985.
Over the last twenty years, sensing techniques, diagnostic and prognostic methods have
made significant progress. In 1993 ARINC first introduced the guidance of on-board
Maintenance Systems (OMS) design. Subsequently the application of Condition-based
maintenance (CBM) and PHM brought a revolution in aircraft maintenance, which was
adopted in the Boeing 747-400 airplanes and F-35 respectively.
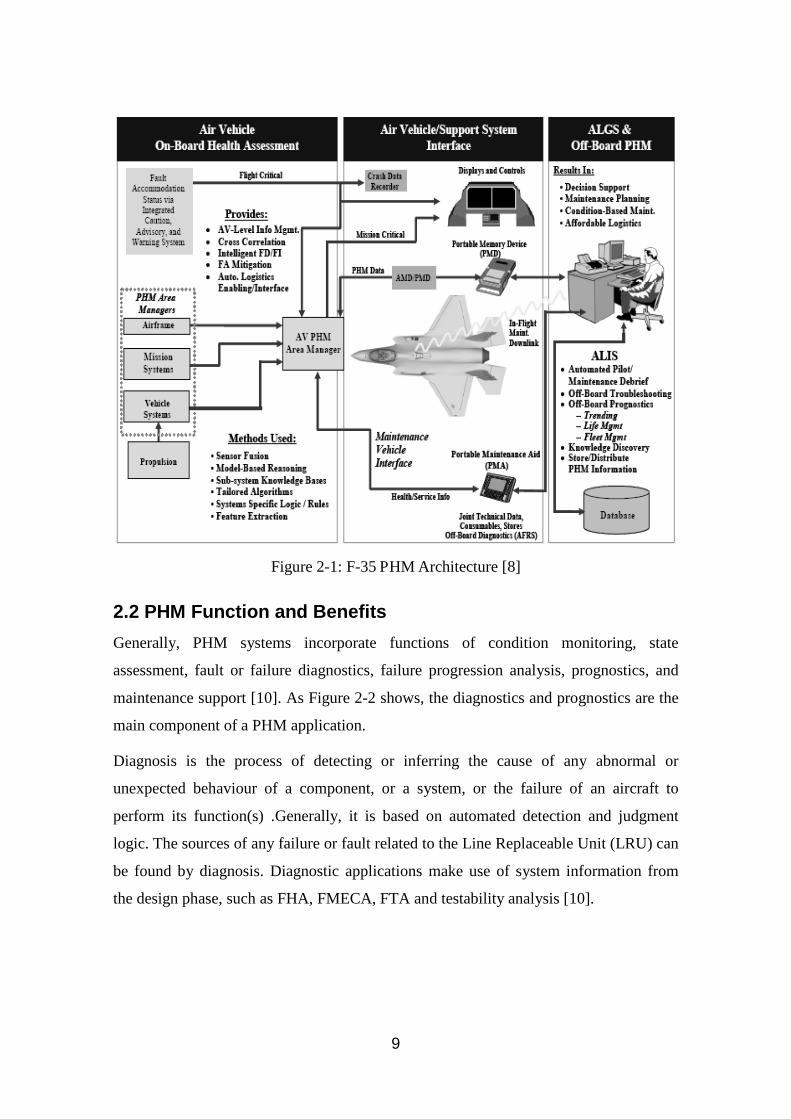
Currently, the PHM system adopted on the F-35 is a comprehensive set of diagnostics,
prognostic and health management capabilities. From the architecture shown in the
following figure, we can see that the PHM on the F-35 includes two parts: on-board
PHM and off-board PHM. [8] The on-board PHM system provides air vehicle
information monitoring and management for airframe, mission system etc. It also
provides logistics support for the end-user and makes the JSF fleet communicate with
the joint distribution information system (JDIS) off-board, which helps the maintainers
to make decisions and plan on-ground maintenance [9].
9
Figure 2-1: F-35 PHM Architecture [8]
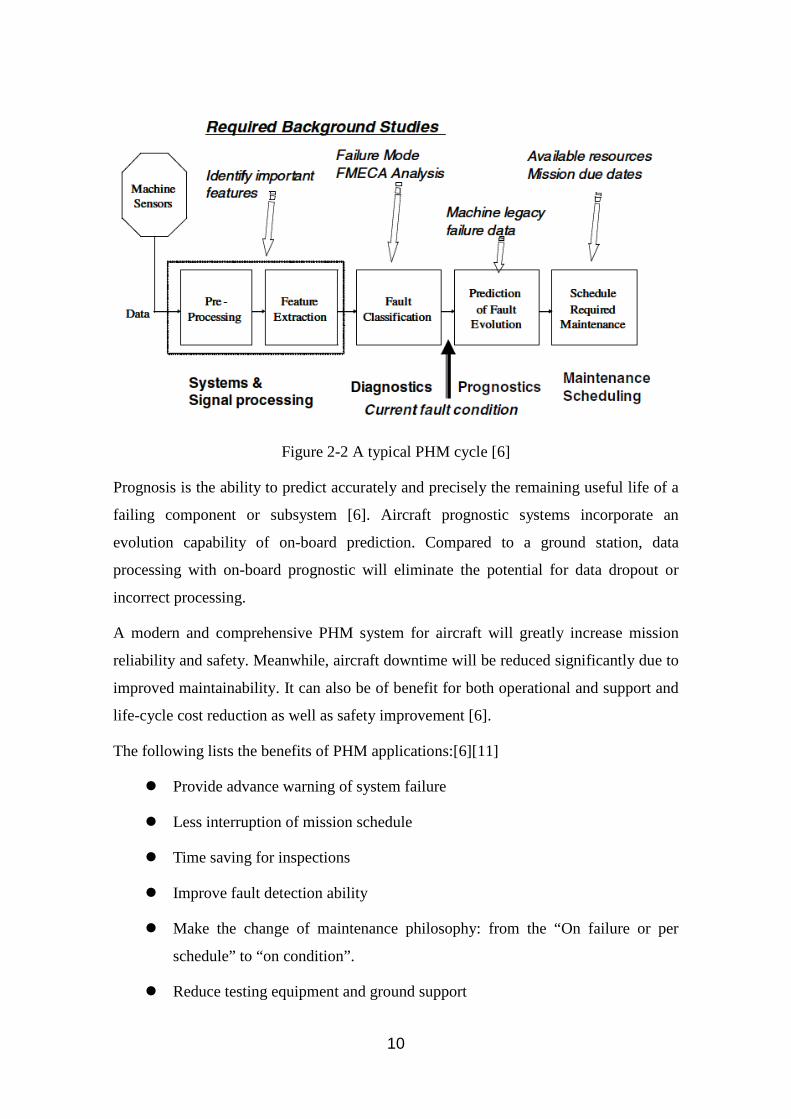
2.2 PHM Function and Benefits Generally, PHM systems incorporate functions of condition monitoring, state
assessment, fault or failure diagnostics, failure progression analysis, prognostics, and
maintenance support [10]. As Figure 2-2 shows, the diagnostics and prognostics are the
main component of a PHM application.
Diagnosis is the process of detecting or inferring the cause of any abnormal or
unexpected behaviour of a component, or a system, or the failure of an aircraft to
perform its function(s) .Generally, it is based on automated detection and judgment
logic. The sources of any failure or fault related to the Line Replaceable Unit (LRU) can
be found by diagnosis. Diagnostic applications make use of system information from
the design phase, such as FHA, FMECA, FTA and testability analysis [10].
10
Figure 2-2 A typical PHM cycle [6]
Prognosis is the ability to predict accurately and precisely the remaining useful life of a
failing component or subsystem [6]. Aircraft prognostic systems incorporate an
evolution capability of on-board prediction. Compared to a ground station, data
processing with on-board prognostic will eliminate the potential for data dropout or
incorrect processing.
A modern and comprehensive PHM system for aircraft will greatly increase mission
reliability and safety. Meanwhile, aircraft downtime will be reduced significantly due to
improved maintainability. It can also be of benefit for both operational and support and
life-cycle cost reduction as well as safety improvement [6].
The following lists the benefits of PHM applications:[6][11]
Provide advance warning of system failure
Less interruption of mission schedule
Time saving for inspections
Improve fault detection ability
Make the change of maintenance philosophy: from the “On failure or per
schedule” to “on condition”.
Reduce testing equipment and ground support

11
Simplify the maintainer training program
Life-cycle cost reduction
2.3 Classification of diagnostics technologies A typical diagnostics process can be described as in the following diagram. Firstly the
system or components operational information is obtained through observation. Then
the observational data is processed by comparison to the expected behavior. Finally the
diagnosis result is given by the diagnostic reasoning engine.
Currently widely-used diagnostic technologies will be described individually in the
following section. And there will be a comparison to discuss their particular advantages
and drawbacks.
According to Ann Patterson-Hine [12], rule-based expert systems, case-based reasoning
(CBR), model-based reasoning (MBR), learning systems and probabilistic reasoning are
described as representative of diagnostic approaches.
Figure 2-3 General process of diagnosis [12]
Referring to G. Vachtsevanos’s book [6], the available techniques can typically be
divided into two main categories: model-based and data-driven methods. As shown in
Fig.2-4 [6], the model-based method can be used for unforeseen faults diagnosis but
must begin with an accurate model. Although a data-driven method is normally used in
detecting anticipated faults only, there is no model needed in data processing.

12
Figure 2-4 Model-based and data-driven diagnosis techniques [6]
Different authors use different classifications of diagnosis techniques. After a
comprehensive consideration, a brief introduction of the following four commonly used
methods will be given.
2.3.1 Rule-based Expert System These methods are mainly used when there is a lack of specific physical properties for
the diagnostic object but expertise is available from historical experiences. The “rule”
used in expert system can be described simply as “if the fault symptom is observed,
then action is required.” Figure 2-5 shows the reasoning chaining of rule-based expert
system. If the observed facts match one established rule from the rule database, the
diagnosis is simple and direct. A set of conflicts will arise when more than one rule
matches. Then a pre-determined strategy will determine which rule has priority and is
applied in the diagnostic results.

13
Figure 2-5 reasoning chaining of rule-based expert system [12]
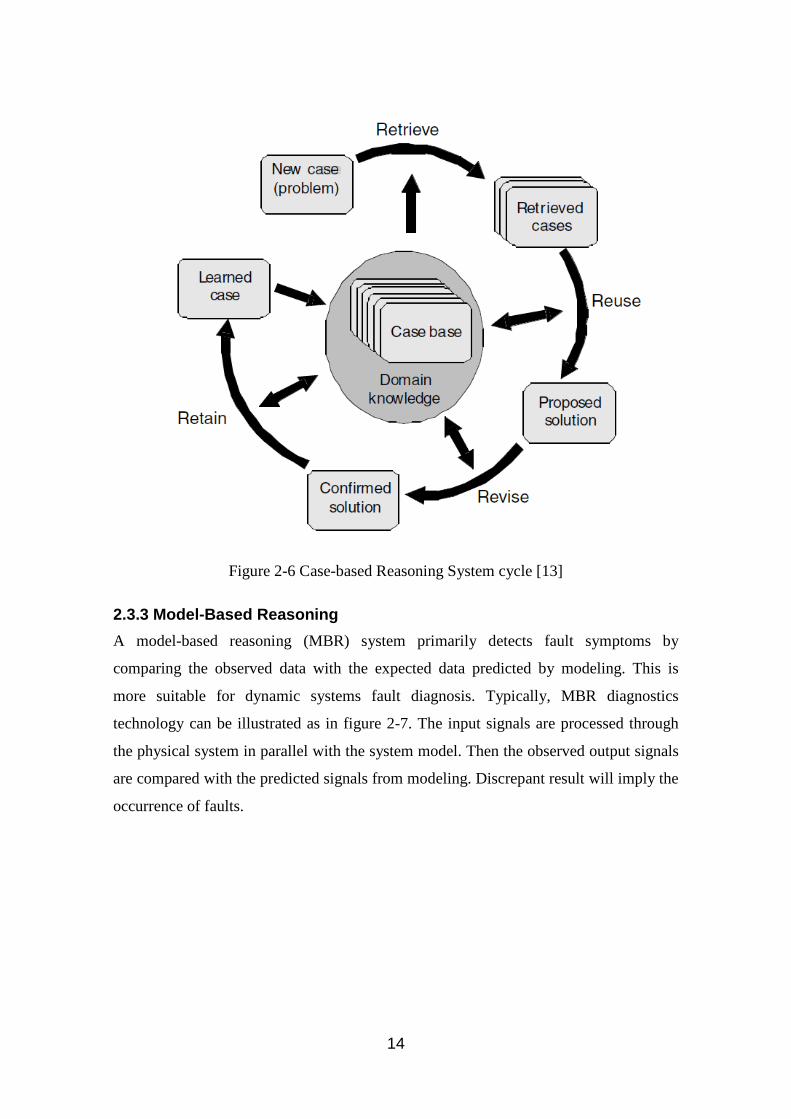
2.3.2 Case-Based Reasoning The reasoning engine of a case-based reasoning system (CBR) solves new problems by
reference to solutions used in previous problems [6]. Similarly to rule-based systems,
CBR utilize the experience of system behavior to build a case library. This method is
mainly used in cases where the problem areas are difficult to understand. A basic CBR
cycle is presented in the following chart, and the diagnostic process can be divided into
four steps:
Retrieve —— retrieve the best or the most similar past case for the new
problem.
Reuse —— attempt to solve the problem using the selected old case.
Revise —— modify the proposed solution if it cannot solve the new
problem.
Retain —— the modified solution will be incorporated into the case-base as
a new solution.
14
Figure 2-6 Case-based Reasoning System cycle [13]
2.3.3 Model-Based Reasoning A model-based reasoning (MBR) system primarily detects fault symptoms by
comparing the observed data with the expected data predicted by modeling. This is
more suitable for dynamic systems fault diagnosis. Typically, MBR diagnostics
technology can be illustrated as in figure 2-7. The input signals are processed through
the physical system in parallel with the system model. Then the observed output signals
are compared with the predicted signals from modeling. Discrepant result will imply the
occurrence of faults.

15
Figure 2-7 A Model-based Reasoning approach [6]
2.3.4 Learning Systems Learning systems can be data-driven diagnosis approaches, which are derived directly
from routinely system operational data. [12] In which, the characteristics of the
statistical data are assumed stably, except when an unanticipated failure occurs in the
system. The data-driven methods have ability to transform the high-dimensional noisy
data into lower-dimensional information when fault detection and diagnosis decisions
making. The main disadvantage of learning systems is that their efficacy and accuracy is
highly relays on the quantity and quality of monitored system operating data.
2.4 Classification of Prognostic Technologies Prognostics can be considered as diagnostic capabilities updates, which work to assess
the current health of the system and predict its remaining life by monitoring system
operating features or the results of diagnostics. Prognosis techniques are important for
improving safety, mission reliability and maintainability. Currently, there are many
prognostic techniques used in various industrial fields. Most prognostic methods fall
into the following three categories:
2.4.1 Model-based Prognostic The model-based prognosis techniques predict the condition of system health by
checking the observed signals of the real system against the simulation results of a

16
system model. In this case an accurate mathematical model is absolutely necessary. A
typical example of model-based prognostic approach is given in Figure 2-8.
These approaches have the advantage that they have the ability to incorporate physical
models into the remaining useful life (RUL) of system estimation even if there is a lack
of measurable events. The accuracy of prediction will accordingly increase as the
system degradation features understanding improves.
Figure 2-8 A typical example of Model-based prognostic approach [15]
2.4.2 Probability-based Prognostics Probability-based prognosis methods establish the change in parameters and the
probability of failure damage model through historical data, and then determine the
system health status and trend analysis by comparing the detected abnormal key
parameters with that of the current probability space of multi-parameter state .Compared
to the model-based methods which rely on mathematical equations, less information
required in probabilistic-based prognosis which is based on various probability density
functions (PDFs). Meanwhile, these PDFs are easily abstracted by statistics from
experimental or historical data. Figure 2-9 illustrates the schematic diagram of this
method.

17
Figure 2-9 Probability-based prognostic approach [16]
2.4.3 Data-driven Prediction Approach Data-driven methods are used in some situations where the prediction model is not
easily established through statistical data or it is too expensive to do so. In such cases, a
nonlinear network approach provided by Data-driven prognostic can produce the
required output data. Nonlinear networks mainly include the neural network and fuzzy-
logic systems.
Artificial neural network (ANN) is an interconnected group of nodes that maps complex
features or fault indicators to their respective fault modes [6]. This is an artificial
intelligence technology inspired by the function and structure of biological neural
networks [14]. ANN tools are usually applied in non-linear statistical data modeling as
they can model complex relationships between inputs and outputs.
A typical fault prognosis scheme by ANN is shown in Fig.2-10. Compared to single
direction or simple layer logical prognosis, ANN is better at multi input and output and
systems prognostics even those which have multi-directional feedback. Overall,
algorithms are used to determine how the function is organized in the system
programme. Meanwhile, artificial neural networks have the ability to become learning
systems which can be self taught by rule base or learned from input.

18
Figure 2-10 The ANN prognostic paradigm [6]
The main advantage of data driven approaches is that they can often be applied more
quickly and cheaply than other methods. The main disadvantage is that there are greater
demands of data training before employing a prognostics approach.
2.5 Summary A set of diagnostic methods and prognostic approaches has been described in the
previous section. Each method has its own advantages in some areas while having
drawbacks in other fields. For diagnostics, the advantages and disadvantages of each
method have been summarized as shown in table 2-2.
Table 2-2 Advantages and disadvantages of diagnostics methods [17]

19
For prognostic approaches, the range of system applicability and the cost of applying
different methods are illustrated in Figure 2-11. As the accuracy of the different
prognostics methods improves, the scope of application decreases and the costs increase.
Figure 2-11 Prognostic technical approaches [6]


21
3 Hydraulic Power System Functional and Failure Modes Analysis According to the research objectives, a hydraulic power system will be designed in
preliminary phase for the FW-11 aircraft which has been finished the conceptual design
in the GDP. All research in this thesis is based on this hydraulic system. In this chapter,
hydraulic power system architecture and functional description will be given firstly.
Then a set of safety analyses for this system will be performed in order to ascertain the
critical components and their associated parameters.
3.1 FW-11 Hydraulic Power System Design The FW-11 aircraft is a designed as a next generation new configuration airliner, with a
range of 7500nm and 250-seat capacity. The maximum take-off weight and range are
similar to the Airbus 330 and Boeing 767-200ER. To compete with those aircraft, the
FW-11 adopts a new configuration and new technology to make it more competitive. A
hydraulic power system is defined as a secondary power system, in which, pressurized
fluid is used to drive actuation mechanisms, thus providing a source of energy to the
user system. PHM technology application in the hydraulic system will provide better
maintainability and reduced operating costs.
3.1.1 Design Requirement The FW-11 is a twin-engine flying wing airliner which will be in service in the 2020s.
As an indication of future trends it can be seen that more-electric systems will be
applied on aircraft such as the B777 and A380. These requirements together with the
type of aircraft, determine the design of a hydraulic system. [25] The following three
aspects are considered for the design requirement in this phase:
a) Safety and reliability consideration
For safe flight, three channel subsystems ensure that the hydraulic system includes
sufficient redundancy. Meanwhile, the hydraulic power system design for FW-11 needs
to meet the airworthiness requirements of FAA, EASA and CAAC. [22][23][24]
b) Functional requirements

22
Hydraulic power is widely used for a variety of functions in most aircraft today, such as
flight controls, undercarriage operating mechanical, braking and gear steering
mechanisms. The control surface configuration of FW-11 is shown in Figure 4-1. As a
more-electric aircraft, the GDP work assumes that the flaps and wheel brake use electric
power. Electrical-Hydrostatic Actuators (EHAs) or the Electromechanical Actuators
(EMAs) are employed for flaps control. The conventional hydraulically actuated brake
system is replaced by an E-Brake Suite, which operates with electro-mechanically
actuated brakes and electronic motor actuation control units. [31]
Figure 3-1 FW-11 control surface
At present, the functions which need be powered by the hydraulic system are as follows:
Flight controls
Aileron
Split Drag Rudder
Elevator
Utility systems
Landing Gear
Nosewheel steering

23
Thrust Reversers
Cargo doors
c) Economical efficiency consideration
The FW-11design aims to provide enhanced economical efficiency in future civil
aircraft markets. Higher pressure can significantly reduce component-size which in turn
means significant weight saving.
3.1.2 Hydraulic System Architecture After comprehensive consideration, the hydraulic power system schematic is depicted in
Figure 3-2.
There are three independent sub-systems (LEFT, RIGHT and CENTRE) in the FW-11
aircraft hydraulic power system. The three systems operate continuously and power the
customs at a pressure of 5000 psi.
The LEFT or RIGHT system is pressurized by one Engine Driven Pump (EDP) and one
Electric Motor Pump (EMP). In the Centre system, two large power EMPs operate as
the main power resource instead of ADP used in previous planes. In an emergency
condition, a Ram Air Turbine (RAT) provides hydraulic power for Centre system
services.
The detail schematics for each sub-system is represented in Figure 3-3 and 3-4.
Table 3-1 expresses the main components of this hydraulic power system.

24
Figure 3-2 FW-11 Hydraulic System Functional Diagram

25
Figure 3-3 LEFT or RIGHT hydraulic power system schematic
M
M
L R Aileron
L R Split Rudder
L R OuterElevator
Thrust Reverser
T
Q
1
2
3 4
5 6
77
8
9 10
11
13
12
10
14
1516 17 18 191819
Pressure Line Rerurn Line Suction Line Charging Line

26
Figure 3-4 CENTRE hydraulic power system schematic
M
L R Aileron
L R Split Rudder
L R innerElevator
Nose Landing Gear & Steering
T
Q
14
6 6
77
8
9
13
12
10
14
16 171819
Pressure Line Rerurn Line Suction Line
M
4
Main Landing Gear
Cargo door
Charging Line
20
10
15 18 19
11
27
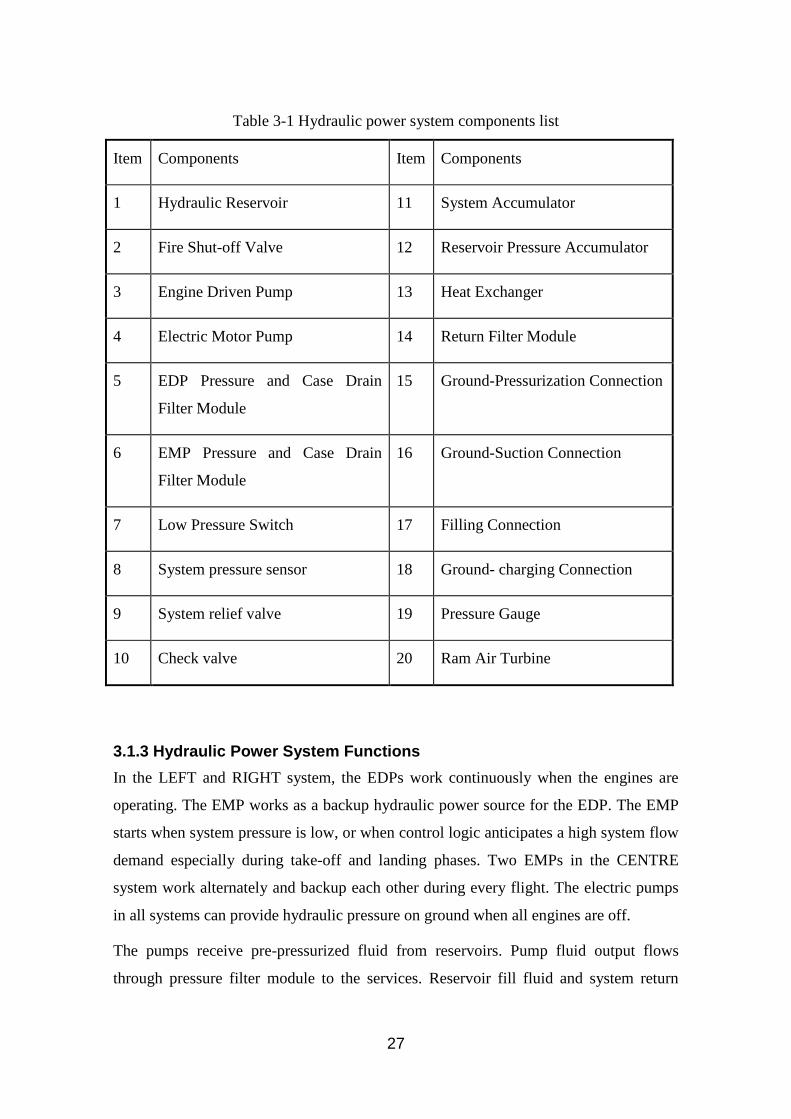
Table 3-1 Hydraulic power system components list
Item Components Item Components
1 Hydraulic Reservoir 11 System Accumulator
2 Fire Shut-off Valve 12 Reservoir Pressure Accumulator
3 Engine Driven Pump 13 Heat Exchanger
4 Electric Motor Pump 14 Return Filter Module
5 EDP Pressure and Case Drain
Filter Module
15 Ground-Pressurization Connection
6 EMP Pressure and Case Drain
Filter Module
16 Ground-Suction Connection
7 Low Pressure Switch 17 Filling Connection
8 System pressure sensor 18 Ground- charging Connection
9 System relief valve 19 Pressure Gauge
10 Check valve 20 Ram Air Turbine
3.1.3 Hydraulic Power System Functions In the LEFT and RIGHT system, the EDPs work continuously when the engines are
operating. The EMP works as a backup hydraulic power source for the EDP. The EMP
starts when system pressure is low, or when control logic anticipates a high system flow
demand especially during take-off and landing phases. Two EMPs in the CENTRE
system work alternately and backup each other during every flight. The electric pumps
in all systems can provide hydraulic pressure on ground when all engines are off.
The pumps receive pre-pressurized fluid from reservoirs. Pump fluid output flows
through pressure filter module to the services. Reservoir fill fluid and system return

28
fluid flow through the system return filter and then to the reservoir. Case drain fluid
flows to the case drain module, through the heat-exchanger to the system return filter
and then returns to the reservoir. A differential pressure indicator on either filter
indicates filter contamination.
Fuel-hydraulic heat exchangers are located in collector tanks for case drain fluid cooling.
A hydraulically pressurized reservoir is used in each system to store fluid, which can
maintain the pressure of pumps input flow at all altitudes. A temperature sensor and
reservoir low level sensor are also installed, and are located at the correct level to
provide a warning message.
A System Accumulator is placed in the pressure circuits of each system. This can
maintain the system pressure for a short period in the event of drops in the system
pressure caused by flow demands beyond maximum displacement. A Reservoir
Pressure Accumulator is placed in the reservoir pressure line to pressurize fluid in the
reservoir.
There is a Fire Shut-off Valve in the suction line of each EDP. Normally the valves are
open. Closing the fire shut-off valve prevents hydraulic fluid from flowing into the
pump and hence sustaining a fire.
A System Pressure Relief Valve will open in the event of an increase in system pressure
to a dangerously high level. Upon relief valve opening, fluid is ported to return line.
The RAT can be deployed automatically or manually in flight and must be retracted on
the ground.
Low pressure switches, located in each pump output line, provide low pressure signals
when relative pump output pressure is low. A System pressure transmitter sends the
combined pressure of the EDP and EMP to the related hydraulic power system
indication. All signals detected by sensors or probes are sent to a Hydraulic System
Management Unit (HSMU) which process signals and communicates the relevant
information through data bus.

29
3.2 Hydraulic Power System Functional Hazard Assessment
3.2.1 Introduction The following paragraphs give a Functional Hazard Assessment (FHA) for the
hydraulic power system architecture. The designed hydraulic power system is required
to provide hydraulic power to all system users during aircraft operation, and to meet
other design safety objectives compatible with the development of the aircraft level
requirements. The purpose of this part is to perform a systematic and comprehensive
examination of the function of the hydraulic power system, and to identify all the failure
conditions caused by malfunction, failure to operate, or as a normal response to any
unusual or abnormal external factor.
The FHA also provides a starting point for more in-depth Failure Modes, Effects and
Criticality Analysis (FMECA) and related analyses, which in turn provide the data on
fault symptoms needed to test the system. The FHA table is constructed according to
SAE ARP 4761[26].
3.2.2 Failure Condition Severity and Effect Classifications To measure the worst potential effect caused by product failures, the severity of every
potential failure mode shall be classified. The severity classification describes a
standard for the worst potential result from the product failure. Table 3-2 lists the failure
condition severity and qualitative effect classifications used in this thesis. A more user
friendly quantitative definition for failure condition severity is expressed in table 3-3.

30
Table 3-2 Failure Condition Severity and Effect Classifications [2]
Table 3-3 Overview of failure classification and safety objectives [25]

31
3.2.3 FHA Summary The detailed analysis of functional failure conditions, flight phases, effect of failure
condition and hazard class for the hydraulic power system is presented in Appendix B.
Because the catastrophic and hazardous events will greatly influence the flight safety
and system performance, the failure condition related to these two classes of severe
events shall be pointed out for the next step research purpose. The table below
summarizes the failure condition the severity of which is catastrophic or of hazardous
class.
Table 3-4 Hydraulic power System Severe Failure Condition Summary
Failure Condition Severity
Loss of all hydraulic power supply Catastrophic
Loss of low-pressure warning when LEFT, RIGHT and CENTRE hydraulic power subsystem failure Catastrophic
Loss of low-pressure warning when any two hydraulic power subsystem failure at take-off or landing Hazardous
Loss of ability to shut off EDP suction flow in case of fire Hazardous
From the above table, it can be seen clearly that “loss of all three hydraulic power
systems together” or “loss of ability to shut off EDP suction flow in case of fire” will
have a serious effect on aircraft safety. Therefore, the research work will pay particular
attention to analysing these failure conditions.
3.3 Hydraulic Power System FMECA
3.3.1 Introduction In the following sections, a Failure Mode, Effects and Criticality Analysis (FMECA)
will be presented for the hydraulic power system. FMECA is an important method of
system reliability analysis, and is also the basis of maintainability analysis, safety
analysis and testability analysis. It is an inductive analysis of all possible failure modes
of system, components, or functions and their possible effects, and determines the rank
of each failure mode according to the severity of effects on aircraft and the probability
of occurrence.

32
An FMECA is a systematic, bottom-up approach that traces the effects of crucial
component failures through the system. [26] Usually, the purposes of FMECA include
the following two elements:
a) Failure modes and effects analysis (FMEA)
It is used to identify all possible failure modes, causes and effects of the product, so as
to detect weaknesses of design cycle and take compensatory measures for design
improvements.
b) Criticality analysis (CA)
The CA is an extension or supplement of the FMEA and is based on the FMEA result.
In order to give a comprehensive evaluation of the effects in all possible failure modes,
each failure mode is classified based on the combined effect of severity and probability
of occurrence.
3.3.2 FMECA Approaches and Process FMECA analysis should be carried out simultaneously with system design. At the
conceptual design phase and the early stage of the preliminary design phase, analysis is
functional and FMECA mainly focuses on the composition of the system functions.
When it comes to the detailed design phase, a hardware or software FMECA should be
carried out based on each component in the system with several functions. In terms of
the FW-11 aircraft hydraulic power system, a combination of the functional and
hardware FMECA will be considered in this research.
Typically, a FMECA process can be described as the flowchart in Figure 3-5:

33
Figure 3-5 FMECA process
The FMECA process starts with system definition, which consists mainly of the system
function description and drawing a scheme diagram [27]. The system functions should
be identified for various mission phases simultaneously. Then each failure mode should
be analyzed based on the functional analysis in different operational modes. The failure
mode shall be presumed as the only failure in the complex system in each analysis
process. Failure cause analysis aims to identify the causes of each failure mode, which
will help in taking appropriate measures for design improvement. For each possible
failure mode, the effects on the system level and aircraft level need be analyzed. Failure
Severity classifications should be determined by the ultimate impact of each failure
mode.

34
Criticality Analysis (CA) aims to classify the combined effects according to the severity
and probability of occurrence for each failure mode, in order to give a comprehensive
evaluation of all the effects of possible failure modes. The CA normally has a
qualitative approach and a quantitative approach. The first is suitable in cases where
there is insufficient failure rate data while the quantitative approach is suitable where
failure rate data is available [28]. As the failure rate data cannot be acquired at the
conceptual design phase of the FW-11 aircraft, the qualitative approach is chosen in this
analysis.
Finally, a FMECA worksheet is completed and is the core of FMECA report. Typically,
a FMECA worksheet should include the following elements:
a) The identification and the function(s) of the components
b) A list of failure modes description of function or hardware
c) Failure effects on system level and aircraft level
e) Means available for failure detection
f) The flight phase when the failure occurs
g) Failure severity level
3.3.3 FMECA Summary The FMECA work should be continued during the whole aircraft design process and be
updated in different design phases repeatedly. A combination of the functional and
hardware FMECA analyzed in this research based on the preliminary architecture of the
FW-11 hydraulic power system. The result of the FMECA is given in Appendix C.
3.4 Hydraulic Power System Fault Tree Analysis
3.4.1 Introduction After the failure conditions are indentified in the FHA and FMECA, a Fault Tree
Analysis (FTA) is described for the hydraulic power system in this section. An FTA is a
deductive analysis which focuses on one particular undesirable event and provides a
method for determining causes of this event. It is a “top-down” evaluation process in
which an undesirable event is formed into a qualitative logical model. [26] All credible
35
failures in next level may cause the top level undesired event should be determined in
fault tree step by step.
In this research, each catastrophic and hazardous failure condition should be analyzed
by FTA based on the FHA and FMECA results.
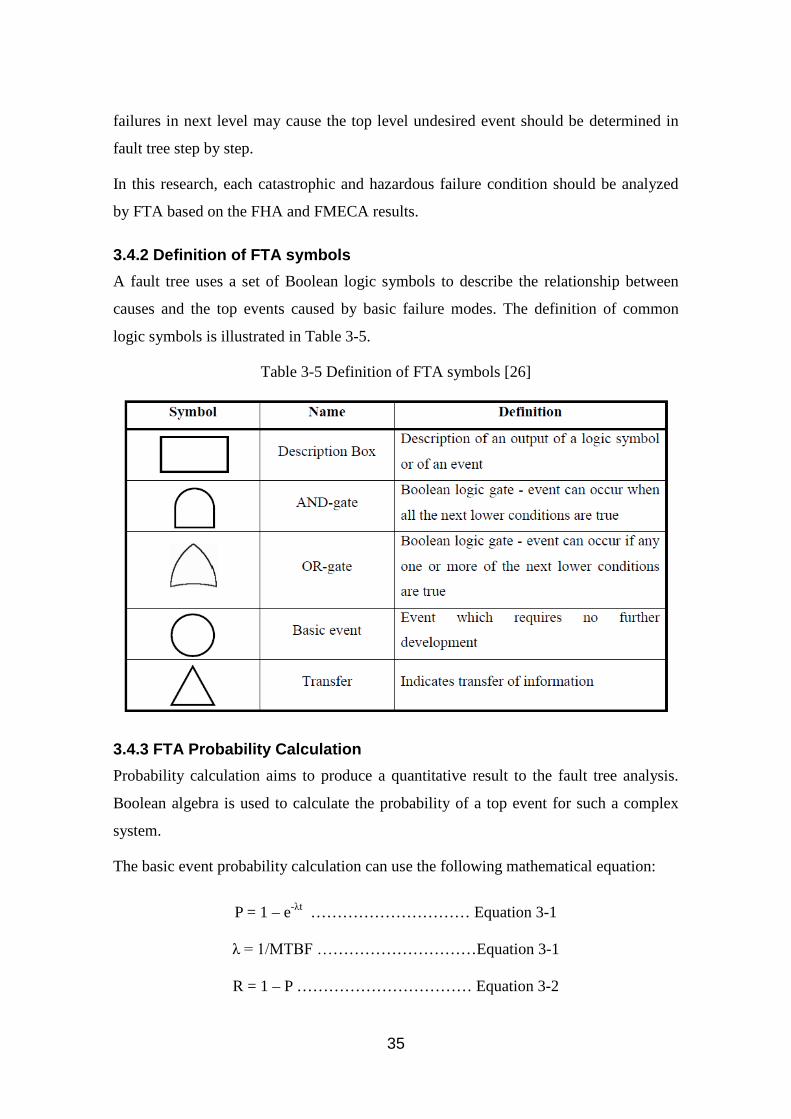
3.4.2 Definition of FTA symbols A fault tree uses a set of Boolean logic symbols to describe the relationship between
causes and the top events caused by basic failure modes. The definition of common
logic symbols is illustrated in Table 3-5.
Table 3-5 Definition of FTA symbols [26]
3.4.3 FTA Probability Calculation Probability calculation aims to produce a quantitative result to the fault tree analysis.
Boolean algebra is used to calculate the probability of a top event for such a complex
system.
The basic event probability calculation can use the following mathematical equation:
P = 1 – e-λt ………………………… Equation 3-1
λ = 1/MTBF …………………………Equation 3-1
R = 1 – P …………………………… Equation 3-2

36
Where P is the probability of failure, λ is the failure rate of the component associated
with statistical data, MTBF is the abbreviation of Mean Time between Failures and t is
the time interval, such as exposure time or miss time. R refers to probability. [29]
The output event probability of a gate is based on the probability of an input event. The
AND gate output is given by:
P(A and B) = P(A ∩ B) = P(A) P(B) …………Equation 3-4
An OR gate output event probability can be calculated as follow:
P(A or B) = P(A ∪ B ) = P(A ) + P(B ) ……… Equation 3-5
3.4.4 FTA Summary The detailed hydraulic power system fault tree architecture is presented in Appendix D.
The root causes of each catastrophic or hazardous failure condition are located at the
LRU level which is achieved the required diagnostic purpose. According to the FTA
results, it can be see that any catastrophic occurrence cannot be caused by a single
failure. Generally, the architecture of the hydraulic power system is reasonable in this
phase. However, the basic events failure rate cannot be obtained at this design phase.
The calculation will be updated when reasonable parameters can be obtained in detail
design for future work.
3.5 Summary In this chapter, a hydraulic power system is designed initially for the FW-11 aircraft as
the case of this research. Then the key parameters and crucial components are identified
from the analysis results of FHA, FMECA and FTA. Based on these analysis results, the
crucial components that may lead to catastrophic or hazardous failure are identified and
the key parameters and detection methods can be obtained. The detailed information is
shown in following tables:

37
Table 3-6 FHA, FMECA and FTA results
Failure condition Loss of all hydraulic power supply
Severity Related component Failure detect method
Catastrophic EMP, EDP, Reservoir, Relief Valve, Return filter, RAT,
Low pressure switch
System Pressure sensor
EPS information
Parameters pressure signal, Reservoir fluid quantity, electrical power signal, filter contamination indicator signal, temperature signal
Failure condition Loss of low-Pressure warning when LEFT, RIGHT and CENTRE hydraulic
power subsystems failure Severity Related component Failure detect method
Catastrophic Low pressure switch System Pressure sensor
HSMU
Parameters Low pressure switch test signal, System Pressure sensor test signal
Failure condition Loss of low-pressure warning when any two hydraulic power subsystems failure
at take-off or landing Severity Related component Failure detect method
Hazardous Low pressure switch System Pressure sensor HSMU
Parameters Low pressure switch test signal, System Pressure sensor test signal
Failure condition Loss of ability to shut off EDP suction flow in case of fire
Severity Related component Failure detect method
Hazardous Fire Shut-off Valve Low pressure switch Engine FEDAC EPS information
Parameters Valve status signal, EDP outlet pressure, electrical power signal


39
4 Diagnostics Research for a Hydraulic Power System The diagnostic approaches which are one of the main functions of DPHM techniques
will be discussed in this chapter. Based on the characteristics of different diagnosis
methods which have been introduced in the literature review chapter, Case-based
reasoning (CBR) is first selected for hydraulic power system diagnosis. Then a generic
CBR diagnosis process and structure are presented in depth. Based on the features of
hydraulic power system failures, suitable diagnosis architecture for the hydraulic power
system was built. Finally, a case study for a common failure mode is presented to
demonstrate how CBR diagnostic works.
4.1 Choice of Diagnostic Methods Rule-based expert systems diagnose faults by matching the observed symptoms to
failure hypotheses stored in a rule base. The rule-based method is widely used as it can
reduce the cost by increasing the availability and reusability of the expertise acquired,
its quick response and by increasing the reliability of decision making. However, it’s
difficult to completely translate domain knowledge into a large amount of terse rules for
a complex system. And there are challenges in managing a large rule base and
maintaining accuracy over the life cycle.
Model-based reasoning (MBR) systems detect fault symptoms by comparing the
observed data with the expected data as indicated by modelling. The MBR diagnostic
process heavily depends on the mathematical model of objective systems. The
efficiency and accuracy of this method is significant when used for a linear system
whereas for a complex system, building a comprehensive diagnosis model seems
impossible. There always lack of parameters for modelling at the beginning of system
design, so the MBR approach cannot be applied at the preliminary phase. In addition,
the cost of an MBR application is higher than that of other methods.
Learning systems have ability to detect faults and diagnose failure by identifying the
noise of monitored system operating data. However, the efficiency and accuracy are
highly relay on the quantity and quality of monitored data, which means the learning
systems require long term historical data record.

40
A case-based Reasoning (CBR) approach solves current problems by reference to
solutions applied to past problems. For an aircraft hydraulic power system, a great
amount of experiential failure data from historical maintenance information is available.
Of course, CBR is also deficient in the establishment of a complete case base while
compared to a rule-based system the case revision processes in CBR mean it has a
partial learning capability. Furthermore, it can work well in some problem areas which
are poorly understood.
In summary, for a comprehensive consideration, case-based Reasoning system is much
more suitable for an aircraft hydraulic power system PHM application. A detailed
research into the CBR diagnostic approach for a hydraulic power system will be
presented next.
4.2 Case-based Reasoning Approach
4.2.1 Introduction Case-based Reasoning diagnostics method solve new problems based on the experience
of previous cases, which resembles the human thinking process in solving a problem.
[34] When a problem occurs in real life, people always ask: “Have you seen this
problem before?” If a similar problem has occurred, then the previous solution for this
problem can be used to solve the new one. Even if this is a new problem, people always
try to find similar problems and where possible refer to their solutions. When it comes
to the engineering area, previous experience can be summarized as a failure case and
broken down into its three main component parts: the problem, symptoms and solutions.
Once similar failure symptoms are found in a case-library, reuse of the solutions for
those problems is suggested.
4.2.2 CBR Diagnosis Process The case-based reasoning diagnosis process can be organized in an information cycle,
and is usually represented as the “4Rs” mentioned before. (Aamodt & Plaza, 1994) A
CBR schematic illustrate the typical diagnosis process as shown in Figure 4-1.

41
Figure 4-1 CBR diagnosis cycle [6]
When failure occurs, the features of the fault are monitored and processed into a special
format which is defined as a new case. Then similar previous cases are retrieved from
the case-base by a pre-set similarity function. The solutions for this retrieved case are
reapplied to the new problem. Not all new cases can be completely solved by the
retrieved cases. Sometimes they must be adapted to the new conditions in the revision
stage of CBR. The solution for the adapted case will be evaluated by user feedback and
then this learned case will be retained in the case-base.
Compared to the other data-base method, CBR can be more accurate in identifying
similar problems. This means that even if the latest problem is not in the case-base
under similar circumstances, CBR can still provide useful information regarding
solutions. When this occurs, the solution can be adapted to new problems and added to
the case base. The case base will be improved continuously as time goes on by
acquiring input from more problems and solutions.
4.2.3 Constituent Elements of CBR In accordance with the description of CBR functions, the three elements forming the
core of CBR can be summarised as follows:

42
a) Case coding
b) Similarity metrics
c) Case adaptation
The detailed information of these constituent elements is described as follows:
Case coding
In a case-based reasoning system, the cases stored in the case library are the foundation
of a diagnostic engine. In order to improve the accuracy of similarity assessment in case
retrieval, it is essential to construct the case properly. Normally, a case must include the
problem and its solution. It should describe the failure information specifically and in an
easily indexed manner. The related condition and symptoms should be considered both
quantitatively and qualitatively in case coding. Figure 4-2 shows a simple case structure.
Figure 4-2 A simple case structure [35]
In this research, each case will be coded into the following form and stored in the case-
base.
(Case ID) (Components ID) (S1 M1)(S2 M2)... (Sn Mn) (w1,w2,...wn) (A1,A2,... An ) (Date)
Where the (Case ID) is the mark of the case in the case library, the (Components ID)
indicate the components which produce the fault, the (Date) records the time of case
storing, (S1 M1) (S2 M2) ... (Sn Mn) describe the features and measurements of related
failure symptoms , (w1,w2,...wn ) is the weighting assigned to the related symptom,
(A1,A2,... An ) describe what solutions are suggested.

43
Similarity metrics
Similarity metrics can be defined as the basis of a case-based diagnosis. To improve the
speed of Case Retrieval in the diagnosis process, all the measurements of hydraulic
system failure symptoms are encoded into the most simple words ——“ 0 ”and “1”
which represent the working status of the components. For example, (S1 1) for EMP
indicates that the pump is operating and (S1 0) indicates that the pump is off. (S2 1)
means that the EMP outlet pressure is low while (S2 0) means that the pressure is
normal.
Similarity assessment for a new case and existing cases stored in a case-base is a
significant challenge. Generally, a failure has various symptoms with corresponding
measurements. To measure the similarity between the old case and the new query case,
we use a simple function given in Equation 4-1 combined with weighting factor. [36]
S(N, O) = �wi ∙ simi(Sin, Sio)n
i=1
× 100% Equa. 4 − 1
Where Sin and Sio is the symptoms of the new case and the old case, wi is the weight of
symptom Si obtained from domain knowledge and will be updated when the case is
successfully reused, simi (Sin , Sio ) refers the similarity of symptoms between two cases.
If (Sin min) equal (Sio mio), simi (Sin , Sio ) =1, If (Sin min) not equal (Sio mio) or a symptom
is only found in one case, then we define simi (Sin , Sio ) =0.
A simplified illustration is given to show the similarity assessment as follows:
For a new case:
(Case n) (S1 1) (S2 1) (S3 0) (S4 1)
The following three old cases exist in the case library:
(Case 1) (S1 1 )(S2 1)(S3 0 )(S4 1)( S5 1) (w1=0.4,w2=0.2 w3=0.1,w4=0.2, w5=0.1 )
(Case 2) (S1 0 )(S2 1)(S3 0)(S4 1) (w1=0.4,w2=0.2 w3=0.3,w4=0.1)
(Case 3) (S1 1 )(S2 1)(S3 0)(S4 1) (w1=0.4,w2=0.2 w3=0.3,w4=0.1)
Using the metric introduced here, the similarities between the new case and the past
ones can be evaluated as follows:
Sim-value Case 1: (1*0.4 + 1*0.2 + 1*0.1 + 1*0.2+0*0.1) *100%= 90%

44
Sim-value Case 2: (0*0.4 + 1*0.2 + 1*0.3 + 1*0.1) *100%= 60%
Sim-value Case 3: (1*0.4 + 1*0.2 + 1*0.3 + 1*0.1) *100%= 100%
Based on the calculated similarity value, old case 3 is recommended as it is more
similar to the new case than the other two cases. The similarity assessment results seem
unreliable for the process looks very simple. However, the accuracy of CBR diagnosis
results depends on the number of symptoms and their weighting based on the historical
database and domain knowledge.
Case adaptation
Compared to other conventional diagnostics methods, CBR has the advantage of
solution adaptation capability. [6]This also presents a challenge. Once there are no old
cases in the case-base providing an exact match to a new query case, the solution
applied to the most similar case will be modified for the new situation. Usually some
intelligence-based tools, such as fuzzy logic, neural networks, etc., are used to devise
domain-specific modification rules. However, it is difficult to design modification rules
for a complex failure condition. When a modified case is created automatically, there is
a big risk in applying it to aircraft fault resolution without human intervention. Adaption
mechanism may be given an incorrect or invalid solution update. In this research, the
author tends to revise case by seeking expert advice for which would be more easily
achieved.
4.3 Design of CBR for a Hydraulic Power System Based on the function and the constituent elements of the CBR diagnostics method, a
CBR framework for systems is sketched for the hydraulic power system. Figure 4-3
illustrates the detailed diagnosis workflow.
As shown in the chart, a typical diagnostic process can be described as follows:
Step 1: System monitoring
The diagnosis process starts with real-time monitoring of the hydraulic system. All the
system operating conditions observed by sensors and relative signals are transferred into
the computer for signal diagnosis processing.
Step 2: Case Retrieval

45
When the abnormal signals are detected, a set of cases related to this fault symptom are
retrieved from the case library.
Monitorfailure feature
Retrieved cases solutions
Anyone Match exactly?
Proposed case
Suggestsolution
Updated case
Confirmedsolution
Modified case
Modified solution
successfulSolution?
New case Revisedsolution
Query case ?
Maintenance
Feedback
SimilarcaseSolution
Similarity metrics
indexCoding
rule
Y
N
Y
N
stop
start
Retain
Adaptation
1
2
3
4 5
6
Hydraulic power system
successfulSolution?
Newcase?
Expert assistance
Y
N
Case base
Figure 4-3 CBR Diagnostics workflow for hydraulic power system

46
Step 3: Similarity matching
Based on each retrieved case and coding rule, the failure features are coded into a query
case. Using similarity metrics, the similarity of cases is calculated and sequenced.
Step 4: Reuse case
If a case is matched exactly, then the corresponding solution will be recommended for
this situation. This case success rate will be updated after the maintenance feedback has
confirmed the outcome of applying this solution.
Step 5: Case adaption
If no exact match can be retrieved or if the maintenance feedback indicates that the
proposed case does not provide a solution to this problem, a new fault warning will be
issued and expert assistance sought. Simultaneously, the most similar cases with
solutions will be suggested to the adaption process in order to revise the solutions.
Step 6: Retain case
If the problem is successfully solved by the modified solution, then it will be retained as
a new case and saved in case-base. Otherwise if the solution fails, the case adaption
mechanism will seek expert help again.
4.4 Case study In this section, a case study based on an Electric Motor Pump is presented to validate
the CBR diagnosis approach discussed in the previous section. In this research, the
author focuses on system level diagnosis in which the failure symptoms detection is
based on functional and safety analysis. The LRU will be replaced after making the
diagnosis. It can be seen from the FHA and FMEAC analysis result that the EMP plays
an essential role in the FW-11hydraulic power system. Therefore, a failure mode of an
EMP is selected for the case study.
4.4.1 Introduction to EMP Four EMPs are employed in the FW-11 hydraulic power system, in which two large
power alternating current motor pumps (ACMP) work continuously in the CENTRE
subsystem at a pressure of 5000 pis. A typical external view of an electric motor pump
and an internal view of the pump are shown in Figure 4-4 and 4-5.

47
Figure 4-4 AC Motor pump [43]
Figure 4-5 Cross section view of piston pump [44]
The ACMP is a complex electromechanical product consisting of a variable delivery-
constant pressure piston pump and an alternating current motor. The pump is composed
of an inlet boost impeller, a revolving cylinder barrel containing several pistons,
bearings and a set of valves while the motor is also a complex piece of electro-

48
machinery. According to the statistics reported in previous publications, seal leakage,
bearing and piston wearing and motor failure are major causes of pump faults. [37]The
failure effects on the function of the pump are primarily a loss of output flow or
overheating.
4.4.2 Pump Failure Analysis and Detection Based on the failure modes effects analysis result, a summary of EMP failure modes is
shown in Table 4-1.
Table 4-1 Summary of FHA, FMEA
Failure modes Cause of failure Effects on system
Loss of output flow
Bearing or piston failures Motor failure to drive
Loss of relative subsystem EMP output flow
Internal leak Seal aging or degradation, Corrosion
Reduced relative EMP output flow
External leak Case crack, Seal failure
Loss of relative subsystem EMP output flow, reduce system fluid quantity
Pump Overheat Dry running, Wearing or abrasion Case drain port blockage
Seal failure and fluid leakage
Motor overheat Short-circuit, Defective motor winding
Loss of relative EMP output flow
Comments: The failure modes and causes are listed briefly for a system level
diagnosis consideration. The real causes of EMP failure at LRU level are actually
more complicated.
To detect these failure features, a set of sensors and probes are employed in system
monitoring.
However, pump failures cannot be determined simply by these sensor signal failures.
The operating conditions of other components and environmental conditions associated
with this pump should be considered in any CBR diagnosis. In addition, Fault Tree
Analysis may contribute to define these factors.

49
Table 4-2 Pump failure detection
Failure modes Detection Sensor designation
Loss of output flow
Pressure Flow rate
Low Pressure Switch in pressure outlet System Pressure Sensor
Internal leak Pressure Outlet flow rate
Low Pressure Switch in pressure outlet
External leak Reservoir fluid quantity Low Pressure Switch, Reservoir Low-level Sensor
Pump overheat Temperature Temperature Sensor in pump case port
Motor overheat Temperature Temperature Sensor in motor Current sensor
4.4.3 Diagnostic Process A pump failure mode “Loss of EMP1 output flow” is selected for CBR diagnosis
process. Using the fault tree analysis and system function, the symptom of “pump fails
to output” can be detected from the following signals: suction pressure of pump, outlet
pressure of pump, reservoir fluid quantity and EMP 1 Contactor Switch signal.
As shown in Figure 4-6,a case structure of this failure mode and the case-base index is
outlined. Table 4-3 lists the sensors and features that may appear in this diagnostic
process
The following diagnosis processes are based on the supposition that all of the sensors
work correctly and the signals acquired from the data bus reflect the actual status.
a) When EMP1 fails to output, an abnormal pressure signal in the EMP1 outlet is
detected by the EMP1 Low Pressure Switch. The feature signal of “pressure is low”
is converted into case form— “(F019, 1)” in the diagnosis processor.
b) A set of cases with the appropriate symptoms are retrieved from the case-base as
shown in Figure 4-6.

50
Figure 4-6 Examples of case-base and the EMP failure Case-structure
Table 4-3 Sensors and features look up table
Feature ID Name Measurements
Description
F001 EMP 1 Contactor Switch signal Switch ON=1,
Switch OFF=0
F002 EMP 2 Contactor Switch signal Switch ON=1,
Switch OFF=0
… … …
F005 LEFT Reservoir Low-level Sensor <15%=1,>15%=0
F006 CENTRE Reservoir Low-level Sensor <15%=1,>15%=0
F007 RIGHT Reservoir Low-level Sensor <15%=1,>15%=0
F008 LEFT Reservoir Pressure Sensor <400 psi=1,>400psi%=0
… … …
F011 Temperature sensor in EMP1 Motor Overheat =1,
Normal =0,
F013 Temperature sensor in EMP1 case drain port
Overheat =1,
Normal =0,

51
Feature ID Name Measurements
Description
… … …
F018 EDP1 Low Pressure Switch Low Pressure =1, Normal =0,
F019 EMP1 Low Pressure Switch Low Pressure =1, Normal =0,
… … …
c) Using the coding rule mentioned previously, the query case is coded and compared
in turn with each retrieved case. An example of similarity assessment is given
below:
--------------------------------------------------------------------------------------------------
The retrieved case C1031 is stored in the case-base as follows:
(C1031) (F001, 1) (F008, 0) (F008, 0) (F019, 1) (0.2, 0.3, 0.1, 0.4)
This indicates that the electric power for EMP1 is normal, the fluid quantity is
not low, the pressure of pump input flow is normal and the pressure of pump
outlet flow is low.
The corresponding query case coding is as follow:
(Case q1) (F001, 1) (F008, 0) (F008, 0) (F019, 1)
Running the similarity assessment:
Sim-value=(1*0.2 + 1*0.3 + 1*0.1 + 1*0.4) *100%= 100%
--------------------------------------------------------------------------------------------------
d) The result means that case C1031 closely matches the query case, so solution of
C1031 is recommended as the proposed solution.
e) Receive the maintenance feedback. If the problem is solved successfully, case
C1031 is confirmed and the success rate will be updated in the case-base.
4.5 Summary and Discussion In this paper, a diagnostics approach for a hydraulic power system is developed, using
the case-based reasoning method. The constituent elements of CBR are discussed

52
specifically and a diagnosis workflow is developed for the hydraulic power system. An
EMP failure mode was chosen as a case study to demonstrate the diagnosis process in
detail. Using the CBR method, the cause of failure is diagnosed by matching the
detected symptoms with past cases. Appropriate solutions are recommended to solve the
new problem. It can be seen that learning capability is a very important feature of CBR.
With the case base being updated, the accuracy and confidence of diagnosis will
gradually increase.

53
5 Prognostic Research for Hydraulic Power System In this chapter, the author intends to apply prognosis approaches to the hydraulic power
system. Firstly, a comparison and discussion of three commonly used prognostic
methods are presented. Then the suitable approaches are recommended for the hydraulic
system components based on their failure characteristics analysis. Finally, a discussion
of the case study is given briefly due to limited time.
5.1 Prognostics Methods Investigation Knowing how to detect the failure symptoms accurately at a very early stage so as to
predict the remaining useful life of systems or components is a great challenge to the
PHM system designer. Therefore, some people refer to prognostic as the Achilles’ heel
of the PHM system. [6] The following figure illustrates the main goal of the prognosis
as well as the difference between it and the diagnosis already discussed.
Figure 5-1 Failure Progression Timeline [38]
In accordance with different condition and failure features, varied prognosis approaches
are suitable for different products and situations. Three prognostic methods widely used
for aircraft systems will be presented in turn as follows.

54
Model-based approaches employ a dynamic model of an objective system or component,
to predict the RUL by checking the simulation results against the observed real output
data. It is a very popular prognosis method due to its higher prediction accuracy in
recent years, especially for linear systems. An accurate mathematical model is required
for a model-based prognostic application. Simultaneously, lots of sensors need to be
used to monitor the corresponding input and output data. Therefore, the cost of model-
based prognosis for a complex system is a restriction also.
Probability-based approaches are widely used in such a situation: there is less detailed
information of system to build mathematical model but lots of historical statistical data
from previous failures. It is a basic prognosis method which can give confidence
boundaries regarding the prediction results. Normally, the cost is the lowest compared
to other methods. However, the precision and accuracy of the prognosis need be
improved. A statistical reliability and usage-based approach are usually employed to
predict the RUL of these components which have lower failure rates and fewer sensed
parameters associated with them.
Data-driven prediction methods are used when a dynamic system model is not easily
established because of the many signals which may indicate the failure. In such instance,
Data-driven approaches are employed to form special algorithms which can provide the
relationship between the desired output and multi-inputs. One of the most popular Data-
driven prognostics is artificial neural networks (ANN) which has been introduced in
chapter 2. Compared to the above two methods, this approach uses the available data
most efficiently to obtain fault prediction as well as the related confidence limits.[6]
As shown in the above discussion of the characteristics of different prognostic
approaches, choosing the appropriate methods needs a comprehensive consideration of
system features and costs. An example of the application of these methods in a gas
turbine performance prognosis is illustrated in Figure 5-2. It can be seen that no one
prognostic method can be used for all systems or components. Different choices of
prognosis approach are selected for the different monitored elements based on their
features.

55
Figure 5-2 Prognosis Approaches Application [2]
5.2 Prognostic Application for Hydraulic Power system Based on the characteristics and cost considerations, these prognosis approaches are
suitable for different types of components. Hydraulic power systems consist of different
types of components, such as pumps, valves, filters and sensors. As for most valves and
accumulators, they are totally mechanical products and no signals can reflect their state
of health directly. Simultaneously, these components always provide higher reliability,
the Probability-based approach based on historical data or maintenance experience is an
appropriate prognostic method in these cases.
Though the contamination of a filter module can be detected by differential pressure
indicators, the other failure modes are not easily found. A Probability-based approach is
suitable for them as well.
In addition, in the case of other mechanical components, such as pumps, fire shut-off
valves and Heat Exchanger, lots of sensors can be used to monitor their operational
performances for they are critical elements of the system. So a fusion Model-based and
Data-driven prognostic approach is a desirable choice for them.

56
With regard to the electronic components, one of the data-driven methods, ANN is a
reasonable approach because of the difficulty in modelling these components. In
conclusion, the hydraulic power system prognostic approaches are summarized as
follow:
Table 5-1 Hydraulic power system prognostic methods
Components Type Detection methods Prognostic approach
System relief valve, System Accumulator, Reservoir Pressure Accumulator, Ground-Pressurization Connection, Ground-Suction Connection, Filling Connection, Ground- charging Connection, Reservoir, Pressure Gauge, Auto Bleed Valve
Mechanical None Probability-based approach
EDP Pressure and Case Drain Filter Module, EMP Pressure and Case Drain Filter Module, Return Filter Module,
Mechanical Filter differential pressure indicator
Probability-based approach
Heat Exchanger, Engine driven pump, Ram Air Turbine
Mechanical Low Pressure Switch, System Pressure Sensor, Temperature Sensor,
Fusion prognostic with Model-based & Data-driven
Electric Motor Pump, Fire Shut-off Valve
Electromechanical
Low Pressure Switch, System Pressure Sensor, Temperature Sensor, HSMU
Fusion prognostic with Model-based & Data-driven
Low Pressure Switch, System Pressure Sensor, Reservoir Temperature Sensor, Reservoir low level sensor
Electronic HSMU ANN
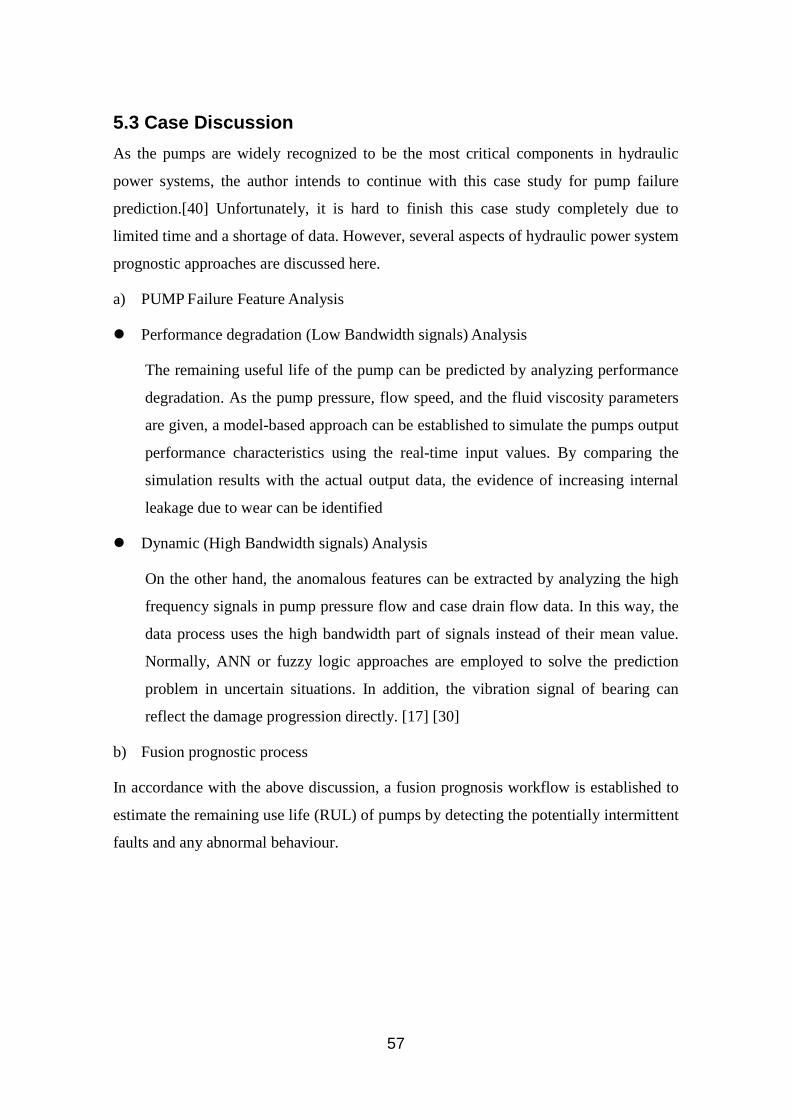
57
5.3 Case Discussion As the pumps are widely recognized to be the most critical components in hydraulic
power systems, the author intends to continue with this case study for pump failure
prediction.[40] Unfortunately, it is hard to finish this case study completely due to
limited time and a shortage of data. However, several aspects of hydraulic power system
prognostic approaches are discussed here.
a) PUMP Failure Feature Analysis
Performance degradation (Low Bandwidth signals) Analysis
The remaining useful life of the pump can be predicted by analyzing performance
degradation. As the pump pressure, flow speed, and the fluid viscosity parameters
are given, a model-based approach can be established to simulate the pumps output
performance characteristics using the real-time input values. By comparing the
simulation results with the actual output data, the evidence of increasing internal
leakage due to wear can be identified
Dynamic (High Bandwidth signals) Analysis
On the other hand, the anomalous features can be extracted by analyzing the high
frequency signals in pump pressure flow and case drain flow data. In this way, the
data process uses the high bandwidth part of signals instead of their mean value.
Normally, ANN or fuzzy logic approaches are employed to solve the prediction
problem in uncertain situations. In addition, the vibration signal of bearing can
reflect the damage progression directly. [17] [30]
b) Fusion prognostic process
In accordance with the above discussion, a fusion prognosis workflow is established to
estimate the remaining use life (RUL) of pumps by detecting the potentially intermittent
faults and any abnormal behaviour.

58
Real-time Monitoring
Remaining life acceptable?
Failure prediction
Remaining use life estimation
model-based
Continue monitoringHealth baseline
N
stop
start
Hydraulic power system
Abnormal?
Data- driven(ANN, Fuzzy
logic)
Y
N
Data isolationproccessing
Maintenance arrangement
Y
Data base standards
specifications
Figure 5-3 A fusion prognosis workflow for pumps

59
As shown in figure 5-3, the prognosis process begins with the system real-time
monitoring which is the same as the diagnosis process. Simultaneously, a health
baseline to identify the input healthy status of components or systems must first be
determined. The baseline can be a composed of the various operating conditions
collected from the system when performing normally or the threshold value from the
standards and specifications. By comparing the monitored states signals with the
baseline parameters, the anomalous signals will be isolated and processed as the input
of the model-based prognosis engine and the data-driven prognosis engine. As discussed
before, the pumps’ operating signals can be the mean value or high-band frequency
waves acquired by dynamic analysis. Through system performance modeling, the
potential failure can be detected beforehand by RUL prediction. The unhealthy
conditions estimated from model-based approach can be used as a part of data-driven
input. Finally, the combined information from the model-based approach and data-
driven approach prognosis results can provide a reasonable RUL assessment.
c) New sensing technologies
For failure prognostic approaches, it is very important to choose appropriate sensors for
system monitoring. The traditional detectors used in a diagnosis process cannot meet the
accuracy requirements of failure prediction. Some new sensing technologies have been
developed for on-line system monitoring, such as Fluid Property Sensors
(MEASUREMENTS SPECIALTLIES TM) and Ferrous Wear Debris Sensor (Kittiwake
Developments). [41][42]
Fluid Property Sensors
Fluid Property Sensors can measure the viscosity, density, dielectric constant, and
temperature of fluids directly and simultaneously, and are especially suitable for
pumps fluids properties analysis using model-based approaches. Using of this type
sensor, the sensing components of system can be reduced which means of the
reduction of failure mode. Figure 5-4 shows the FPS2800B12C4 Fluid Property
Sensors.

60
Figure 5-4 Fluid Property Sensors [41]
On-Line Wear Debris Sensor
This type of sensor can be used to analyse contamination of the pumps’ case drain
fluid in real time. Ferrographic or spectroscopic analysis methods are employed in
this technology to analyze particle size and materials, which can reflect the wear
condition of the internal components of pumps. By combining these sensing results
and the pump operating conditions, the pump’s remaining use life can be predicted.
The following figure illustrates a ferrous wear debris sensor mounted on a system
pipeline.
Figure 5-5 Ferrous wear debris sensor [42]

61
5.4 Summary Prognostic technology has been employed in various industrial fields and plays a very
important role in PHM systems. In this chapter, three main prognosis methods and their
characteristics were first discussed. Based on the hydraulic power system design
features and different types of component failure analysis, an appropriate prognosis
approach was selected for each component. In addition, the pump’s RUL prediction
methods and sensing techniques were discussed and used as a case study. Although
prognostic methods have been developed for many years and widely applied in different
fields, there still remain, due to their uncertainty and complexity, great challenges in
applying it to an on-board PHM system. As mentioned before, it is difficult to complete
detailed prognosis research for an aircraft hydraulic system in the short term. However,
the basic objective was achieved as described in the above analysis and discussion.


63
6 Hydraulic Power System DPHM Architecture In this chapter, based on the above diagnostics and prognostics technology, an
integrated DPHM architecture is established for the hydraulic power system. The main
functions and the operating process will be discussed, along with the interface between
the hydraulic power system DPHM and the aircraft level Integrated Vehicle Health
Management (IVHM) system.
6.1 Hydraulic Power System DPHM Framework Normally, DPHM systems are highly integrated, incorporating advanced sensors, a host
of diagnostics and prognostic processing modules, related software and hardware
technologies, human-machine interaction interface, and off-board maintenance and
management support systems [32]. That is to say, the DPHM systems do not just consist
of the application of diagnostics and prognostic, but also include the interface to crew
and maintenance operators. Based on the diagnostics and prognostics approaches
previously discussed, an integrated DPHM system framework is developed for the FW-
11 hydraulic power system.
As shown in Figure 6-1, hydraulic power system DPHM can be a part of the aircraft
level health management system — IVHM. The IVHM may also include other health
management applications on airframe structure or systems, such as avionics, fuel
systems, electrical systems and flight control systems etc. Accordingly, the on-board
DPHM of the hydraulic power system communicates with the flight crew and the off-
board maintenance system simultaneously via the aircraft IVHM manager.
The on-board DPHM system includes the following elements. A set of sensors and
probers are employed to monitor the hydraulic power system operating conditions. A
diagnostics and prognostic module works to carry out the system healthy status. A data
base is used to stow all the required data and information relevant to the diagnostics and
prognostic process. In addition, an interface device is needed to connect the avionic
equipment with system managers. It should be noted that, it is impossible to monitor the
health condition of each component in a hydraulic power system, for which may
increase the failure probability and the cost. Simultaneously, some complex components
integrated with sensors can provide monitoring interface directly to the DPPM system.

64
Figure 6-1 FW-11 Hydraulic Power System DPHM Framework
The off-board system mainly consists of ground-maintenance management system,
maintenance supports team and the spare parts warehouse. In proportion to the on-board
system database, a database also exists in the ground maintenance management system.
Both the vehicle health state and maintenance feedback information will be updated
continuously.

65
6.2 Functional Classification of DPHM As with the DPHM system framework described above, the hydraulic power system
DPHM consists primarily of the on-board system and off-board system. Their
respective operational functions are listed as follows:
a) On-board DPHM system:
System real-time monitoring;
Data capture, process, retention and transmission;
Fault diagnosis and prognosis;
Warning faults and forecasting incipient failure;
Recommending solutions;
In-flight communication with aircraft level IVHM.
b) Off-board DPHM system:
Communication with aircraft level IVHM;
System health state analysis and recording;
Ground maintenance arrangement and action;
Expert technical assistance;
Spare parts storehouse management;
Maintenance feedback and database update.
6.3 Operating Process of DPHM The hydraulic power system DPHM works when the system starts operating. The
system and components operating conditions are monitored by sensors. The
performance parameters will be pre-processed before being transferred into a
Diagnosis/Prognosis module. Simultaneously, other systems or environment
information can be acquired from the data bus.
Based on this monitored data and related information, the system health condition will
be determined by means of the diagnosis/prognosis reasoning engine. When abnormal
signals are detected, the CBR diagnosis programme works out the root cause of the

66
failure and recommends the solutions. On the other hand, the prognosis programme
provides the capability to identify potential issues before they become critical. The on-
board database furnishes data and recommends solutions in real time.
At the same time, the hydraulic power system failure warning and display signals are
transferred to avionics via aircraft level IVHM which also takes responsibility for
remote communicating with ground base.
When the off-board system receives the system health status data in real-time, it will run
certain programmes to check and confirm the failure conditions. If a failure and solution
are clear, the ground maintenance arrangement and action will be implemented. If the
failure condition is brand new or complex enough that cannot be solved automatically
by the diagnostic engine, ground technical assistance might be furnished.
Simultaneously, feedback of the successful solution and case should be provided to
update the database. The warehouse system manages the supply chain of spare parts in
accordance with the condition-based maintenance schedule.
6.4 Benefits and Challenges of DPHM Application With the application of DPHM technology to the aircraft hydraulic power system,
system health information will be collected and processed throughout every phase of
operation. From pre-flight, in-flight and post-flight activities, appropriate actions can be
taken as DPHM enables flight crew and ground serviceman to make informed decisions.
To sum up, the following aspects are the main benefits of the DPHM application.
Safety and mission reliability improvement
The hydraulic power system supplies the power to flight-control surfaces and
landing gear actuators, which directly affect flight safety. DPHM, applied in the
hydraulic power system, enables the crew to take corrective actions quickly, which
may result in more rapid fault identification response. That is to say, the DPHM
system can provide more accurate awareness to crew or operator, which in turn
means that aircraft safety can be significantly improved. The mission reliability can
also be increased due to more effective condition-based maintenance.
Cost reduction

67
DPHM applied in aircraft system design will result in a significant decrease in life-
cycle cost. Firstly, the processing and operational manpower requirement will be
reduced due to more intelligence in DPHM to help in diagnosis/prognosis failure
and maintenance action. Secondly, less actual maintenance will be carried out due
to the prognostic and diagnostic capability. This predictive maintenance will result
in a reduction in both maintenance frequency and turnaround time. A collateral
benefit is that the cost of spare components will decrease due to fewer maintenance
actions.
However, the efficiency of the DPHM system depends mainly on the accuracy of
diagnosis and prognosis results which are related to the acquisition of signal, signal
processing and the diagnosis /prognosis engine. Although the above section describes
several benefits, there are challenges still remaining to develop more reliable and more
effective DPHM systems:
Sensing and signal processing techniques
With the development of hydraulic system technology, sensing and signal
processing techniques, there is, due to system complexity and the level of
integration, a requirement for greater accuracy and intelligence capability.
Although the development of sensor technology can provides adequate information
on sensing mechanical performance and structural health conditions, there still a
lack of enough effective means for self-health diagnosis of sensors or electronic
components by means of in-situ monitoring. In addition, higher pressure and
temperature operating conditions pose a challenge for the reliability of sensors.
Accuracy of diagnosis /prognosis engine
The CBR diagnosis approach and fusion prognosis approaches are employed in
hydraulic power system DPHM. It is sufficiently accurate and efficient to deal with
common failures. But for a complex system, completing the case base so as to
improve CBR diagnosis confidence is a significant challenge. Simultaneously, the
precision prediction model and algorithm affect the accuracy of prognosis results
directly. Currently, the higher cost of hardware and software is a barrier to
achieving a more accurate diagnosis/prognosis capability.

68
6.5 Summary The DPHM system employs on-board and remote resources, both hardware and
software, to monitor, capture, and analyze system health conditions. Based on the above
diagnostics and prognostics research, the hydraulic power system DPHM architecture is
established which contains all primary elements of a health management system. The
functions and operational process are described specifically. Finally, the benefits and
challenges of the DPHM application are discussed briefly. In relation to the aircraft
hydraulic power system, system design with DPHM technology will greatly increase
flight safety and mission reliability.
69
7 Conclusions and Further Work
7.1 Conclusions The objective of this research was to develop a diagnostics, prognostic and health
management approach to a flying wing aircraft hydraulic power system as an extension
of the Group Design Project (GDP). Aircraft systems with DPHM technology will
improve system safety, mission reliability and reduce life-cycle costs efficiently, which
will enable the new airliner — FW-11 designed in the GDP to be more competitive in a
future aviation market. The detailed GDP task and the author’s contributions are
presented in Appendix A.
In this research, a literature review of health management technology was given at first.
By means of this review, the history and status of DPHM technology and the main
functions were studied. Simultaneously, the various diagnostics and prognostic methods
were presented and analyzed to achieve the objectives of this research.
In accordance with the research objectives, a hydraulic power system was established
for the FW-11 aircraft. All research works in this thesis were based on this hydraulic
system. The hydraulic power system was designed to provide a source of energy to
primary flight controls, landing gear and other utility services. In this, three subsystems
operate continuously to supply high pressurized fluid to users so as to maintain aircraft
safety with redundancy design. Meanwhile, it must meet the airworthiness regulation
requirements of FAA, EASA, and CAAC. The main components and structure were
illustrated in a schematic diagram of each subsystem. The operational functions of the
system were also represented.
Depending on the functional description of the hydraulic power system, a set of safety
assessment approaches were employed to analyse the failure conditions of the system.
Functional hazard Assessment (FHA) was conducted for the whole system to identify
all function failure conditions and associated severity levels. The results show that “loss
of all three hydraulic power systems together” or “loss of ability to shut off EDP suction
flow in case of fire” will have a serious effect on aircraft safety. The failure modes
effect and criticality analysis (FMECA) was performed for each component of the
hydraulic power system to identify the critical components and their potential failure
modes. Fault Tree Analysis (FTA) for the selected failure modes which have higher

70
hazard levels was carried out in order to determine the root cause and the probabilities
of failure. Finally, the crucial components that may lead to catastrophic or hazardous
failure were summarized and the key parameters and detection methods were identified.
Based on the failure features from the analyses results, a comparison of different
diagnostic methods was performed. After that, a case-based reasoning diagnostic
approach was chosen for the hydraulic power system. The author researched the coding
mechanism and similarity metrics of CBR specifically and designed a diagnosis
workflow accordingly. Using the CBR method, the cause of failure was diagnosed by
matching the detected symptoms with past cases. Appropriate solutions were
recommended to solve the new problem. With the case-base being updated continuously,
the accuracy and confidence of diagnosis will gradually increase. The electric motor
pump was chosen as a case study to demonstrate the diagnosis process in detail, which
showed that the CBR is a reasonable solution for hydraulic power system diagnosis.
Three main prognosis methods and their characteristics were first discussed. Based on
the hydraulic power system design features and different types of component failure
analysis, the appropriate prognosis approach was selected for each component. In
addition, the pump’s RUL prediction methods and related sensing techniques were
discussed as a case study. A fusion prognosis approach was discussed to carry out the
hydraulic power system prognostics practically and efficiently.
Finally the hydraulic power system DPHM architecture was developed. This consisted
of the integration of the above diagnostics and prognostics research and the interface
between the hydraulic power system DPHM and the aircraft level IVHM. The accuracy
and cost of DPHM application was considered and discussed.
To sum up, this research completely developed an integrated DPHM system for the
FW-11 aircraft hydraulic power system. Appropriate diagnosis/prognosis methods were
used to identify faults/potential failure quickly and accurately. Aircraft safety was
improved significantly due to the crew having accurate information to enable them to
take appropriate corrective action. With the capability of remote signal transmission,
system operating status was transmitted from the onboard to ground base in real-time,
the maintenance philosophy was changed from the “On failure or per schedule” to “on

71
condition”. The aircraft mission reliability improved and the life-cycle cost decreased.
In general, the research objectives were achieved.
7.2 Future Work As a new and progressive technology, DPHM was applied in various industrial fields
gradually. The related research works can be broad concepts which cover various
aspects and different levels. It is impossible to complete a comprehensive study on
hydraulic system from top level to a detailed level in a short time. There are several
issues which will be studied in future research:
The diagnostics and prognostic research in this thesis focused on the system level
application. The system failure mode analysis and detection were only concerned with
LRU level in this design phase. In order to improve the accuracy of diagnosis and
prognosis results, the detailed failure modes of hydraulic components and advance
sensing techniques should be researched in-depth.
Furthermore, the prognosis approach mainly focused on the feature research and
recommendation of different methods. Due to limited time and a shortage of data it just
comprised a qualitative analysis. With the development of more detailed design, a
mathematical model could be established for critical components. The actual calculation
and analysis should be conducted to demonstrate the remaining useful life prediction
method.
Lastly, the evaluation of the DPHM application was also given briefly and qualitatively.
Uncertainty is actually a critical element of the diagnosis and prognosis approaches. The
quantitative assessment and validation methods should be studied further. Meanwhile,
the cost analysis of DPHM system will also pose a challenge. Although we predict that
the maintenance cost of aircraft will be saved by using of DPHM technology, the net
cost benefit may not actually be easily achieved. A quantitative estimation should take
the cost of the DPHM system installation and operation into consideration in future
work.


73
REFERENCES [1] Industry Canada
Aircraft Systems Diagnostics, Prognostics and Health Management Technology
Insight Document (Version 0.2)
Industry Canada, December 16, 2004
http://www.dphm-canada.org/english/view.asp?x=17
[2] Niu Liang
Aircraft Fuel System Prognostics and Health Management
MSc Thesis, Department of Aircraft Design, College of Aeronautics, Cranfield Institute
of Technology, Academic Year: 2008-2009
[3] Hanlon E.
The New-technology Boeing 787 Dream liner [J]
Aviation Week & Space Technology Market Supplement, 2005, 18(4):15-19.
[4] Robert W M.
High Pressure Hydraulics for the A380 [J]
Overhaul& Maintenance, 2005, 18(6):43-45.
[5] AVIC Group (2011) AVIC MSc Programme
FW-11 Aircraft Conceptual Design, (Unpublished executive summary)
Cranfield University,Bedford shire, UK.
[6] G. Vachtsevanos, F. Lewis, M. Roemer A. Hess and B. Wu
Intelligent Fault Diagnosis and Prognosis for Engineering Systems.
John Wiley & Sons, Inc. 2006
[7]Stephen B. Johnson
Introduction to System Health Engineering and Management in Aerospace
1st Integrated Systems Health Engineering and Management Forum

74
Napa, CA. November 2005
[8] Brown, McCollom, Moore and Hess
Prognostics and Heath Management, A Data Driven Approach to Supporting the F-35
Lightning II
IEEE Paper
[9] Ashok N. Srivastava, Robert W. Mah, Claudia Meyer
Integrated Vehicle Health Management
“Automated detection, diagnosis, prognosis to enable mitigation of adverse
events during flight.” (Version 2.01)
NASA, Aeronautics Research Mission Directorate
Aviation Safety Program, August 14 2008
http://www.aeronautics.nasa.gov/nra_pdf/ivhm_tech_plan_c1.pdf
[10] John W. Sheppard, Mark A. Kaufman, Timothy J. Wilmering
IEEE Standards for Prognostics and Health Management
Aerospace and Electronic Systems Magazine, IEEE ,Volume: 24 , Issue: 9 2008
[11] Bridgman, M.S.;
Relating failure prognostics to system benefits
Aerospace Conference Proceedings, 2002. IEEE,Volume 7.
[12] Ann Patterson-Hine, Gordon Aaseng, Gautam Biswas and Sriram Narasimhan
A Review of Diagnostic Techniques for ISHM Applications
NASA (2005), USA.
[13]A. Aamodt and E. Plaza,
Case-Based Reasoning: Foundational Issues, Methodological Variations, and System
Approaches
AI-Communications 7(i):39–59, 1994.

75
[14] http://en.wikipedia.org/wiki/Artificial_neural_network
[15]Michael J. Roemer, Carl S. Byington, Gregory J. Kacprzynski,George
Vachtsevanos
An Overview of Selected Prognostic Technologies with Reference to an Integrated PHM
Architecture
1st Integrated Systems Health Engineering and Management Forum Napa, CA.
November 2005
[16] G. J. Kacprzynski, M. Gumina,etc
A PROGNOSTIC MODELING APPROACH FOR PREDICTING RECURRING
MAINTENANCE FOR SHIPBOARDPROPULSION SYSTEMS
Proceedings of ASME Turbo Expo 2001, New Orleans, LA USA
[17] MENG ZHAOANG
Aircraft Fuel System Prognostics and Health Management
MSc Thesis, Department of Aircraft Design, College of Aeronautics, Cranfield Institute
of Technology, Academic Year: 2010-2011
[18] Roskam J.
Airplane Design.Part V:Component Weight Estimation.
Roskam Aviation and Engineering Corporation,Ottawa, Kansas, 1985.
[19] The College of Aeronautics Lecture Note
Aerospace Vehicle Desgin:Aircraft mass prediction. DAeT 9218
Cranfield Institute of Technology
[20]Currey, N. S.
Aircraft Landing Gear Design Principles and Practices
AIAA Education Series, Washington, 1988.
[21]Roskam, J.
Airplane Design Part Ⅳ. Layout Design of Landing Gear and Systems

76
Roskam Aviation and Engineering, Ottawa, Kansas, 1985.
[22] Federal Aviation Administration
Federal Aviation Regulation, Part 25
http://www.faa.com
[23] European Aviation Safety Agency
Certification Specifications For Large Aeroplanes, CS-25
http://www.easa.org
[24] Civil Aviation Administration of China
Civil Aviation Airworthiness regulation, Part 25, R3
http://www.caac.com
[25] Ian Moir and Allan Seabridge
Aircraft Systems: Mechanical, electrical, and avionics subsystems integration
Third Edition. John Wiley & Sons, Ltd. 2008
[26] Society of Automotive Engineers
Guidelines and Methods for conducting the Safety Assessment Process on Civil
Airborne Systems and Equipment
SAE ARP 4761, December 1996
[27] Aerospace Vehicle Design Lecture Note
Introduction to Failure Modes and Effects Analysis, AVD 0464
Department of Aerospace Engineering, Cranfield University
[28] FAA USA, (1980)
Procedures for Performing a Failure Mode, Effects and Criticality Analysis
USA
[29]Joseph Berk
SYSTEM FAILURE ANALYSIS

77
ASM Inernational ,2009
[30] Nigel Whitaker
The Application of Integrated Vehicle Health Management to an Aircraft Fuel System
MScThesis, Cranfield University, Bedford shire, UK.2011
[31]Mary Kirby,
Bombardier tests point to C Series electric brakes innovation
Philadelphia, 2008
http://www.flightglobal.com/news/articles/bombardier-tests-point-to-cseries-electric-
brakes-innovation-318161/
[32]Integrated Vehicle Health Management (IVHM)
http://www.nasa.gov/centers/ames/research/humaninspace/humansinspace-ivhm.html
[33]Aamodt and E. Plaza
Case-Based Reasoning: Foundational Issues, Methodological
Variations, and System Approaches,AI-Communications 7(i):39–59, 1994
[34] Derere, L.
Case-based reasoning: diagnosis of faults in complex systems through reuse of
experience
Test Conference, 2000. Proceedings. International
[35] Zhongtian Tai
AIRCRAFT ELECTRICAL POWER SYSTEM DIAGNOSTICS,PROGNOSTICS AND
HEALTH MANAGEMENT
MSc Thesis, Department of Aircraft Design, College of Aeronautics, Cranfield Institute
of Technology, Academic Year: 2009-2010
[36] Martin Atzmueller, Joachim Baumeister, Frank Puppe
Evaluation of two Strategies for Case-Based Diagnosis handling Multiple Faults
Department of Computer Science. University of Würzburg, Germany 2003

78
[37] Carl J. Dister
On-line health assessment of integrated pumps
Aerospace Conference, Proceedings. 2003 IEEE
[38]Byington C.S., Roemer M. J., Hess A. J.
Programmatic and Technical PHM Development Challenges in Forward Fit
Applications
Impact Technologies, LLC, 2007
[39] Mark Schwabacher, Kai Goebel
A Survey of Artificial Intelligence for Prognostics
MS 269-3, NASA Ames Research Center, 2007
URL: http://ti.arc.nasa.gov/m/pub-archive/1382h/1382%20(Schwabacher).pdf
[40] Carl S. Byington, P.E.
In-Line Health Monitoring System for Hydraulic Pumps and Motors
Aerospace Conference, 2003. Proceedings. 2003 IEEE
[41]Fluid Property Sensors
http://www.meas-spec.com/fluid-property-sensors/fluid-property-sensors.aspx
[42]On-Line Ferrous Wear Debris Sensor
http://www.kittiwake.com/atex-wear-debris-particle-sensor
[43]http://www.eaton.com/ecm/groups/public/@pub/@eaton/@aero/documents/content/
ct_202661.jpg
[44]http://www.k-makris.gr/AircraftComponents/Hydpamp/hyd_pump.htm

79
APPENDICES
Appendix A Group Design Project Report
Conceptual Design of Flying Wing Airliner FW-11
Fuel Mass Calculation, Mass Breakdown and Landing Gear Design


81
TABLE OF CONTENTS LIST OF FIGURES ......................................................................................................... 83
LIST OF TABLES .......................................................................................................... 85
A1 Introduction .............................................................................................................. 89
A1.1 Background of GDP ........................................................................................... 89
A1.2 FW-11 ................................................................................................................. 89
A1.3Design Process of GDP ....................................................................................... 89
A2 Derivation of Design Requirements .......................................................................... 93
A2.1 Introduction ......................................................................................................... 93
A2.2 Engine Performance Estimation ......................................................................... 93
A2.2.1 Task ............................................................................................................. 93
A2.2.2 Engine Modelling ....................................................................................... 93
A2.2.3 Simulation Result ........................................................................................ 94
A2.3 Phase Summary .................................................................................................. 97
A3 Conventional Aircraft Design .................................................................................... 99
A3.1 Introduction .................................................................................................... 99
A3.2 Fuel Mass Calculation .................................................................................... 99
A3.2.1 Calculation Methodology ........................................................................ 99
A3.2.2 Calculation Results ................................................................................ 101
A3.3 System and Equipment Mass Breakdown .................................................... 102
A 3.3.1 Calculation Methodology ..................................................................... 102
A 3.3.2 Results .................................................................................................. 103
A3.4 Phase Summary ............................................................................................ 105
A4 Flying Wing Aircraft Design ................................................................................... 107
A4.1 Introduction ...................................................................................................... 107
A4.2 Landing Gear Design ........................................................................................ 107
A4.2.1 Landing Gear Disposition .......................................................................... 107
A4.2.2 Tires selection ............................................................................................ 110
A4.2.3 Ground Operation capability .................................................................... 112

82
A4.3 Summary ........................................................................................................... 113
A5 CONCLUTION ....................................................................................................... 115

83
LIST OF FIGURES
Figure A1-1 FW-11 Conceptual Design Process ............................................................ 90
Figure A2-1 Engine model A .......................................................................................... 94
Figure A2-2 Engine model B .......................................................................................... 94
Figure A2-3 Variation of Net Thrust and SFC with TET ............................................... 95
Figure A2-4 Variation of Net Thrust with Altitude and Mach number .......................... 95
Figure A2-5 Variation of SFC with Altitude and Mach number ..................................... 96
Figure A3-1 Typical mission Profile ............................................................................... 99
Figure A4-1 Landing Gear Location ............................................................................. 108
Figure A4-2 Landing Gear Turnover Angle .................................................................. 109
Figure A4-3 Landing Gear Stowage 3D Model ............................................................ 109
FigureA4-4 Main Landing Gear Structural Compatibility (a) .................................... 110
FigureA4-5 Main Landing Gear Structural Compatibility (b) ..................................... 110
Figure A4-6 Ground Turning Radii ............................................................................... 112
Figure A4-7 Three-view Drawing of the FW-11 .......................................................... 113
Figure A4-8 The Fuel Efficiency of FW-11 .................................................................... 11


85
LIST OF TABLES
Table A2-1 Main parameters of engines currently in service ......................................... 93
Table A2-2 Engine performance characteristics estimation ............................................ 96
Table A3-1 Conventional aircraft fuel mass calculation results.................................... 101
Table A3-2 Conventional aircraft system mass calculation results ............................... 104
Table A3-3 Conventional aircraft system mass and fuel efficiency .............................. 105
Table A4-1 Landing Gear Loading Datasheet .............................................................. 111
Table A4-2 Tire Selection Datasheet............................................................................. 112
Table A4-3 Ground Turning Radii ................................................................................ 113


87
LIST OF ABBREVIATION
AVIC Aviation Industry Corporation of China
APU Auxiliary Power Unit
C Specific Fuel Consumption
CG Centre of Gravity
ECS Environmental Control System
FCS Flight Control System
GDP Group Design Project
L/D Lift to Drag Ratio
MOE Operating Empty Mass
MTOW Maximum Take-off Weight
MLG Nose Landing Gear
NLG Main Landing Gear
sfc Specific Fuel Consumption
TET Turbine Entry Temperature


89
A.1 Introduction
A.1.1 Background of GDP
This Group Design Project is the 4th year cooperation programme between Aviation
Industry Corporation of China (AVIC) and Cranfield University. It is the first year of
another three-year MSc training Programme of civil aircraft design. Three groups from
AVIC will accomplish a commercial aircraft design, from conceptual design to
preliminary design and then detail design respectively. In this year, 22 AVIC students
work together to finish the conceptual design of the flying wing airliner—FW-11.
A.1.2 FW-11
According to the national strategy of china civil aviation industry, they are attempting to
manufacture advanced aircraft to meet the huge domestic demand. As we know, the
regional jet ARJ21 has been taken its initial flight and the single-aisle narrow body
airliner C919 wish to be put into service in five years. The government is also very
urgent to design a kind of long-range and larger airliner to satisfy increasing demands of
international aviation market.
In the past three years, 3 AVIC groups have accomplished a conventional airliner design
as their GDP training programme in Cranfield University. As the expectation of AVIC,
our group attempts to design a new concept aircraft. Therefore, the GDP programme
aims to design a flying wing aircraft—FW-11, which is a long range, 250-seat, next
generation airliner. With the long range capability of 7500 nautical miles, it is designed
to reach most of the major cities from Beijing or London.
A.1.3 Design Process of GDP
The GDP design process was divided into three phases. The main task and objective of
each phase is shown in figure A1-1.

90
Figure A1-1 FW-11 Conceptual Design Process
In phase I, the main task was to analyse and define the specific design requirements.
The design group was divided into 7 teams to make a survey in following subjects:
General Characteristics;
Performance Characteristics;
Aerodynamic / Static Stability Characteristics;
Geometric Design Characteristics;
Manufacturer and Operator Investigations;
Engine General Characteristics;
Engine Performance Characteristics;
After a comprehensive analysis and discussion of the collected data and information, the
design requirements were worked out. In this stage, the author was allocated to the
Engine Performance Characteristics team and worked for engine performance
estimation.
In phase II, a conventional aircraft was designed in conceptual phase to practice the
design flow of civil aircraft. Two type range aircraft were designed simultaneously as a
family issue. The final characteristics of this aircraft were used as a baseline. In this
stage, the author was in charge of fuel mass calculation and system mass breakdown.

91
In phase III, a flying wing aircraft was developed base on the same design requirements.
A comparison of it and the baseline was given to see the benefits and challenges of the
new concept. In this stage, the author mainly contributed to the landing gear design of
FW-11.
The author’s contributions and the main achievements of each phase were represented
in following chapters.


93
A.2 Derivation of Design Requirements
A.2.1 Introduction
In order to gain a comprehensive design requirement, seven teams worked to survey in
different aspects. The author was allocated to the Engine team and was in charge of
engine performance estimation.
A.2.2 Engine Performance Estimation
A 2.2.1 Task
Compile a set of estimated engine performance data tables for a wide range of engines
which determined by the Engine General Characteristics team. These should include
Thrust and the specific fuel consumption (sfc) as a function of altitude, Mach number
and throttle setting. A level of fidelity appropriate to the conceptual design phase is
anticipated. Estimation/analysis methods can be consistent with this objective.
Finally, four engines which were widely used in current aircraft were chosen. The main
parameters of these engines are shown in table A2-1.
Table A2-1 Main parameters of engines currently in service
TYPE BPR OPR Mass Flow
(Kg/s)
Net Thrust
(N) TO
CFM56-5B2 5.5 35.4 433.6 137940
V2530-A5 4.6 36.4 384 139740
CF6-80C2 5.05 31.5 800 267480
RB211-524GH 4.3 33 729 269470
A 2.2.2 Engine Modelling
According to the engine decks obtained from Jane’s Engine Handbook, engine mode
structure was established firstly. The models are similar for CFM56-5B2, V2530-A5

94
and CF6-80C2, which is illustrated in Figure A2-1. The engine model of RB21-24GH
was shown in Figure A2-2.
INTAKE MIXEESPREMAS DUCTERCOMPRE PREMAS COMPRECOMPRE PREMAS PREMAS
BURNER
TURBIN TURBIN NOZCON
1
17
2 3 4 5 6 7 8 9 10 11 12 13 14 15
DUCTER NOZCON
19 2018
MIXEES
16
FAN BOOSTER HPC
BYPASS
HPT LPT
22 21 21
Figure A2-1 Engine model A
INTAKE MIXEESPREMAS DUCTERCOMPRE PREMAS COMPRECOMPRE PREMAS PREMAS
BURNER
TURBIN TURBIN NOZCON
1 172 3 4 5 6 7 8 9 10 11 12 13 14 15
DUCTER
19
20
18MIXEES
16
FAN BOOSTER HPC
BYPASS
HPT LPT
MIXFULTURBIN
21
IPT
23 2222
Figure A2-2 Engine model B
A 2.2.3 Simulation Result
With these initial parameters, the engine design point and off-design point performance
are simulated. All these tasks are carried out by using simulation software
TURBOMATCH. Taking into account the length of report, the programme language
and the intermediate process are not given. The following figures illustrate the
simulation results of CF6-80C2 engine.
Figure A2-3 described the design point simulation results, which shown the variation of
Net Thrust and SFC with Turbine Entry Temperature (TET) change. Figure A2-4 and
A2-5 illustrated the off-design point simulation results.

95
Figure A2-3 Variation of Net Thrust and SFC with TET
Figure A2-4 Variation of Net Thrust with Altitude and Mach number
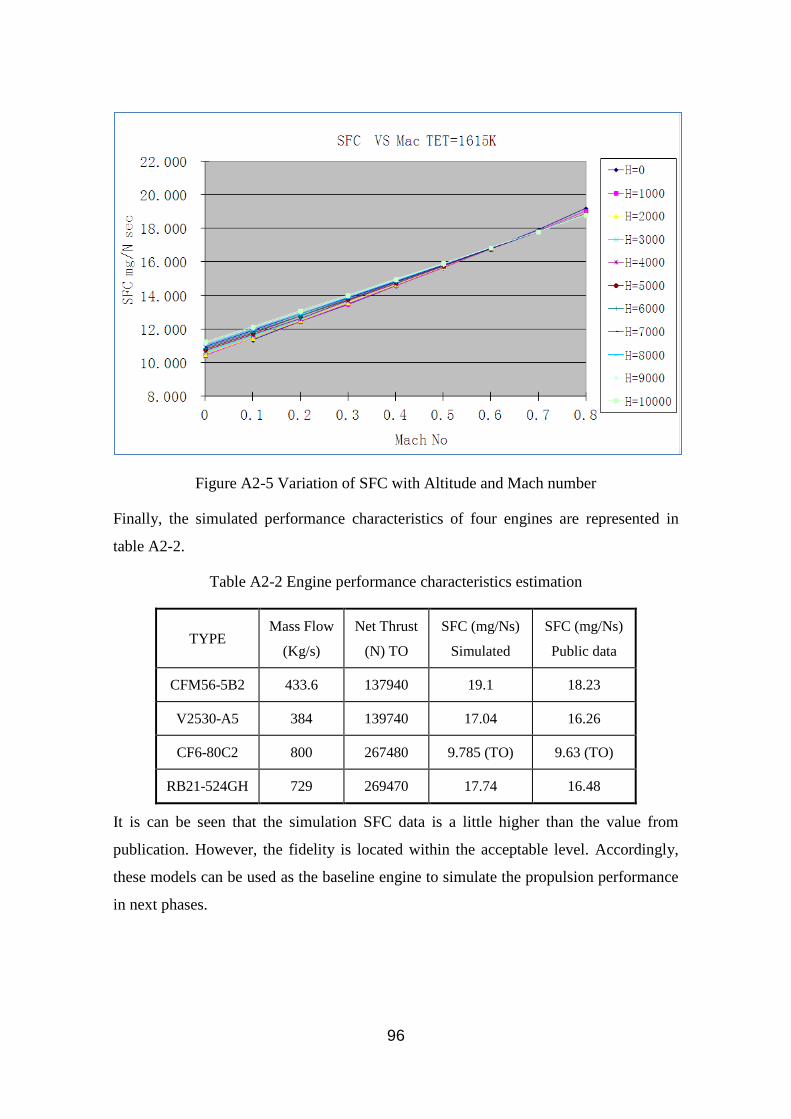
96
Figure A2-5 Variation of SFC with Altitude and Mach number
Finally, the simulated performance characteristics of four engines are represented in
table A2-2.
Table A2-2 Engine performance characteristics estimation
TYPE Mass Flow
(Kg/s)
Net Thrust
(N) TO
SFC (mg/Ns)
Simulated
SFC (mg/Ns)
Public data
CFM56-5B2 433.6 137940 19.1 18.23
V2530-A5 384 139740 17.04 16.26
CF6-80C2 800 267480 9.785 (TO) 9.63 (TO)
RB21-524GH 729 269470 17.74 16.48
It is can be seen that the simulation SFC data is a little higher than the value from
publication. However, the fidelity is located within the acceptable level. Accordingly,
these models can be used as the baseline engine to simulate the propulsion performance
in next phases.

97
A.2.3 Phase Summary
Seven teams collected data from geometric, aerodynamic/static stability performance,
engine performance, manufacturer and operator aspects, made a compensative survey
and market analysis. To sum up, the specific design requirements of FW-11 aircraft
shall be:
250seats international aircraft;
7500 nm range;
M 0.80-0.85 cruise speed;
Taking-off and Landing at 4E airports;
Competitive price, Unit price less than $185 million;
Better fuel efficiency, 25% fuel reduction;
20.5 dB noise reduction;
Lower life cycle costs;
Higher reliability and safety;
Flexible operating capabilities;
Entry service 2020.

99
A.3 Conventional Aircraft Design
A.3.1 Introduction
As the design requirement was determined, conceptual design of a long range and a
medium range conventional civil aircraft processed in parallel. The author was allocated
to the Mass and CG team in this phase.
The maximum take-off weight of the aircraft can be broken down as:
MTOW=MOE+MF+MPL
MOE —— Operating Empty Mass of the aircraft
MF —— Mass of the mission fuel
MPL —— Mass of the payload
The author contributes to the aircraft fuel mass estimations and system mass breakdown
work.
A.3.2 Fuel Mass Calculation
In order to calculate the mission fuel mass of the aircraft, a typical mission profile is
drawn as below. The method that was adapted is Dr. Jan Roskam’s method is a rapid
approach to calculate the fuel mass of the aircraft in conceptual design phase. [18]
Figure A3-1 Typical mission Profile
A 3.2.1 Calculation Methodology

100
A typical mission profile is considered as follow for the calculation of the aircraft fuel
mass.
STEP 1: Engine start and warm up.
The mission begin from MTO, the mass at the end of the phase is M1. According to
empirical data, M1/MTO is s 0.99 typically.
STEP2: Taxi.
The mass of start point and finish point of this period are M1 and M2 respectively.
According to empirical data, M2/M1 is 0.99.
STEP3: Take-off.
The mass of start point and finish point of this period are M2 and M3 respectively.
According to empirical data, M3/M2 is 0.995.
STEP4: Climbing to cruise attitude and cruise speed.
The mass of start point and finish point of this period are M3 and M4 respectively.
According to empirical data, M4/M3 is 0.98.
STEP5: Cruise.
The mass of start point and finish point of this period are M4 and M5 respectively. The
mass of the fuel consumed during this flight segment can be calculated using Breguet’s
range equation.
R cr =(v/cj)cr×(L/D) cr×ln(M4/ M 5)
R cr —— range
V —— airspeed of cruise
Cj —— cruise SFC of the engine
L/D —— lift to drag ratio
STEP6: Loiter.
The mass of start point and finish point of this period are M5 and M6 respectively. The
mass of the fuel consumed during this flight segment can be calculated using Breguet’s
range equation.

101
Eltr=(1/ cj) ltr×(L/D) ltr×ln(M 5/ M 6)
Eltr —— loiter time
STEP7: Descent.
The mass of start point and finish point of this period are M6 and M7 respectively.
According to empirical data, typical M 7/ M 6 is 0.99.
STEP8: Fly to alternate and descent.
The mass of start point and finish point of this period are M7 and M8 respectively. The
calculation of fuel mass consumed during this flight segment can be same as Cruise
segment.
R cr =(v/cj)cr×(L/D) cr×ln(M 7/ M 8)
STEP9: Landing, taxi and shut down.
The mass of start point and finish point of this period are M8 and M9 respectively.
According to empirical data, typical M 9/ M 8 is 0.992.
Hence,
MFF=(M1/MTO)×(M2/M1)×(M3/M2)×(M4/M3)×(M5/M4)×(M6/M5)×(M7/M6)×(M8/M7)×(M9/M8)
The fuel used during the mission will be:
M FUSE=(1- MFF) ×M TO
Accordingly, some parameters need be given by the performance team, such as the
cruise speed, lift to drag ratio and SFC in different flight phase. The airspeed of cruise is
490kts, the time of loiter is 0.75hours.
A 3.2.2 Calculation Results
According to the initial maximum take-off mass and other input parameters given by
other teams, the fuel mass for two type aircraft was calculated. Table A3-1 shows the
final results of fuel mass estimation.
Table A3-1 Conventional aircraft fuel mass calculation results
Items Seats Range (nm) Mfuel (kg) MTOW (kg) Long range aircraft 220 7000 86426 188181
Medium range aircraft 327 4000 65668 192415

102
A.3.3 System and Equipment Mass Breakdown
For the system mass prediction, some empirical equations is used in mass predication.
The author employs the method from lecture notes of cranfield university which are
similar with the Roskam’s method. [19]
Accordingly, the mass of systems and equipments can be considered as the sum of
powerplant mass, fuel and oil system mass, mass of power services, mass of furnishings
and equipments mass:
Msys=Mpi+Mf+Mpsfc+Mfur+Meq
A 3.2.1 Calculation Methodology
The calculation methodology is presented as follow:
For the powerplant, the factor for turbofan engines to calculate power installation is
1.3, hence
Mpi=1.3Mp
Mp —— mass of engines
For fuel and oil systems, the mass include the mass of the fuel tank (Mtank), is the
mass of residual fuel (Mrf) and the mass of fuel system (Mfs).
The volume of fuel can be calculated from the mass of fuel given before.
The tank is blend with the structure of wing box. Sealing for integral tanks is likely
to amount to about 10V kg.
Mtank=10V kg
Residual fuel can amount to about 0.25% of take-off mass, which is
Mrf=0.0025Mto.
The mass of fuel system can be calculated as MFS=0.05M0.8
Thus the total mass of fuel and oil system is:
Mf=Mtank+Mrf+Mfs
For the mass of the APU, it can be calculated by the equation:
Mapu=0.005Mto=290kg

103
For the mass of hydraulics with powered controls, it can be calculated by:
Mhyd=3.2Mto0.5
For the mass of electrics, it can be calculated by:
Mele=0.75Mto0.67
For the mass of powered flying control systems, it can be calculated by:
Mfc=0.11Mto0.8
For the environmental control systems mass calculation:
Men=Mac+Mdi
Mac—— mass of air-conditioning system
Mdi —— mass of de-icing system
Men=Mac+Mdi=0.035Mto0.88+0.16Mto0.7
Thus the total mass of power services including flying controls is:
Mpsfc=Mapu+Mhyd+Mele+Mfc+Men
The mass of furnishings includes the mass of cabin furnishings and the mass of
seats. Since the design number of passengers is Np, the total mass of furnishings is:
Mfur=45Np kg
The mass of equipment is made up of instruments & automatic controls which is
about 250kg for civil aircraft with automatic flight system, radio & radar &
navigation equipments which is about 1000 kg, fire precautions Mfp =0.003Mto,
wing area is 276m2 and external paint Mep= 0.5s = 138kg. Thus the total mass of
equipment is:
Meq=Mia+Mrrn+Mfp+Mep
A 3.2.2 Results
All of these methods are based on empirical formula. So, the outcome of calculation
using these methods might not conform to the real figure. The process of mass
calculation is iterating during conceptual design phase. The fuel mass and system mass
calculation results are showing in Table 2.

104
Table A3-2 Conventional aircraft system mass calculation results
Part
Mass (kg)
Percentage of MTOW Mass (kg) Percentage
of MTOW
Long range aircraft
Max-Seat:327
Range: 7500
Medium range aircraft
Max-Seat:224
Range: 4000
MTOW 188181.6
192415.1
Total system mass 35960 19.11% 39983 20.78%
Powerplant 12441 6.61% 12441 6.47%
Fuel System 1937.1 1.03% 1685.9 0.88%
FCS 1824.1 0.97% 1856.85 0.97%
Hydraulic System 1388.1 0.74% 1403.67 0.73%
Electrical system 2564.6 1.36% 2603.1 1.35%
Accessory Drives 564.5 0.30% 577.23 0.30%
APU 300 0.16% 300 0.16%
ECS 1907.6 1.01% 2434.9 1.27%
Instrument 250 0.13% 250 0.13%
Radio 1000 0.53% 1000 0.52%
Fire Precaution 564.5 0.30% 577.23 0.30%
External paint 138.35 0.07% 138.35 0.07%
Furnishing 10080 5.36% 14715 7.65%
A.3.4 Phase Summary
In this phase, a long range aircraft and a medium range aircraft was designed
concurrently. They shared the same wing but different length of body. The author

105
contributed to the aircraft fuel mass calculation and system mass breakdown. The mass
estimation process is a continual optimization. Finally, the fuel efficiency was estimated
based on the mass calculation results. From the table A3-3, it can be seen that the
designed conventional aircraft have a better fuel efficiency than the similar size civil
airliner in service.
Table A3-3 Conventional aircraft system mass and fuel efficiency
Items B767-200ER
A330-200
A310-300
A330-300
Long range
Medium range
seats 255 303 243 335 220 327
weight/pax(kg) 115.7 115.7 115.7 115.7 115.7 115.7
MTOW(kg) 175540 233000 150000 233000 188181.6 192415.1
OEW(kg) 82377 109100 79207 119931 78537 91060
payload(kg) 29496 35048 28108 38749 25447 37824
Payload&OEW(kg) 111873 144148 107315 158680 103984 128884
Payload Range(nm) 5600 5656 3700 4500 7721 5391
fuel capacity(kg) 63667 88852 42685 74320 81294 70439
Fuel used(kg) 60484 84409 40551 70604 75604 65508
Fuel/pax/nm(kg) 0.042 0.049 0.045 0.047 0.044 0.037


107
A.4 Flying Wing Aircraft Design
A.4.1 Introduction
In phase Ⅲ, a new concept, flying wing aircraft is designed based on the same design
requirements. The author contributes to the aircraft landing gear design work. It is a big
challenge for the author to design a flying wing aircraft landing gear.
A.4.2 Landing Gear Design
The landing gear design of the FW-11 aircraft in conceptual phrase is mainly considered
in follow aspect, which is heavy reliance on Norman S. Currey’s book: Aircraft Landing
gear Design. [20]
1) Landing Gear Disposition
2) Tires selection
3) Ground Operation capability
For FW-11 aircraft landing gear, a tricycle configuration is used as almost all of the
civil transport aircraft. And there is no serious reason to derive from it.
With the estimated maximum take-off weight of around 190 tons, the landing gear strut
and tire numbers were determined based on the past aircraft data. The nose landing gear
is composed of one strut and two tires. The main landing gear has two struts, with four
tires per strut.
A4.2.1 Landing Gear Disposition
The landing gear disposition depends on various factors:
a) Loading requirements
b) Stability requirements
c) Structure compatibility
Loading consideration
For the loading, it is preferable to place 8% to 15% of aircraft weight on the nose gears

108
when the aircraft is on ground. However, the main landing gear position is limited by
the aft CG location and the stability requirements; the nose landing gear position is
limited by the structural layout.
Stability requirements
For the longitudinal stability, a tail-down angle of more than 15 degree is needed. It can
prevent the aft CG move back to the main gear when brake. [21]
After trading off, the landing gear location is shown as following:
Figure A4-1 Landing Gear Location
As can be seen from the above figure, the load on the nose gear is 8.75% with the aft
CG, and 17.4% with the forward CG. The loading range is within required limits. The
landing gear tail-down angle of the FW-11 is exactly 17.1 degrees, which is above the
limit.
For the lateral stability, the figure A4-2 illustrates the design situation:
The calculated turnover angle of the aircraft is 34 degrees, which is reasonable when
compared with other transport aircraft.

109
Figure A4-2 Landing Gear Turnover Angle
Structure compatibility
For structural Compatibility, The nose landing gear swings backward into the fuselage
because of the nose gear is located at 2m form nose for reduce the load on it. For the
feature of flying wing structure, there is no space under the cabin in the centre of
fuselage. The main gears retract outboard back of cargo bay and make a little turn back
to avoid interferes with the middle spar.
The following figure shows the design situation and the landing gear position relative to
the supporting structures.
Figure A4-3 Landing Gear Stowage 3D Model

110
FigureA4-4 Main Landing Gear Structural Compatibility (a)
FigureA4-5 Main Landing Gear Structural Compatibility (b)
A4.2.2 Tires selection
For the landing gear tires selection, the loading on each wheel should be calculated. The
following table shows the landing gear loading datasheet.
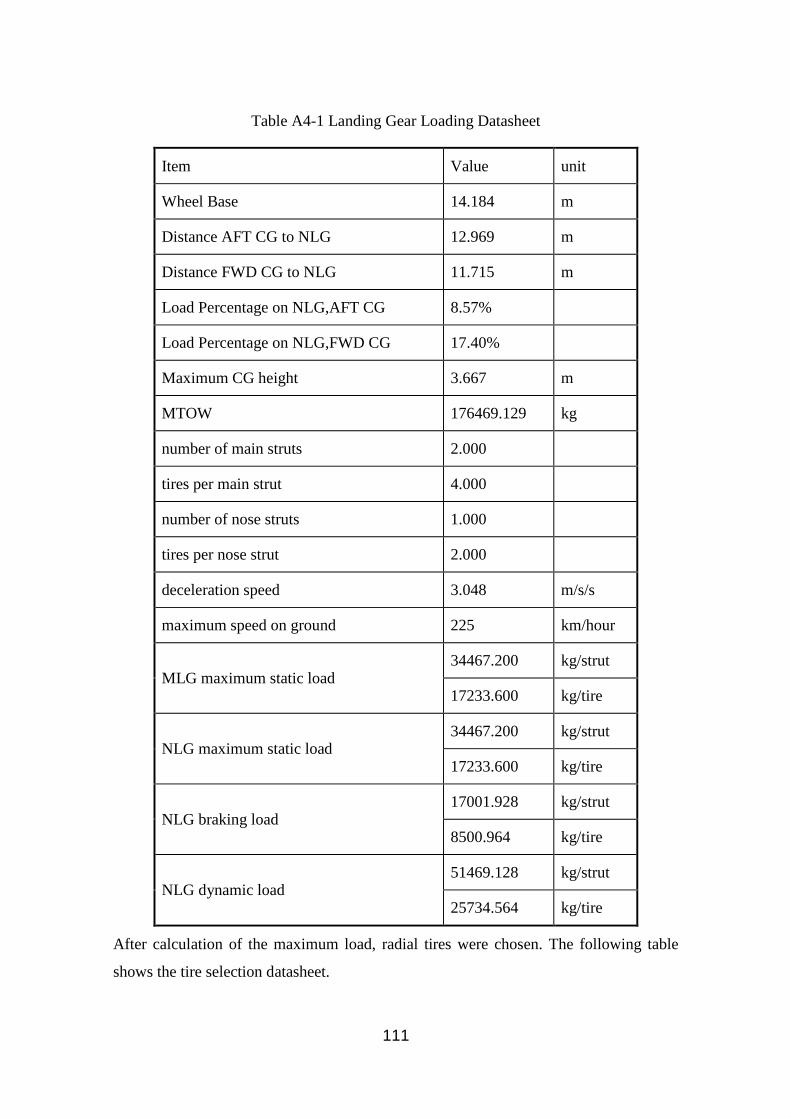
111
Table A4-1 Landing Gear Loading Datasheet
Item Value unit
Wheel Base 14.184 m
Distance AFT CG to NLG 12.969 m
Distance FWD CG to NLG 11.715 m
Load Percentage on NLG,AFT CG 8.57%
Load Percentage on NLG,FWD CG 17.40%
Maximum CG height 3.667 m
MTOW 176469.129 kg
number of main struts 2.000
tires per main strut 4.000
number of nose struts 1.000
tires per nose strut 2.000
deceleration speed 3.048 m/s/s
maximum speed on ground 225 km/hour
MLG maximum static load 34467.200 kg/strut
17233.600 kg/tire
NLG maximum static load 34467.200 kg/strut
17233.600 kg/tire
NLG braking load 17001.928 kg/strut
8500.964 kg/tire
NLG dynamic load 51469.128 kg/strut
25734.564 kg/tire
After calculation of the maximum load, radial tires were chosen. The following table
shows the tire selection datasheet.

112
Table A4-2 Tire Selection Datasheet
Item MLG Tires NLG Tires Unit Tire Size 50x20-20 44x16.5-18
Speed 225 225 mph
Max Load 53800 42500 lb
Inflation Press. 195 1 95 psi
Braking Load 77800 63750 lb
Weight 306.4 138.8 in
Dia. 50 44.5 in
Width 19 156.5 in
Rad. 20.3 18.4
Aspect Ratio 0.767 0.807
A4.2.3 Ground Operation capability
The following figure and table shows the turning radii of the aircraft.
Figure A4-6 Ground Turning Radii

113
Table A4-3 Ground Turning Radii
Steering angle
R1
R2
R3
R4
30 29.45 58.31 29.28 16.62
40 23.42 50.24 22.43 10.92
50 20.1 45.96 18.31 5.91
60 18.14 42.37 15.6 2.2
70 16.99 39.47 13.74 0.84
This value is within the limitation of class 4E airports which is meets the design
requirements.
A.4.3 Phase Summary
After several rounds of assessments and updates, the final configuration of a twin-
engine flying wing aircraft is developed and frozen. The three-view drawing of the FW-
11 aircraft is showing below.
Figure A4-7 Three-view Drawing of the FW-11
According to the performance team estimation results, the comparison of fuel efficiency
between the new concept and the baseline is shown as follow. Although there is little
weak on stability operations, flying wing aircraft has unparalleled advantages in oil

114
saving and noise reduction. This new concept aircraft research work is worthiness and
challenged.
Figure A4-8 The Fuel Efficiency of FW-11
115
A.5 Conclusion
In this group design project, the author worked in a team to design a new concept civil
aircraft. After five months work, the conceptual design of a flying wing airliner—
FW-11is completed.
The GDP work was divided into three phrases. At the beginning, we collected data from
different aspects to get the aircraft design requirements. Then we finished a conceptual
design of a conventional civil aircraft in order to practice the design flow of the aircraft
conceptual design. After that we developed a new configuration—flying wing aircraft in
conceptual design phase. According to the performance assessments of the FW-11 with
the existing aircraft, it can be seen that the whole research work is successful. The final
configuration of aircraft was frozen and will be used as input of the preliminary design
in next year.
Although the author made different contributions in different phases, the whole process
was challenged and experienced. The author was in charge of engine performance
characteristics estimation during the design requirements derivation phase. In
conventional aircraft design phase, he made the fuel mass calculation and system mass
breakdown for two configurations. Finally, the author finished the conceptual design of
the landing gear for the flying wing aircraft and contributed to the poster and brochure
design, as well as an imaginative video for the final presentation.


117
Appendix B Hydraulic Power system FHA Summary Function Description
Failure condition (hazard description)
Flight phase
Effect of failure condition on Aircraft/Crew/Occupants
hazard Classification
1)Supply hydraulic power
1.1) Loss of all hydraulic power supply.
Take off,Flight , Landing
1. The aircraft will loss flight control capability. 2. The flight crew cannot control the aircraft continued
safe flight takeoff and landing. 3. All the occupants might suffer serious injury.
Catastrophic
1)Supply hydraulic power
1.2) Loss of LEFT and RIGHT channel hydraulic power supply.
Take off,Flight , Landing
1. The aircraft will partially loss of the aircraft controllability and those function: L outer elevator R outer elevator L&R thrust reverser
2. The flight crew need to take the relative procedures to cope with this circumstance which will make the work load increased.
3. All the occupants might feel discomfort due to due to partly lose controllability of the aircraft.
Major

118
Function Description
Failure condition (hazard description)
Flight phase
Effect of failure condition on Aircraft/Crew/Occupants
hazard Classification
1)Supply hydraulic power
1.3) Loss of LEFT and CENTRE channel hydraulic power supply.
Take off,Flight , Landing
1. The aircraft will partially loss of the aircraft controllability and those function: L inner elevator L aileron R split rudder L thrust reverser Nose Landing Gear Steering Landing gear normal retraction/extension
2. The flight crew need to take the relative procedures to cope with this circumstance which will make the work load increased.
3. All the occupants might feel discomfort due to due to partly lose controllability of the aircraft.
Major

119
Function Description
Failure condition (hazard description)
Flight phase
Effect of failure condition on Aircraft/Crew/Occupants
hazard Classification
1)Supply hydraulic power
1.4) Loss of RIGHT and CENTRE channel hydraulic power supply.
Take off,Flight , Landing
1. The aircraft will partially loss of the aircraft controllability and those function: R inner elevator R aileron L split rudder R thrust reverser Nose Landing Gear Steering Landing gear normal retraction/extension
2. The flight crew need to take the relative procedures to cope with this circumstance which will make the work load increased.
3. All the occupants might feel discomfort due to due to partly lose controllability of the aircraft.
Major
1)Supply hydraulic power
1.5) Loss of CENTRE channel hydraulic power supply.
Take off,Flight , Landing
1. The aircraft will loss those control path: Nose Landing Gear Steering Landing gear normal retraction/extension
2. The flight crew will take measures to cope with this circumstance which will increase the work load.
3. The occupants might feel slight inconvenience.
Minor

120
Function Description
Failure condition (hazard description)
Flight phase
Effect of failure condition on Aircraft/Crew/Occupants
hazard Classification
1)Supply hydraulic power
1.6) Loss of LEFT channel hydraulic power supply
Take off,Flight , Landing
1. The aircraft will loss those control path: R outer elevator L thrust reverser
2. The flight crew will take measures to cope with this circumstance which will increase the work load.
3. The occupants might feel slight inconvenience.
Minor
1)Supply hydraulic power
1.7) Loss of RIGHT channel hydraulic power supply
Take off,Flight , Landing
1. The aircraft will loss those control path: L outer elevator R thrust reverser
2. The flight crew will take measures to cope with this circumstance which will increase the work load.
3. The occupants might feel slight inconvenience.
Minor
2)Provide annunciation to ECAS
2.1) loss of Low-Pressure warning when LEFT, RIGHT and CENTRE hydraulic power subsystems failure
Take off,Flight , Landing
1. The aircraft will loss flight control capability. 2. The flight crew cannot control the aircraft continued
safe flight and landing. 3. All the occupants might be seriously injured due to
lose controllability of the aircraft.
Catastrophic

121
Function Description
Failure condition (hazard description)
Flight phase
Effect of failure condition on Aircraft/Crew/Occupants
hazard Classification
2)Provide annunciation to ECAS
2.2) loss of Low-Pressure warning when two hydraulic power subsystems failure
Flight
1. The aircraft will lose some control path while the flight crew is not aware of it.
2. The flight crew work load will be increased excessively to deal with this emergency situation.
3. All the occupants might suffer injury or severe discomfort.
Major
Take off, Landing
1. The aircraft will lose some control path while the flight crew is not aware of it.
2. The flight crew cannot control the aircraft continued safe flight and landing.
3. All the occupants might be seriously injured due to lose controllability of the aircraft.
Hazardous
2)Provide annunciation to ECAS
2.3)loss of Low-Pressure warning when one hydraulic power subsystem failure
Take off,Flight , Landing
1. The aircraft will loss few control path: 2. The flight crew need to take the relative procedures
to cope with this circumstance which will make the work load increased
3. All the occupants might feel discomfort due to due to partly lose controllability of the aircraft.
Major

122
Function Description
Failure condition (hazard description)
Flight phase
Effect of failure condition on Aircraft/Crew/Occupants
hazard Classification
3)Fire Protection
3.1) loss of ability to shut off EDP suction in case of fire. All phase
1. It may cause fire when engine when engine fire. 2. The flight crew work load will be increased
excessively to deal with this emergency situation. 3. The occupants might be injured due to fire.
Hazardous

123
Appendix C Hydraulic Power system FMECA Summary Component: Engine driven pump Function: Provides pressured fluids
Failure Modes Flight phase
Effects on system Effects on Aircraft Severity level
Loss of output flow Flight, ground Loss of relative EDP output flow. Decrease LEFT or RIGHT system power capability. Major
Reduced output flow Flight, ground Reduce relative EDP output flow. Decrease LEFT or RIGHT system power capability. Minor
Internal leak Flight, ground Reduced relative EDP output flow. None. Minor
External leak Flight, ground Loss of relative subsystem EDP output flow.
Decrease LEFT or RIGHT system power capability. Impact on environment.
Major
Overheat Flight, ground Cause seal failure and fluid leakage. External fluid spillage.
Decrease relative system power capability. Impact on environment.
Major

124
Component: Electrical motor pump Function: Provides pressured fluids
Failure Modes Flight phase
Effects on system Effects on Aircraft Severity level
Loss of output flow Flight, ground Loss of relative EMP output flow. Decrease relative system power capability. Major
Reduced output flow Flight, ground Reduce relative EMP output flow. Decrease relative system power capability. Minor
Internal leak Flight, ground Reduce relative EMP output flow. None. Minor
External leak Flight, ground Loss of relative EMP output flow.
Decrease relative system power capability. Impact on environment.
Major
Pump overheat Flight, ground Cause seal failure and fluid external leakage.
Decrease relative system power capability. Impact on environment.
Hazardous
Motor overheat Flight, ground Loss of relative EMP output flow. Decrease relative system power capability. Impact on environment.
Hazardous

125
Component: Hydraulic reservoir Function: store and pressure fluids for pumps, radiating, remove the air in fluids, sense the fluids temperature, detect the low level signal of fluids quantity, measure reservoir fluids quantity
Failure Modes Flight phase Effects on system Effects on Aircraft Severity level
Fluid chamber leak Flight, ground
Loss of relative subsystem power supply.
Loss of relative subsystem power capability. External fluid spillage.
Major
Pressure chamber leak Flight, ground
Loss of reservoir fluids pressure. May cause relative pumps damage.
Decrease relative system power capability.
Major
Internal leak between fluid chamber and pressure chamber
Flight, ground
Reservoir fluids pressure decrease. May cause relative pumps damage.
None. Minor
Component: Auto Bleed Valve Function: discharge the air in fluid to depressurize reservoir automatically
Failure Modes Flight phase Effects on system Effects on Aircraft Severity level
Auto Bleed Valve block Flight, ground
Reservoir losses of auto bleed capability.
None. Minor
Seal fails Flight, ground
External leak through the spar. Impact on environment. Minor

126
Component: Reservoir Temperature Sensor Function: provide fluids temperature signal
Failure Modes Flight phase
Effects on system Effects on Aircraft Severity level
Reservoir Temperature Sensor failed to output
Flight, ground
Unable to provide fluids temperature signal.
Loss of reservoir fluids overheat warning message when temperature is high.
Minor
Reservoir Temperature Sensor inaccurate output
Flight, ground
Provide fluids overheat false warning signal.
Erroneous reservoir fluids temperature warning message.
Minor
Seal fails Flight, ground
External leak through the spar. Impact on environment. Minor
Component: Reservoir Low-level Sensor Function: provide reservoir low level warning signal
Failure Modes Flight phase Effects on system Effects on Aircraft Severity level
Reservoir Low-level Sensor failed to output
Flight, ground
Unable to provide reservoir low level warning signal.
Loss of reservoir low level warning message when system leak.
Major
Reservoir Low-level Sensor inaccurate output
Flight, ground
Provide reservoir low level false warning signal.
Erroneous reservoir low level warning message.
Minor
Seal fails Flight, ground
External leak through the spar. Impact on environment. Minor
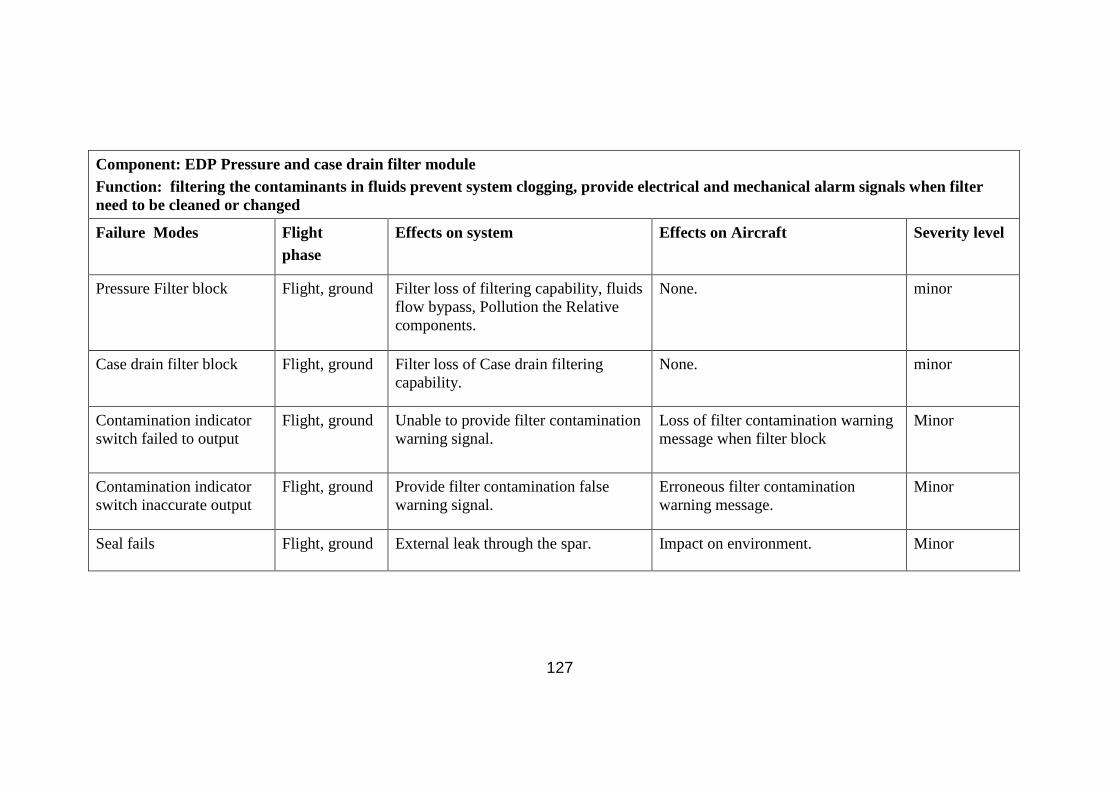
127
Component: EDP Pressure and case drain filter module Function: filtering the contaminants in fluids prevent system clogging, provide electrical and mechanical alarm signals when filter need to be cleaned or changed
Failure Modes Flight phase
Effects on system Effects on Aircraft Severity level
Pressure Filter block Flight, ground Filter loss of filtering capability, fluids flow bypass, Pollution the Relative components.
None. minor
Case drain filter block Flight, ground Filter loss of Case drain filtering capability.
None. minor
Contamination indicator switch failed to output
Flight, ground Unable to provide filter contamination warning signal.
Loss of filter contamination warning message when filter block
Minor
Contamination indicator switch inaccurate output
Flight, ground Provide filter contamination false warning signal.
Erroneous filter contamination warning message.
Minor
Seal fails Flight, ground External leak through the spar. Impact on environment. Minor

128
Component: EMP Pressure and case drain filter module Function: filtering the contaminants in fluids prevent system clogging, provide electrical and mechanical alarm signals when filter need to be cleaned or changed
Failure Modes Flight phase
Effects on system Effects on Aircraft Severity level
Pressure Filter block Flight, ground Filter loss of filtering capability, fluids flow bypass, Pollution the Relative components.
None. minor
Case drain filter block Flight, ground Filter loss of Case drain filtering capability.
None. minor
Contamination indicator switch failed to output
Flight, ground Unable to provide filter contamination warning signal.
Loss of filter contamination warning message when filter block.
Minor
Contamination indicator switch inaccurate output
Flight, ground Provide filter contamination false warning signal.
Erroneous filter contamination warning message.
Minor
Seal fails Flight, ground External leak through the spar. Impact on environment. Minor

129
Component: Return Filter Module Function: filtering the contaminants in fluids prevent system clogging, provide electrical and mechanical alarm signals when filter need to be cleaned or changed
Failure Modes Flight phase
Effects on system Effects on Aircraft Severity level
Return filter block Flight, ground Filter loss of filtering capability, fluids flow bypass, Pollution the Relative components.
None. minor
Return filter bypass valve failed to open
Flight, ground Relative filter output pressure decrease.
Decrease relative system power capability. major
Contamination indicator switch failed to output
Flight, ground Unable to provide filter contamination warning signal.
Loss of filter contamination warning message when filter block.
Minor
Contamination indicator switch inaccurate output
Flight, ground Provide filter contamination false warning signal.
Erroneous filter contamination warning message.
Minor
Seal fails Flight, ground External leak through the spar. Impact on environment. Minor

130
Component: Fire Shut-off Valve Function: Cut off hydraulic fluid flowing into EDP
Failure Modes Flight phase Effects on system Effects on Aircraft Severity level
Failed to close Flight, ground relative EDP suction flow unable to cut off.
May cause fire when failure on EDP. Hazardous
Failed to open Flight, ground Loss of relative EDP output even damage pumps.
Decrease relative system power capability. major
Seal fails Flight, ground External leak through the spar. Impact on environment. Minor Component: Low Pressure Switch Function: provide low pressure signals of pump outlet
Failure Modes Flight phase Effects on system Effects on Aircraft Severity level
Never indicates low pressure
Flight, ground Unable to provide relative pump low pressure warning signal.
Loss of relative pump low pressure warning message .
Major
always indicates low pressure
Flight, ground provide pump low pressure false warning signal.
Erroneous pump low pressure warning message for pilots.
Minor
Seal fails Flight, ground External leak through the spar. Possible indication of pump failure.
Impact on environment. Minor

131
Component: System Pressure Sensor Function: detect system operating pressure
Failure Modes Flight phase Effects on system Effects on Aircraft Severity level
Failed to output Flight, ground Unable to measure relative system pressure. Loss of relative system
pressure message.
Minor
inaccurate output Flight, ground System pressure cannot be monitor
correctly.
Erroneous system pressure
message for pilots.
Minor
Seal fails Flight, ground External leak through the spar. Impact on environment. Minor
Component: Ram Air Turbine Function: Provide emergency hydraulic power
Failure Modes Flight phase Effects on system Effects on Aircraft Severity level
Pump fails to output Flight, ground Loss of RAT pump output flow. Loss of emergency power. Hazardous
Fails to deploy Flight Loss of RAT pump output flow. Loss of emergency power. Hazardous
Fails to retract Ground None. None. Minor
Seal fails Flight, ground External leak through the spar. Impact on environment. Minor

132
Component: System relief valve Function: prevent pressure building up to a dangerously high level
Failure Modes Flight phase Effects on system Effects on Aircraft Severity level
Failed to open Flight, ground Loss ability to relieve pressure when it building up , may cause components damage or seals blowing.
Decrease relative subsystem power capability.
Major
Failed to close Flight, ground System pressure cannot building up. Loss of relative subsystem power capability.
Hazardous
Seal fails Flight, ground External leak through the spar. Impact on environment. Minor
Component: Check valve (in main pressure line) Function: prevents the flow will not be a cross direction
Failure Modes Flight phase Effects on system Effects on Aircraft Severity level
Failed to open Flight, ground System pressure cannot building up for the pressure flow bypass through relief valve.
Loss of relative subsystem power capability.
Minor
Failed to close Flight, ground Possible backflow from downstream. Decrease relative subsystem power capability.
Minor
Seal fails Flight, ground External leak through the spar. Impact on environment. Minor

133
Component: Check valve (in front of reservoir pressure line) Function: prevents the flow will not be a cross direction
Failure Modes Flight phase Effects on system Effects on Aircraft Severity level
Failed to open Flight, ground Loss of reservoir fluids pressure. May relative cause relative pumps damage.
Decrease relative subsystem power capability.
Minor
Failed to close Flight, ground Possible backflow from downstream will effect reservoir fluids pressure.
Decrease relative subsystem power capability.
Minor
Seal fails Flight, ground External leak through the spar. Impact on environment. Minor
Component: System accumulator Function: maintain system pressure when flow demands beyond maximum output of pumps in a short periods
Failure Modes Flight phase Effects on system Effects on Aircraft Severity level
Leak in fluid chamber Flight, ground Loss of relative subsystem power supply. Loss of relative subsystem power capability. External fluid spillage.
Major
Leak in air chamber Fight Loss of ability to maintain the system pressure when large peak loads.
None. Minor
Leak in air chamber Ground Cannot charge and the pressure gauge indicate zero.
None. Minor

134
Component: Reservoir pressure accumulator Function: maintain reservoir pressure when there is a demands
Failure Modes Flight phase Effects on system Effects on Aircraft Severity level
Leak in fluid chamber Flight, ground Loss of relative subsystem power supply. Loss of relative subsystem power capability. External fluid spillage.
Major
Leak in air chamber Fight Loss of ability to maintain the reservoir fluids pressure when large peak loads, Cannot charge on ground and the pressure gauge indicate zero.
None. Minor
Leak in air chamber Ground None. Minor
Component: Heat exchanger Function: transfer heats of fluids to maintain a safety temperature
Failure Modes Flight phase Effects on system Effects on Aircraft Severity level
Block in hydraulic line Flight, ground Over temperature of relative subsystem fluid.
None. Minor
External leak Flight, ground Decrease relative subsystem power capability.
Decrease relative subsystem power capability. External fluid spillage may contaminate fuel and effect fuel system safety.
Major

135
Component: Ground-Pressurization connection Function: port for ground pressure supply
Failure Modes Flight phase Effects on system Effects on Aircraft Severity level
Valve fails to open Ground Loss of ground pressure supply capability.
None. Minor
Valve fails to close Ground Possible fuel spillage. Possible fuel spillage. Minor Component: Ground-Suction connection Function: port for ground power connect
Failure Modes Flight phase Effects on system Effects on Aircraft Severity level
Valve fails to open Ground Loss of ground pressure supply capability.
None. Minor
Valve fails to close Ground Possible fuel spillage. Possible fuel spillage. Minor Component: Filling connection Function: port for filling fluid into reservoirs
Failure Modes Flight phase Effects on system Effects on Aircraft Severity level
Valve fails to open Ground Loss of reservoir filling capability. None. Minor
Valve fails to close Ground Possible fuel spillage. Possible fuel spillage. Minor

136
Component: Ground- charging connection Function: port for charging the accumulator
Failure Modes Flight phase
Effects on system Effects on Aircraft Severity level
Valve fails to open Ground Loss of accumulator charging capability. None. Minor
Valve fails to close Ground Relative accumulator loss pressure. None. Minor
Component: pressure gauge Function: port for charging the accumulator
Failure Modes Flight phase
Effects on system Effects on Aircraft Severity level
fails to indicate the pressure
Ground Loss of information of accumulator pressure for operator.
None. Minor
inaccurate indicate the pressure
Ground Loss of information of accumulator pressure for operator.
None. Minor
External leak All phase Relative accumulator loss pressure. None. Minor

137
Component: Reservoir Quantity Gauge Function: indicate the fluids quantity of reservoir
Failure Modes Flight phase Effects on system Effects on Aircraft Severity level
Fails to indicate the fluids quantity of reservoir
Ground Loss of information of fluids quantity of reservoir for operator.
None. Minor
Inaccurate indicate the fluids quantity of reservoir
Ground Loss of information of fluids quantity of reservoir for operator.
None. Minor
Seal fails Flight, ground External leak through the spar. Impact on environment. Minor


139
Appendix D Hydraulic Power system FTA Summary

140
Loss of all hydraulic power supply
Loss of EDP1 Channel output flow
Loss of RIGHT channel hydraulic power supply
Loss of EMP1 channel output flow
Loss of two Pumps output flow
Loss of LFET channel hydraulic power supply
Loss of CENTRE channel hydraulic power supply
System relief valve fail to
close
Rupture ofhydraulic tube
Leak or rupture of reservoir
External leak Of return
filter
Check valve fails to open
The same as
LFET
Reservoir 1’s fluid falls to low level
EDP1 failEngine 1 failure to
drive
Loss ofelectrical
powerEMP1 fail
Fire shut off valve fail to
open
External leak of system
relief valve
Pressure filter block
Pressure filter block
Loss of all hydraulic power supply (1)
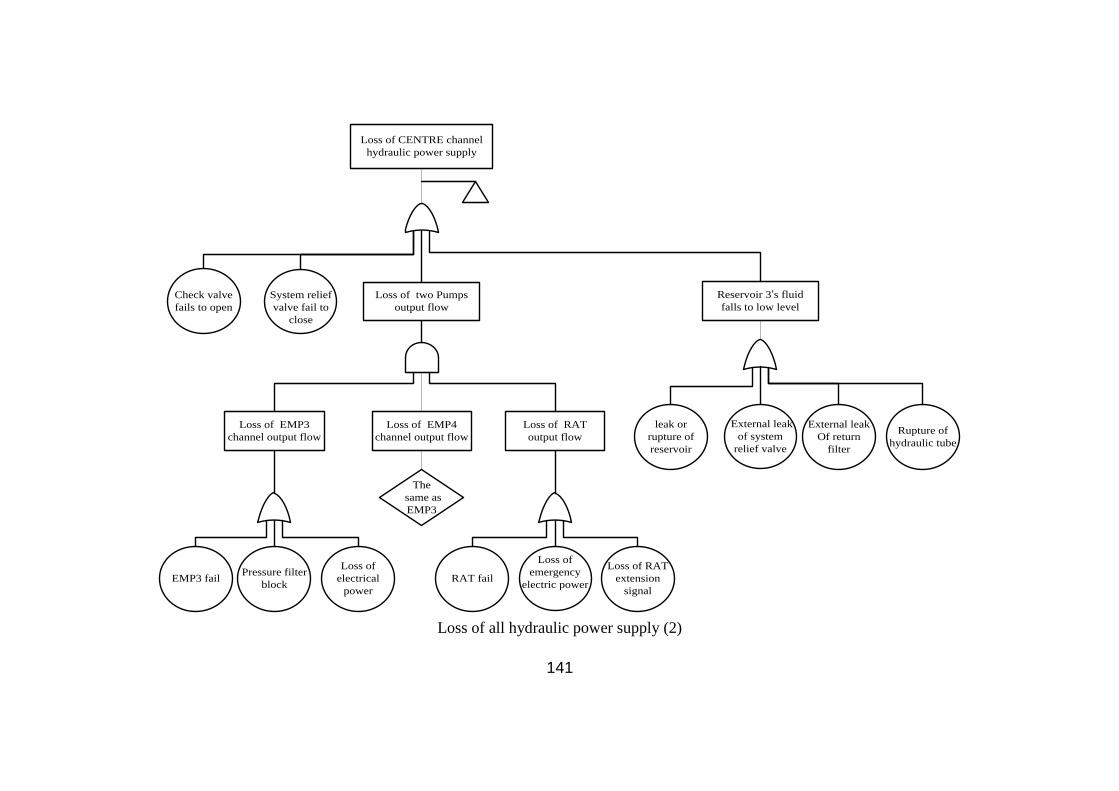
141
Loss of CENTRE channel hydraulic power supply
Loss of two Pumps output flow
System relief valve fail to
close
Rupture ofhydraulic tube
leak or rupture of reservoir
External leak Of return
filter
Check valve fails to open
Reservoir 3’s fluid falls to low level
External leak of system
relief valve
Loss of EMP3 channel output flow
Loss ofelectrical
powerEMP3 fail Pressure filter
block
Loss of EMP4 channel output flow
Loss of RAT output flow
RAT failLoss of RAT
extension signal
Loss of emergency
electric power
The same as EMP3
Loss of all hydraulic power supply (2)
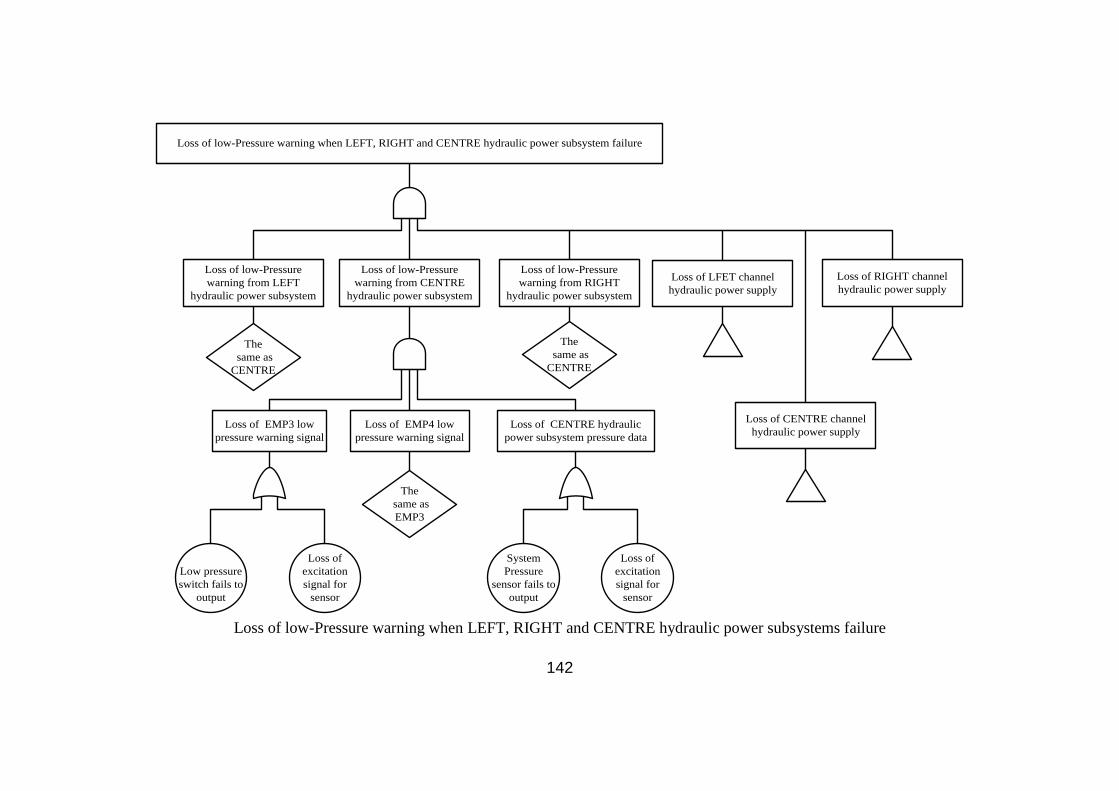
142
Loss of low-Pressure warning when LEFT, RIGHT and CENTRE hydraulic power subsystem failure
Low pressure switch fails to
output
Loss of excitation signal for
sensor
Loss of low-Pressure warning from RIGHT
hydraulic power subsystem
Loss of low-Pressure warning from LEFT
hydraulic power subsystem
Loss of low-Pressure warning from CENTRE
hydraulic power subsystem
The same as
CENTRE
The same as
CENTRE
Loss of EMP3 low pressure warning signal
Loss of CENTRE hydraulic power subsystem pressure data
System Pressure
sensor fails to output
Loss of excitation signal for
sensor
Loss of EMP4 low pressure warning signal
The same as EMP3
Loss of RIGHT channel hydraulic power supply
Loss of LFET channel hydraulic power supply
Loss of CENTRE channel hydraulic power supply
Loss of low-Pressure warning when LEFT, RIGHT and CENTRE hydraulic power subsystems failure

143
Loss of ability to shut off EDP suction in case of fire
Fire shutoffvalve fails to close
Fails to close
Loss of control signal
Loss of electric power
Engine fire
Fire shutoffvalve failure
Internal leak
Loss of ability to shut off EDP suction flow in case of fire
Top Related