


Languages
Pages
Legal

Reliablepowerwhenandwhereyouneedit.Cleanandsimple.
Management Presentation

Safe Harbor Statement
This presentation contains “forward-looking statements” regarding future events or financial performance of the
Company, within the meaning of the Safe Harbor provisions of the Private Securities Litigation Reform Act of 1995.
These statements relate to, among other things, benefits from our cost reduction initiatives, improved operating
leverage and organizational efficiency, strengthened distribution channels, new product development and the
success of our Signature Series product, benefits and competitive advantage associated with our product,
compliance with government regulations, increased sales in Russia, implementation of the Capstone Energy
Finance business, growth of our aftermarket service business, growth and diversification of our end markets,
increase in revenue and performance in light of macroeconomic headwinds, and attaining profitability. Forward-
looking statements may be identified by words such as “believe,” “expect," "objective," "intend," "targeted," "plan"
and similar phrases.
These forward-looking statements are subject to numerous assumptions, risks and uncertainties described in
Capstone's Form 10-K, Form 10-Q and other recent filings with the Securities and Exchange Commission that may
cause Capstone's actual results to be materially different from any future results expressed or implied in such
statements. Because of the risks and uncertainties, Capstone cautions you not to place undue reliance on these
statements, which speak only as of today. We undertake no obligation, and specifically disclaim any obligation, to
release any revision to any forward-looking statements to reflect events or circumstances after the date of this
conference call or to reflect the occurrence of unanticipated events.
2
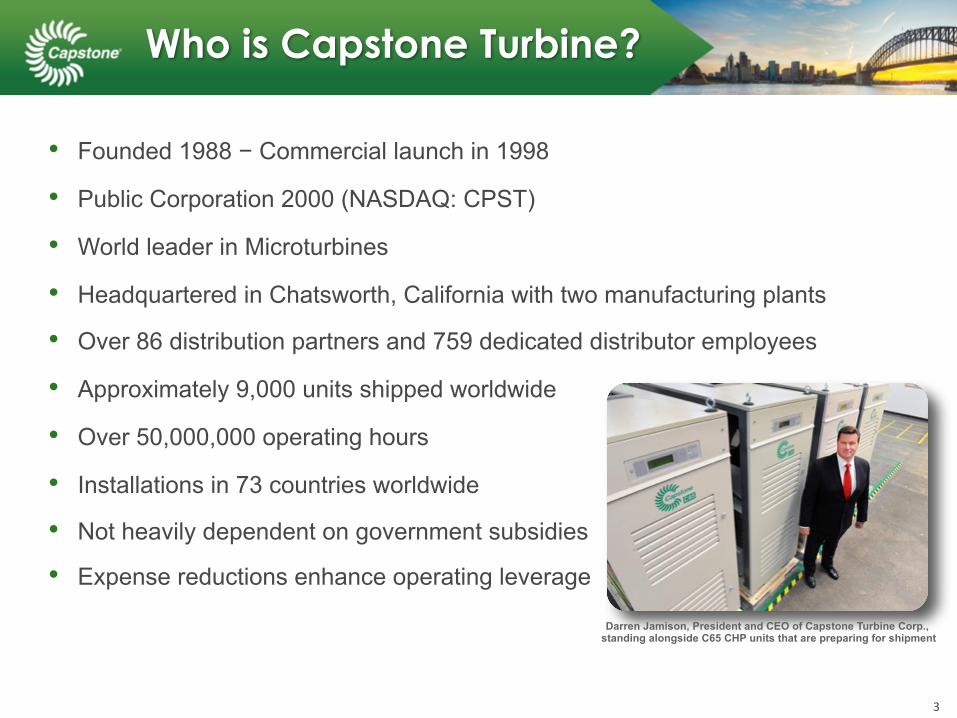
• Founded 1988 − Commercial launch in 1998
• Public Corporation 2000 (NASDAQ: CPST)
• World leader in Microturbines
• Headquartered in Chatsworth, California with two manufacturing plants
• Over 86 distribution partners and 759 dedicated distributor employees
• Approximately 9,000 units shipped worldwide
• Over 50,000,000 operating hours
• Installations in 73 countries worldwide
• Not heavily dependent on government subsidies
• Expense reductions enhance operating leverage
Who is Capstone Turbine?
3
Darren Jamison, President and CEO of Capstone Turbine Corp.,standing alongside C65 CHP units that are preparing for shipment

What is a Microturbine?
CHP/TYPEEFFICIENCY
ELECTRIC TOTAL
Hot Water 33.0% 85.0%
Steam 33.0% 60.0-95.0%
Chilled Water 33.0% 85.0%
Rotor Group
Air Foil
Power Out
Heat Out
Air In
Fuel In
4

Competitive Advantages
5
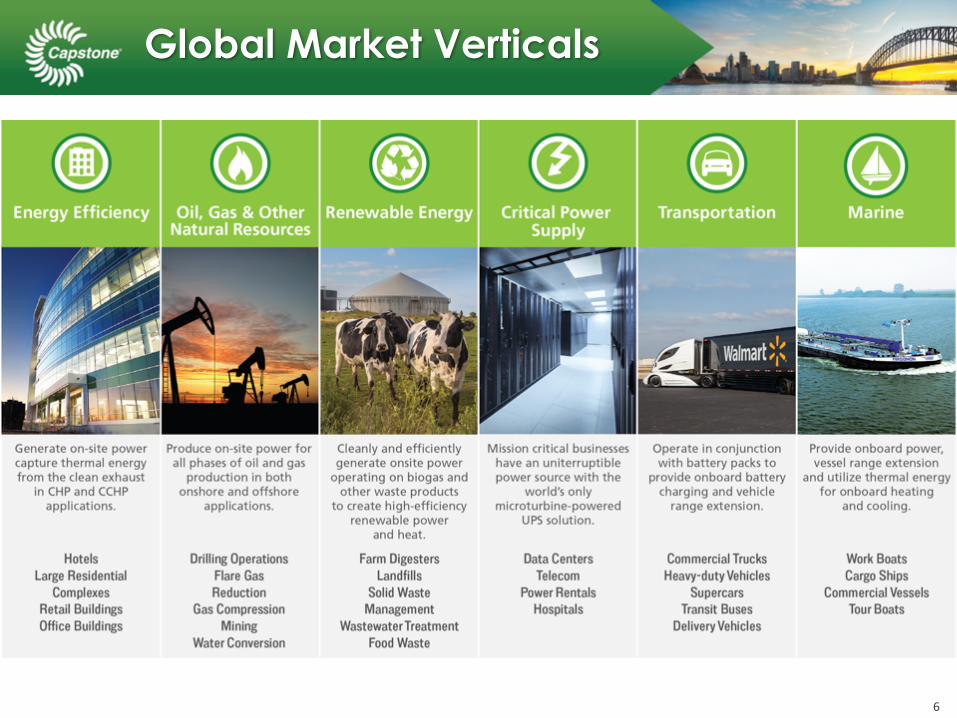
Global Market Verticals
6
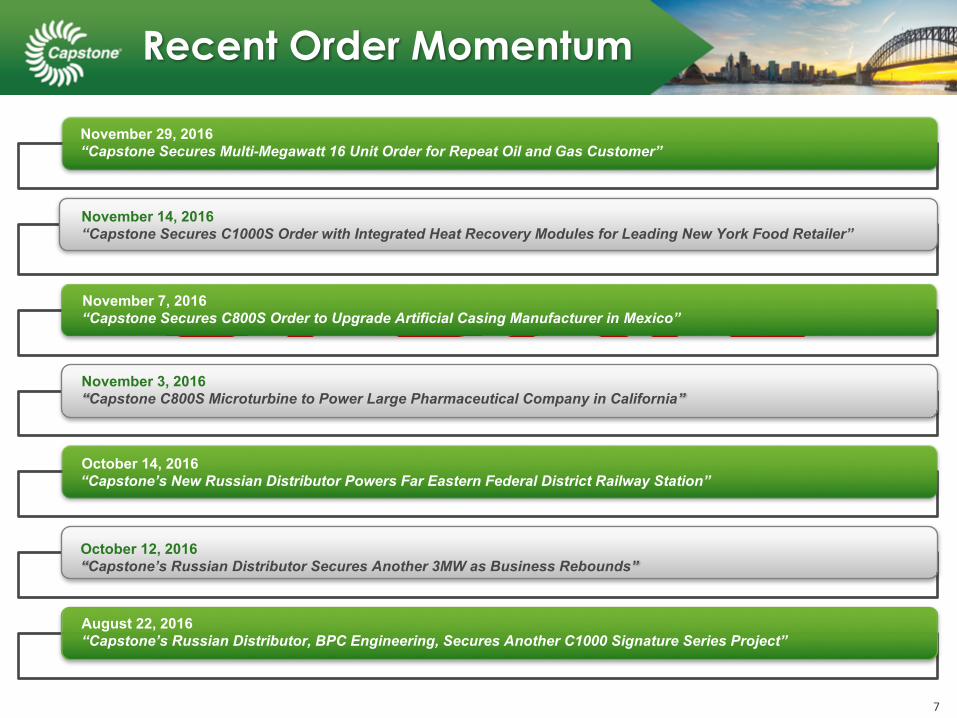
Recent Order Momentum
November 7, 2016 “Capstone Secures C800S Order to Upgrade Artificial Casing Manufacturer in Mexico”
August 22, 2016“Capstone’s Russian Distributor, BPC Engineering, Secures Another C1000 Signature Series Project”
November 3, 2016“Capstone C800S Microturbine to Power Large Pharmaceutical Company in California”
7
October 12, 2016“Capstone’s Russian Distributor Secures Another 3MW as Business Rebounds”
October 14, 2016 “Capstone’s New Russian Distributor Powers Far Eastern Federal District Railway Station”
November 14, 2016“Capstone Secures C1000S Order with Integrated Heat Recovery Modules for Leading New York Food Retailer”
November 29, 2016 “Capstone Secures Multi-Megawatt 16 Unit Order for Repeat Oil and Gas Customer”

RenewableEnergy8%
Oil,Gas&OtherNatural
Resources31%
EnergyEfficiency,61%
RenewableEnergy11% Oil,Gas&Other
NaturalResources8%
EnergyEfficiency81%
Product Shipments by Vertical Market
Six Months – FY17 Q2 – FY17
Record Energy Efficiency as a Percentage of Sales8

New C1000 Signature Series
• Relocated Engine Exhaust Stack
• 12 Year Marine Grade Paint
• Higher Inlet Fuel Temperature
• New System Control Platform
• 1.0MW Electrical Output
• 1.5MW CHP Heat Recovery
• Integrated Heat Recovery
• Two Stage Air Filtration
• Improved Enclosure Design
• Lower System Noise Level
9Focus Product on Energy Efficiency/CHP Market
February 2016 - First C600 Signature Series Delivery Minneapolis, MN

Capstone Revenue History
10
$12.6 $17.0
$24.1 $21.0
$31.3
$43.9
$61.6
$81.9
$109.4
$127.6 $133.1
$115.5
$85.2
$-
$20.0
$40.0
$60.0
$80.0
$100.0
$120.0
$140.0
$160.0
FY2004 FY2005 FY2006 FY2007 FY2008 FY2009 FY2010 FY2011 FY2012 FY2013 FY2014 FY2015 FY2016
EBITDA Breakeven Goal
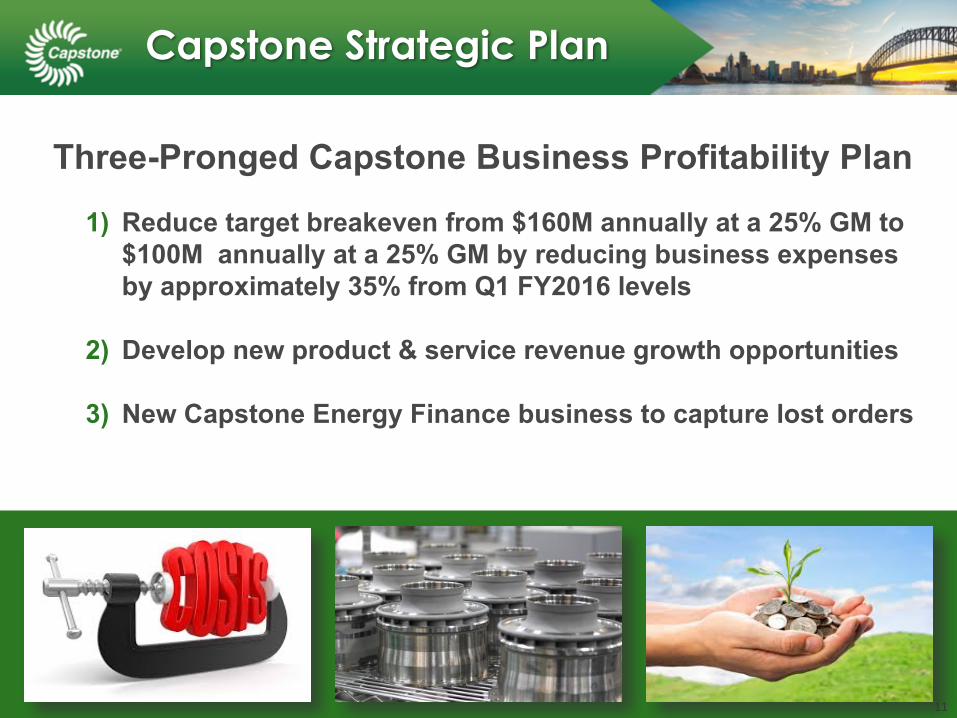
Capstone Strategic Plan
Three-Pronged Capstone Business Profitability Plan
1) Reduce target breakeven from $160M annually at a 25% GM to $100M annually at a 25% GM by reducing business expenses by approximately 35% from Q1 FY2016 levels
2) Develop new product & service revenue growth opportunities
3) New Capstone Energy Finance business to capture lost orders
11
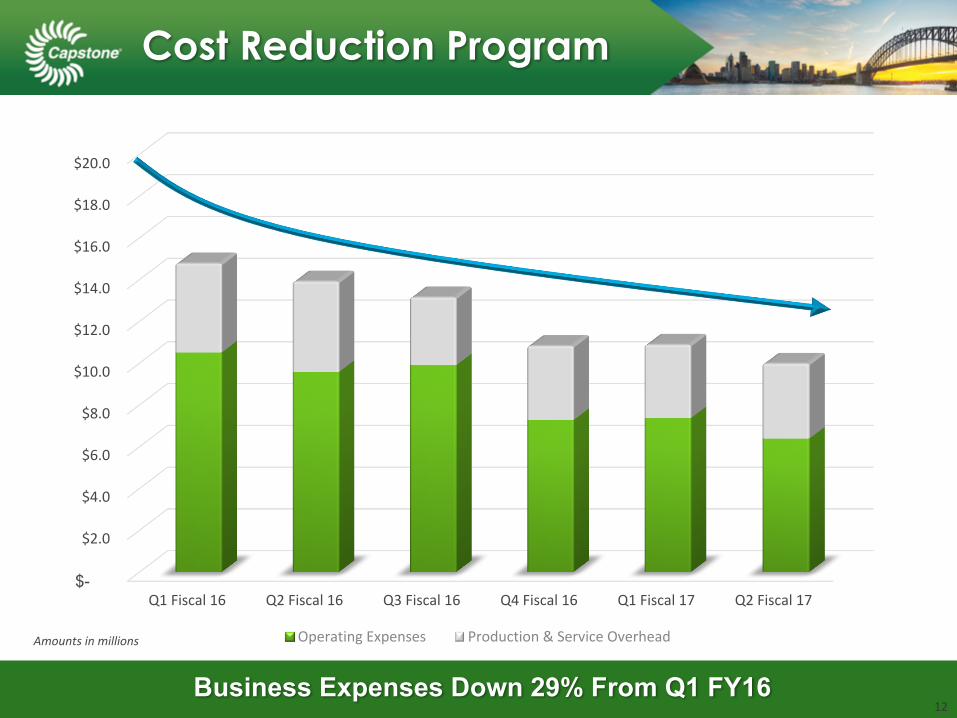
$-
$2.0
$4.0
$6.0
$8.0
$10.0
$12.0
$14.0
$16.0
$18.0
$20.0
Q1Fiscal16 Q2Fiscal16 Q3Fiscal16 Q4Fiscal16 Q1Fiscal17 Q2Fiscal17
OperatingExpenses Production&ServiceOverhead
Cost Reduction Program
Amountsinmillions
Business Expenses Down 29% From Q1 FY1612

Completed:• Enhanced top selling C1000 product line with better performance and integrated ICHP
for CHP market
• Continued growth from Service Business with improved Factory Protection Plan (FPP) program and new extended Warranty product
• Increased accessory sales with new heat recovery module (HRM) for C1000 Signature Series
• Improved market vertical diversification with more focus on CHP and Renewables
• Rebuild Russian business by continuing to support BPC and adding additional distributors in Russia and Commonwealth of Independent States (CIS)
• Sell new Signature Series upgrade kits for non-Signature Series products
In Process:• Improved geographic diversification with a heavier focus on growing the business in
Asia, Australia, Europe, Russia, the Middle East and Africa• Work with global distribution channel to add 100 new sales professionals and improve
our key performance indicators (KPIs)
New Sources of Revenue
13

$-
$0.5
$1.0
$1.5
$2.0
$2.5
Q4FY15 Q1FY16 Q2FY16 Q3FY16 Q4FY16 Q1FY17 Q2FY17
Revenue Baddebtrecovery
BPC Sales Recovery
BPCBusinessAnalysisAmountsinmillions
14

Asia&Australia,$126.7
Europe&Russia,$139.2
LatinAmerica,$214.0MEA, $112.4
US&Canada,$331.0
12 Month Pipeline of $923.3M as of Q2 FY1715
Source:CapstonedistributorsviaSalesforceAmountsinmillions
Sales Pipeline by Region

Aftermarket Service Growth• Contributing to overall gross margin
• Record FPP contract backlog
• 9,000 unit install base provides scalability
• C200/C1000 reliability improving
• Lower product warranty expense
• Improved reliability decreases FPP costs and increases customer satisfaction
• New extended Warranty Product
Global Customer Footprint• Supporting 86 Distributors/9 OEM partners in
73 countries
• 2 Capstone service centers globally
• 1,200+ units under FPP and growing
• Establishing regional remanufacturing centers to lower logistical costs and service
• Improved alignment with Sales and Aftermarket
C65 Turbine Nozzle
FPP Contract Backlog ($M)
$0$10$20$30$40$50$60$70$80$90
$35.0 FY2013
$47.2 FY2014
$61.2 FY2015
$66.5 FY2016
$71.4 Q1 FY17
$72.7Q2 FY17
16

• CEF offers PPA agreements exclusively for projects that utilize Capstone’s proven microturbine technology to deliver low-cost, clean and reliable energy to a customer’s site or facility.
• Near-term goal is to leverage up to $10M in third party equity with reasonably priced debt with “blue chip” U.S. customers.
Clean Reliable Power Today with No Upfront Cost17
Capstone Energy Finance
• Signed agreement with Sky Capital (subsidiary of Sky Solar Group) to provide up to $150M in project financing.
• Distributors lost approximately $42M in FY16 and over $50M in FY15 due to lack of financing options.

• Two PPA contracts currently in negotiations.• U.S. Distributor Training ongoing to identify
better qualified leads.• Added Dedicated Sales Resources.
• Significant progress on clearing legal and regulatory hurdles.
• Several International opportunities identified and under evaluation.
Energy Finance Joint Venture Growth
Growing Pipeline of Well-Qualified Opportunities $40M18

Reliablepowerwhenandwhereyouneedit.Cleanandsimple.
AppendixAdditional Information
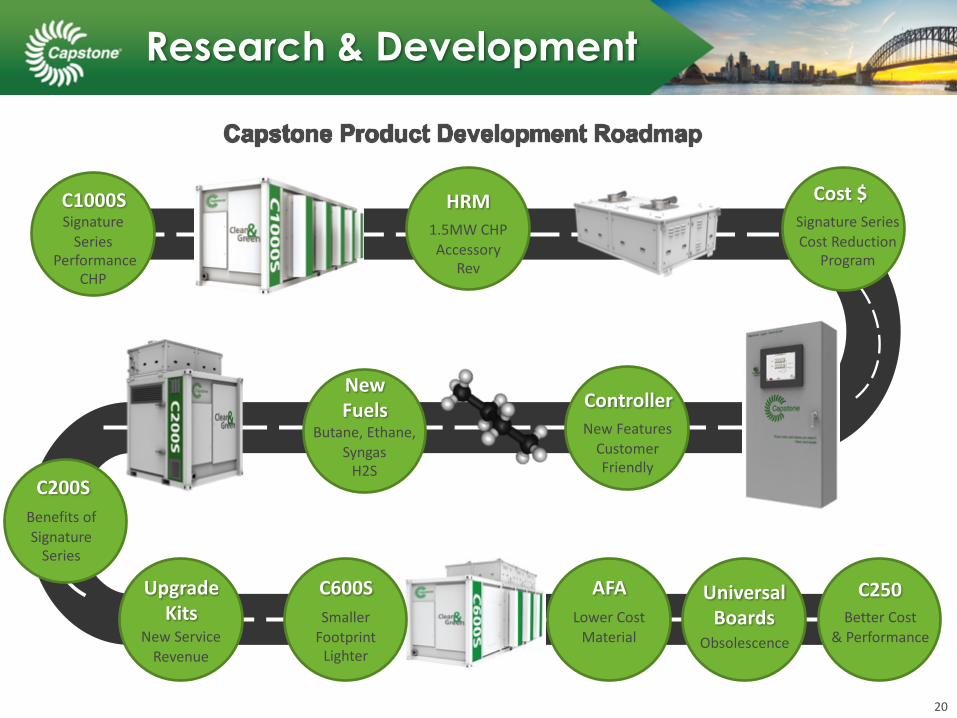
Research & Development
20
SignatureSeriesCostReduction
Program
ControllerNewFeaturesCustomerFriendly
1.5MWCHPAccessory
Rev
NewFuels
Butane,Ethane,SyngasH2S
HRMC1000SSignatureSeries
PerformanceCHP
AFALowerCostMaterial
C250BetterCost
&Performance
UniversalBoards
Obsolescence
C200SBenefitsofSignatureSeries
Cost$
C600SSmallerFootprintLighter
UpgradeKits
NewServiceRevenue

Market Cap of CPST vs. Oil Price (Brent Crude)
21
$-
$100
$200
$300
$400
$500
$600
$700
$-
$20
$40
$60
$80
$100
$120
$140
$160
NAS
DAQ:C
PSTMKT
CAP
–InM
illions
OilPricePe
rBarrel(Bren
tCrude
)
CPSTMKTCAP OilPrice(BrentCrude)

2Q In-Line With Negative Pre-Announcement. Trimming Estimates, Maintaining HOLD Rating and $1.25 Price Target
Hold –Price Target $1.25
Outperform –Price Target $1.75
Capstone Analyst Coverage
2Q17 results were largely as expected with revenues in-line with its pre-announcement and an adj. EPS miss as gross margin weakness was only partially offset by lower operating expenses and a $0.5M bad debt recovery out of Russia. It has been a tough road over the last couple years given low and volatile oil prices, market conditions in Russia, and USD strength, and this was again illustrated in 2Q with orders of $8.9M, its second lowest order quarter since 2009.
Buy –Price Target $2.00
While the shift from oil & gas to CHP has caused lumpiness in revenue timing, management reiterated its plan for profitability with revenue growth and diversification as well as continued cost cutting. The company's additional financing solutions enable a greater value proposition for its distribution network. A rebound in oil & gas markets could provide a quicker path to profitability.
Capstone reported F2Q17 revenue inline with the recent preannouncement, with EPS and adj-EBITDA slightly ahead on lower opex (which was down33% Y/Y). After a transitional year for the company, we believe management has positioned Capstone for improving performance diversifying the pipelineby both geography and customer industry verticals, which should result inimproving order capture rates. The company's tight expense controls positions Capstone well for profitability on a revenue rebound, in our view.
On November 9, 2016, CPST reported its FY2Q17 results with revenues of $15.0M compared to $17.9M in the year-ago period and $19.1M in FY1Q17. FY2Q17 gross margins were 4.5% compared to 16.0% in FY2Q16 and 16.1% in FY1Q17. Operatingexpenses for FY2Q17 were $6.4M compared to $9.6M in FY2Q16 and $7.4M in FY1Q17. Net loss for the quarter was $5.9M or ($0.19)per share, compared with a net loss of $7.9M or ($0.48) per share in the year-ago period.
Eric Stine November 10, 2016
Jeffrey OsborneNovember 10, 2016
Colin Rusch November 10, 2016
Craig IrwinNovember 10, 2016
Amit DayalNovember 10, 2016
CHP Shift Drives Less Predictable Revenue Timing; Reiterates Profitability Plan
FY2Q17 Results; Financing Facilities for Customers; Maintain Buy
CPST: F2Q17 Review; Tight Expense ControlsPosition Capstone Well for a Rebound
Perform –Price Target N/A
Neutral –Price Target $1.15
CPST posted results in line with its pre-announcement and detailed numerous opportunities for growth on its call. Of note is the increasing importance of its finance offerings, which appear to be set to impact results materially by mid-2017. We believe project delays may alleviate somewhat post-election as certain oil and gas projects begin to move forward. We would be particularly encouraged by increased Combined Heat and Power (CHP) project sales, which would signal movement in a complex end market that requires significant customer education.
CPST: F2Q17 Earnings Recap
22

www.capstoneturbine.com
NASDAQ: CPST
CAPDEC2016
Top Related