


Languages
Pages
Legal

CHAPTER 4
Nitridation
4.1 Introduction
In air or combustion atmospheres containingnitrogen, nitridation can take place under certainexposure conditions. In most cases, oxidationdominates the high-temperature corrosion re-action. However, nitridation can take place forsome alloys when oxide scales no longer provideprotection. The alloys that are particularly sus-ceptible to oxidation/nitridation attack are thosecontaining strong nitride formers, such as tita-nium and aluminum. Many high-temperaturenickel-base alloys containing both aluminum andtitanium are strengthened by γ′ phase, Ni3(Al,Ti).For these alloys, nitridation by forming internalnitrides of aluminum and titanium can deplete thesurface layer with aluminum and titanium, thusweakening the alloy. Under a high-velocity com-bustion gas stream with severe thermal cycling,similar to the conditions in “flying” gas turbines(aircraft engines), nitridation can be particularlysevere in oxidation/nitridation attack.
In nitrogen-base atmospheres, such as N2 orN2-H2, metals and alloys can also suffer nitri-dation attack. This type of atmosphere is oftenused as a protective atmosphere in heat treatingand sintering operations. Molecular nitrogen canbe severely nitriding for many metals and alloys,particularly when temperatures are sufficientlyhigh.
Ammonia (NH3) is a commonly used nitridinggas for case hardening at temperatures from500 to 590 °C (925 to 1100 °F) (Ref 1). Furnaceequipment and components repeatedly subjectedto these service conditions frequently sufferbrittle failures as a result of nitridation attack.Carbonitriding is another important method ofcase hardening that produces a surface layer ofboth nitrides and carbides. The process is typi-cally carried out at 700 to 900 °C (1300 to 1650 °F) in ammonia, with additions of carbonaceousgases, such as CH4 (Ref 2). Thus, the heat treatretort, fixtures, and other furnace equipment aresubject to both nitridation and carburization.
Cracked ammonia (i.e., ammonia that is com-pletely dissociated into H2 and N2) provides aneconomical protective atmosphere for processingmetals and alloys. Many bright annealing opera-tions for stainless steels use a protective atmo-sphere consisting of N2 and H2, generated bydissociation of ammonia. With three parts H2and one part N2 produced in cracked ammonia,nitridation is less critical for the heat treatingequipment.
In the chemical processing industry, nitridingenvironments are generated by processes em-ployed for production of ammonia, nitric acid,melamine, and nylon 6-6 (Ref 3, 4). Ammonia isproduced by reacting nitrogen with hydrogenover a catalyst at temperatures of typically 500to 550 °C (930 to 1020 °F) and pressures of 200and 400 atm. Commercial processes for ammo-nia synthesis are discussed in detail in Ref 5. Theconverter, where the ammonia synthesis reactiontakes place, may suffer nitridation attack. Brittlefailure of the welds for the waste heat boiler ofan ammonia plant has been reported by Van derHorst (Ref 6). These tube-to-tube sheet weldswere high-nickel alloy 182, which sufferednitridation attack.
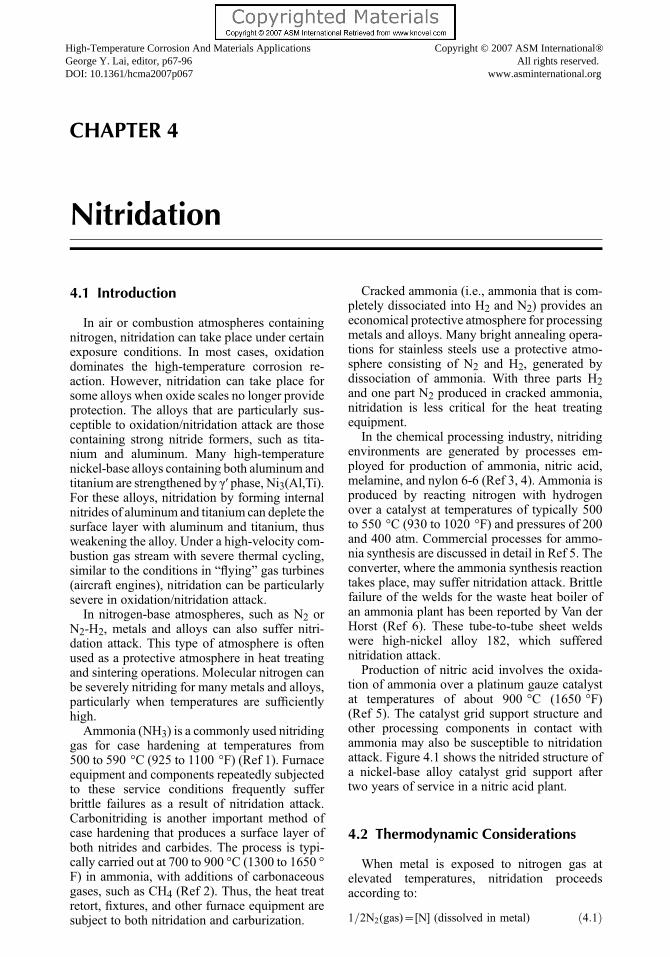
Production of nitric acid involves the oxida-tion of ammonia over a platinum gauze catalystat temperatures of about 900 °C (1650 °F)(Ref 5). The catalyst grid support structure andother processing components in contact withammonia may also be susceptible to nitridationattack. Figure 4.1 shows the nitrided structure ofa nickel-base alloy catalyst grid support aftertwo years of service in a nitric acid plant.
4.2 Thermodynamic Considerations
When metal is exposed to nitrogen gas atelevated temperatures, nitridation proceedsaccording to:
1=2N2(gas)=[N] (dissolved in metal) ð4:1Þ
High-Temperature Corrosion And Materials ApplicationsGeorge Y. Lai, editor, p67-96DOI: 10.1361/hcma2007p067
Copyright © 2007 ASM International®All rights reserved.
www.asminternational.org
[%N] = k(pN2 )1=2 ð4:2Þ
where k is the equilibrium constant and pN2 is thepartial pressure of N2 in the atmosphere.
In nitrogen-base atmospheres, the nitridingpotential is proportional to (pN2)
1=2. Increasingthe nitrogen partial pressure (or nitrogen con-centration) increases the thermodynamic poten-tial for nitridation. Molecular nitrogen is lessaggressive than ammonia in terms of nitridationof metals. However, when metal is heated toexcessively high temperatures (e.g., 1000 °C(1830 °F) or higher), nitridation by molecularnitrogen can become a serious material issue.
Under oxidation/nitridation conditions, nitro-gen molecules permeate through cracks andpores and reach the metal underneath the oxidescales when the oxide scale is no longer protec-tive. Nitridation then proceeds by dissociation of
nitrogen molecules and absorption of nitrogenatoms by the metal following Reaction 4.1.Nitridation often takes place in the metal at thevicinity of cracks developed under creep condi-tions in air or N2-containing combustion atmo-spheres. In this case, oxides are often associatedwith the crack under creep deformation in air.Oxidation consumes the oxygen molecules fromair, which penetrates into the crack, thus deplet-ing oxygen and increasing nitrogen potential(or concentration) around the crack. As a result,nitridation takes place in the vicinity of the creepcrack.
When the environment is ammonia (NH3) orcontainsNH3,metals or alloysmay undergo rapidnitridation reactions. It is precisely for this reasonthat NH3 is frequently used for case hardening.Ammonia is metastable and dissociates intomolecular N2 and molecular H2 when heated toelevated temperatures. Once NH3 is completelydissociated into N2 andH2, the nitriding potentialis defined by Reaction 4.3. To increase nitrogenabsorption by steel, molecular NH3 should beallowed to dissociate on the steel surface, thusallowing dissociated atomic nitrogen to be dis-solved at the metal surface (Ref 7, 8). Thus, toincrease nitridation reactions, it is necessary tobring as much fresh, uncracked NH3 as possiblein contact with the surface of the metal to mini-mize the production of molecular nitrogen.At temperatures below 600 °C (1110 °F) and athigh gas flow rates, the production of nitrogenis minimized and the nitrogen solubility at thesurface of iron is determined by (Ref 8):
NH3 $ 3=2 H2+[N] (dissolved in Fe) ð4:3Þ
[%N]=k(pNH3=(pH2 ))3=2 ð4:4Þ
where k is the equilibrium constant, and pNH3 ,and pH2 are partial pressures of NH3 and H2,respectively.
The nitriding potential is proportional topNH3=( pH2)
3=2. Increasing ammonia partialpressure (or concentration) in the atmosphereincreases the thermodynamic potential for nitri-dation. When nitrogen in the metal exceeds itssolubility limit, nitrides will then precipitateout. The nitrides of important alloying elementsfor engineering alloys are tabulated in Table 4.1(Ref 9). For iron, nickel, and cobalt, three im-portant alloy bases for high-temperature alloys,only iron forms stable nitrides. No nitrides ofnickel and cobalt have been reported. Therelative stabilities among various nitrides can
(a)
(b)
100 μm
100 μm
Fig. 4.1 Alloy X (Ni-22Cr-18.5Fe-9Mo-0.6W) catalyst gridsupport structure bar after 2 years of service in a nitric
acid plant. (a) Internal nitride precipitates (about 20 mils in depth)containing mainly chromium-rich nitrides along with some car-bides formed during thermal aging. (b) Microstructure in theunaffected interior containing mainly carbides due to thermalaging at the service temperature
68 / High-Temperature Corrosion and Materials Applications
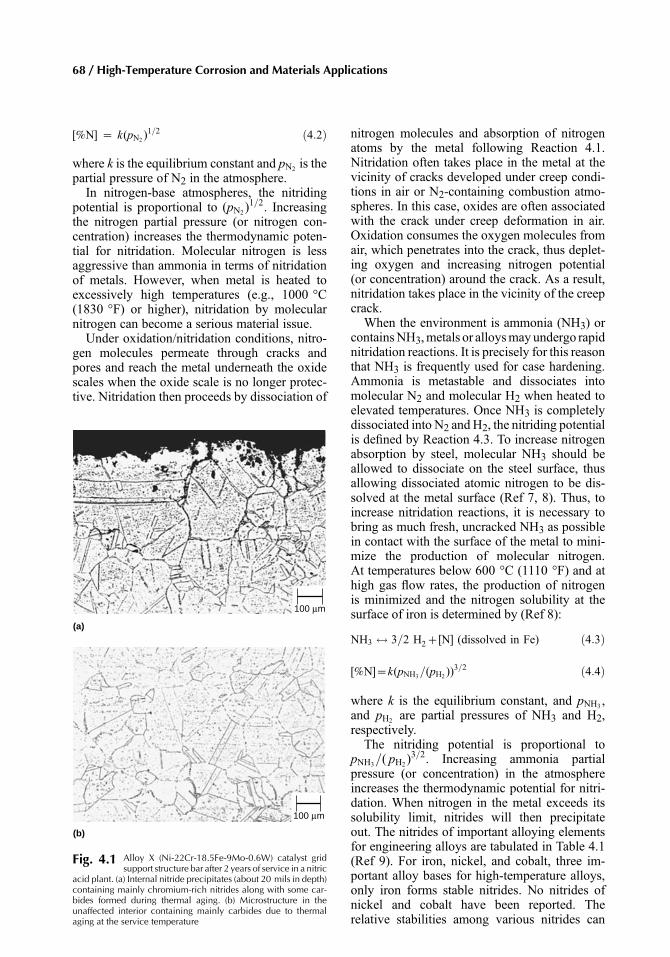
be compared in terms of their free energies offormation, as illustrated in Fig. 4.2 (Ref 10).Physical-chemical properties of some of thesenitrides can be found in Ref 9. The types ofnitrides that are likely to form in the alloy canbe predicted by examining the phase-stabilitydiagram. Figure 4.3 shows a phase-stabilitydiagram of Fe-18Cr-Ni-N system at 900 °C(1650 °F), indicating phase regions of Cr2Nin γ (or α+γ) phase as a function of nickeland nitrogen contents (Ref 11). Nitride phasesformed in alloys are also dependent on nitrogenpartial pressure ( pN2 ), as shown in Fig. 4.4 forNi-Cr-N system at 1000 °C (1830 °F) (Ref 12).
Nitrogen solubility in the alloy is important inaffecting the nitridation resistance of the alloy.Table 4.2 summarizes some nitrogen solubilitydata for iron, stainless steels, and nickel alloy(Ref 13–18). Iron and stainless steels exhibitsignificantly higher nitrogen solubility than anickel-base alloy (Ni-20Fe). Nickel has beenfound to decrease the nitrogen solubility in Fe-Ni
alloys with nickel ranging from 0 to 35%(Ref 19). In Fe-18Cr-Ni-N system, increasingnickel reduces the solubility of nitrogen, asshown in Fig. 4.3 (Ref 11). It is also shown inTable 4.2 that the solubility of nitrogen in stain-less steels increased with increasing temperature.Alloys with higher nitrogen solubilities generallyexhibit less resistance to nitridation attack.
2 Fe4N
2 Mo 2N
2 CrN
2 Cr 2N
1/2 Si 3N
4
Ca 3N 2 2
VN
Mg 3
N 2
2 TaN
2 BN
2 NbN
2 AIN
2 TiN
2 ZrN
2 NH 3
+10
0
–10
–20
–30
–40
–50
–60
–70
–80
–90
–100
–110
–120
–130
–140
0 500 1000
2M + N2 = 2MN
Temperature, °C
ΔG°,
Kca
l
1500 2000
Fig. 4.2 Standard free energy of formation for selectednitrides. Source: Ref 10
20
10
00 0.1
α + γ
α
γ
α + γ + Cr2N
γ + Cr2N
0.2
Nitrogen, %
Nic
kel,
%
0.3 0.4
Fig. 4.3 Phase stability diagram for Fe-18Cr-Ni-N system at900 °C (1650 °F). Source: Ref 11
Table 4.1 Nitrides of important alloyingelements for engineering alloysElement Nitrides
Iron Fe4N Fe2NChromium CrN Cr2NMolybdenum MoN Mo2NTungsten WN W2NAluminum AlNTitanium TiN Ti2NNiobium NbN Nb2N Nb4N3
Tantalum TaN Ta2N Ta3N5
Zirconium ZrNHafnium HfN Hf3N2 Hf4N3
Silicon Si3N4
Vanadium VN V2NBoron BNManganese Mn4N Mn2N Mn3NMagnesium Mg3N
Source: Ref 9102
γ + CrN
γ + Cr2N
γ + π
γ + α
γ
10
1000 °C(1830 °F)
1
0.1
10–2
10–3
10–40 10 20
Cr concentration, wt %
N2
part
ial p
ress
ure,
bar
30 40 50 60
Fig. 4.4 Phase stability diagram for the Ni-Cr-N system as afunction of N2 partial pressure at 1000 °C (1830 °F).
Source: Ref 12
Chapter 4: Nitridation / 69
4.3 Internal Nitridation in OxidizingEnvironments
In air or oxidizing combustion environments,oxidation usually dominates high-temperaturecorrosion reactions. However, under certainconditions, alloys can suffer internal nitridationattack along with oxidation. Internal nitridationattack, when it occurs, can penetrate fartherinto the metal interior than oxidation, thus sig-nificantly affecting the creep-rupture behaviorof the alloy by accelerating the creep crackgrowth. Discussion of internal nitridation underno external stresses and under creep conditionsis presented in sections 4.3.1 and 4.3.2.
4.3.1 Internal Nitridation in Air underNo External Stress
Some high-temperature alloys that containstrong nitride formers such as aluminum andtitanium can suffer internal nitridation even in airenvironments. In an air oxidation study for twonickel-base alloys, IN939 (Ni-22Cr-20Co-3.8Ti-1.4Al-2W-1Nb-1.3Ta) and IN738LC (Ni-16Cr-9Co-3.5Ti-3.3Al-1.8Mo-1Nb-1.8Ta) at 700,900, and 1100 °C (1290, 1650, and 2010 °F).Litz et al. (Ref 20) observed internal titaniumnitrides (needle shape) formed in front of internalaluminum oxides that formed underneath theexternal oxide scales. In an oxidation study ofalloy 800HT (Fe-21Cr-32Ni-0.5Al-0.5Ti) in airat 980 °C (1800 °F) for about 2 years (720 days),Harper et al. (Ref 21) observed Widmanstättenacicular chromium-rich nitrides along withaluminum nitrides that formed below chromium-rich oxides. Lai (Ref 22) observed internalaluminum nitrides (needle shape) that formed
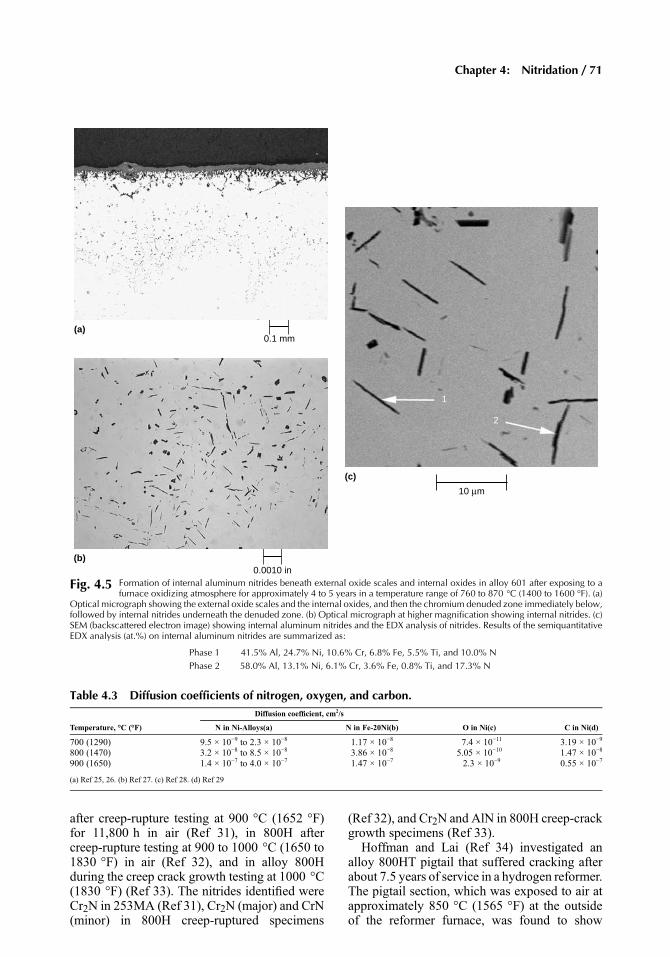
underneath the external oxide scale and internaloxides in alloy 601 exposed to a furnace oxi-dizing atmosphere for about 4 to 5 years attemperatures probably between 760 and 870 °C(1400 and 1600 °F), as shown in Fig. 4.5.
Severe thermal cycling that causes crackingand spalling of oxide scales can also result insevere internal nitridation. Han and Young (Ref23) conducted cyclic oxidation tests by heatingthe specimens to 1100 °C (2010 °F) in still airfor 1 h followed by cooling to room temperaturefor 15 min then repeating the cycle again for 260cycles. The alloys investigated were Ni-24 to38%Cr-14 to 25%Al. The specimens sufferedsevere oxide scale spallation. The internal nitri-dation attack was found to be extensive, and thenitridation zone consisted of AlN beneath Cr2O3and Al2O3, then AlN+Cr2N, and then AlN in thedeepest region (Ref 23).
Douglas (Ref 24) indicated that the diffusivityof nitrogen appears to be two orders of magni-tude greater than that of oxygen in nickel ornickel alloys. Table 4.3 summarizes the diffusioncoefficients of nitrogen in nickel and iron alloyscompared with those of oxygen and carbon innickel, based on the diffusivity data from Rublyand Douglas (Ref 25, 26), Grabke and Peterson(Ref 27), Park and Alstetter (Ref 28), and Gruzinet al. (Ref 29). The diffusivity of nitrogen is alsoon the same order of magnitude as that of carbonas shown in Table 4.3. It is thus not surprising tofind internal nitrides were advancing in front ofinternal oxides.
4.3.2 Internal Nitridation at Creep Cracksin Air Environment
During creep testing in air, extensive internalnitridation can develop in the vicinity of cracks.Brickner et al. (Ref 30) found that types 302,304, and 310 stainless steels showed significantnitridation after creep-rupture testing in air at870 °C (1600 °F) in less than 1000 h. Acicularnitrides (believed to be chromium nitrides) ina Widmanstätten pattern were found to formextensively in the vicinity of microcracks, asshown in Fig. 4.6 (Ref 30). Extensive nitridationwas confirmed by the chemical analysis of thetested specimens for nitrogen, which showedthe nitrogen content was increased from about0.058% before testing to 0.30 to 0.53% aftercreep-rupture testing (Ref 30). Extensive internalnitrides were also observed in the vicinity ofcreep cracks in alloy 253MA (Fe-21Cr-11Ni)
Table 4.2 Nitrogen solubility inmetals and alloys
Nitrogen, wt% Metal or alloyTemperature,
°C (°F) Ref
0.06 α-Fe 502 (936) 130.26 max γFe γ region of Fe-C 140.02 (at pN2 : 1 atm) Fe-10%Ni 1000 (1832) 150.125 Type 304 538 (1000) 160.177 Type 304 593 (1100) 170.190 Type 304 927 (1700) 170.258 Type 304 954 (1749) 170.281 Type 304 981 (1800) 170.18 Fe-18Cr-12Ni-2Ti 985 (1805) 180.18 Fe-18Cr-12Ni-2Ti 1040 (1905) 180.21 Fe-18Cr-12Ni-2Ti 1093 (2000) 180.26 Fe-18Cr-12Ni-2Ti 1150 (2100) 180.26 Fe-18Cr-12Ni-2Ti 1210 (2210) 180.0001 (at pN2 : 1 atm) Ni-20%Fe 1000 (1832) 15
70 / High-Temperature Corrosion and Materials Applications
after creep-rupture testing at 900 °C (1652 °F)for 11,800 h in air (Ref 31), in 800H aftercreep-rupture testing at 900 to 1000 °C (1650 to1830 °F) in air (Ref 32), and in alloy 800Hduring the creep crack growth testing at 1000 °C(1830 °F) (Ref 33). The nitrides identified wereCr2N in 253MA (Ref 31), Cr2N (major) and CrN(minor) in 800H creep-ruptured specimens
(Ref 32), and Cr2N and AlN in 800H creep-crackgrowth specimens (Ref 33).
Hoffman and Lai (Ref 34) investigated analloy 800HT pigtail that suffered cracking afterabout 7.5 years of service in a hydrogen reformer.The pigtail section, which was exposed to air atapproximately 850 °C (1565 °F) at the outsideof the reformer furnace, was found to show
1
2
(c)
10 μm
0.1 mm(a)
(b)0.0010 in
Fig. 4.5 Formation of internal aluminum nitrides beneath external oxide scales and internal oxides in alloy 601 after exposing to afurnace oxidizing atmosphere for approximately 4 to 5 years in a temperature range of 760 to 870 °C (1400 to 1600 °F). (a)
Optical micrograph showing the external oxide scales and the internal oxides, and then the chromium denuded zone immediately below,followed by internal nitrides underneath the denuded zone. (b) Optical micrograph at higher magnification showing internal nitrides. (c)SEM (backscattered electron image) showing internal aluminum nitrides and the EDX analysis of nitrides. Results of the semiquantitativeEDX analysis (at.%) on internal aluminum nitrides are summarized as:
Phase 1 41.5% Al, 24.7% Ni, 10.6% Cr, 6.8% Fe, 5.5% Ti, and 10.0% NPhase 2 58.0% Al, 13.1% Ni, 6.1% Cr, 3.6% Fe, 0.8% Ti, and 17.3% N
Table 4.3 Diffusion coefficients of nitrogen, oxygen, and carbon.Diffusion coefficient, cm2/s
Temperature, °C (°F) N in Ni-Alloys(a) N in Fe-20Ni(b) O in Ni(c) C in Ni(d)
700 (1290) 9.5 × 10⁻⁹ to 2.3 × 10⁻⁸ 1.17 × 10⁻⁸ 7.4 × 10⁻¹¹ 3.19 × 10⁻⁹
800 (1470) 3.2 × 10⁻⁸ to 8.5 × 10⁻⁸ 3.86 × 10⁻⁸ 5.05 × 10⁻¹⁰ 1.47 × 10⁻⁸
900 (1650) 1.4 × 10⁻⁷ to 4.0 × 10⁻⁷ 1.47 × 10⁻⁷ 2.3 × 10⁻⁹ 0.55 × 10⁻⁷
(a) Ref 25, 26. (b) Ref 27. (c) Ref 28. (d) Ref 29
Chapter 4: Nitridation / 71
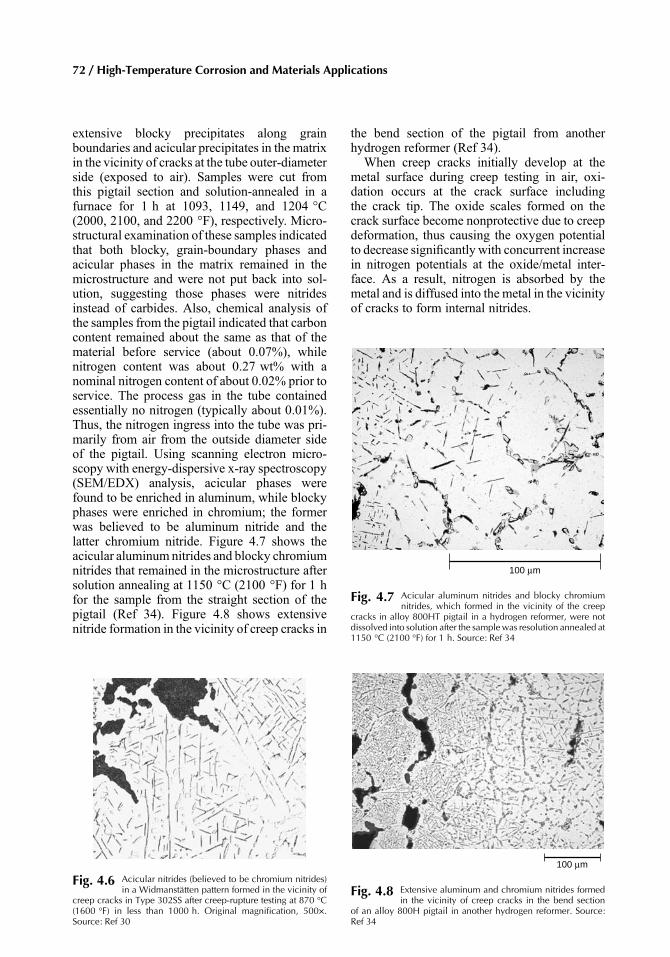
extensive blocky precipitates along grainboundaries and acicular precipitates in the matrixin the vicinity of cracks at the tube outer-diameterside (exposed to air). Samples were cut fromthis pigtail section and solution-annealed in afurnace for 1 h at 1093, 1149, and 1204 °C(2000, 2100, and 2200 °F), respectively. Micro-structural examination of these samples indicatedthat both blocky, grain-boundary phases andacicular phases in the matrix remained in themicrostructure and were not put back into sol-ution, suggesting those phases were nitridesinstead of carbides. Also, chemical analysis ofthe samples from the pigtail indicated that carboncontent remained about the same as that of thematerial before service (about 0.07%), whilenitrogen content was about 0.27 wt% with anominal nitrogen content of about 0.02% prior toservice. The process gas in the tube containedessentially no nitrogen (typically about 0.01%).Thus, the nitrogen ingress into the tube was pri-marily from air from the outside diameter sideof the pigtail. Using scanning electron micro-scopy with energy-dispersive x-ray spectroscopy(SEM/EDX) analysis, acicular phases werefound to be enriched in aluminum, while blockyphases were enriched in chromium; the formerwas believed to be aluminum nitride and thelatter chromium nitride. Figure 4.7 shows theacicular aluminum nitrides and blocky chromiumnitrides that remained in the microstructure aftersolution annealing at 1150 °C (2100 °F) for 1 hfor the sample from the straight section of thepigtail (Ref 34). Figure 4.8 shows extensivenitride formation in the vicinity of creep cracks in
the bend section of the pigtail from anotherhydrogen reformer (Ref 34).
When creep cracks initially develop at themetal surface during creep testing in air, oxi-dation occurs at the crack surface includingthe crack tip. The oxide scales formed on thecrack surface become nonprotective due to creepdeformation, thus causing the oxygen potentialto decrease significantly with concurrent increasein nitrogen potentials at the oxide/metal inter-face. As a result, nitrogen is absorbed by themetal and is diffused into the metal in the vicinityof cracks to form internal nitrides.
Fig. 4.6 Acicular nitrides (believed to be chromium nitrides)in a Widmanstätten pattern formed in the vicinity of
creep cracks in Type 302SS after creep-rupture testing at 870 °C(1600 °F) in less than 1000 h. Original magnification, 500×.Source: Ref 30
100 μm
Fig. 4.7 Acicular aluminum nitrides and blocky chromiumnitrides, which formed in the vicinity of the creep
cracks in alloy 800HT pigtail in a hydrogen reformer, were notdissolved into solution after the samplewas resolution annealed at1150 °C (2100 °F) for 1 h. Source: Ref 34
100 μm
Fig. 4.8 Extensive aluminum and chromium nitrides formedin the vicinity of creep cracks in the bend section
of an alloy 800H pigtail in another hydrogen reformer. Source:Ref 34
72 / High-Temperature Corrosion and Materials Applications
4.3.3 Oxidation and Nitridation inCombustion Atmospheres
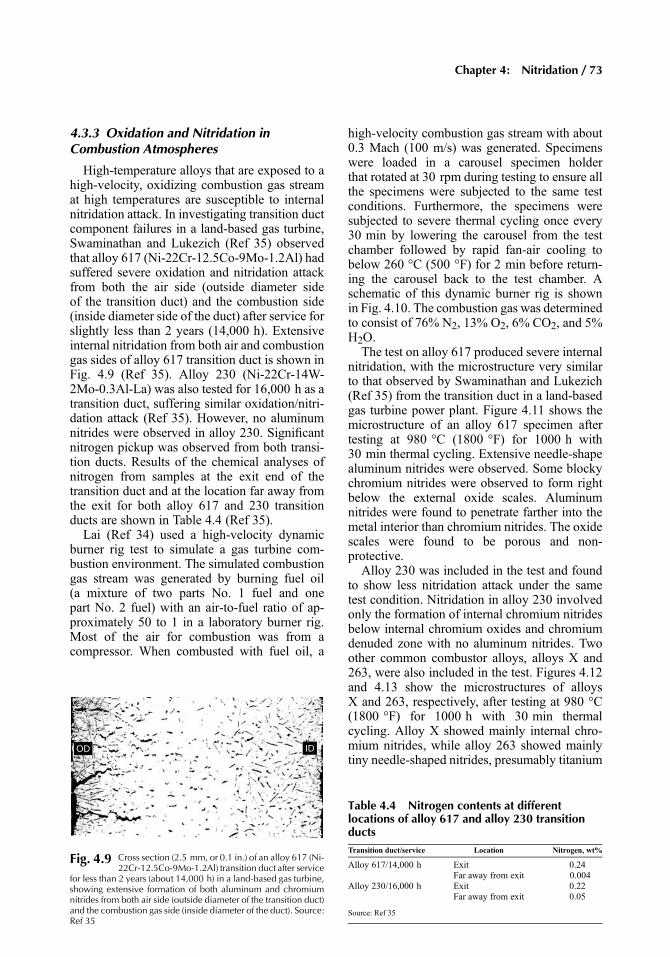
High-temperature alloys that are exposed to ahigh-velocity, oxidizing combustion gas streamat high temperatures are susceptible to internalnitridation attack. In investigating transition ductcomponent failures in a land-based gas turbine,Swaminathan and Lukezich (Ref 35) observedthat alloy 617 (Ni-22Cr-12.5Co-9Mo-1.2Al) hadsuffered severe oxidation and nitridation attackfrom both the air side (outside diameter sideof the transition duct) and the combustion side(inside diameter side of the duct) after service forslightly less than 2 years (14,000 h). Extensiveinternal nitridation from both air and combustiongas sides of alloy 617 transition duct is shown inFig. 4.9 (Ref 35). Alloy 230 (Ni-22Cr-14W-2Mo-0.3Al-La) was also tested for 16,000 h as atransition duct, suffering similar oxidation/nitri-dation attack (Ref 35). However, no aluminumnitrides were observed in alloy 230. Significantnitrogen pickup was observed from both transi-tion ducts. Results of the chemical analyses ofnitrogen from samples at the exit end of thetransition duct and at the location far away fromthe exit for both alloy 617 and 230 transitionducts are shown in Table 4.4 (Ref 35).
Lai (Ref 34) used a high-velocity dynamicburner rig test to simulate a gas turbine com-bustion environment. The simulated combustiongas stream was generated by burning fuel oil(a mixture of two parts No. 1 fuel and onepart No. 2 fuel) with an air-to-fuel ratio of ap-proximately 50 to 1 in a laboratory burner rig.Most of the air for combustion was from acompressor. When combusted with fuel oil, a
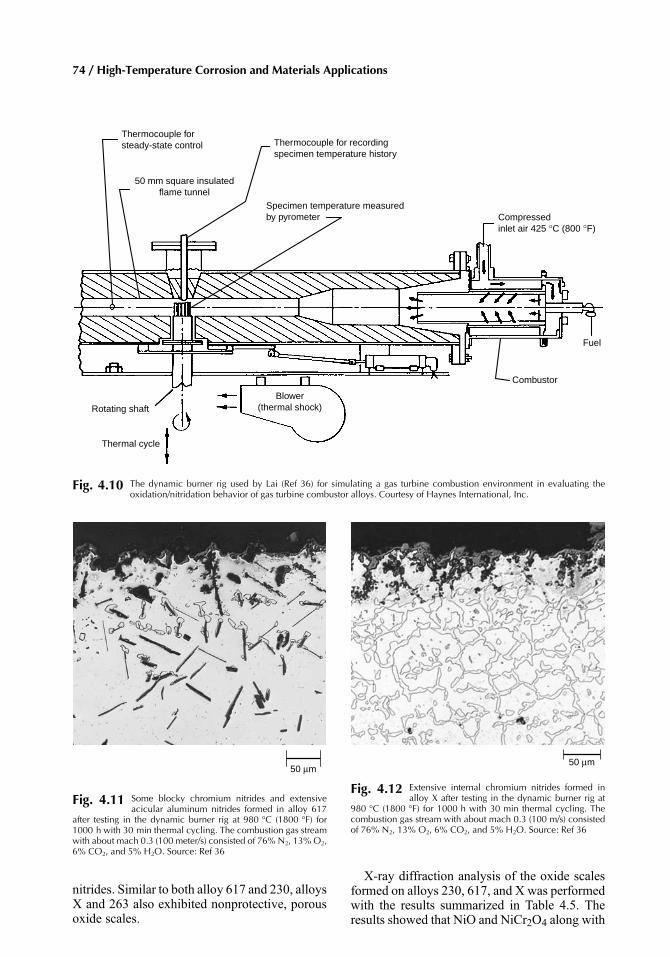
high-velocity combustion gas stream with about0.3 Mach (100 m/s) was generated. Specimenswere loaded in a carousel specimen holderthat rotated at 30 rpm during testing to ensure allthe specimens were subjected to the same testconditions. Furthermore, the specimens weresubjected to severe thermal cycling once every30 min by lowering the carousel from the testchamber followed by rapid fan-air cooling tobelow 260 °C (500 °F) for 2 min before return-ing the carousel back to the test chamber. Aschematic of this dynamic burner rig is shownin Fig. 4.10. The combustion gas was determinedto consist of 76% N2, 13% O2, 6% CO2, and 5%H2O.
The test on alloy 617 produced severe internalnitridation, with the microstructure very similarto that observed by Swaminathan and Lukezich(Ref 35) from the transition duct in a land-basedgas turbine power plant. Figure 4.11 shows themicrostructure of an alloy 617 specimen aftertesting at 980 °C (1800 °F) for 1000 h with30 min thermal cycling. Extensive needle-shapealuminum nitrides were observed. Some blockychromium nitrides were observed to form rightbelow the external oxide scales. Aluminumnitrides were found to penetrate farther into themetal interior than chromium nitrides. The oxidescales were found to be porous and non-protective.
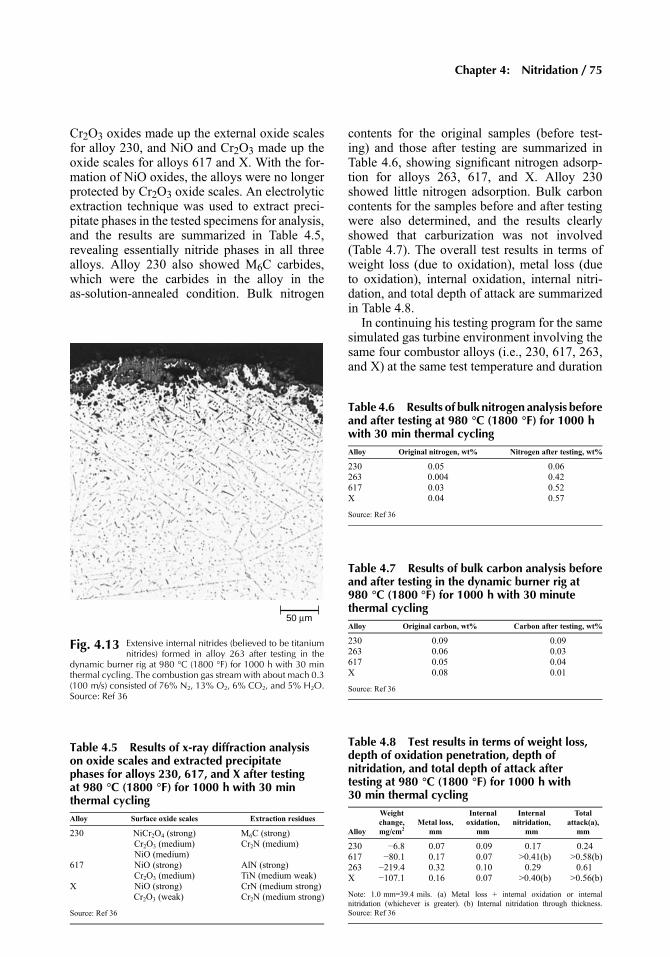
Alloy 230 was included in the test and foundto show less nitridation attack under the sametest condition. Nitridation in alloy 230 involvedonly the formation of internal chromium nitridesbelow internal chromium oxides and chromiumdenuded zone with no aluminum nitrides. Twoother common combustor alloys, alloys X and263, were also included in the test. Figures 4.12and 4.13 show the microstructures of alloysX and 263, respectively, after testing at 980 °C(1800 °F) for 1000 h with 30 min thermalcycling. Alloy X showed mainly internal chro-mium nitrides, while alloy 263 showed mainlytiny needle-shaped nitrides, presumably titanium
OD ID
Fig. 4.9 Cross section (2.5 mm, or 0.1 in.) of an alloy 617 (Ni-22Cr-12.5Co-9Mo-1.2Al) transition duct after service
for less than 2 years (about 14,000 h) in a land-based gas turbine,showing extensive formation of both aluminum and chromiumnitrides from both air side (outside diameter of the transition duct)and the combustion gas side (inside diameter of the duct). Source:Ref 35
Table 4.4 Nitrogen contents at differentlocations of alloy 617 and alloy 230 transitionductsTransition duct/service Location Nitrogen, wt%
Alloy 617/14,000 h Exit 0.24Far away from exit 0.004
Alloy 230/16,000 h Exit 0.22Far away from exit 0.05
Source: Ref 35
Chapter 4: Nitridation / 73
nitrides. Similar to both alloy 617 and 230, alloysX and 263 also exhibited nonprotective, porousoxide scales.
X-ray diffraction analysis of the oxide scalesformed on alloys 230, 617, and X was performedwith the results summarized in Table 4.5. Theresults showed that NiO and NiCr2O4 along with
Thermocouple forsteady-state control
50 mm square insulatedflame tunnel
Thermocouple for recordingspecimen temperature history
Specimen temperature measuredby pyrometer Compressed
inlet air 425 °C (800 °F)
Fuel
Combustor
Blower(thermal shock)Rotating shaft
Thermal cycle
Fig. 4.10 The dynamic burner rig used by Lai (Ref 36) for simulating a gas turbine combustion environment in evaluating theoxidation/nitridation behavior of gas turbine combustor alloys. Courtesy of Haynes International, Inc.
50 μm
Fig. 4.12 Extensive internal chromium nitrides formed inalloy X after testing in the dynamic burner rig at
980 °C (1800 °F) for 1000 h with 30 min thermal cycling. Thecombustion gas stream with about mach 0.3 (100 m/s) consistedof 76% N2, 13% O2, 6% CO2, and 5% H2O. Source: Ref 36
50 μm
Fig. 4.11 Some blocky chromium nitrides and extensiveacicular aluminum nitrides formed in alloy 617
after testing in the dynamic burner rig at 980 °C (1800 °F) for1000 h with 30 min thermal cycling. The combustion gas streamwith about mach 0.3 (100 meter/s) consisted of 76% N2, 13%O2,6% CO2, and 5% H2O. Source: Ref 36
74 / High-Temperature Corrosion and Materials Applications
Cr2O3 oxides made up the external oxide scalesfor alloy 230, and NiO and Cr2O3 made up theoxide scales for alloys 617 and X. With the for-mation of NiO oxides, the alloys were no longerprotected by Cr2O3 oxide scales. An electrolyticextraction technique was used to extract preci-pitate phases in the tested specimens for analysis,and the results are summarized in Table 4.5,revealing essentially nitride phases in all threealloys. Alloy 230 also showed M6C carbides,which were the carbides in the alloy in theas-solution-annealed condition. Bulk nitrogen
contents for the original samples (before test-ing) and those after testing are summarized inTable 4.6, showing significant nitrogen adsorp-tion for alloys 263, 617, and X. Alloy 230showed little nitrogen adsorption. Bulk carboncontents for the samples before and after testingwere also determined, and the results clearlyshowed that carburization was not involved(Table 4.7). The overall test results in terms ofweight loss (due to oxidation), metal loss (dueto oxidation), internal oxidation, internal nitri-dation, and total depth of attack are summarizedin Table 4.8.
In continuing his testing program for the samesimulated gas turbine environment involving thesame four combustor alloys (i.e., 230, 617, 263,and X) at the same test temperature and duration
50 μm
Fig. 4.13 Extensive internal nitrides (believed to be titaniumnitrides) formed in alloy 263 after testing in the
dynamic burner rig at 980 °C (1800 °F) for 1000 h with 30 minthermal cycling. The combustion gas stream with about mach 0.3(100 m/s) consisted of 76% N2, 13% O2, 6% CO2, and 5% H2O.Source: Ref 36
Table 4.5 Results of x-ray diffraction analysison oxide scales and extracted precipitatephases for alloys 230, 617, and X after testingat 980 °C (1800 °F) for 1000 h with 30 minthermal cyclingAlloy Surface oxide scales Extraction residues
230 NiCr2O4 (strong) M6C (strong)Cr2O3 (medium) Cr2N (medium)NiO (medium)
617 NiO (strong) AlN (strong)Cr2O3 (medium) TiN (medium weak)
X NiO (strong) CrN (medium strong)Cr2O3 (weak) Cr2N (medium strong)
Source: Ref 36
Table 4.6 Results of bulk nitrogen analysis beforeand after testing at 980 °C (1800 °F) for 1000 hwith 30 min thermal cyclingAlloy Original nitrogen, wt% Nitrogen after testing, wt%
230 0.05 0.06263 0.004 0.42617 0.03 0.52X 0.04 0.57
Source: Ref 36
Table 4.7 Results of bulk carbon analysis beforeand after testing in the dynamic burner rig at980 °C (1800 °F) for 1000 h with 30 minutethermal cyclingAlloy Original carbon, wt% Carbon after testing, wt%
230 0.09 0.09263 0.06 0.03617 0.05 0.04X 0.08 0.01
Source: Ref 36
Table 4.8 Test results in terms of weight loss,depth of oxidation penetration, depth ofnitridation, and total depth of attack aftertesting at 980 °C (1800 °F) for 1000 h with30 min thermal cycling
Alloy
Weightchange,mg/cm2
Metal loss,mm
Internaloxidation,
mm
Internalnitridation,
mm
Totalattack(a),
mm
230 −6.8 0.07 0.09 0.17 0.24617 −80.1 0.17 0.07 >0.41(b) >0.58(b)263 −219.4 0.32 0.10 0.29 0.61X −107.1 0.16 0.07 >0.40(b) >0.56(b)
Note: 1.0 mm=39.4 mils. (a) Metal loss + internal oxidation or internalnitridation (whichever is greater). (b) Internal nitridation through thickness.Source: Ref 36
Chapter 4: Nitridation / 75
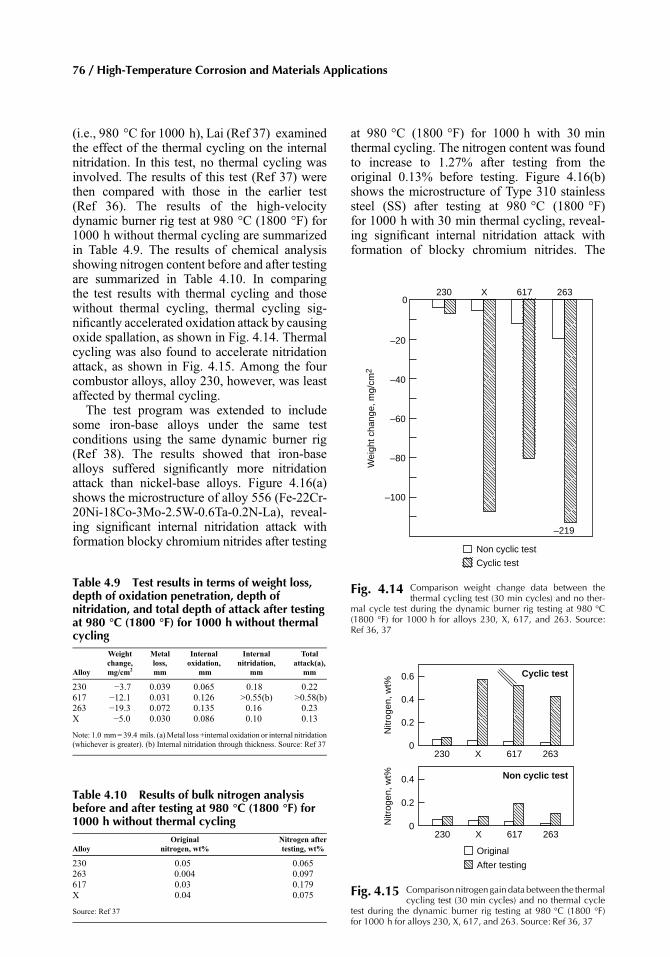
(i.e., 980 °C for 1000 h), Lai (Ref 37) examinedthe effect of the thermal cycling on the internalnitridation. In this test, no thermal cycling wasinvolved. The results of this test (Ref 37) werethen compared with those in the earlier test(Ref 36). The results of the high-velocitydynamic burner rig test at 980 °C (1800 °F) for1000 h without thermal cycling are summarizedin Table 4.9. The results of chemical analysisshowing nitrogen content before and after testingare summarized in Table 4.10. In comparingthe test results with thermal cycling and thosewithout thermal cycling, thermal cycling sig-nificantly accelerated oxidation attack by causingoxide spallation, as shown in Fig. 4.14. Thermalcycling was also found to accelerate nitridationattack, as shown in Fig. 4.15. Among the fourcombustor alloys, alloy 230, however, was leastaffected by thermal cycling.
The test program was extended to includesome iron-base alloys under the same testconditions using the same dynamic burner rig(Ref 38). The results showed that iron-basealloys suffered significantly more nitridationattack than nickel-base alloys. Figure 4.16(a)shows the microstructure of alloy 556 (Fe-22Cr-20Ni-18Co-3Mo-2.5W-0.6Ta-0.2N-La), reveal-ing significant internal nitridation attack withformation blocky chromium nitrides after testing
at 980 °C (1800 °F) for 1000 h with 30 minthermal cycling. The nitrogen content was foundto increase to 1.27% after testing from theoriginal 0.13% before testing. Figure 4.16(b)shows the microstructure of Type 310 stainlesssteel (SS) after testing at 980 °C (1800 °F)for 1000 h with 30 min thermal cycling, reveal-ing significant internal nitridation attack withformation of blocky chromium nitrides. The
Table 4.9 Test results in terms of weight loss,depth of oxidation penetration, depth ofnitridation, and total depth of attack after testingat 980 °C (1800 °F) for 1000 h without thermalcycling
Alloy
Weightchange,mg/cm2
Metalloss,mm
Internaloxidation,
mm
Internalnitridation,
mm
Totalattack(a),
mm
230 −3.7 0.039 0.065 0.18 0.22617 −12.1 0.031 0.126 >0.55(b) >0.58(b)263 −19.3 0.072 0.135 0.16 0.23X −5.0 0.030 0.086 0.10 0.13
Note: 1.0 mm= 39.4 mils. (a)Metal loss +internal oxidation or internal nitridation(whichever is greater). (b) Internal nitridation through thickness. Source: Ref 37
Table 4.10 Results of bulk nitrogen analysisbefore and after testing at 980 °C (1800 °F) for1000 h without thermal cycling
AlloyOriginal
nitrogen, wt%Nitrogen aftertesting, wt%
230 0.05 0.065263 0.004 0.097617 0.03 0.179X 0.04 0.075
Source: Ref 37
0
–20
–40
–60
–80
–100
230 617 263
Wei
ght c
hang
e, m
g/cm
2
–219
Non cyclic test
Cyclic test
X
Fig. 4.14 Comparison weight change data between thethermal cycling test (30 min cycles) and no ther-
mal cycle test during the dynamic burner rig testing at 980 °C(1800 °F) for 1000 h for alloys 230, X, 617, and 263. Source:Ref 36, 37
0.6
0.4
0.2
0230 X 617 263
0.4
0.2
0230 X 617 263
Non cyclic test
Cyclic test
Nitr
ogen
, wt%
Nitr
ogen
, wt%
Original
After testing
Fig. 4.15 Comparisonnitrogengaindatabetween the thermalcycling test (30 min cycles) and no thermal cycle
test during the dynamic burner rig testing at 980 °C (1800 °F)for 1000 h for alloys 230, X, 617, and 263. Source: Ref 36, 37
76 / High-Temperature Corrosion and Materials Applications
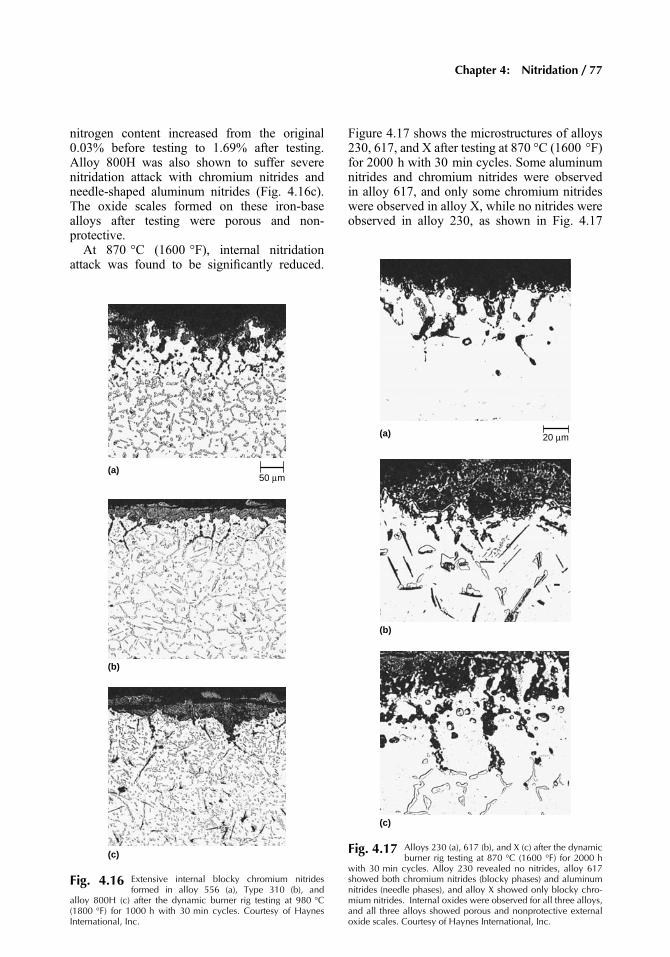
nitrogen content increased from the original0.03% before testing to 1.69% after testing.Alloy 800H was also shown to suffer severenitridation attack with chromium nitrides andneedle-shaped aluminum nitrides (Fig. 4.16c).The oxide scales formed on these iron-basealloys after testing were porous and non-protective.
At 870 °C (1600 °F), internal nitridationattack was found to be significantly reduced.
Figure 4.17 shows the microstructures of alloys230, 617, and X after testing at 870 °C (1600 °F)for 2000 h with 30 min cycles. Some aluminumnitrides and chromium nitrides were observedin alloy 617, and only some chromium nitrideswere observed in alloy X, while no nitrides wereobserved in alloy 230, as shown in Fig. 4.17
50 μm(a)
(b)
(c)
Fig. 4.16 Extensive internal blocky chromium nitridesformed in alloy 556 (a), Type 310 (b), and
alloy 800H (c) after the dynamic burner rig testing at 980 °C(1800 °F) for 1000 h with 30 min cycles. Courtesy of HaynesInternational, Inc.
(b)
(a) 20 μm
(c)
Fig. 4.17 Alloys 230 (a), 617 (b), and X (c) after the dynamicburner rig testing at 870 °C (1600 °F) for 2000 h
with 30 min cycles. Alloy 230 revealed no nitrides, alloy 617showed both chromium nitrides (blocky phases) and aluminumnitrides (needle phases), and alloy X showed only blocky chro-mium nitrides. Internal oxides were observed for all three alloys,and all three alloys showed porous and nonprotective externaloxide scales. Courtesy of Haynes International, Inc.
Chapter 4: Nitridation / 77
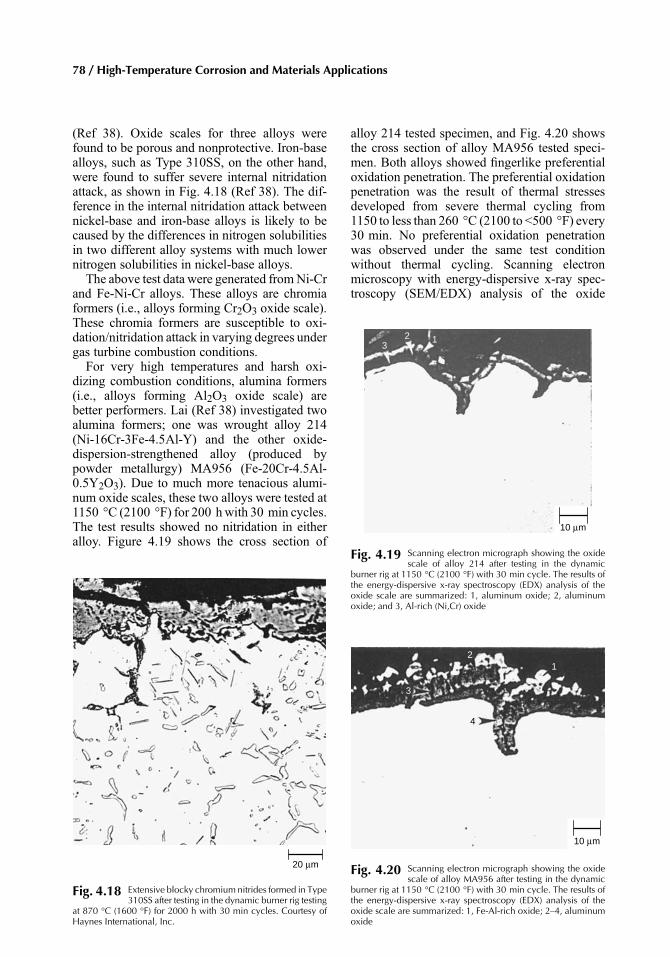
(Ref 38). Oxide scales for three alloys werefound to be porous and nonprotective. Iron-basealloys, such as Type 310SS, on the other hand,were found to suffer severe internal nitridationattack, as shown in Fig. 4.18 (Ref 38). The dif-ference in the internal nitridation attack betweennickel-base and iron-base alloys is likely to becaused by the differences in nitrogen solubilitiesin two different alloy systems with much lowernitrogen solubilities in nickel-base alloys.
The above test data were generated fromNi-Crand Fe-Ni-Cr alloys. These alloys are chromiaformers (i.e., alloys forming Cr2O3 oxide scale).These chromia formers are susceptible to oxi-dation/nitridation attack in varying degrees undergas turbine combustion conditions.
For very high temperatures and harsh oxi-dizing combustion conditions, alumina formers(i.e., alloys forming Al2O3 oxide scale) arebetter performers. Lai (Ref 38) investigated twoalumina formers; one was wrought alloy 214(Ni-16Cr-3Fe-4.5Al-Y) and the other oxide-dispersion-strengthened alloy (produced bypowder metallurgy) MA956 (Fe-20Cr-4.5Al-0.5Y2O3). Due to much more tenacious alumi-num oxide scales, these two alloys were tested at1150 °C (2100 °F) for 200 hwith 30 min cycles.The test results showed no nitridation in eitheralloy. Figure 4.19 shows the cross section of
alloy 214 tested specimen, and Fig. 4.20 showsthe cross section of alloy MA956 tested speci-men. Both alloys showed fingerlike preferentialoxidation penetration. The preferential oxidationpenetration was the result of thermal stressesdeveloped from severe thermal cycling from1150 to less than 260 °C (2100 to <500 °F) every30 min. No preferential oxidation penetrationwas observed under the same test conditionwithout thermal cycling. Scanning electronmicroscopy with energy-dispersive x-ray spec-troscopy (SEM/EDX) analysis of the oxide
20 μm
Fig. 4.18 Extensive blocky chromium nitrides formed in Type310SS after testing in the dynamic burner rig testing
at 870 °C (1600 °F) for 2000 h with 30 min cycles. Courtesy ofHaynes International, Inc.
10 μm
32 1
Fig. 4.19 Scanning electron micrograph showing the oxidescale of alloy 214 after testing in the dynamic
burner rig at 1150 °C (2100 °F) with 30 min cycle. The results ofthe energy-dispersive x-ray spectroscopy (EDX) analysis of theoxide scale are summarized: 1, aluminum oxide; 2, aluminumoxide; and 3, Al-rich (Ni,Cr) oxide
10 μm
4
3
21
Fig. 4.20 Scanning electron micrograph showing the oxidescale of alloy MA956 after testing in the dynamic
burner rig at 1150 °C (2100 °F) with 30 min cycle. The results ofthe energy-dispersive x-ray spectroscopy (EDX) analysis of theoxide scale are summarized: 1, Fe-Al-rich oxide; 2–4, aluminumoxide
78 / High-Temperature Corrosion and Materials Applications
scales showed that both alloys exhibited an alu-minum oxide scale. For MA956 some Fe-Al-richoxide phases were observed to form on the top ofthe aluminum oxide scale.
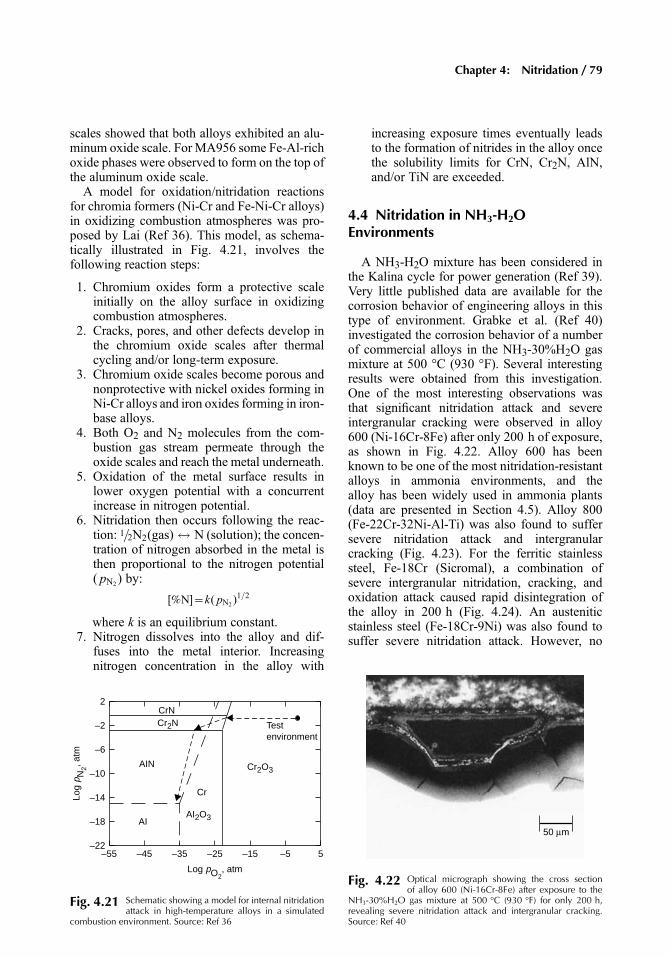
A model for oxidation/nitridation reactionsfor chromia formers (Ni-Cr and Fe-Ni-Cr alloys)in oxidizing combustion atmospheres was pro-posed by Lai (Ref 36). This model, as schema-tically illustrated in Fig. 4.21, involves thefollowing reaction steps:
1. Chromium oxides form a protective scaleinitially on the alloy surface in oxidizingcombustion atmospheres.
2. Cracks, pores, and other defects develop inthe chromium oxide scales after thermalcycling and/or long-term exposure.
3. Chromium oxide scales become porous andnonprotective with nickel oxides forming inNi-Cr alloys and iron oxides forming in iron-base alloys.
4. Both O2 and N2 molecules from the com-bustion gas stream permeate through theoxide scales and reach the metal underneath.
5. Oxidation of the metal surface results inlower oxygen potential with a concurrentincrease in nitrogen potential.
6. Nitridation then occurs following the reac-tion: 1=2N2(gas) $ N (solution); the concen-tration of nitrogen absorbed in the metal isthen proportional to the nitrogen potential( pN2) by:
[%N]=k( pN2 )1=2
where k is an equilibrium constant.7. Nitrogen dissolves into the alloy and dif-
fuses into the metal interior. Increasingnitrogen concentration in the alloy with
increasing exposure times eventually leadsto the formation of nitrides in the alloy oncethe solubility limits for CrN, Cr2N, AlN,and/or TiN are exceeded.
4.4 Nitridation in NH3-H2OEnvironments
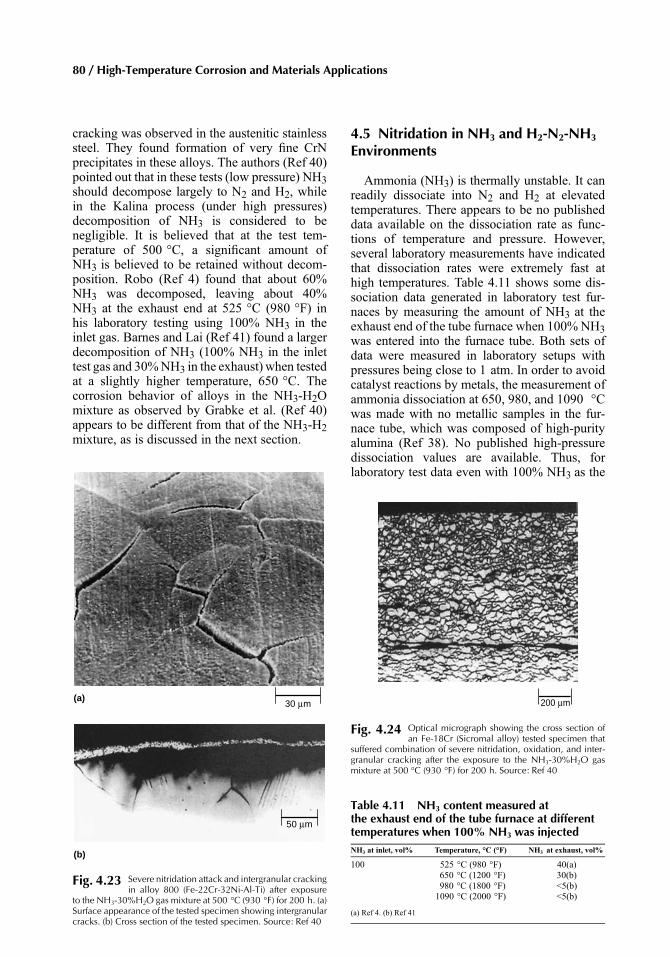
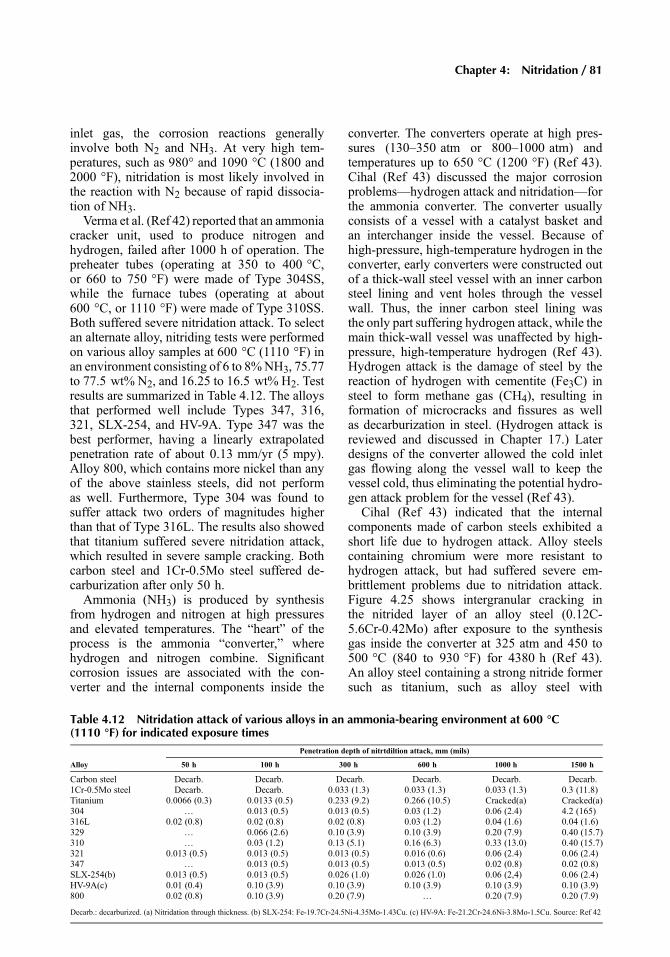
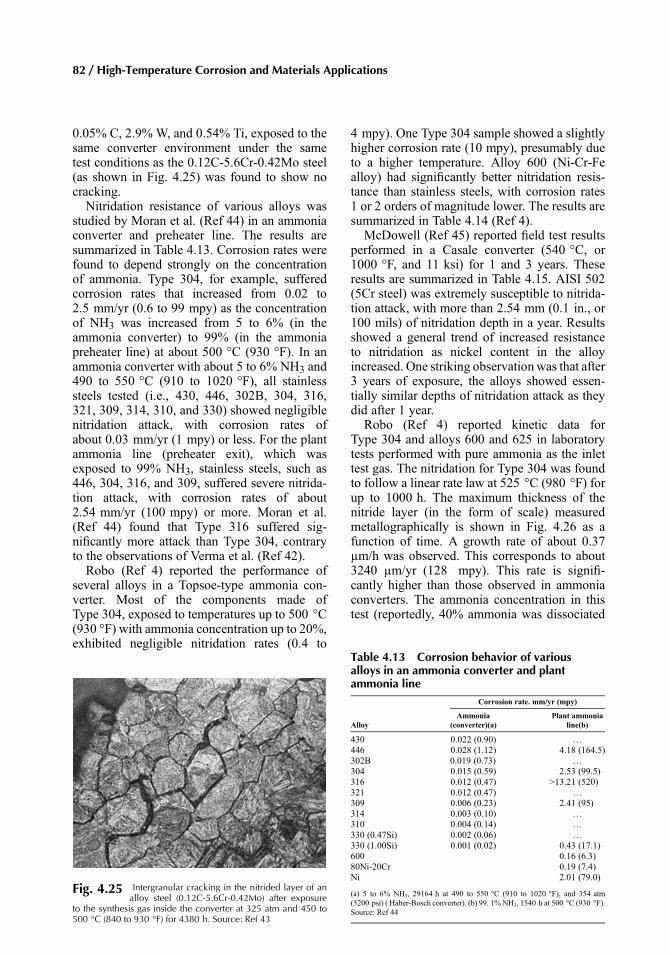
A NH3-H2O mixture has been considered inthe Kalina cycle for power generation (Ref 39).Very little published data are available for thecorrosion behavior of engineering alloys in thistype of environment. Grabke et al. (Ref 40)investigated the corrosion behavior of a numberof commercial alloys in the NH3-30%H2O gasmixture at 500 °C (930 °F). Several interestingresults were obtained from this investigation.One of the most interesting observations wasthat significant nitridation attack and severeintergranular cracking were observed in alloy600 (Ni-16Cr-8Fe) after only 200 h of exposure,as shown in Fig. 4.22. Alloy 600 has beenknown to be one of the most nitridation-resistantalloys in ammonia environments, and thealloy has been widely used in ammonia plants(data are presented in Section 4.5). Alloy 800(Fe-22Cr-32Ni-Al-Ti) was also found to suffersevere nitridation attack and intergranularcracking (Fig. 4.23). For the ferritic stainlesssteel, Fe-18Cr (Sicromal), a combination ofsevere intergranular nitridation, cracking, andoxidation attack caused rapid disintegration ofthe alloy in 200 h (Fig. 4.24). An austeniticstainless steel (Fe-18Cr-9Ni) was also found tosuffer severe nitridation attack. However, no
2
–2
–6
–10
–14
–18
–22–55 –45 –35 –25 –15 –5 5
Log pO2, atm
Log
p N2, a
tm
CrNCr2N
AIN
AI
Cr
AI2O3
Cr2O3
Testenvironment
Fig. 4.21 Schematic showing a model for internal nitridationattack in high-temperature alloys in a simulated
combustion environment. Source: Ref 36
50 μm
Fig. 4.22 Optical micrograph showing the cross sectionof alloy 600 (Ni-16Cr-8Fe) after exposure to the
NH3-30%H2O gas mixture at 500 °C (930 °F) for only 200 h,revealing severe nitridation attack and intergranular cracking.Source: Ref 40
Chapter 4: Nitridation / 79
cracking was observed in the austenitic stainlesssteel. They found formation of very fine CrNprecipitates in these alloys. The authors (Ref 40)pointed out that in these tests (low pressure) NH3should decompose largely to N2 and H2, whilein the Kalina process (under high pressures)decomposition of NH3 is considered to benegligible. It is believed that at the test tem-perature of 500 °C, a significant amount ofNH3 is believed to be retained without decom-position. Robo (Ref 4) found that about 60%NH3 was decomposed, leaving about 40%NH3 at the exhaust end at 525 °C (980 °F) inhis laboratory testing using 100% NH3 in theinlet gas. Barnes and Lai (Ref 41) found a largerdecomposition of NH3 (100% NH3 in the inlettest gas and 30%NH3 in the exhaust) when testedat a slightly higher temperature, 650 °C. Thecorrosion behavior of alloys in the NH3-H2Omixture as observed by Grabke et al. (Ref 40)appears to be different from that of the NH3-H2mixture, as is discussed in the next section.
4.5 Nitridation in NH3 and H2-N2-NH3
Environments
Ammonia (NH3) is thermally unstable. It canreadily dissociate into N2 and H2 at elevatedtemperatures. There appears to be no publisheddata available on the dissociation rate as func-tions of temperature and pressure. However,several laboratory measurements have indicatedthat dissociation rates were extremely fast athigh temperatures. Table 4.11 shows some dis-sociation data generated in laboratory test fur-naces by measuring the amount of NH3 at theexhaust end of the tube furnace when 100% NH3was entered into the furnace tube. Both sets ofdata were measured in laboratory setups withpressures being close to 1 atm. In order to avoidcatalyst reactions by metals, the measurement ofammonia dissociation at 650, 980, and 1090 °Cwas made with no metallic samples in the fur-nace tube, which was composed of high-purityalumina (Ref 38). No published high-pressuredissociation values are available. Thus, forlaboratory test data even with 100% NH3 as the
30 μm(a)
50 μm
(b)
Fig. 4.23 Severe nitridation attack and intergranular crackingin alloy 800 (Fe-22Cr-32Ni-Al-Ti) after exposure
to the NH3-30%H2O gas mixture at 500 °C (930 °F) for 200 h. (a)Surface appearance of the tested specimen showing intergranularcracks. (b) Cross section of the tested specimen. Source: Ref 40
200 μm
Fig. 4.24 Optical micrograph showing the cross section ofan Fe-18Cr (Sicromal alloy) tested specimen that
suffered combination of severe nitridation, oxidation, and inter-granular cracking after the exposure to the NH3-30%H2O gasmixture at 500 °C (930 °F) for 200 h. Source: Ref 40
Table 4.11 NH3 content measured atthe exhaust end of the tube furnace at differenttemperatures when 100% NH3 was injectedNH3 at inlet, vol% Temperature, °C (°F) NH3 at exhaust, vol%
100 525 °C (980 °F) 40(a)650 °C (1200 °F) 30(b)980 °C (1800 °F) <5(b)1090 °C (2000 °F) <5(b)
(a) Ref 4. (b) Ref 41
80 / High-Temperature Corrosion and Materials Applications
inlet gas, the corrosion reactions generallyinvolve both N2 and NH3. At very high tem-peratures, such as 980° and 1090 °C (1800 and2000 °F), nitridation is most likely involved inthe reaction with N2 because of rapid dissocia-tion of NH3.
Verma et al. (Ref 42) reported that an ammoniacracker unit, used to produce nitrogen andhydrogen, failed after 1000 h of operation. Thepreheater tubes (operating at 350 to 400 °C,or 660 to 750 °F) were made of Type 304SS,while the furnace tubes (operating at about600 °C, or 1110 °F) were made of Type 310SS.Both suffered severe nitridation attack. To selectan alternate alloy, nitriding tests were performedon various alloy samples at 600 °C (1110 °F) inan environment consisting of 6 to 8%NH3, 75.77to 77.5 wt% N2, and 16.25 to 16.5 wt% H2. Testresults are summarized in Table 4.12. The alloysthat performed well include Types 347, 316,321, SLX-254, and HV-9A. Type 347 was thebest performer, having a linearly extrapolatedpenetration rate of about 0.13 mm/yr (5 mpy).Alloy 800, which contains more nickel than anyof the above stainless steels, did not performas well. Furthermore, Type 304 was found tosuffer attack two orders of magnitudes higherthan that of Type 316L. The results also showedthat titanium suffered severe nitridation attack,which resulted in severe sample cracking. Bothcarbon steel and 1Cr-0.5Mo steel suffered de-carburization after only 50 h.
Ammonia (NH3) is produced by synthesisfrom hydrogen and nitrogen at high pressuresand elevated temperatures. The “heart” of theprocess is the ammonia “converter,” wherehydrogen and nitrogen combine. Significantcorrosion issues are associated with the con-verter and the internal components inside the
converter. The converters operate at high pres-sures (130–350 atm or 800–1000 atm) andtemperatures up to 650 °C (1200 °F) (Ref 43).Cihal (Ref 43) discussed the major corrosionproblems—hydrogen attack and nitridation—forthe ammonia converter. The converter usuallyconsists of a vessel with a catalyst basket andan interchanger inside the vessel. Because ofhigh-pressure, high-temperature hydrogen in theconverter, early converters were constructed outof a thick-wall steel vessel with an inner carbonsteel lining and vent holes through the vesselwall. Thus, the inner carbon steel lining wasthe only part suffering hydrogen attack, while themain thick-wall vessel was unaffected by high-pressure, high-temperature hydrogen (Ref 43).Hydrogen attack is the damage of steel by thereaction of hydrogen with cementite (Fe3C) insteel to form methane gas (CH4), resulting information of microcracks and fissures as wellas decarburization in steel. (Hydrogen attack isreviewed and discussed in Chapter 17.) Laterdesigns of the converter allowed the cold inletgas flowing along the vessel wall to keep thevessel cold, thus eliminating the potential hydro-gen attack problem for the vessel (Ref 43).
Cihal (Ref 43) indicated that the internalcomponents made of carbon steels exhibited ashort life due to hydrogen attack. Alloy steelscontaining chromium were more resistant tohydrogen attack, but had suffered severe em-brittlement problems due to nitridation attack.Figure 4.25 shows intergranular cracking inthe nitrided layer of an alloy steel (0.12C-5.6Cr-0.42Mo) after exposure to the synthesisgas inside the converter at 325 atm and 450 to500 °C (840 to 930 °F) for 4380 h (Ref 43).An alloy steel containing a strong nitride formersuch as titanium, such as alloy steel with
Table 4.12 Nitridation attack of various alloys in an ammonia-bearing environment at 600 °C(1110 °F) for indicated exposure times
Penetration depth of nitrtdiltion attack, mm (mils)
Alloy 50 h 100 h 300 h 600 h 1000 h 1500 h
Carbon steel Decarb. Decarb. Decarb. Decarb. Decarb. Decarb.1Cr-0.5Mo steel Decarb. Decarb. 0.033 (1.3) 0.033 (1.3) 0.033 (1.3) 0.3 (11.8)Titanium 0.0066 (0.3) 0.0133 (0.5) 0.233 (9.2) 0.266 (10.5) Cracked(a) Cracked(a)304 … 0.013 (0.5) 0.013 (0.5) 0.03 (1.2) 0.06 (2.4) 4.2 (165)316L 0.02 (0.8) 0.02 (0.8) 0.02 (0.8) 0.03 (1.2) 0.04 (1.6) 0.04 (1.6)329 … 0.066 (2.6) 0.10 (3.9) 0.10 (3.9) 0.20 (7.9) 0.40 (15.7)310 … 0.03 (1.2) 0.13 (5.1) 0.16 (6.3) 0.33 (13.0) 0.40 (15.7)321 0.013 (0.5) 0.013 (0.5) 0.013 (0.5) 0.016 (0.6) 0.06 (2.4) 0.06 (2.4)347 … 0.013 (0.5) 0.013 (0.5) 0.013 (0.5) 0.02 (0.8) 0.02 (0.8)SLX-254(b) 0.013 (0.5) 0.013 (0.5) 0.026 (1.0) 0.026 (1.0) 0.06 (2,4) 0.06 (2.4)HV-9A(c) 0.01 (0.4) 0.10 (3.9) 0.10 (3.9) 0.10 (3.9) 0.10 (3.9) 0.10 (3.9)800 0.02 (0.8) 0.10 (3.9) 0.20 (7.9) … 0.20 (7.9) 0.20 (7.9)
Decarb.: decarburized. (a) Nitridation through thickness. (b) SLX-254: Fe-19.7Cr-24.5Ni-4.35Mo-1.43Cu. (c) HV-9A: Fe-21.2Cr-24.6Ni-3.8Mo-1.5Cu. Source: Ref 42
Chapter 4: Nitridation / 81
0.05% C, 2.9% W, and 0.54% Ti, exposed to thesame converter environment under the sametest conditions as the 0.12C-5.6Cr-0.42Mo steel(as shown in Fig. 4.25) was found to show nocracking.
Nitridation resistance of various alloys wasstudied by Moran et al. (Ref 44) in an ammoniaconverter and preheater line. The results aresummarized in Table 4.13. Corrosion rates werefound to depend strongly on the concentrationof ammonia. Type 304, for example, sufferedcorrosion rates that increased from 0.02 to2.5 mm/yr (0.6 to 99 mpy) as the concentrationof NH3 was increased from 5 to 6% (in theammonia converter) to 99% (in the ammoniapreheater line) at about 500 °C (930 °F). In anammonia converter with about 5 to 6% NH3 and490 to 550 °C (910 to 1020 °F), all stainlesssteels tested (i.e., 430, 446, 302B, 304, 316,321, 309, 314, 310, and 330) showed negligiblenitridation attack, with corrosion rates ofabout 0.03 mm/yr (1 mpy) or less. For the plantammonia line (preheater exit), which wasexposed to 99% NH3, stainless steels, such as446, 304, 316, and 309, suffered severe nitrida-tion attack, with corrosion rates of about2.54 mm/yr (100 mpy) or more. Moran et al.(Ref 44) found that Type 316 suffered sig-nificantly more attack than Type 304, contraryto the observations of Verma et al. (Ref 42).
Robo (Ref 4) reported the performance ofseveral alloys in a Topsoe-type ammonia con-verter. Most of the components made ofType 304, exposed to temperatures up to 500 °C(930 °F) with ammonia concentration up to 20%,exhibited negligible nitridation rates (0.4 to
4 mpy). One Type 304 sample showed a slightlyhigher corrosion rate (10 mpy), presumably dueto a higher temperature. Alloy 600 (Ni-Cr-Fealloy) had significantly better nitridation resis-tance than stainless steels, with corrosion rates1 or 2 orders of magnitude lower. The results aresummarized in Table 4.14 (Ref 4).
McDowell (Ref 45) reported field test resultsperformed in a Casale converter (540 °C, or1000 °F, and 11 ksi) for 1 and 3 years. Theseresults are summarized in Table 4.15. AISI 502(5Cr steel) was extremely susceptible to nitrida-tion attack, with more than 2.54 mm (0.1 in., or100 mils) of nitridation depth in a year. Resultsshowed a general trend of increased resistanceto nitridation as nickel content in the alloyincreased. One striking observation was that after3 years of exposure, the alloys showed essen-tially similar depths of nitridation attack as theydid after 1 year.
Robo (Ref 4) reported kinetic data forType 304 and alloys 600 and 625 in laboratorytests performed with pure ammonia as the inlettest gas. The nitridation for Type 304 was foundto follow a linear rate law at 525 °C (980 °F) forup to 1000 h. The maximum thickness of thenitride layer (in the form of scale) measuredmetallographically is shown in Fig. 4.26 as afunction of time. A growth rate of about 0.37μm/h was observed. This corresponds to about3240 μm/yr (128 mpy). This rate is signifi-cantly higher than those observed in ammoniaconverters. The ammonia concentration in thistest (reportedly, 40% ammonia was dissociated
Table 4.13 Corrosion behavior of variousalloys in an ammonia converter and plantammonia line
Corrosion rate. mm/yr (mpy)
AlloyAmmonia
(converter)(a)Plant ammonia
line(b)
430 0.022 (0.90) …
446 0.028 (1.12) 4.18 (164.5)302B 0.019 (0.73) …
304 0.015 (0.59) 2.53 (99.5)316 0.012 (0.47) >13.21 (520)321 0.012 (0.47) …
309 0.006 (0.23) 2.41 (95)314 0.003 (0.10) …
310 0.004 (0.14) …
330 (0.47Si) 0.002 (0.06) …
330 (1.00Si) 0.001 (0.02) 0.43 (17.1)600 0.16 (6.3)80Ni-20Cr 0.19 (7.4)Ni 2.01 (79.0)
(a) 5 to 6% NH3, 29164 h at 490 to 550 °C (910 to 1020 °F), and 354 atm(5200 psi) ( Haber-Bosch converter). (b) 99. 1% NH3, 1540 h at 500 °C (930 °F).Source: Ref 44
Fig. 4.25 Intergranular cracking in the nitrided layer of analloy steel (0.12C-5.6Cr-0.42Mo) after exposure
to the synthesis gas inside the converter at 325 atm and 450 to500 °C (840 to 930 °F) for 4380 h. Source: Ref 43
82 / High-Temperature Corrosion and Materials Applications
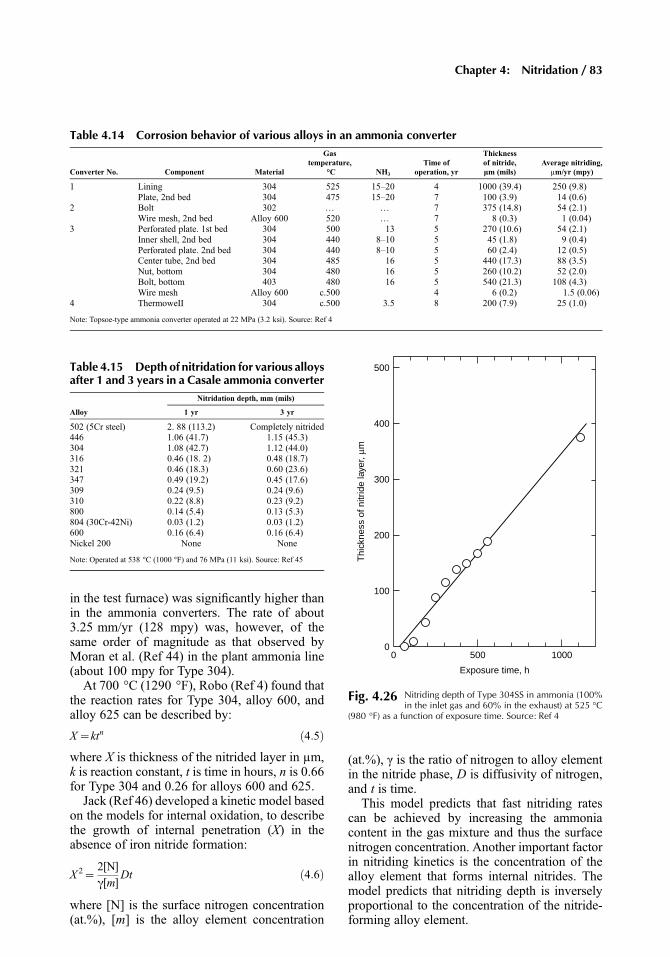
in the test furnace) was significantly higher thanin the ammonia converters. The rate of about3.25 mm/yr (128 mpy) was, however, of thesame order of magnitude as that observed byMoran et al. (Ref 44) in the plant ammonia line(about 100 mpy for Type 304).
At 700 °C (1290 °F), Robo (Ref 4) found thatthe reaction rates for Type 304, alloy 600, andalloy 625 can be described by:
X=ktn ð4:5Þwhere X is thickness of the nitrided layer in μm,k is reaction constant, t is time in hours, n is 0.66for Type 304 and 0.26 for alloys 600 and 625.
Jack (Ref 46) developed a kinetic model basedon the models for internal oxidation, to describethe growth of internal penetration (X) in theabsence of iron nitride formation:
X 2=2[N]
c[m]Dt ð4:6Þ
where [N] is the surface nitrogen concentration(at.%), [m] is the alloy element concentration
(at.%), γ is the ratio of nitrogen to alloy elementin the nitride phase, D is diffusivity of nitrogen,and t is time.
This model predicts that fast nitriding ratescan be achieved by increasing the ammoniacontent in the gas mixture and thus the surfacenitrogen concentration. Another important factorin nitriding kinetics is the concentration of thealloy element that forms internal nitrides. Themodel predicts that nitriding depth is inverselyproportional to the concentration of the nitride-forming alloy element.
500
400
300
200
100
00 500 1000
Exposure time, h
Thi
ckne
ss o
f nitr
ide
laye
r, μm
Fig. 4.26 Nitriding depth of Type 304SS in ammonia (100%in the inlet gas and 60% in the exhaust) at 525 °C
(980 °F) as a function of exposure time. Source: Ref 4
Table 4.15 Depth of nitridation for various alloysafter 1 and 3 years in a Casale ammonia converter
Nitridation depth, mm (mils)
Alloy 1 yr 3 yr
502 (5Cr steel) 2. 88 (113.2) Completely nitrided446 1.06 (41.7) 1.15 (45.3)304 1.08 (42.7) 1.12 (44.0)316 0.46 (18. 2) 0.48 (18.7)321 0.46 (18.3) 0.60 (23.6)347 0.49 (19.2) 0.45 (17.6)309 0.24 (9.5) 0.24 (9.6)310 0.22 (8.8) 0.23 (9.2)800 0.14 (5.4) 0.13 (5.3)804 (30Cr-42Ni) 0.03 (1.2) 0.03 (1.2)600 0.16 (6.4) 0.16 (6.4)Nickel 200 None None
Note: Operated at 538 °C (1000 °F) and 76 MPa (11 ksi). Source: Ref 45
Table 4.14 Corrosion behavior of various alloys in an ammonia converter
Converter No. Component Material
Gastemperature,
°C NH3
Time ofoperation, yr
Thicknessof nitride,μm (mils)
Average nitriding,μm/yr (mpy)
1 Lining 304 525 15–20 4 1000 (39.4) 250 (9.8)Plate, 2nd bed 304 475 15–20 7 100 (3.9) 14 (0.6)
2 Bolt 302 … … 7 375 (14.8) 54 (2.1)Wire mesh, 2nd bed Alloy 600 520 … 7 8 (0.3) 1 (0.04)
3 Perforated plate. 1st bed 304 500 13 5 270 (10.6) 54 (2.1)Inner shell, 2nd bed 304 440 8–10 5 45 (1.8) 9 (0.4)Perforated plate. 2nd bed 304 440 8–10 5 60 (2.4) 12 (0.5)Center tube, 2nd bed 304 485 16 5 440 (17.3) 88 (3.5)Nut, bottom 304 480 16 5 260 (10.2) 52 (2.0)Bolt, bottom 403 480 16 5 540 (21.3) 108 (4.3)Wire mesh Alloy 600 c.500 4 6 (0.2) 1.5 (0.06)
4 ThermoweII 304 c.500 3.5 8 200 (7.9) 25 (1.0)
Note: Topsoe-type ammonia converter operated at 22 MPa (3.2 ksi). Source: Ref 4
Chapter 4: Nitridation / 83
The nitridation behavior of a wide variety ofcommercial alloys in ammonia was extensivelyinvestigated by Barnes and Lai (Ref 41). Thealloys tested included stainless steels, Fe-Ni-Cralloys, and nickel- and cobalt-base superalloys.Many alloys tested contained alloying elements(e.g., Al, Ti, Zr, Nb, Cr, Mo, W, Fe, etc.) thatform nitrides. The test results generated at 650,980, and 1090 °C (1200, 1800, and 2000 °F)are summarized in Tables 4.16 to 4.18. It wasfound that nickel-base alloys are generally morenitridation resistant than iron-base alloys. In-creasing nickel content generally improvesthe resistance of the alloy to nitridation attack.Increasing cobalt content appears to have thesame effect. When nitrogen absorption wasplotted against Ni + Co content in the alloy forthe 650 °C (1200 °F) test data, resistance tonitridation improves with increasing Ni + Cocontent up to about 50 wt%, as shown inFig. 4.27. Further increases up to about 75% didnot seem to affect the nitridation resistance of thealloy. For maximum resistance to nitridationattack at 650 °C (1200 °F), it appears that alloyswith at least 50%Ni or Ni + Co are most suitable.This is in general agreement with the resultsreported by Moran et al. (Ref 44). Their resultssuggested that improvement in nitridation resis-tance began to level off at about 40% Ni, with noimprovement resulting from further increases innickel up to about 80%. Pure nickel, however,showed significantly lower nitridation resistance(Ref 43). At 980 °C (1800 °F), a slightly differ-ent relationship was observed, as shown in
Table 4.18 Nitridation resistance of variousalloys in ammonia at 1090 °C (2000 °F) for168 h
Alloy Alloy base
Nitrogenabsorption,mg/cm2
Depth of nitridepenetration,mm (mils)
600 Nickel 0.2 0214 Nickel 0.2 0.02 (0.7)S Nickel 1.0 0.34 (13.4)230 Nickel 1.5 0.39 (15.3)25 Cobalt 1.7 >0.65 (25.5)617 Nickel 1.9 >0.56 (22)188 Cobalt 2.0 >0.53 (21)HR-160 Nickel 2.5 0.46 (18)601 Nickel 2.6 >0.58 (23)RA330 Iron 3.1 >0.56 (22)625 Nickel 3.3 >0.56 (22)316 Iron 3.3 >0.91 (36)304 Iron 3.5 >0.58 (23)X Nickel 3.8 >0.58 (23)150 Cobalt 4.1 0.51 (20)556 Iron 4.2 >0.51 (20)446 Iron 4.5 >0.58 (23)6B Cobalt 4.7 >0.64 (25)MULTIMET Iron 5.0 >0.64 (25)825 Nickel 5.2 0.58 (23)RA333 Nickel 5.2 >0.71 (28)800H Iron 5.5 >0.76 (30)253MA Iron 6.3 >1.5 (60)310 Iron 9.5 >0.79 (31)
Note: 100% NH3 in the inlet gas and less than 5% (detection limit) in the exhaustgas. Source: Ref 41
Table 4.17 Nitridation resistance of variousalloys in ammonia at 980 °C (1800 °F) for168 h
Alloy Alloy base
Nitrogenabsorptionmg/cm2
Depth ofnitride penetration,
mm (mils)
214 Nickel 0.3 0.04 (1.4)600 Nickel 0.9 0.12 (4.8)S Nickel 0.9 0.18 (7.2)601 Nickel 1.2 0.17 (6.6)230 Nickel 1.4 0.12(4.9)617 Nickel 1.5 0.38 (15.0)HR-160 Nickel 1.7 0.18 (7.2)188 Cobalt 2.3 0.19(7.4)625 Nickel 2.5 0.17 (6.9)6B Cobalt 3.1 0.15 (5.8)253MA Iron 3.3 0.48 (19.0)25 Cobalt 3.6 0.26(10.4)X Nickel 3.2 0.19 (7.4)RA333 Nickel 3.7 0.42(16.4)RA330 Iron 3.9 0.52 (20.6)800H Iron 4.0 0.28 (11.1)825 Nickel 4.3 0.58 (23.0)150 Cobalt 5.3 0.38 (15.1)MULTIMET Iron 5.6 0.35 (13.6)316 Iron 6.0 0.52 (20.3)556 Iron 6.7 0.37 (14.7)304 Iron 7.3 >0.58 (23.0)310 Iron 7.7 0.38 (15.1)446 Iron 12.9 >0.58 (23.0)
Note: 100% NH3 in the inlet gas and less than 5% NH3 (detection limit) in theexhaust gas. Source: Ref 41
Table 4.16 Nitridation resistance of variousalloys in ammonia at 650 °C (1200 °F) for 168 h
Alloy Alloy base
Nitrogenabsorption,mg/cm2
Depth of nitridepenetration,mm (mils)
C-276 Nickel 0.7 0.02 (0.6)230 Nickel 0.7 0.03 (1.2)HR-160 Nickel 0.8 0.01 (0.5)600 Nickel 0.8 0.03(1.3)625 Nickel 0.9 0.01 (0.5)RA333 Nickel 1.0 0.03 (1.0)601 Nickel 1.1 0.03 (1.0)188 Cobalt 1.2 0.02 (0.6)S Nickel 1.3 0.03 (1.1)617 Nickel 1.3 0.03 (1.0)214 Nickel 1.5 0.04 (1.5)X Nickel 1.7 0.04 (1.5)825 Nickel 2.5 0.06 (2.2)800H Iron 4.3 0.10 (4.1)556 Iron 4.9 0.09 (3.5)316 Iron 6.9 0.19 (7.3)310 Iron 7.4 0.15 (6.0)304 Iron 9.8 0.21 (8.4)
Note: 100% NH3 in the inlet gas and 30% NH3 in the exhaust gas. Source: Ref 41
84 / High-Temperature Corrosion and Materials Applications
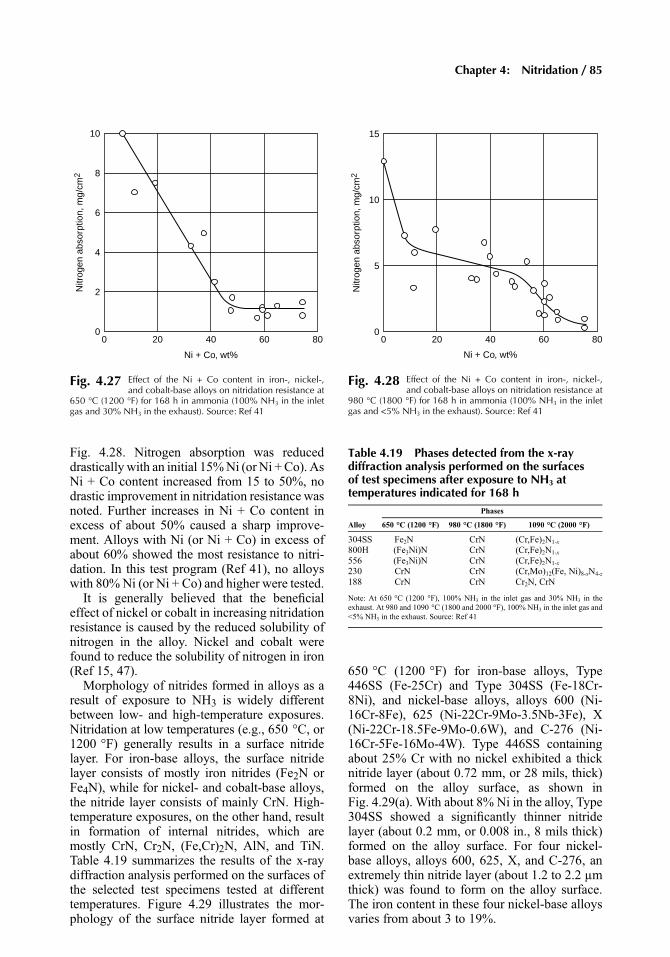
Fig. 4.28. Nitrogen absorption was reduceddrastically with an initial 15%Ni (or Ni +Co). AsNi + Co content increased from 15 to 50%, nodrastic improvement in nitridation resistance wasnoted. Further increases in Ni + Co content inexcess of about 50% caused a sharp improve-ment. Alloys with Ni (or Ni + Co) in excess ofabout 60% showed the most resistance to nitri-dation. In this test program (Ref 41), no alloyswith 80%Ni (or Ni + Co) and higher were tested.
It is generally believed that the beneficialeffect of nickel or cobalt in increasing nitridationresistance is caused by the reduced solubility ofnitrogen in the alloy. Nickel and cobalt werefound to reduce the solubility of nitrogen in iron(Ref 15, 47).
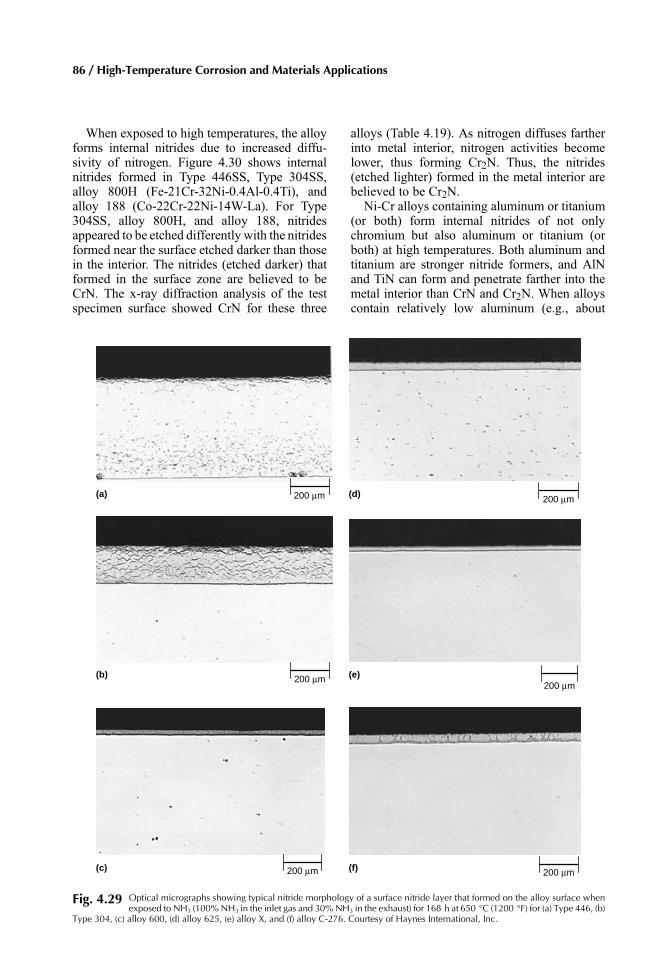
Morphology of nitrides formed in alloys as aresult of exposure to NH3 is widely differentbetween low- and high-temperature exposures.Nitridation at low temperatures (e.g., 650 °C, or1200 °F) generally results in a surface nitridelayer. For iron-base alloys, the surface nitridelayer consists of mostly iron nitrides (Fe2N orFe4N), while for nickel- and cobalt-base alloys,the nitride layer consists of mainly CrN. High-temperature exposures, on the other hand, resultin formation of internal nitrides, which aremostly CrN, Cr2N, (Fe,Cr)2N, AlN, and TiN.Table 4.19 summarizes the results of the x-raydiffraction analysis performed on the surfaces ofthe selected test specimens tested at differenttemperatures. Figure 4.29 illustrates the mor-phology of the surface nitride layer formed at
650 °C (1200 °F) for iron-base alloys, Type446SS (Fe-25Cr) and Type 304SS (Fe-18Cr-8Ni), and nickel-base alloys, alloys 600 (Ni-16Cr-8Fe), 625 (Ni-22Cr-9Mo-3.5Nb-3Fe), X(Ni-22Cr-18.5Fe-9Mo-0.6W), and C-276 (Ni-16Cr-5Fe-16Mo-4W). Type 446SS containingabout 25% Cr with no nickel exhibited a thicknitride layer (about 0.72 mm, or 28 mils, thick)formed on the alloy surface, as shown inFig. 4.29(a). With about 8% Ni in the alloy, Type304SS showed a significantly thinner nitridelayer (about 0.2 mm, or 0.008 in., 8 mils thick)formed on the alloy surface. For four nickel-base alloys, alloys 600, 625, X, and C-276, anextremely thin nitride layer (about 1.2 to 2.2 μmthick) was found to form on the alloy surface.The iron content in these four nickel-base alloysvaries from about 3 to 19%.
Table 4.19 Phases detected from the x-raydiffraction analysis performed on the surfacesof test specimens after exposure to NH3 attemperatures indicated for 168 h
Phases
Alloy 650 °C (1200 °F) 980 °C (1800 °F) 1090 °C (2000 °F)
304SS Fe2N CrN (Cr,Fe)2N1-x
800H (Fe3Ni)N CrN (Cr,Fe)2N1-x
556 (Fe3Ni)N CrN (Cr,Fe)2N1-x
230 CrN CrN (Cr,Mo)12(Fe, Ni)8-xN4-z
188 CrN CrN Cr2N, CrN
Note: At 650 °C (1200 °F), 100% NH3 in the inlet gas and 30% NH3 in theexhaust. At 980 and 1090 °C (1800 and 2000 °F), 100% NH3 in the inlet gas and<5% NH3 in the exhaust. Source: Ref 41
15
10
5
00 20 40 60 80
Ni + Co, wt%N
itrog
en a
bsor
ptio
n, m
g/cm
2
Fig. 4.28 Effect of the Ni + Co content in iron-, nickel-,and cobalt-base alloys on nitridation resistance at
980 °C (1800 °F) for 168 h in ammonia (100% NH3 in the inletgas and <5% NH3 in the exhaust). Source: Ref 41
10
8
6
4
2
00 20 40 60 80
Ni + Co, wt%
Nitr
ogen
abs
orpt
ion,
mg/
cm2
Fig. 4.27 Effect of the Ni + Co content in iron-, nickel-,and cobalt-base alloys on nitridation resistance at
650 °C (1200 °F) for 168 h in ammonia (100% NH3 in the inletgas and 30% NH3 in the exhaust). Source: Ref 41
Chapter 4: Nitridation / 85
When exposed to high temperatures, the alloyforms internal nitrides due to increased diffu-sivity of nitrogen. Figure 4.30 shows internalnitrides formed in Type 446SS, Type 304SS,alloy 800H (Fe-21Cr-32Ni-0.4Al-0.4Ti), andalloy 188 (Co-22Cr-22Ni-14W-La). For Type304SS, alloy 800H, and alloy 188, nitridesappeared to be etched differently with the nitridesformed near the surface etched darker than thosein the interior. The nitrides (etched darker) thatformed in the surface zone are believed to beCrN. The x-ray diffraction analysis of the testspecimen surface showed CrN for these three
alloys (Table 4.19). As nitrogen diffuses fartherinto metal interior, nitrogen activities becomelower, thus forming Cr2N. Thus, the nitrides(etched lighter) formed in the metal interior arebelieved to be Cr2N.
Ni-Cr alloys containing aluminum or titanium(or both) form internal nitrides of not onlychromium but also aluminum or titanium (orboth) at high temperatures. Both aluminum andtitanium are stronger nitride formers, and AlNand TiN can form and penetrate farther into themetal interior than CrN and Cr2N. When alloyscontain relatively low aluminum (e.g., about
(a)
(b)
(c) (f) 200 μm
(e)200 μm
(d) 200 μm
200 μm
200 μm
200 μm
Fig. 4.29 Optical micrographs showing typical nitride morphology of a surface nitride layer that formed on the alloy surface whenexposed to NH3 (100%NH3 in the inlet gas and 30%NH3 in the exhaust) for 168 h at 650 °C (1200 °F) for (a) Type 446, (b)
Type 304, (c) alloy 600, (d) alloy 625, (e) alloy X, and (f) alloy C-276. Courtesy of Haynes International, Inc.
86 / High-Temperature Corrosion and Materials Applications
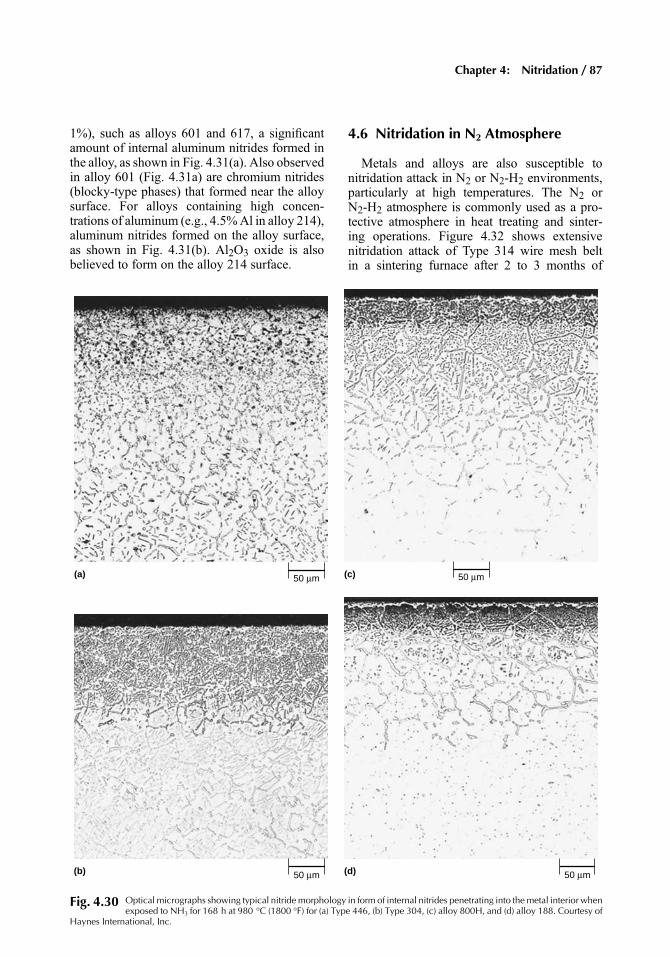
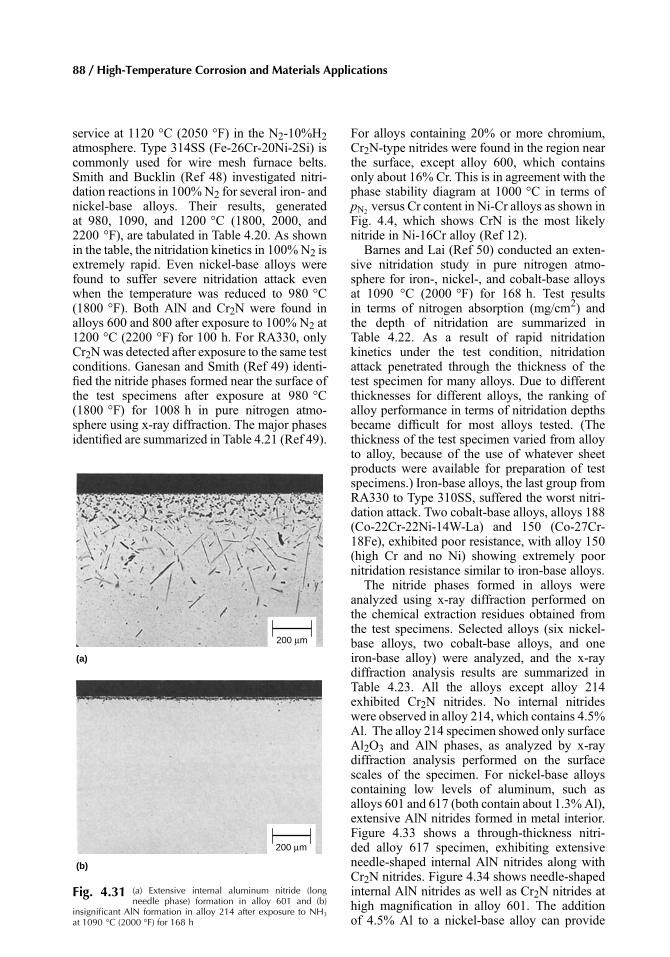
1%), such as alloys 601 and 617, a significantamount of internal aluminum nitrides formed inthe alloy, as shown in Fig. 4.31(a). Also observedin alloy 601 (Fig. 4.31a) are chromium nitrides(blocky-type phases) that formed near the alloysurface. For alloys containing high concen-trations of aluminum (e.g., 4.5%Al in alloy 214),aluminum nitrides formed on the alloy surface,as shown in Fig. 4.31(b). Al2O3 oxide is alsobelieved to form on the alloy 214 surface.
4.6 Nitridation in N2 Atmosphere
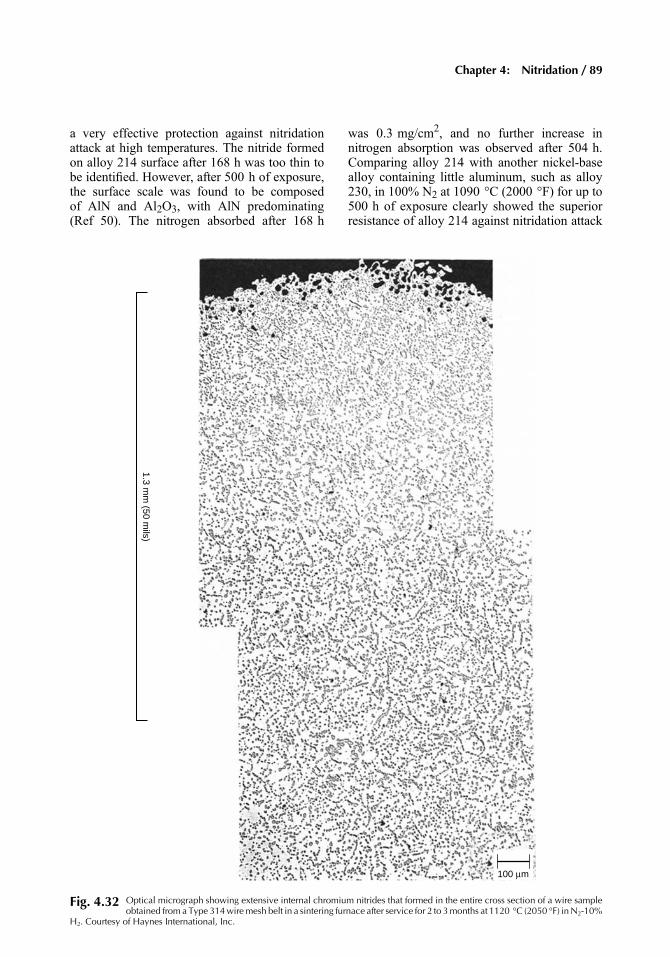
Metals and alloys are also susceptible tonitridation attack in N2 or N2-H2 environments,particularly at high temperatures. The N2 orN2-H2 atmosphere is commonly used as a pro-tective atmosphere in heat treating and sinter-ing operations. Figure 4.32 shows extensivenitridation attack of Type 314 wire mesh beltin a sintering furnace after 2 to 3 months of
50 μm 50 μm(a) (c)
50 μm(b) 50 μm(d)
Fig. 4.30 Optical micrographs showing typical nitridemorphology in form of internal nitrides penetrating into themetal interior whenexposed to NH3 for 168 h at 980 °C (1800 °F) for (a) Type 446, (b) Type 304, (c) alloy 800H, and (d) alloy 188. Courtesy of
Haynes International, Inc.
Chapter 4: Nitridation / 87
service at 1120 °C (2050 °F) in the N2-10%H2atmosphere. Type 314SS (Fe-26Cr-20Ni-2Si) iscommonly used for wire mesh furnace belts.Smith and Bucklin (Ref 48) investigated nitri-dation reactions in 100% N2 for several iron- andnickel-base alloys. Their results, generatedat 980, 1090, and 1200 °C (1800, 2000, and2200 °F), are tabulated in Table 4.20. As shownin the table, the nitridation kinetics in 100%N2 isextremely rapid. Even nickel-base alloys werefound to suffer severe nitridation attack evenwhen the temperature was reduced to 980 °C(1800 °F). Both AlN and Cr2N were found inalloys 600 and 800 after exposure to 100% N2 at1200 °C (2200 °F) for 100 h. For RA330, onlyCr2Nwas detected after exposure to the same testconditions. Ganesan and Smith (Ref 49) identi-fied the nitride phases formed near the surface ofthe test specimens after exposure at 980 °C(1800 °F) for 1008 h in pure nitrogen atmo-sphere using x-ray diffraction. The major phasesidentified are summarized in Table 4.21 (Ref 49).
For alloys containing 20% or more chromium,Cr2N-type nitrides were found in the region nearthe surface, except alloy 600, which containsonly about 16% Cr. This is in agreement with thephase stability diagram at 1000 °C in terms ofpN2 versus Cr content in Ni-Cr alloys as shown inFig. 4.4, which shows CrN is the most likelynitride in Ni-16Cr alloy (Ref 12).
Barnes and Lai (Ref 50) conducted an exten-sive nitridation study in pure nitrogen atmo-sphere for iron-, nickel-, and cobalt-base alloysat 1090 °C (2000 °F) for 168 h. Test resultsin terms of nitrogen absorption (mg/cm2) andthe depth of nitridation are summarized inTable 4.22. As a result of rapid nitridationkinetics under the test condition, nitridationattack penetrated through the thickness of thetest specimen for many alloys. Due to differentthicknesses for different alloys, the ranking ofalloy performance in terms of nitridation depthsbecame difficult for most alloys tested. (Thethickness of the test specimen varied from alloyto alloy, because of the use of whatever sheetproducts were available for preparation of testspecimens.) Iron-base alloys, the last group fromRA330 to Type 310SS, suffered the worst nitri-dation attack. Two cobalt-base alloys, alloys 188(Co-22Cr-22Ni-14W-La) and 150 (Co-27Cr-18Fe), exhibited poor resistance, with alloy 150(high Cr and no Ni) showing extremely poornitridation resistance similar to iron-base alloys.
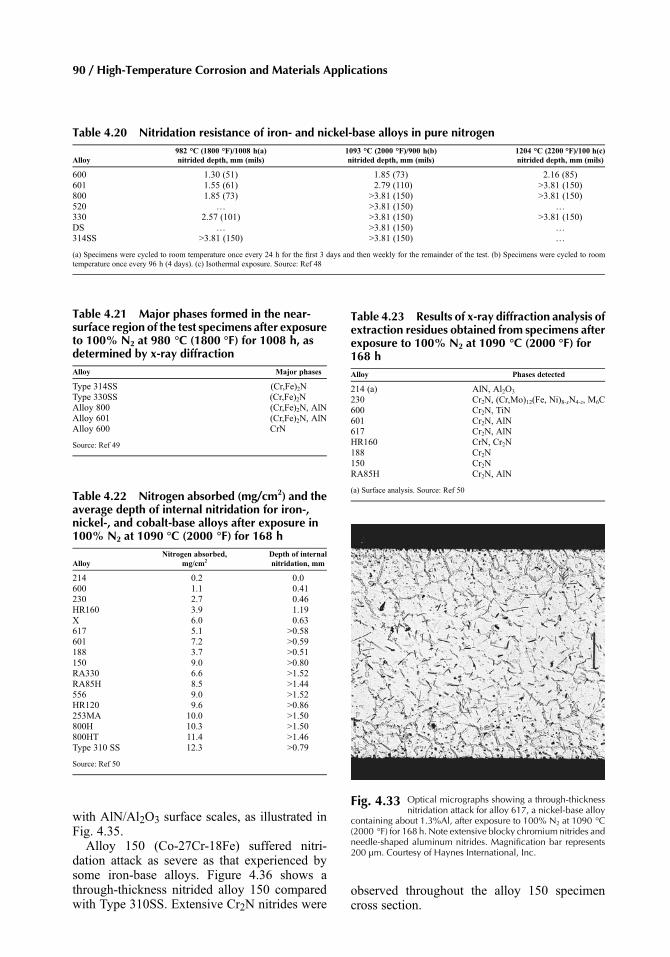
The nitride phases formed in alloys wereanalyzed using x-ray diffraction performed onthe chemical extraction residues obtained fromthe test specimens. Selected alloys (six nickel-base alloys, two cobalt-base alloys, and oneiron-base alloy) were analyzed, and the x-raydiffraction analysis results are summarized inTable 4.23. All the alloys except alloy 214exhibited Cr2N nitrides. No internal nitrideswere observed in alloy 214, which contains 4.5%Al. The alloy 214 specimen showed only surfaceAl2O3 and AlN phases, as analyzed by x-raydiffraction analysis performed on the surfacescales of the specimen. For nickel-base alloyscontaining low levels of aluminum, such asalloys 601 and 617 (both contain about 1.3%Al),extensive AlN nitrides formed in metal interior.Figure 4.33 shows a through-thickness nitri-ded alloy 617 specimen, exhibiting extensiveneedle-shaped internal AlN nitrides along withCr2N nitrides. Figure 4.34 shows needle-shapedinternal AlN nitrides as well as Cr2N nitrides athigh magnification in alloy 601. The additionof 4.5% Al to a nickel-base alloy can provide
200 μm
(b)
200 μm
(a)
Fig. 4.31 (a) Extensive internal aluminum nitride (longneedle phase) formation in alloy 601 and (b)
insignificant AlN formation in alloy 214 after exposure to NH3
at 1090 °C (2000 °F) for 168 h
88 / High-Temperature Corrosion and Materials Applications
a very effective protection against nitridationattack at high temperatures. The nitride formedon alloy 214 surface after 168 h was too thin tobe identified. However, after 500 h of exposure,the surface scale was found to be composedof AlN and Al2O3, with AlN predominating(Ref 50). The nitrogen absorbed after 168 h
was 0.3 mg/cm2, and no further increase innitrogen absorption was observed after 504 h.Comparing alloy 214 with another nickel-basealloy containing little aluminum, such as alloy230, in 100% N2 at 1090 °C (2000 °F) for up to500 h of exposure clearly showed the superiorresistance of alloy 214 against nitridation attack
1.3 mm
(50 mils)
100 μm
Fig. 4.32 Optical micrograph showing extensive internal chromium nitrides that formed in the entire cross section of a wire sampleobtained from a Type 314wiremesh belt in a sintering furnace after service for 2 to 3months at 1120 °C (2050 °F) inN2-10%
H2. Courtesy of Haynes International, Inc.
Chapter 4: Nitridation / 89
with AlN/Al2O3 surface scales, as illustrated inFig. 4.35.
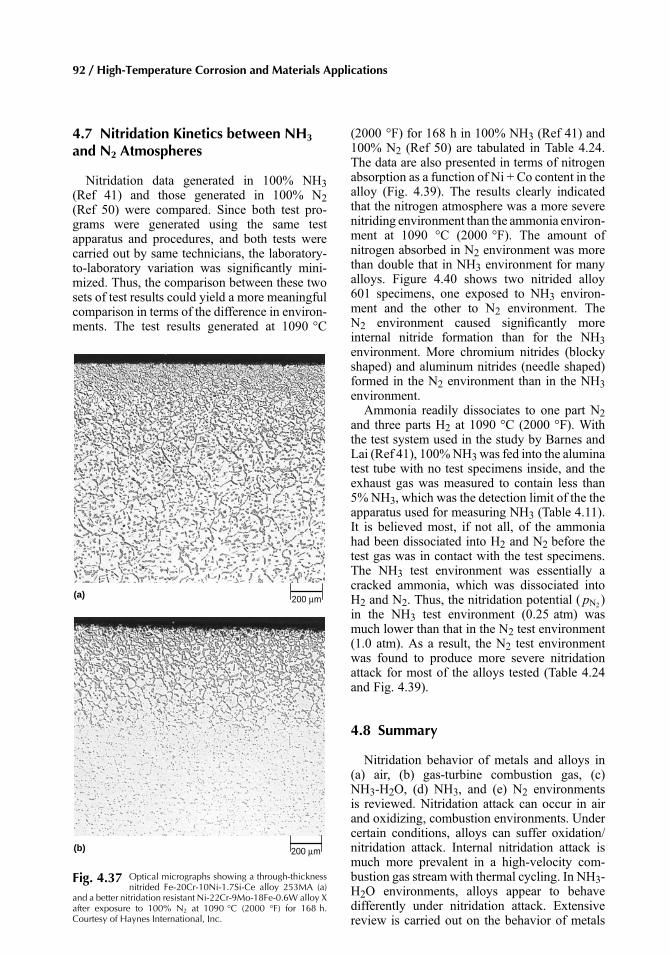
Alloy 150 (Co-27Cr-18Fe) suffered nitri-dation attack as severe as that experienced bysome iron-base alloys. Figure 4.36 shows athrough-thickness nitrided alloy 150 comparedwith Type 310SS. Extensive Cr2N nitrides were
observed throughout the alloy 150 specimencross section.
Table 4.20 Nitridation resistance of iron- and nickel-base alloys in pure nitrogen
Alloy982 °C (1800 °F)/1008 h(a)nitrided depth, mm (mils)
1093 °C (2000 °F)/900 h(b)nitrided depth, mm (mils)
1204 °C (2200 °F)/100 h(c)nitrided depth, mm (mils)
600 1.30 (51) 1.85 (73) 2.16 (85)601 1.55 (61) 2.79 (110) >3.81 (150)800 1.85 (73) >3.81 (150) >3.81 (150)520 … >3.81 (150) …
330 2.57 (101) >3.81 (150) >3.81 (150)DS … >3.81 (150) …
314SS >3.81 (150) >3.81 (150) …
(a) Specimens were cycled to room temperature once every 24 h for the first 3 days and then weekly for the remainder of the test. (b) Specimens were cycled to roomtemperature once every 96 h (4 days). (c) Isothermal exposure. Source: Ref 48
Table 4.21 Major phases formed in the near-surface region of the test specimens after exposureto 100% N2 at 980 °C (1800 °F) for 1008 h, asdetermined by x-ray diffractionAlloy Major phases
Type 314SS (Cr,Fe)2NType 330SS (Cr,Fe)2NAlloy 800 (Cr,Fe)2N, AlNAlloy 601 (Cr,Fe)2N, AlNAlloy 600 CrN
Source: Ref 49
Table 4.22 Nitrogen absorbed (mg/cm2) and theaverage depth of internal nitridation for iron-,nickel-, and cobalt-base alloys after exposure in100% N2 at 1090 °C (2000 °F) for 168 h
AlloyNitrogen absorbed,
mg/cm2Depth of internalnitridation, mm
214 0.2 0.0600 1.1 0.41230 2.7 0.46HR160 3.9 1.19X 6.0 0.63617 5.1 >0.58601 7.2 >0.59188 3.7 >0.51150 9.0 >0.80RA330 6.6 >1.52RA85H 8.5 >1.44556 9.0 >1.52HR120 9.6 >0.86253MA 10.0 >1.50800H 10.3 >1.50800HT 11.4 >1.46Type 310 SS 12.3 >0.79
Source: Ref 50
Table 4.23 Results of x-ray diffraction analysis ofextraction residues obtained from specimens afterexposure to 100% N2 at 1090 °C (2000 °F) for168 hAlloy Phases detected
214 (a) AlN, Al2O3
230 Cr2N, (Cr,Mo)12(Fe, Ni)8-xN4-z, M6C600 Cr2N, TiN601 Cr2N, AlN617 Cr2N, AlNHR160 CrN, Cr2N188 Cr2N150 Cr2NRA85H Cr2N, AlN
(a) Surface analysis. Source: Ref 50
Fig. 4.33 Optical micrographs showing a through-thicknessnitridation attack for alloy 617, a nickel-base alloy
containing about 1.3%Al, after exposure to 100% N2 at 1090 °C(2000 °F) for 168 h. Note extensive blocky chromium nitrides andneedle-shaped aluminum nitrides. Magnification bar represents200 μm. Courtesy of Haynes International, Inc.
90 / High-Temperature Corrosion and Materials Applications
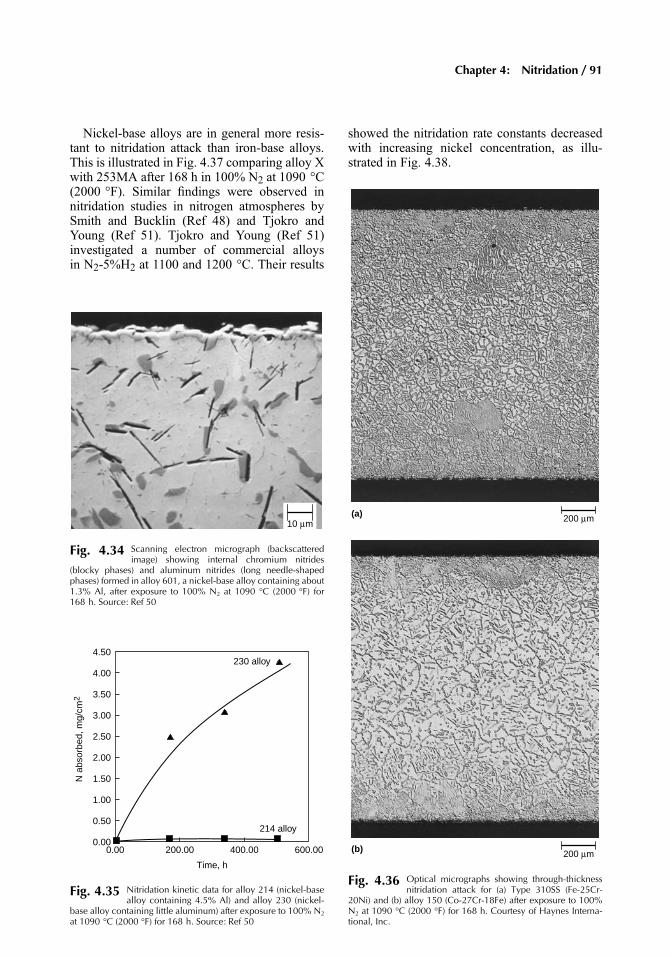
Nickel-base alloys are in general more resis-tant to nitridation attack than iron-base alloys.This is illustrated in Fig. 4.37 comparing alloy Xwith 253MA after 168 h in 100% N2 at 1090 °C(2000 °F). Similar findings were observed innitridation studies in nitrogen atmospheres bySmith and Bucklin (Ref 48) and Tjokro andYoung (Ref 51). Tjokro and Young (Ref 51)investigated a number of commercial alloysin N2-5%H2 at 1100 and 1200 °C. Their results
showed the nitridation rate constants decreasedwith increasing nickel concentration, as illu-strated in Fig. 4.38.
10 μm
Fig. 4.34 Scanning electron micrograph (backscatteredimage) showing internal chromium nitrides
(blocky phases) and aluminum nitrides (long needle-shapedphases) formed in alloy 601, a nickel-base alloy containing about1.3% Al, after exposure to 100% N2 at 1090 °C (2000 °F) for168 h. Source: Ref 50
0.00
0.50
1.00
1.50
2.00
2.50
3.00
N a
bsor
bed,
mg/
cm2 3.50
4.00
4.50
200.00
Time, h
214 alloy
230 alloy
400.00 600.000.00
Fig. 4.35 Nitridation kinetic data for alloy 214 (nickel-basealloy containing 4.5% Al) and alloy 230 (nickel-
base alloy containing little aluminum) after exposure to 100% N2
at 1090 °C (2000 °F) for 168 h. Source: Ref 50
200 μm(a)
200 μm(b)
Fig. 4.36 Optical micrographs showing through-thicknessnitridation attack for (a) Type 310SS (Fe-25Cr-
20Ni) and (b) alloy 150 (Co-27Cr-18Fe) after exposure to 100%N2 at 1090 °C (2000 °F) for 168 h. Courtesy of Haynes Interna-tional, Inc.
Chapter 4: Nitridation / 91
4.7 Nitridation Kinetics between NH3
and N2 Atmospheres
Nitridation data generated in 100% NH3(Ref 41) and those generated in 100% N2(Ref 50) were compared. Since both test pro-grams were generated using the same testapparatus and procedures, and both tests werecarried out by same technicians, the laboratory-to-laboratory variation was significantly mini-mized. Thus, the comparison between these twosets of test results could yield a more meaningfulcomparison in terms of the difference in environ-ments. The test results generated at 1090 °C
(2000 °F) for 168 h in 100% NH3 (Ref 41) and100% N2 (Ref 50) are tabulated in Table 4.24.The data are also presented in terms of nitrogenabsorption as a function of Ni + Co content in thealloy (Fig. 4.39). The results clearly indicatedthat the nitrogen atmosphere was a more severenitriding environment than the ammonia environ-ment at 1090 °C (2000 °F). The amount ofnitrogen absorbed in N2 environment was morethan double that in NH3 environment for manyalloys. Figure 4.40 shows two nitrided alloy601 specimens, one exposed to NH3 environ-ment and the other to N2 environment. TheN2 environment caused significantly moreinternal nitride formation than for the NH3environment. More chromium nitrides (blockyshaped) and aluminum nitrides (needle shaped)formed in the N2 environment than in the NH3environment.
Ammonia readily dissociates to one part N2and three parts H2 at 1090 °C (2000 °F). Withthe test system used in the study by Barnes andLai (Ref 41), 100%NH3was fed into the aluminatest tube with no test specimens inside, and theexhaust gas was measured to contain less than5% NH3, which was the detection limit of the theapparatus used for measuring NH3 (Table 4.11).It is believed most, if not all, of the ammoniahad been dissociated into H2 and N2 before thetest gas was in contact with the test specimens.The NH3 test environment was essentially acracked ammonia, which was dissociated intoH2 and N2. Thus, the nitridation potential ( pN2 )in the NH3 test environment (0.25 atm) wasmuch lower than that in the N2 test environment(1.0 atm). As a result, the N2 test environmentwas found to produce more severe nitridationattack for most of the alloys tested (Table 4.24and Fig. 4.39).
4.8 Summary
Nitridation behavior of metals and alloys in(a) air, (b) gas-turbine combustion gas, (c)NH3-H2O, (d) NH3, and (e) N2 environmentsis reviewed. Nitridation attack can occur in airand oxidizing, combustion environments. Undercertain conditions, alloys can suffer oxidation/nitridation attack. Internal nitridation attack ismuch more prevalent in a high-velocity com-bustion gas stream with thermal cycling. In NH3-H2O environments, alloys appear to behavedifferently under nitridation attack. Extensivereview is carried out on the behavior of metals
200 μm(a)
(b) 200 μm
Fig. 4.37 Optical micrographs showing a through-thicknessnitrided Fe-20Cr-10Ni-1.7Si-Ce alloy 253MA (a)
and a better nitridation resistant Ni-22Cr-9Mo-18Fe-0.6W alloy Xafter exposure to 100% N2 at 1090 °C (2000 °F) for 168 h.Courtesy of Haynes International, Inc.
92 / High-Temperature Corrosion and Materials Applications
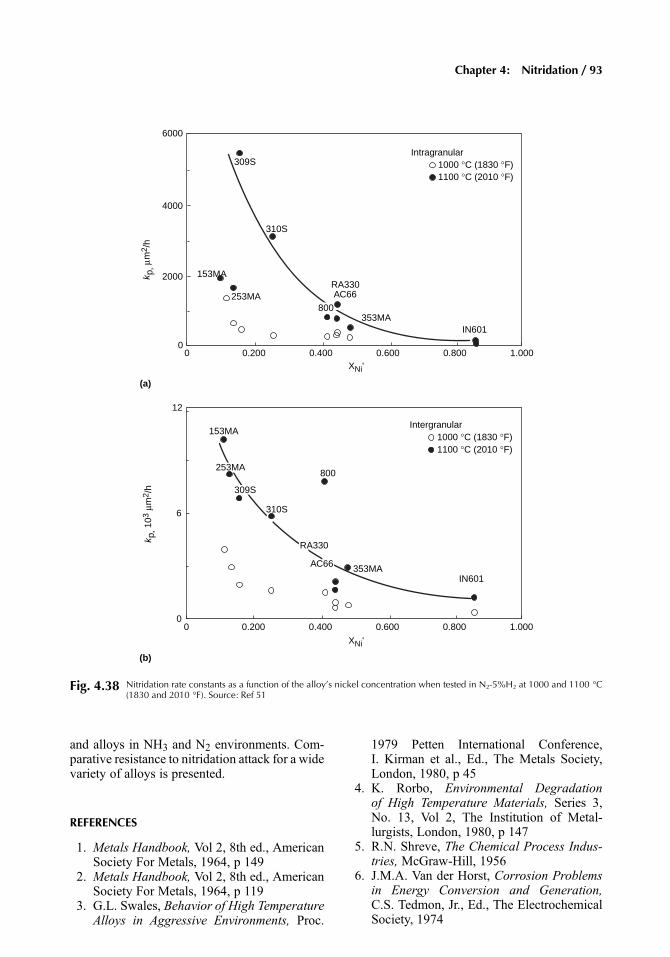
and alloys in NH3 and N2 environments. Com-parative resistance to nitridation attack for a widevariety of alloys is presented.
REFERENCES
1. Metals Handbook, Vol 2, 8th ed., AmericanSociety For Metals, 1964, p 149
2. Metals Handbook, Vol 2, 8th ed., AmericanSociety For Metals, 1964, p 119
3. G.L. Swales, Behavior of High TemperatureAlloys in Aggressive Environments, Proc.
1979 Petten International Conference,I. Kirman et al., Ed., The Metals Society,London, 1980, p 45
4. K. Rorbo, Environmental Degradationof High Temperature Materials, Series 3,No. 13, Vol 2, The Institution of Metal-lurgists, London, 1980, p 147
5. R.N. Shreve, The Chemical Process Indus-tries, McGraw-Hill, 1956
6. J.M.A. Van der Horst, Corrosion Problemsin Energy Conversion and Generation,C.S. Tedmon, Jr., Ed., The ElectrochemicalSociety, 1974
4000
2000
00 0.200 0.400 0.600 0.800 1.000
309S
310S
RA330AC66
353MAIN601
Intragranular
Intergranular
153MA
253MA
1000 °C (1830 °F)1100 °C (2010 °F)
1000 °C (1830 °F)1100 °C (2010 °F)
k p,μ
m2 /
hk p
, 103
μm2 /
h
(a)
(b)
XNi'
XNi'
12
6
00 0.200 0.400 0.600 0.800 1.000
153MA
800
353MAIN601
6000
800
253MA
309S
RA330
AC66
310S
Fig. 4.38 Nitridation rate constants as a function of the alloy’s nickel concentration when tested in N2-5%H2 at 1000 and 1100 °C(1830 and 2010 °F). Source: Ref 51
Chapter 4: Nitridation / 93
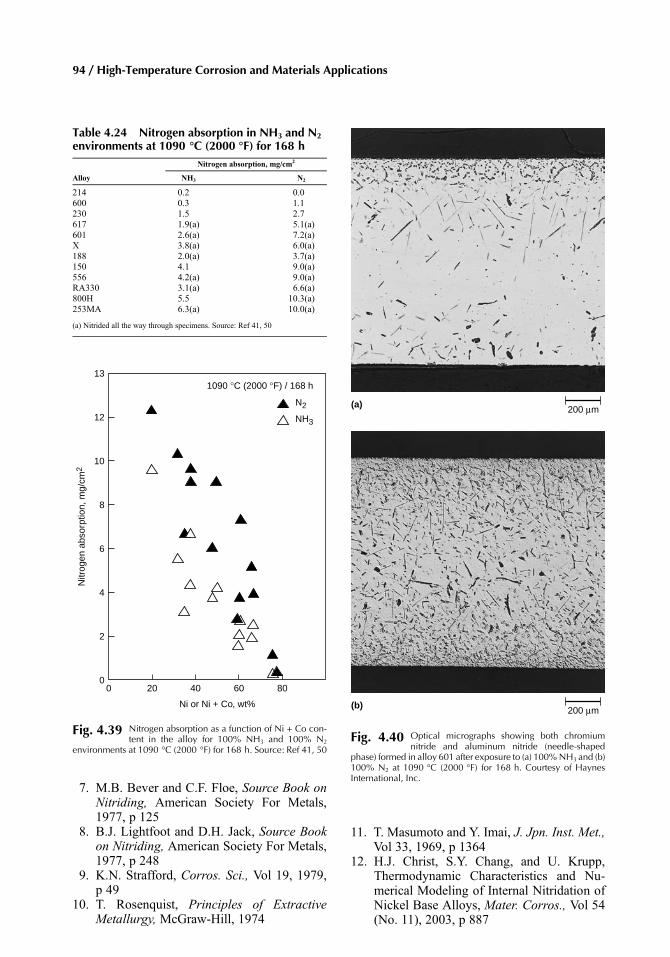
7. M.B. Bever and C.F. Floe, Source Book onNitriding, American Society For Metals,1977, p 125
8. B.J. Lightfoot and D.H. Jack, Source Bookon Nitriding, American Society For Metals,1977, p 248
9. K.N. Strafford, Corros. Sci., Vol 19, 1979,p 49
10. T. Rosenquist, Principles of ExtractiveMetallurgy, McGraw-Hill, 1974
11. T. Masumoto and Y. Imai, J. Jpn. Inst. Met.,Vol 33, 1969, p 1364
12. H.J. Christ, S.Y. Chang, and U. Krupp,Thermodynamic Characteristics and Nu-merical Modeling of Internal Nitridation ofNickel Base Alloys, Mater. Corros., Vol 54(No. 11), 2003, p 887
13
12
1090 °C (2000 °F) / 168 h
N2
NH3
10
8
6
4
2
00 20 40
Ni or Ni + Co, wt%
Nitr
ogen
abs
orpt
ion,
mg/
cm2
60 80
Fig. 4.39 Nitrogen absorption as a function of Ni + Co con-tent in the alloy for 100% NH3 and 100% N2
environments at 1090 °C (2000 °F) for 168 h. Source: Ref 41, 50
Table 4.24 Nitrogen absorption in NH3 and N2environments at 1090 °C (2000 °F) for 168 h
Nitrogen absorption, mg/cm2
Alloy NH3 N2
214 0.2 0.0600 0.3 1.1230 1.5 2.7617 1.9(a) 5.1(a)601 2.6(a) 7.2(a)X 3.8(a) 6.0(a)188 2.0(a) 3.7(a)150 4.1 9.0(a)556 4.2(a) 9.0(a)RA330 3.1(a) 6.6(a)800H 5.5 10.3(a)253MA 6.3(a) 10.0(a)
(a) Nitrided all the way through specimens. Source: Ref 41, 50
200 μm(a)
200 μm(b)
Fig. 4.40 Optical micrographs showing both chromiumnitride and aluminum nitride (needle-shaped
phase) formed in alloy 601 after exposure to (a) 100%NH3 and (b)100% N2 at 1090 °C (2000 °F) for 168 h. Courtesy of HaynesInternational, Inc.
94 / High-Temperature Corrosion and Materials Applications
13. N.S. Corney and E.T. Turkdogan, The Effectof Alloying Elements on the Solubilityof Nitrogen in Iron, J. Iron Steel Inst., Aug1955, p 344
14. D.H. Jack and K.H. Jack, Carbides andNitrides in Steel, Mater. Sci. Eng., Vol 11,1973, p 1
15. H.A. Wriedt and O.D. Gonzalez, Trans.AIME, Vol 221, 1961, p 532
16. J.F. Eckel, T.P. Floridis, and B.N. Ferry,Nitrides in Type 304 Stainless Steel,VirginiaJ. Sci., Vol 17, 1966, p 325
17. J.F. Eckel and T.B. Cox, J. Mater., Vol 3,1968, p 605
18. L.E. Kindlimann and G.S. Ansell, Kineticsof the Internal Nitridation of AusteniticFe-Cr-Ni-Ti Alloys, Metall. Trans., Vol 1,1970, p 163
19. A.J. Heckler and J.A. Peterson, The Effectof Nickel on the Activity of Nitrogen inFe-Ni-N Austenite, Trans. Metall. Soc.AIME, Vol 245, 1969, p 2537
20. J. Litz, A. Rahmel, M. Schorr, and J. Weiss,Scale Formation on the Ni-Base SuperalloysIN 939 and IN 738LC, Oxid. Met., Vol 32,1989, p 167
21. M.A. Harper, J.E. Barnes, and G.Y. Lai,Long-Term Oxidation Behavior of SelectedHigh Temperature Alloys, Paper No. 132,Corrosion/97, NACE International, 1997
22. G.Y. Lai, unpublished results, 200323. S. Han and D.J. Young, Simultaneous
Internal Oxidation and Nitridation of Ni-Cr-Al Alloys, Oxid. Met., Vol 55, 2001,p 223
24. D.L. Douglass, Anomalous BehaviorDuring Internal Oxidation and Nitridation,JOM, Nov 1991, p 74
25. R.P. Rubly and D.L. Douglass, Oxid. Met.,Vol 35, 1991, p 269
26. R.P. Rubly and D.L. Douglass, InternalNitridation of Ni-Cr-Al Alloys, Proc. Int.Symp. On Solid-State Chemistry of Ad-vanced Materials: High-Temperature Cor-rosion Workshop, 1992
27. H.J. Grabke and E.M. Peterson, Scr. Met.,Vol 12, 1978, p 1111
28. J.-W. Park and C. J. Alstetter,Metall. Trans.A, Vol 18A, 1987, p 43
29. P.L. Gruzin, Y.A. Polikarpov, and G.B.Federov, Fiz. Metal. I Metalloved., Vol 4(No. 1), 1957, p 94
30. K.G. Brickner, G.A. Ratz, and R.F.Domagala, Creep-Rupture Properties ofStainless Steels at 1600, 1800, and 2000 °F,
Advances in the Technology of StainlessSteels and Related Alloys, STP 369, ASTM,1965, p 99
31. M. Yu, R. Sandstrom, B. Lehtinen, andC.Westman, Scand. J. Metall.,Vol 16, 1987,p 154
32. V. Guttmann and R. Burgel, Creep-Structural Relationship in Steel Alloy 800Hat 900–1000 °C, Met. Sci., Vol 17, 1983,p 549
33. M. Welker, A. Rahmel, M. Schutze, Oxi-dation and Nitridation of Alloy 800H at aGrowing Creep Crack and for UnstressedSamples, Metall. Trans. A, Vol 20A, 1989,p 1541
34. J.J. Hoffman and G.Y. Lai, Paper No. 5402,Corrosion 2005, NACE International,2005
35. V.P. Swaminathan and S.J. Lukezich,Degradation of Transition Duct Alloys inGas Turbines, Advanced Materials andCoatings for Combustion Turbines, Proc.ASM 1993 Materials Congress MaterialsWeek (Pittsburgh, PA), Oct 17–21, 1993,V.P. Swaminathan and N.S. Cheruvu, Ed.,ASM International, 1994, p 99
36. G.Y. Lai, Nitridation of Several CombustorAlloys in a Simulated Gas Turbine Com-bustion Environment, Advanced Materialsand Coatings for Combustion Turbines,Proc. ASM 1993 Materials CongressMaterials Week (Pittsburgh, PA), Oct17–21, 1993, V.P. Swaminathan andN.S. Cheruvu, Eds., ASM International,1994, p 113
37. G.Y. Lai, Nitridation Attack in a SimulatedGas Turbine Combustion Environment,Materials for Advanced Power Engineering,Part II, D. Coutsouradis et al., Ed., KluwerAcademic Publishers, The Netherlands,1994, p 1263
38. G.Y. Lai, unpublished results, HaynesInternational, Inc., 1995
39. Y.M. Park and R.E. Sonntag, Int. J. EnergyRes., Vol 14, 1990, p 153
40. H.J. Grabke, S. Strauss, and D. Vogel,Nitridation in NH3-H2O Mixtures, Mater.Corros., Vol 54 (No. 11), 2003, p 895
41. J.J. Barnes and G.Y. Lai, High TemperatureNitridation of Fe-, Ni-, and Co-base Alloys,Corrosion & Particle Erosion at HighTemperatures, Proc. TMS-ASM Sympo-sium, V. Srinivasan and K. Vedula, Ed., TheMinerals, Metals &Materials Society, 1989,p 617
Chapter 4: Nitridation / 95
42. K.M. Verma, H. Ghosh, and J.S. Rai, Brit.Corros. J., Vol 13 (No. 4), 1978, p 173
43. V. Cihal, Corrosion Mechanisms inAmmonia Synthesis Equipment, Conf.Proc., First International Congress onMetallic Corrosion (London, U.K.), April10–15, 1961, L. Kenworthy, Ed., Butter-worths, London, 1962, p 591
44. J.J. Moran, J.R.Mihalisin, and E.N. Skinner,Corrosion, Vol 17 (No. 4), 1961, p 191t
45. D.W. McDowell, Jr., Mater. Protect., Vol 1(No. 7), 1962, p 18
46. K.H. Jack, High Temperature Gas-MetalReactions in Mixed Environments,S.A. Jansson and Z.A. Foroulis, Ed., TheMetallurgical Society of AIME, 1973,p 182
47. H. Schenck, M.G. Frohberg, and F.Reinders, Stahl Eisen, Vol 83, 1963, p 93
48. G.D. Smith and P.J. Bucklin, SomeObservation on the Performance ofNickel-Containing Commercial Alloys inNitrogen-Based Atmospheres, Paper No.375, Corrosion/86, NACE, 1986
49. P. Ganesan and G.D. Smith, Performance ofSelected Commercial Alloys in NitrogenBased Sintering Atmospheres, PaperNo. 278, Corrosion/90, NACE, 1990
50. J.J. Barnes and G.Y. Lai, Factors Affectingthe Nitridation Behavior of Fe-Base, Ni-Base and Co-Base Alloys in Pure Nitrogen,J. Physique IV, Colloque C9, supplementalau Journal de Physique III, Vol 3, 1993,p 167
51. K. Tjokro and D.J. Young, Comparison ofInternal Nitridation Reactions in Ammoniaand in Nitrogen, Oxid. Met., Vol 44, 1995,p 453
96 / High-Temperature Corrosion and Materials Applications