


Languages
Pages
Legal


Corn Situation and Outlook
Historical Perspective and Outlook for 2007
Corn Production, Ending Stocks, and Price, 1992-2007
0
2000
4000
6000
8000
10000
12000
14000
1992 1993 1994 1995 1996 1997 1998 1999 2000 2001 2002 2003 2004 2005 2006
Mill
ion
bu
$0.00
$0.50
$1.00
$1.50
$2.00
$2.50
$3.00
$3.50
Production Ending Stocks Price/Bu
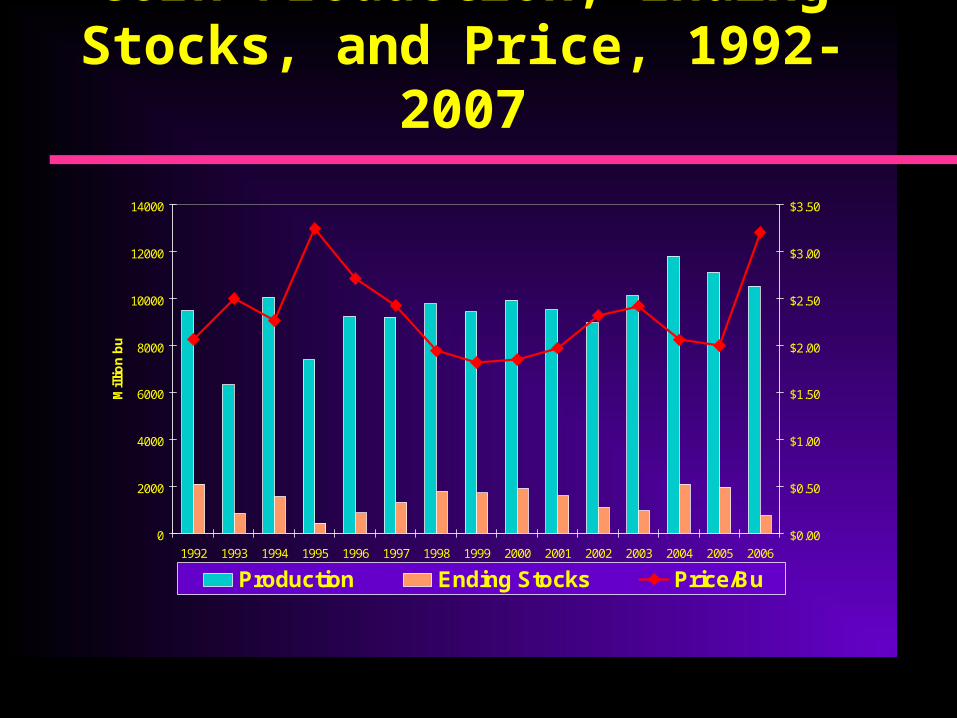
U.S. Corn Ending Stocks and Price, 1992-2007
0
500
1000
1500
2000
2500
1992 1993 1994 1995 1996 1997 1998 1999 2000 2001 2002 2003 2004 2005 2006
Mill
ion
bu
$1.50
$1.70
$1.90
$2.10
$2.30
$2.50
$2.70
$2.90
$3.10
$3.30
$3.50
Ending Stocks Price/Bu

U.S. & Foreign Corn Ending Stocks 1996-2007
010002000300040005000600070008000
1996
1997
1998
1999
2000
2001
2002
2003
2004
2005
2006
Year
Mil
lio
n b
ush
els
Foreign Stocks U.S. Ending Stocks

Supply/Demand Projections:2006/2007 Corn ----------Supply/Demand ----------
Low/High Exp/Exp High/Low
Beginning Stocks(MB) 1967 1967 1967Acres (M. P. A.) 78.3 Yield 149.1 Supply(M. Bu) 12512 Use:
Feed 5975Ethanol 2150 Food, Seed 1385 Exports 2250
Ending Stocks 682 752 822Projected Price $3.50 $3.30 $3.10

Supply/Demand Projections:2007/2008 Corn ----------Supply/Demand ----------
Low/High Exp/Exp High/Low
Beginning Stocks(MB) 752 752 752Acres (MPA) 84.0 87.0 90.0Acres (MHA) 76.0 79.8 81.4Yield 147 152.8 157Supply(M. Bu) 11934 12962 13542 Use:
Feed 5800Ethanol 3200 Food, Seed 1400 Exports 1925
Ending Stocks 350 637 1500Projected Price $5.50 $3.60 $3.00

Wheat Situation and Outlook
Historical Perspective and Outlook for 2007

Wheat Production, Ending Stocks, and Price, 1993-2007
0
500
1000
1500
2000
2500
3000
1993 1994 1995 1996 1997 1998 1999 2000 2001 2002 2003 2004 2005 2006
Mil
lio
n B
u
$0.00
$0.50
$1.00
$1.50
$2.00
$2.50
$3.00
$3.50
$4.00
$4.50
$5.00
Production Ending Stocks Price/Bu

U.S. Wheat Ending Stocks and Price, 1993-2007
0
200
400
600
800
1000
1993 1994 1995 1996 1997 1998 1999 2000 2001 2002 2003 2004 2005 2006
Mil
lio
n B
u
$2.00
$2.50
$3.00
$3.50
$4.00
$4.50
$5.00
Ending Stocks Price/Bu

U.S. & Foreign Wheat Ending Stocks, 1996-2007
010002000300040005000600070008000
1996
1997
1998
1999
2000
2001
2002
2003
2004
2005
2006
Year
Mil
lio
n b
ush
els
Foreign Ending Stocks U.S. Ending Stocks

Supply/Demand Projections:2006/2007 Wheat ----------Supply/Demand ----------
Low/High Exp/Exp High/Low
Beginning Stocks(MB) 571 Acres (M. A. Planted) 57.3 Yield 38.7 Supply(M. Bu) 2498 Use:
Food, Seed 1006 Feed, Resid 145 Exports 875
Ending Stocks 444 472 500Projected Price $4.40 $4.20 $4.00

Supply/Demand Projections:2007/2008 Wheat ----------Supply/Demand ----------
Low/High Exp/Exp High/LowBeginning Stocks(MB) 472 472 472Acres (M. A. Planted) 58.0 60.0 62.0Acres (M.A. Harvested) 49.3 51.0 52.7Yield 38.0 42.5 44.0Supply(M. Bu) 2445 2742 2891 Use:
Food, Seed 1011 Feed, Resid 300 Exports 925
Ending Stocks 350 506 780Projected Price $5.25 $4.30 $3.20

Soybean Situation and Outlook
Historical Perspective and Outlook for 2007

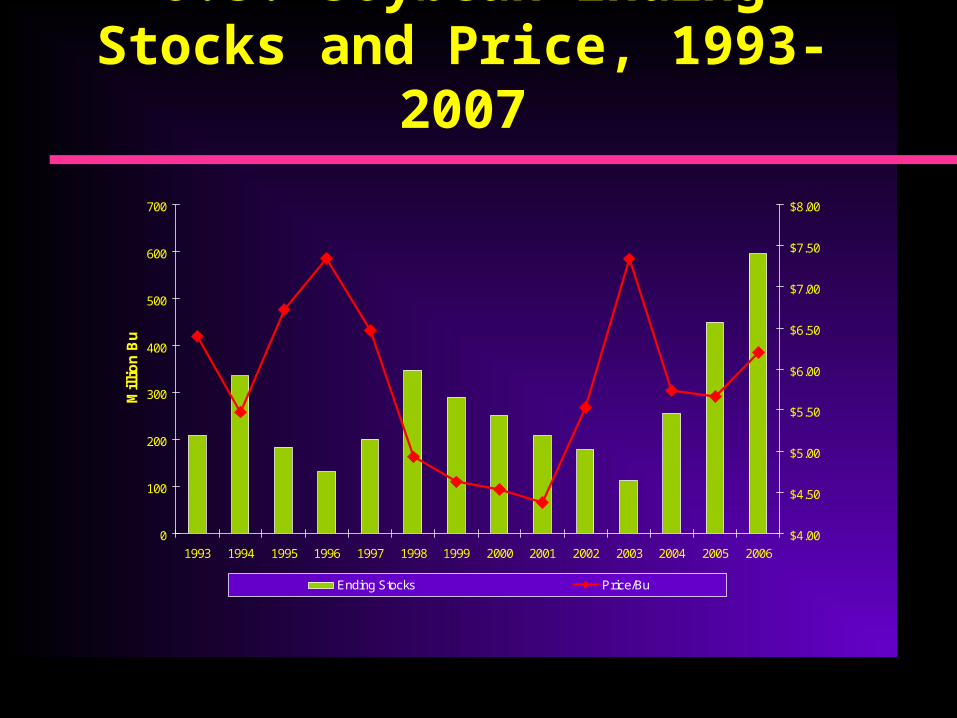
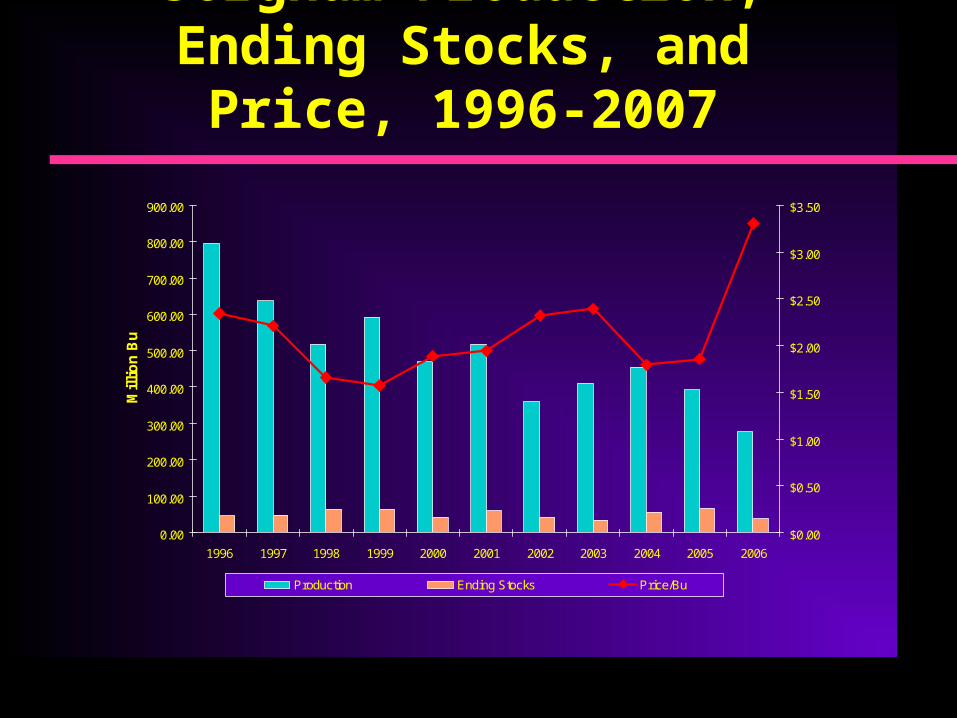
Soybean Production, Ending Stocks, and Price, 1993-2007
0
500
1000
1500
2000
2500
3000
3500
1993 1994 1995 1996 1997 1998 1999 2000 2001 2002 2003 2004 2005 2006
Mil
lio
n B
u
$0.00
$1.00
$2.00
$3.00
$4.00
$5.00
$6.00
$7.00
$8.00
Production Ending Stocks Price/Bu
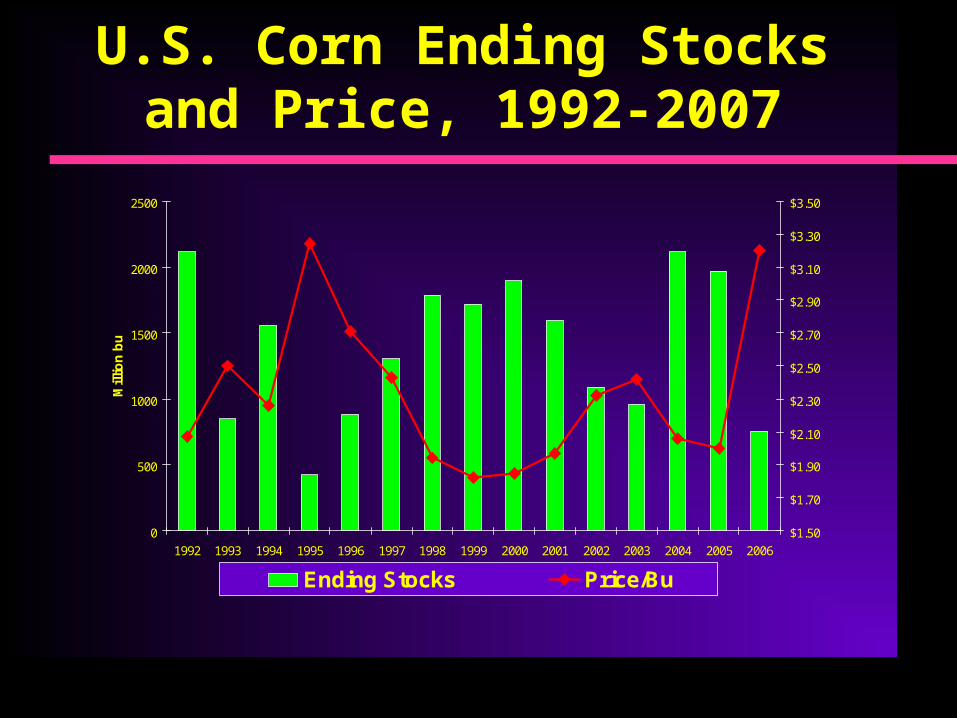
U.S. Soybean Ending Stocks and Price, 1993-2007
0
100
200
300
400
500
600
700
1993 1994 1995 1996 1997 1998 1999 2000 2001 2002 2003 2004 2005 2006
Mil
lio
n B
u
$4.00
$4.50
$5.00
$5.50
$6.00
$6.50
$7.00
$7.50
$8.00
Ending Stocks Price/Bu
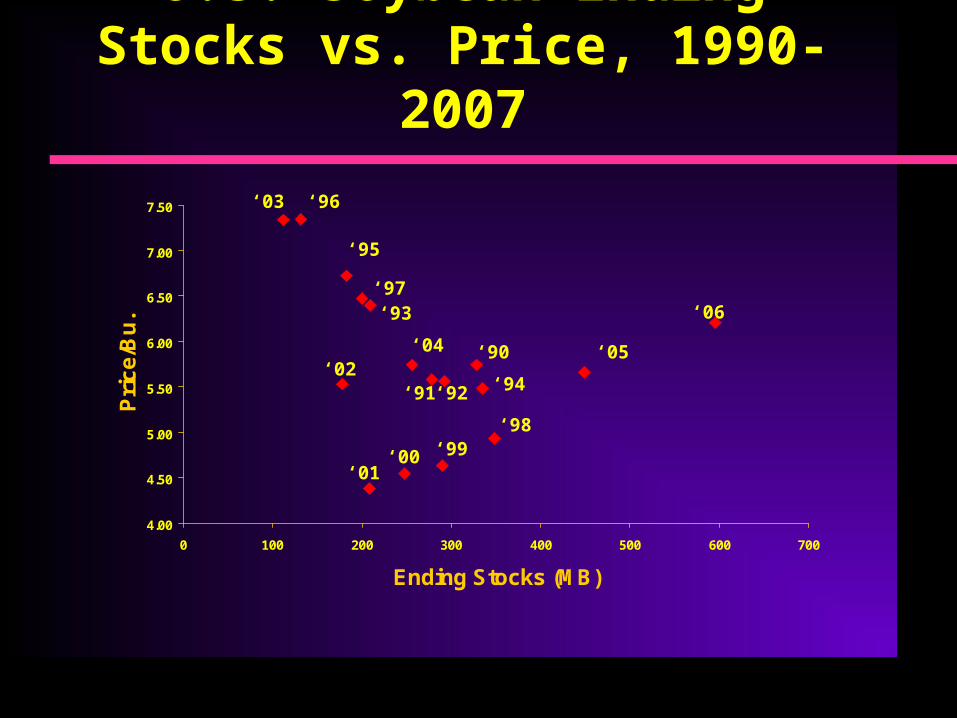
U.S. Soybean Ending Stocks vs. Price, 1990-2007
4.00
4.50
5.00
5.50
6.00
6.50
7.00
7.50
0 100 200 300 400 500 600 700
Ending Stocks (MB)
Pri
ce
/Bu
. ‘06
‘05
‘01‘00 ‘99
‘98
‘97
‘96
‘95
‘94
‘93
‘92‘91
‘90‘04
‘03
‘02

U.S. & Foreign Soybean Ending Stocks, 1996-2007
0
500
1000
1500
2000
2500
1996 1997 1998 1999 2000 2001 2002 2003 2004 2005 2006Year
Mil
lio
n B
ush
els
Foreign Ending Stocks U.S. Ending Stocks
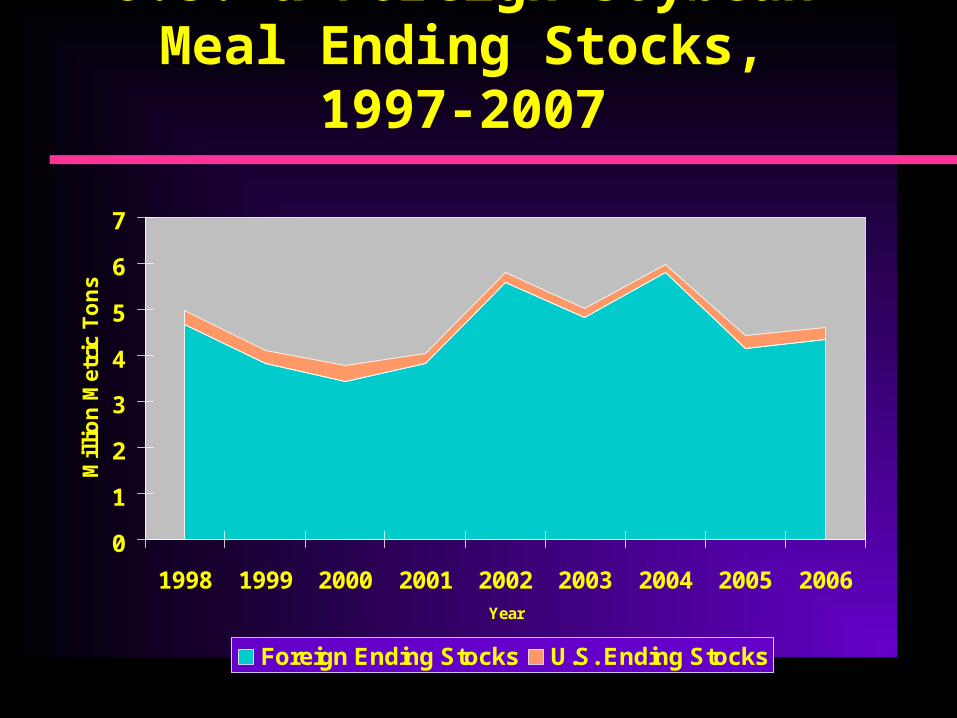
U.S. & Foreign Soybean Meal Ending Stocks, 1997-2007
0
1
2
3
4
5
6
7
1998 1999 2000 2001 2002 2003 2004 2005 2006Year
Mil
lio
n M
etri
c T
on
s
Foreign Ending Stocks U.S. Ending Stocks
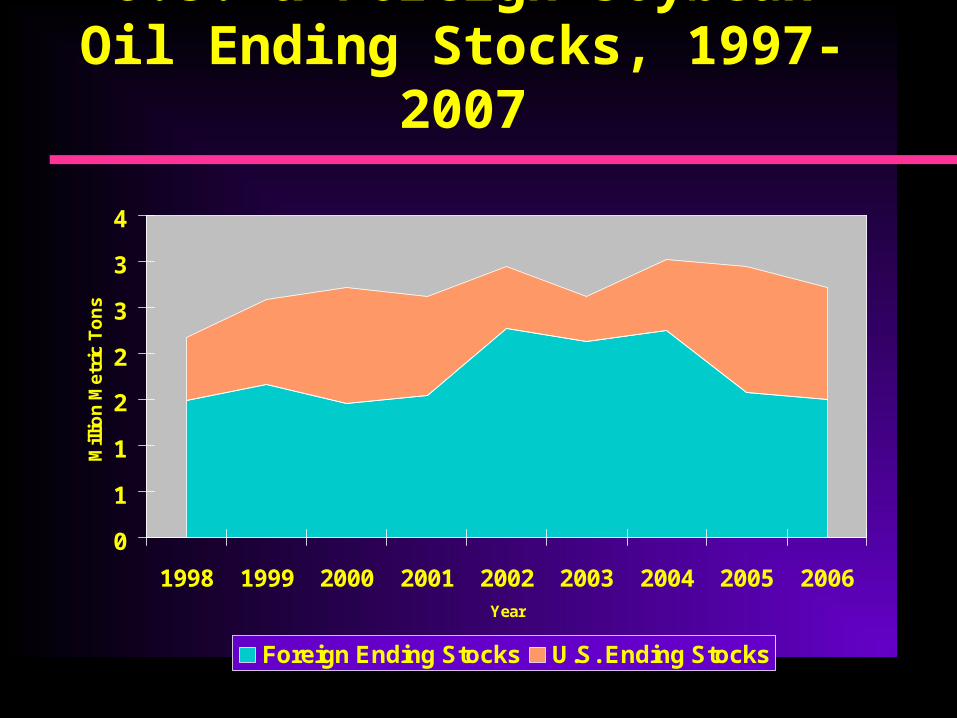
U.S. & Foreign Soybean Oil Ending Stocks, 1997-2007
0
1
1
2
2
3
3
4
1998 1999 2000 2001 2002 2003 2004 2005 2006Year
Mill
ion
Me
tric
To
ns
Foreign Ending Stocks U.S. Ending Stocks

Supply/Demand Projections:2006/2007 Soybeans ----------Supply/Demand ----------
Low/High Exp/Exp High/LowBeginning Stocks(MB) 449 449 449Acres (M. P. A.) 75.2 75.5 75.8Yield 42.5 42.7 42.9Supply(M. Bu) 3611 3642 3666 Use:
Crushing 1780 Exports 1100 Seed, Feed 166
Ending Stocks 461 595 729Projected Price $6.50 $6.30 $6.10

Supply/Demand Projections:2007/2008 Soybeans ----------Supply/Demand ----------
Low/High Exp/Exp High/LowBeginning Stocks(MB) 595 595 595Acres (MA Planted) 68.0 70.5 72.0Acres (MA Harvested) 67.0 69.4 70.8Yield 38.0 41.5 44.0Supply(M. Bu) 3145 3479 3714 Use:
Crushing 1820 Exports 1125 Seed, Feed 164
Ending Stocks 120 370 650Projected Price $8.50 $7.10 $5.50

Grain Sorghum Situation and Outlook
Historical Perspective and Outlook for 2007
Sorghum Production, Ending Stocks, and Price, 1996-2007
0.00
100.00
200.00
300.00
400.00
500.00
600.00
700.00
800.00
900.00
1996 1997 1998 1999 2000 2001 2002 2003 2004 2005 2006
Mil
lio
n B
u
$0.00
$0.50
$1.00
$1.50
$2.00
$2.50
$3.00
$3.50
Production Ending Stocks Price/Bu

U.S. Sorghum Ending Stocks and Price, 1996-2007
0.00
10.00
20.00
30.00
40.00
50.00
60.00
70.00
1996 1997 1998 1999 2000 2001 2002 2003 2004 2005 2006
Mil
lio
n B
u
$1.50
$2.00
$2.50
$3.00
$3.50
Ending Stocks Price/Bu

Supply/Demand Projections:2006/2007Sorghum ----------Supply/Demand ----------
Low/High Exp/Exp High/Low
Beginning Stocks(MB) 66.0 66.0 66.0
Acres (M. P. A.) 6.5 6.5 6.5
Supply(M. Bu) 343 343 343
Use:
Food & Seed 45
Exports 150
Feed 110
Ending Stocks 27 38 49
Projected Price $3.40 $3.20 $3.00

Cotton Situation and Outlook
Historical Perspective and Outlook for 2007

Cotton Production, Ending Stocks, and Price, 1993-2007
0
5000
10000
15000
20000
25000
30000
1993 1994 1995 1996 1997 1998 1999 2000 2001 2002 2003 2004 2005 2006
Th
ou
sa
nd
Ba
les
0
10
20
30
40
50
60
70
80
90
Production Ending Stocks Price(cents/lb)

U.S. Cotton Ending Stocks and Price, 1993-2007
0
1000
2000
3000
4000
5000
6000
7000
8000
9000
10000
1993 1994 1995 1996 1997 1998 1999 2000 2001 2002 2003 2004 2005 2006
Th
ou
sa
nd
Ba
les
30
35
40
45
50
55
60
65
70
75
80
Ending Stocks Price(cents/lb)

U.S. & Foreign Cotton Ending Stocks, 1997-2007
0
10000
20000
30000
40000
50000
60000
1997 1998 1999 2000 2001 2002 2003 2004 2005 2006Year
Th
ou
san
d B
ales
Foreign Ending Stocks U.S. Ending Stocks

Supply/Demand Projections:2006/2007 Cotton ----------Supply/Demand ----------
Low/High Exp/Exp High/Low
Beginning Stocks(MB) 6.0 6.0 6.0
Acres (M. P. A.) 15.25 15.27 15.30
Yield 815 819 823
Supply(MB) 27.7 27.8 28.0
Use:
Domestic 5.0
Exports 14.0
Ending Stocks 7.8 8.8 9.8
Projected Price/cwt $54 $48 $42

Supply/Demand Projections:2007/2008 Cotton ----------Supply/Demand ----------
Low/High Exp/Exp High/Low
Beginning Stocks(MB) 8.8 8.8 8.8Acres (M. P. A.) 12.8 13.0 13.2Acres (MA Harvested) 11.6 11.8 12.0Yield 750 815 850Supply(MB) 26.9 28.8 30.0 Use:
Domestic 4.5 Exports 18.0
Ending Stocks 5.2 6.3 8.5Projected Price/cwt $65 $54 $47

What Could Change The Outlook?
South America Plant Mix Non-Farm Economic Conditions in U.S.,
World – Oil Supplies, War Exchange Rates China Weather
Top Related