


Languages
Pages
Legal


Copyright 2014 by Diane S. Docking 1
Interest Rate Risk Management:DGAP

Learning Objectives
Define the duration gap measure of interest rate risk
Understand the process of DGAP management
Copyright 2014 by Diane S. Docking 2

Copyright 2014 by Diane S. Docking 3
Duration GAP
Why look at Duration GAP? ISGAP does not fully take into account the
effect of changing interest rates on bank’s capital.
Immunize Financial Institution Balance sheet

4Copyright 2014 by Diane S. Docking
Duration Gap Analysis
Recall: The basic equation for determining the change in market value for assets or liabilities is:
% Change in Value = – DUR x [Δi / (1 + i)]
or
Change in Value = – DUR x [Δi / (1 + i)] x Original Value

Copyright 2014 by Diane S. Docking 5
Immunizing a Bank’s Balance Sheet
Use duration to immunize bank assets and liabilities, in effect the capital. Duration is an attractive measure because it is
_____________across assets and liabilities.
If duration of capital = , the bank will not be affected by changes in interest rates.

Copyright 2014 by Diane S. Docking 6
Dollar-Weighted Average Duration of an Asset Portfolio
n
1iiA iA Dx w D
Where:
wi = the dollar amount of the ith asset divided by total assets
DAi = the duration of the ith asset in the portfolio
001TA
i
iDTA A
Copyright 2014 by Diane S. Docking 7
Dollar-Weighted Average Duration of a Liability Portfolio
n
1iLiL i
D x w D
Where:
wi = the dollar amount of the ith liability divided by total liabilities
DLi = the duration of the ith liability in the portfolio
001TL
i
iDTL L
Copyright 2014 by Diane S. Docking 8
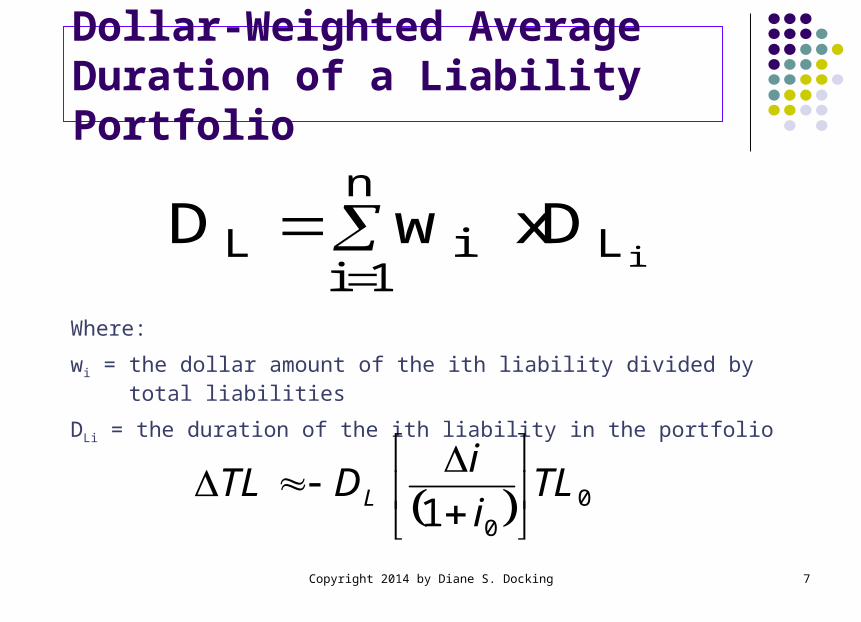
Leverage-Adjusted Duration Gap (DGAPK)
TA
TL x D - D DGAP LAK
where:TA or A= total assets of an investment portfolio or a bankK = total capital of the bank or net worth of the
investment portfolioTL or L = total liabilities of an investment portfolio or a bank

Copyright 2014 by Diane S. Docking 9
Duration Gap
DGAP models focus on managing net worth (capital) or the net market value of the portfolio, recognizing the timing of all individual cash flows.
Management’s goal is to stabilize or increase net worth or the value of the portfolio.
If Fund/Bank expects interest rates to increase (decrease), then it will want a negative (positive) DGAP
Copyright 2014 by Diane S. Docking 10
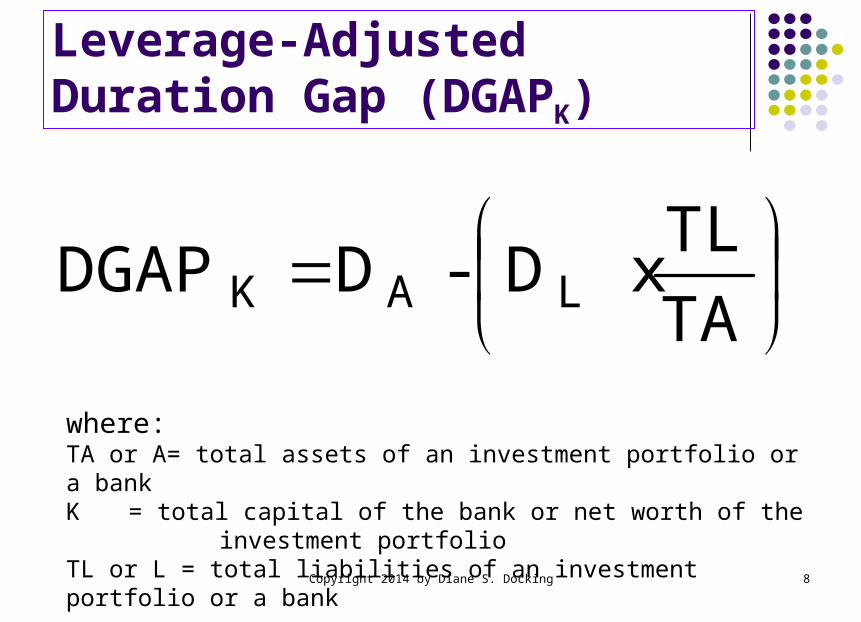
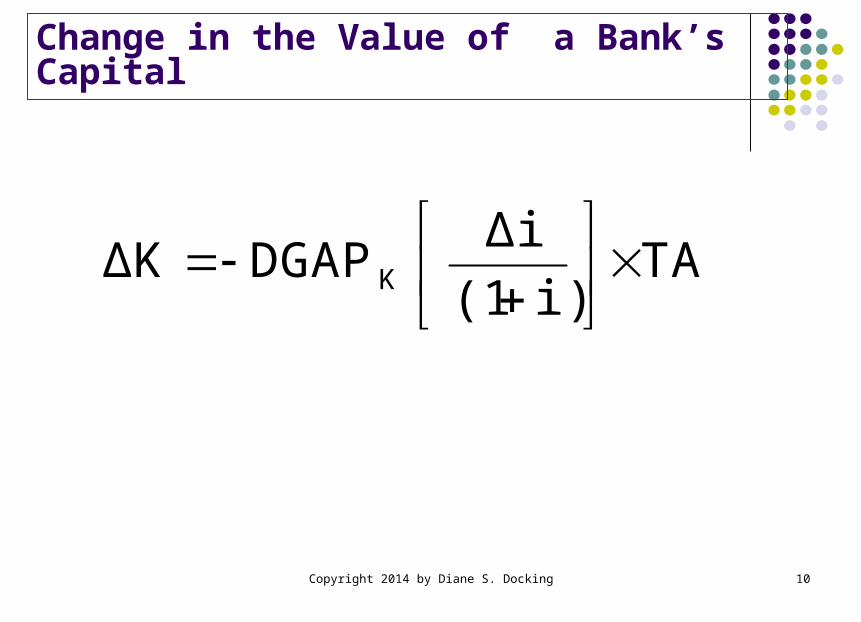
Change in the Value of a Bank’s Capital
TA i) (1
Δi DGAPΔK K

Copyright 2014 by Diane S. Docking 11
Example: DGAP - Financial Institution Balance Sheet
Given the average duration items from First National Bank’s Balance Sheet (see next slide), calculate the following:
1. Dollar-Weighted average duration of assets?2. Dollar-Weighted average duration of liabilities?3. What is the bank’s Leverage-adjusted Duration
GAP of capital?4. Suppose interest rates decrease from 6% to
4.5%. What is the bank’s dollar change in capital?
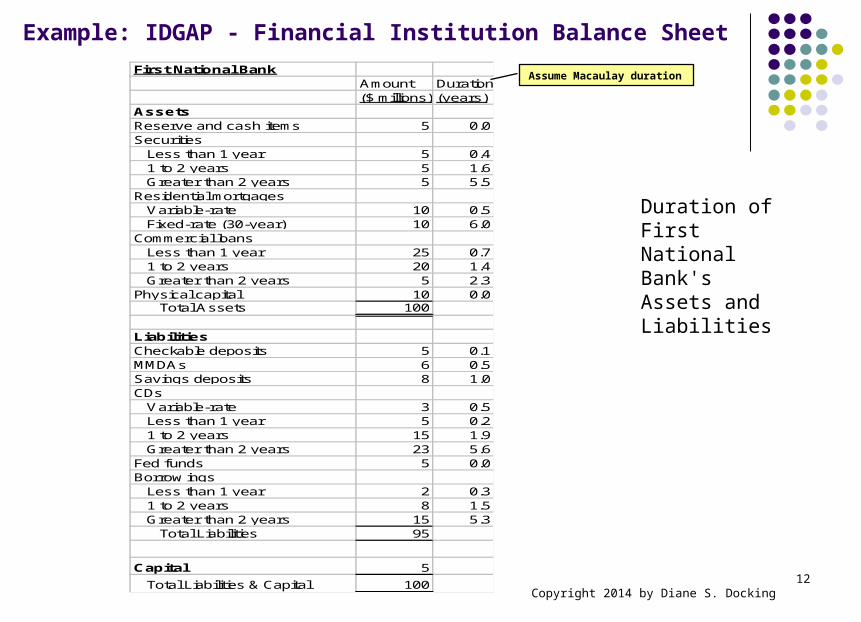
Duration of First National Bank's Assets and Liabilities
First National BankAmount Duration($ millions) (years)
AssetsReserve and cash items 5 0.0Securities Less than 1 year 5 0.4 1 to 2 years 5 1.6 Greater than 2 years 5 5.5Residential mortgages Variable-rate 10 0.5 Fixed-rate (30-year) 10 6.0Commercial loans Less than 1 year 25 0.7 1 to 2 years 20 1.4 Greater than 2 years 5 2.3Physical capital 10 0.0 Total Assets 100
LiabilitiesCheckable deposits 5 0.1MMDAs 6 0.5Savings deposits 8 1.0CDs Variable-rate 3 0.5 Less than 1 year 5 0.2 1 to 2 years 15 1.9 Greater than 2 years 23 5.6Fed funds 5 0.0Borrow ings Less than 1 year 2 0.3 1 to 2 years 8 1.5 Greater than 2 years 15 5.3 Total Liabilities 95
Capital 5
Total Liabilities & Capital 100
Example: IDGAP - Financial Institution Balance Sheet
12Copyright 2014 by Diane S. Docking
Assume Macaulay duration

Example: DGAP - Financial Institution Balance Sheet
First National BankAmount Duration Weight Wtd.Duration($ millions) (years) (%) (years)
AssetsReserve and cash items 5 0.0 5% 0.000Securities Less than 1 year 5 0.4 5% 0.020 1 to 2 years 5 1.6 5% 0.080 Greater than 2 years 5 5.5 5% 0.275Residential mortgages Variable-rate 10 0.5 10% 0.050 Fixed-rate (30-year) 10 6.0 10% 0.600Commercial loans Less than 1 year 25 0.7 25% 0.175 1 to 2 years 20 1.4 20% 0.280 Greater than 2 years 5 2.3 5% 0.115Physical capital 10 0.0 10% 0.000 Total Assets 100 100% DA 1.595
LiabilitiesCheckable deposits 5 0.1 5% 0.005MMDAs 6 0.5 6% 0.032Savings deposits 8 1.0 8% 0.084CDs Variable-rate 3 0.5 3% 0.016 Less than 1 year 5 0.2 5% 0.011 1 to 2 years 15 1.9 16% 0.300 Greater than 2 years 23 5.6 24% 1.356Fed funds 5 0.0 5% 0.000Borrow ings Less than 1 year 2 0.3 2% 0.006 1 to 2 years 8 1.5 8% 0.126 Greater than 2 years 15 5.3 16% 0.837 Total Liabilities 95 100% DL 2.773 DGAPK -1.039
13
Copyright 2014 by Diane S. Docking

Copyright 2014 by Diane S. Docking 14
Example: DGAP - Financial Institution Balance Sheet
$ D in K if rates decrease:
New Capital is: 5 mill. – 1.470283 mill. = _______________
In probable violation of capital ratios.
Ai1
ΔiDGAPΔK
0K
_________million 100$1.06
.0151.039-ΔK

Copyright 2014 by Diane S. Docking 15
Impact of Changing Interest Rates on a Portfolio’s or Bank’s Capital
Sign of DGAP E(i) NW or Capital
Rise Decrease Positive DGAP
Fall Increase
Rise Increase Negative DGAP
Fall Decrease
Rise No Change Zero DGAP
Fall No Change
Copyright 2014 by Diane S. Docking 16
Problems with Duration Gap Analysis
1. Finding Assets and Liabilities of the Same Duration Can be Difficult
2. Some Assets and Liabilities May Have Patterns of CFs Not Well Defined
3. Customer Prepayments May Distort the Expected Cash Flows in Duration
4. Not a Linear Relationship Between Prices and Interest Rates5. Any duration analysis assumes that the yield curve is flat and
shifts in the level of interest rates imply parallel shifts of the yield curve. In reality, the yield curve is seldom flat, and short-term and long-term interest rates have different volatilities or shifts over time.
Copyright 2014 by Diane S. Docking 17
Problems with Duration Gap Management
6. Overly aggressive management that “bets the bank.” This happened to First Pennsylvania Corp. in late 1970s. With rates high at the end of an expansion, it bought long-term securities with short-term borrowed funds (negative dollar gap, positive duration gap). However, instead of rates falling, they shot up further, causing both negative NIMs and losses on equity leading to bankruptcy. Moral: don’t bet the bank on interest rates!
7. Average durations of assets and liabilities drift or change over time and not at the same rates. At one point the duration gap may be 2.0 but one year later it may be only 0.5. Some experts advise rebalancing to keep the duration gap in a target range over time.

Example: Immunize Financial Institution Balance Sheet
18
First National Bank
Amount Duration Weight Wtd.Duration
($ millions) (years) (%) (years)
Assets
Reserve and cash items 5 0.0 5% 0.000
Securities
Less than 1 year 5 0.4 5% 0.018
1 to 2 years 5 1.6 5% 0.073
Greater than 2 years 5 5.5 5% 0.252
Residential mortgages
Variable-rate 10 0.5 9% 0.046
Make 30-yr 5% mtgs. 9 11.4 9% 0.972
Fixed-rate (30-year) 10 6.0 9% 0.549
Commercial loans
Less than 1 year 25 0.7 23% 0.160
1 to 2 years 20 1.4 18% 0.256
Greater than 2 years 5 2.3 5% 0.105
Physical capital 10 0.0 9% 0.000 Total Assets 109 100%
DA 2.431
Liabilities
Checkable deposits 5 0.1 5% 0.005
MMDAs 6 0.5 6% 0.029
Savings deposits 8 1.0 8% 0.077
CDs
Variable-rate 3 0.5 3% 0.014
Attract 3% 90-day CDs 9 0.25 9% 0.022
Less than 1 year 5 0.2 5% 0.010
1 to 2 years 15 1.9 14% 0.273
Greater than 2 years 23 5.6 22% 1.235
Fed funds 5 0.0 5% 0.000
Borrowings
Less than 1 year 2 0.3 2% 0.006
1 to 2 years 8 1.5 8% 0.115
Greater than 2 years 15 5.3 14% 0.762 Total Liabilities 104 100%
DL 2.547 DGAPK 0.000
Copyright 2014 by Diane S. Docking
90/360
See next slide

Duration Calculation
19
rm = 5.00%
Calculation of monthly payment
Loan Amount 100,000.00
Annual Interest Rate 5.00%
Loan Period in Years 30
Number of Payments 360
Monthly Payment 536.8216
t CF PVCF at 5.0%/12 t x PVCF Duration
1 536.82 534.5941 534.5941
2 536.82 532.3759 1,064.7518
3 536.82 530.1669 1,590.5007
4 536.82 527.9670 2,111.8681
5 536.82 525.7763 2,628.8814
355 536.82 122.6791 43,551.0918
356 536.82 122.1701 43,492.5520
357 536.82 121.6632 43,433.7481
358 536.82 121.1583 43,374.6835
359 536.82 120.6556 43,315.3611
360 536.82 120.1550 43,255.7843
100,000.0000 13,718,611.7718 11.4322 yearsCopyright 2014 by Diane S. Docking