


Languages
Pages
Legal


Coping with the Costly
Oversupply of Gas: Liquids
Activity Surges Ahead
Presentation to the AAPG Trustees
September 2011 • Lake Tahoe, California
Robert W. Esser,
IHS CERA (retired)
CONFIDENTIAL
© 2011, All rights reserved, IHS CERA Inc., 55 Cambridge Parkway, Cambridge, Massachusetts 02142
No portion of this presentation may be reproduced, reused or otherwise distributed in any form without prior written consent.
© 2011, IHS CERA Inc. No portion of this presentation may be reproduced, reused, or otherwise distributed in any form without prior written consent.
1
AAPG_09211
Terms of Use
• IHS CERA content and information, including but not limited to graphs, charts, tables,
figures, and data, are not to be disseminated outside of a client organization to any third
party, including a client’s customers, financial institutions, consultants, or the public.
• Content distributed within the client organization must display IHS CERA’s legal notices and
attributions of authorship.
The accompanying materials were prepared by IHS CERA Inc. (IHS CERA) and are not to be
redistributed or reused in any manner without prior written consent, with the exception of client internal
distribution as described below.
IHS CERA strives to be supportive of client internal distribution of IHS CERA content but requires that
Some information supplied by IHS CERA may be obtained from sources that IHS CERA believes to
be reliable but are in no way warranted by IHS CERA as to accuracy or completeness. Absent a
specific agreement to the contrary, IHS CERA has no obligation to update any content or information
provided to a client.
© 2011, IHS CERA Inc. No portion of this presentation may be reproduced, reused, or otherwise distributed in any form without prior written consent.
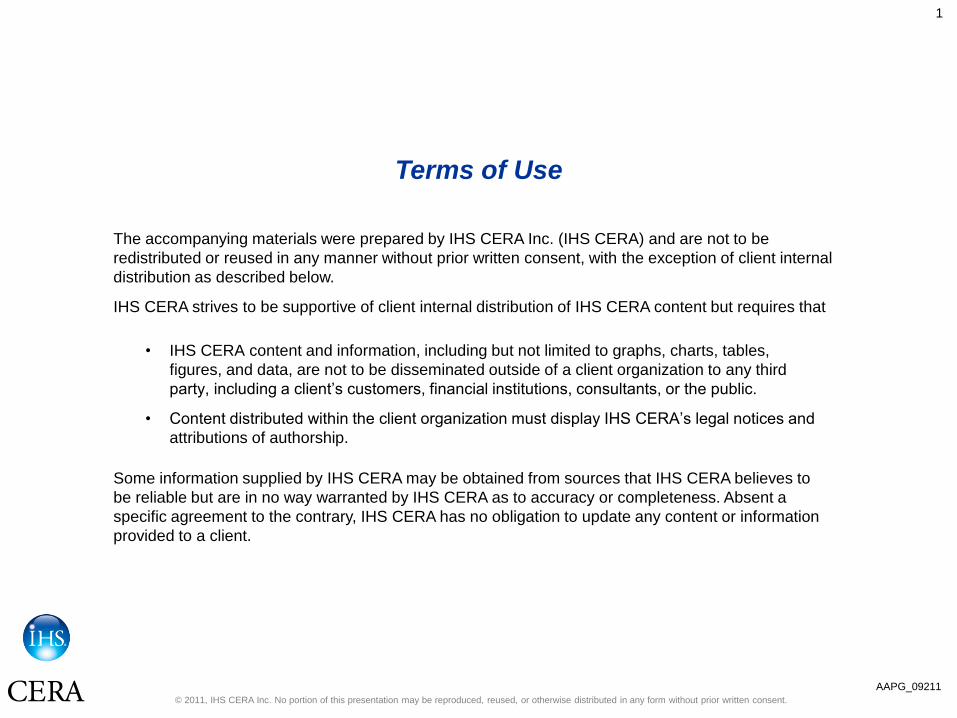
Too Much Gas
2
AAPG_09211
Surge in
Domestic Production
LNG Imports Storage Demand
2000 2006 2012
Source: EIA, IHS CERA.
August 2011
40916-100

© 2011, IHS CERA Inc. No portion of this presentation may be reproduced, reused, or otherwise distributed in any form without prior written consent.
Recent US Lower-48 Average Annual
Dry Gas Productive Capacity Outlooks
3
AAPG_09211
Billion
Cubic Feet
per Day
1990 1992 1994 1996 1998 2000 2002 2004 2006 2008 2010 2012 2014 2016 201850
51
52
53
54
55
56
57
58
59
61
60
62
63
65
64
Sept 2006
July 2007
Oct 2008
July 2009
June 2008
March 2011
March 2010
Source: IHS CERA.
July 2011
40916-3B

© 2011, IHS CERA Inc. No portion of this presentation may be reproduced, reused, or otherwise distributed in any form without prior written consent.
US Gas-related Drilling
4
AAPG_09211
Gas
RigCount
Jan Jan Jan Jan Jan Jan Jan Jan Jan Jan Jan Jan
250
350
450
550
650
750
850
950
1,050
1,150
0
1,250
1,350
Jan
1,450
1,650
JanJan
1,550
Jan Jan Jan
1995 1996 1997 1998 1999 2000 2001 2002 2003 2004 2005 2006 2007 2008 2009 2010 2011 2012
Source: IHS CERA, Baker Hughes Inc.
Note: A weekly peak level of 1,606 rigs was reached in September 2008.
A secondary peak of 1,068 rigs was attained in July 2001.
Updated July 2011
40916-2
© 2011, IHS CERA Inc. No portion of this presentation may be reproduced, reused, or otherwise distributed in any form without prior written consent.
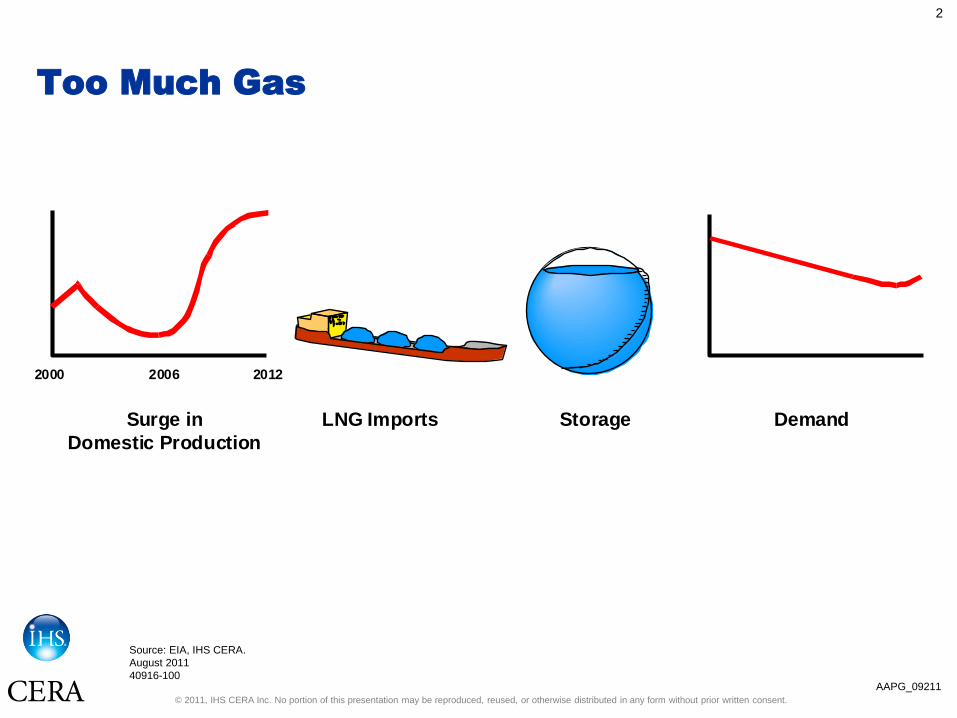
US Lower 48 Rig Count by Direction
2000-2011
5
AAPG_09211
2000 2002 2004 2006 2008 20100
200
400
600
800
1,000
1,200
1,400
Rigs
Non Vertical
Vertical
Source: IHS CERA.
July 2011
40916-102
© 2011, IHS CERA Inc. No portion of this presentation may be reproduced, reused, or otherwise distributed in any form without prior written consent.
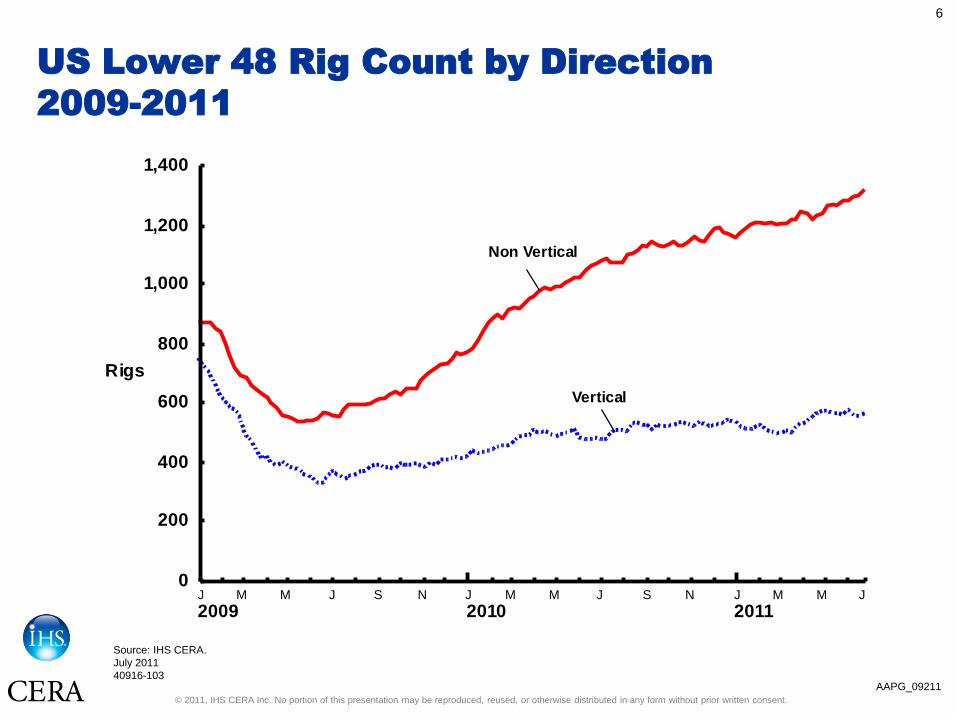
US Lower 48 Rig Count by Direction
2009-2011
6
AAPG_09211
0
200
400
600
800
1,000
1,200
1,400
Rigs
Non Vertical
Vertical
J M M J S N
2009J M M J S N
2010J M M
2011J
Source: IHS CERA.
July 2011
40916-103

© 2011, IHS CERA Inc. No portion of this presentation may be reproduced, reused, or otherwise distributed in any form without prior written consent.
US Lower-48 Rig Count Shifts Toward Oil
7
AAPG_09211
Gas
Oil
0
200
400
600
800
1,000
1,200
1,400
Rigs
1,600
1,800
2007 2008 2009 2010 2011 2012
Source: IHS CERA.
July 2011
40916-104

© 2011, IHS CERA Inc. No portion of this presentation may be reproduced, reused, or otherwise distributed in any form without prior written consent.
8
AAPG_09211
Significant Changes in Rig Counts
Source: IHS CERA.
*Rich gas.
Area Play June 2010 June 2011 Change
Oil Related
Colorado Niobrara 53 70 +17
Kansas 17 29 +12
New Mexico Bone Spring/Avalon 65 80 +15
North Dakota Bakken 115 161 +46
Oklahoma Miss Lime*, Woodford-
Cano*
125 169 +44
TX RR 1 Eagle Ford 41 106 +65
TX RR 2 Eagle Ford 28 66 +38
TX RR 7C Wolfberry 52 70 +18
TX 8 Bone Sprint/Avalon* 150 255 +105
TX 8A Wolfberry 25 37 +12
Gas Related
Arkansas Fayetteville Dry Gas 39 35 -4
North Louisiana Haynesville Dry Gas 139 100 -39
Pennsylvania Marcellus 82 111 +29
TX RR 5 Barnett 86 55 -31
TX RR 6 Haynesville Dry Gas 75 50 -25
TX 10 Granite Wash 62 78 +16
TX 3 Dry Gas 53 42 -11
© 2011, IHS CERA Inc. No portion of this presentation may be reproduced, reused, or otherwise distributed in any form without prior written consent.
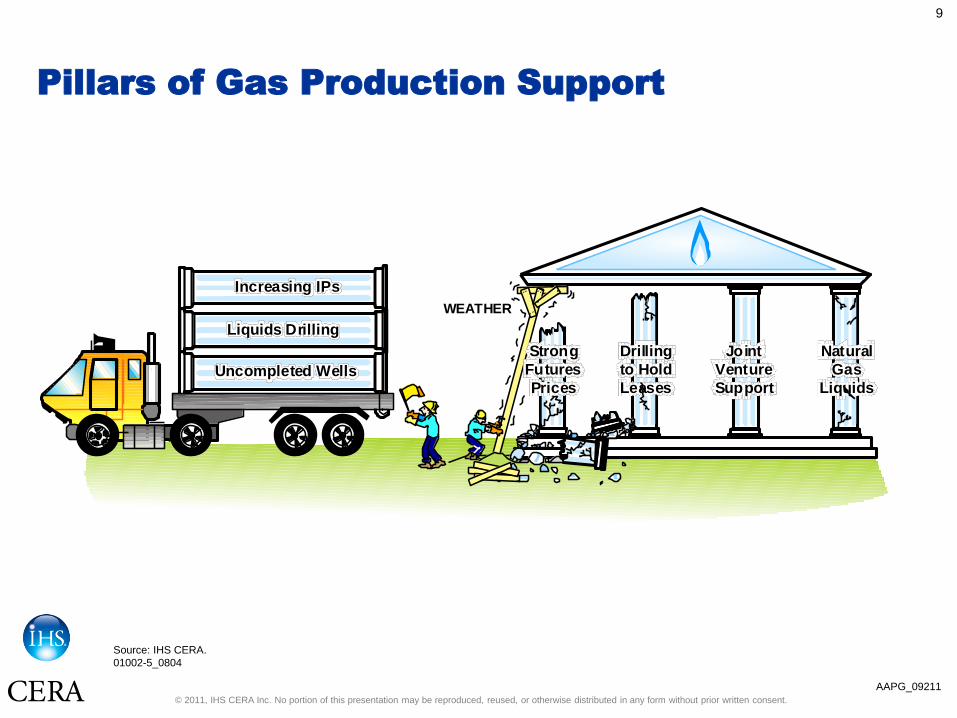
Pillars of Gas Production Support
9
AAPG_09211
Drilling
to Hold
Leases
Joint
Venture
Support
Natural
Gas
Liquids
WEATHER
Strong
Futures
PricesUncompleted Wells
Increasing IPs
Liquids Drilling
Source: IHS CERA.
01002-5_0804
© 2011, IHS CERA Inc. No portion of this presentation may be reproduced, reused, or otherwise distributed in any form without prior written consent.
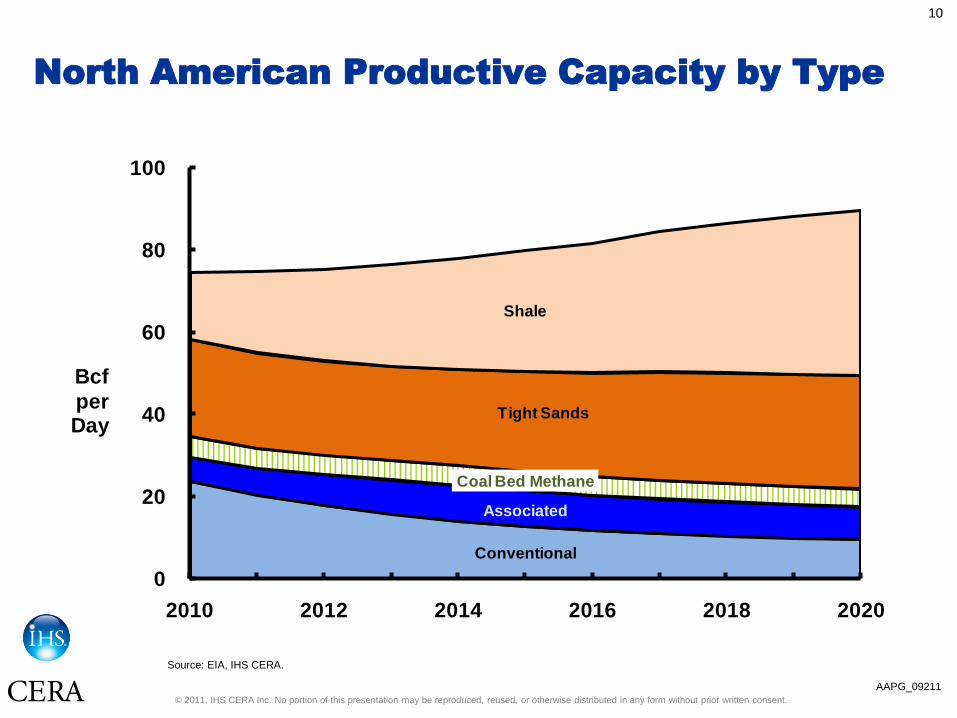
North American Productive Capacity by Type
10
Source: EIA, IHS CERA.
Conventional
Associated
Coal Bed Methane
Tight Sands
Shale
0
20
40
60
80
100
2010 2012 2014 2016 2018 2020
Bcf
perDay
AAPG_09211
© 2011, IHS CERA Inc. No portion of this presentation may be reproduced, reused, or otherwise distributed in any form without prior written consent.
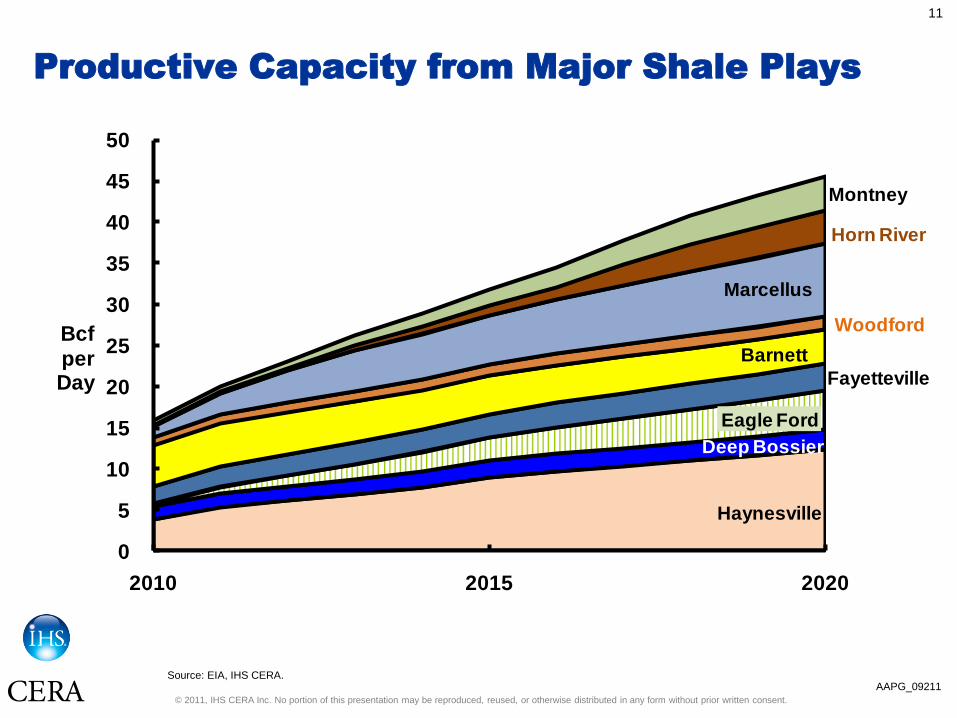
Productive Capacity from Major Shale Plays
11
Source: EIA, IHS CERA.
Haynesville
Deep Bossier
Eagle Ford
Fayetteville
Barnett
Woodford
Marcellus
Horn River
Montney
0
5
10
15
20
25
30
35
40
45
50
2010 2015 2020
Bcf
perDay
Productive Capacity, Major Shale Plays
Source: Energy Information Administration, IHS Cambridge Energy Research Associates.
AAPG_09211

© 2011, IHS CERA Inc. No portion of this presentation may be reproduced, reused, or otherwise distributed in any form without prior written consent.
Major US Lower 48 Unconventional Liquids*
and Gas Hotspots
12
AAPG_09211
Source: IHS CERA.
*Includes oil, high NGL yield gas.
Updated August 2011
40916-45
Greater
Green River BasinPinedale/Jonah Fields
East Texas BasinBossier and Deep/Cotton Valley
Tight Sands
Anadarko BasinDeep Gas
Tuscaloosa Oil/Wet Gas
Barnett Gas/Oil "Combo" Play
Piceance Basin
Uinta Basin(Natural Buttes Field)Wet Gas, Monument
Butte Oil
San JuanBasin
Fayetteville, Woodford,and Caney Shales
Delaware BasinBone Spring/
Avalon Oil
CollingwoodAntrim Gas Shale
Denver Julesburg BasinWattenburg Niobrara
Oil and Gas
Utica Shale
Marcellus
Shale
HaynesvilleGas Shale
Eagle FordOil and
GasShale
Midand BasinWolfberry Oil
Bakken/Three Forks Oil
Powder River BasinCoal Bed Methane (CBM)
MississippianLime Oil/Gas
Granite WashCleveland/TonkawaGas/Oil Tight Sands
Monterey Oil
© 2011, IHS CERA Inc. No portion of this presentation may be reproduced, reused, or otherwise distributed in any form without prior written consent.
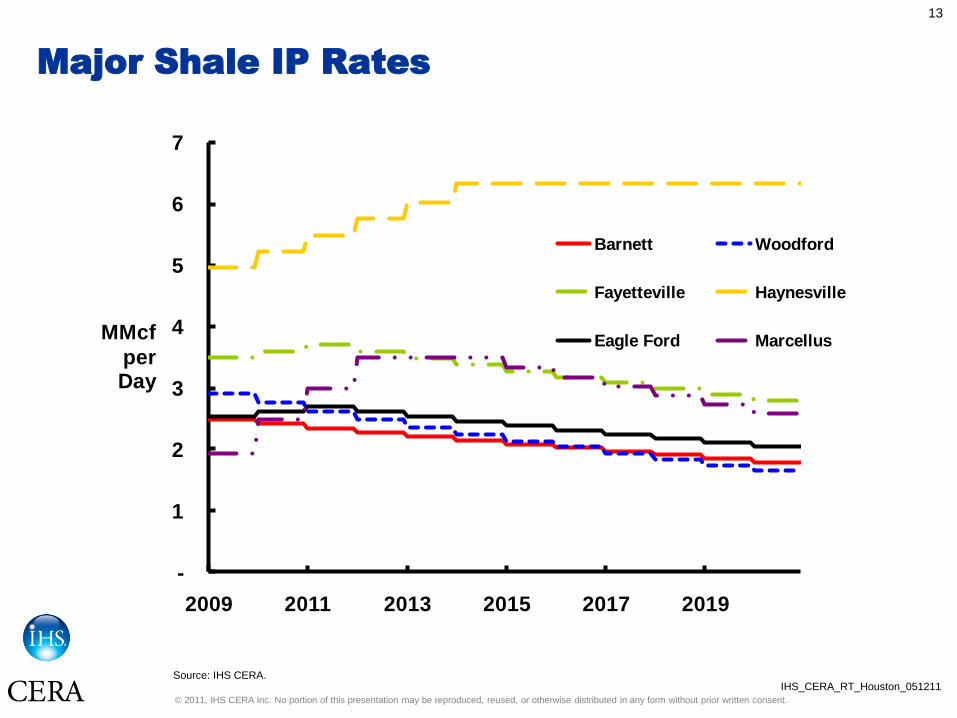
Major Shale IP Rates
13
Source: IHS CERA.
-
1
2
3
4
5
6
7
2009 2011 2013 2015 2017 2019
MMcf
perDay
Barnett Woodford
Fayetteville Haynesville
Eagle Ford Marcellus
IHS_CERA_RT_Houston_051211
© 2011, IHS CERA Inc. No portion of this presentation may be reproduced, reused, or otherwise distributed in any form without prior written consent.
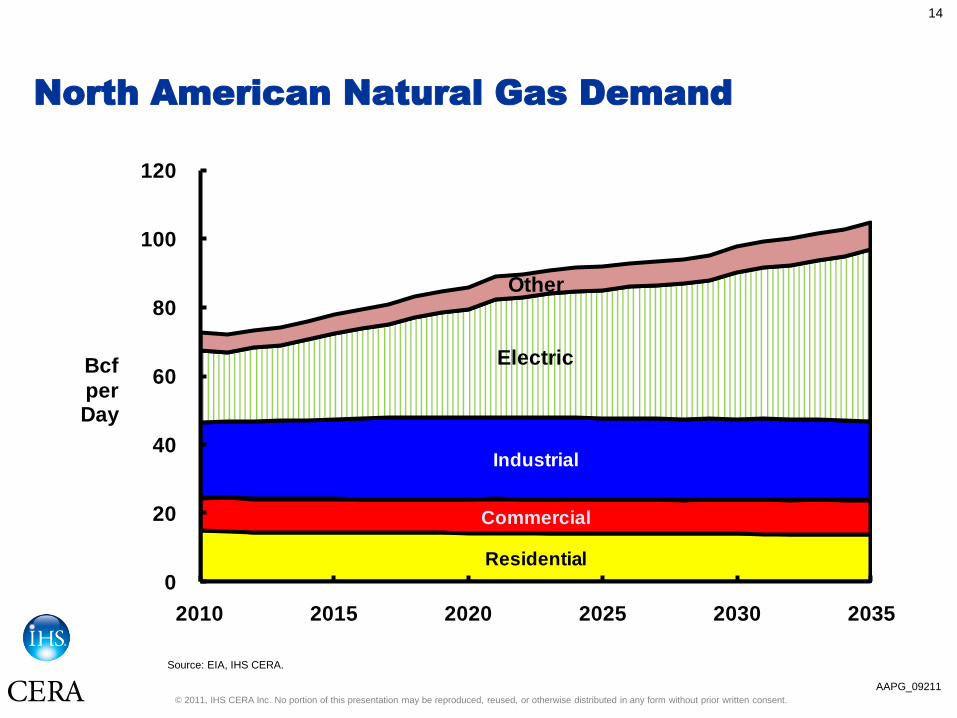
North American Natural Gas Demand
14
Source: EIA, IHS CERA.
Residential
Commercial
Industrial
Electric
Other
0
20
40
60
80
100
120
2010 2015 2020 2025 2030 2035
Bcf
perDay
North American Natural Gas Demand
Source: Energy Information Administration, IHS Cambridge Energy Research Associates. AAPG_09211

© 2011, IHS CERA Inc. No portion of this presentation may be reproduced, reused, or otherwise distributed in any form without prior written consent.
Factors in US Gas Price Expectations
15
AAPG_09211
Source: IHS CERA.
July 2011
40916-101
GASPRICE
Uncertainty
about FutureTaxation
Unconventional gasproduction profile
US Production Increases
Rig counts
Seasonal productionshut ins
Coal price
Demand
Weather
Speed and extent ofeconomic recovery
Reduced ForwardStrip Expectations
Commodity Investment
BandwagonInflation Expectations
Value of dollar
Oil Price
Demand (global)
Equity market
LNG Imports
Storage InjectionsTiming of Total Fill
Nuclear fears
Demand (global)
OPEC and North African availability concerns
© 2011, IHS CERA Inc. No portion of this presentation may be reproduced, reused, or otherwise distributed in any form without prior written consent.
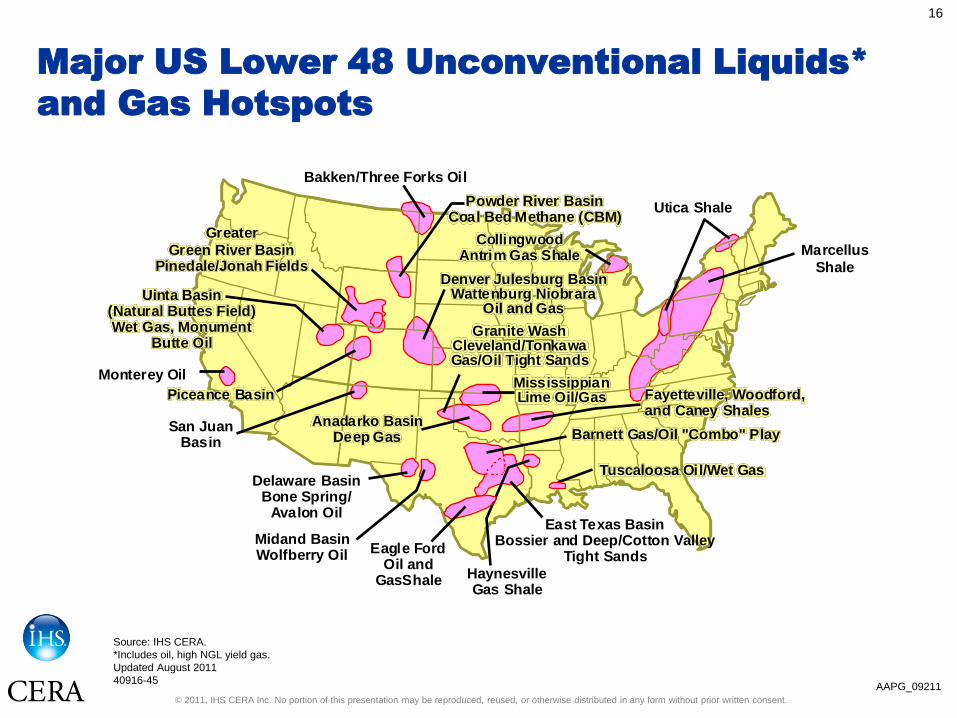
Major US Lower 48 Unconventional Liquids*
and Gas Hotspots
16
AAPG_09211
Source: IHS CERA.
*Includes oil, high NGL yield gas.
Updated August 2011
40916-45
Greater
Green River BasinPinedale/Jonah Fields
East Texas BasinBossier and Deep/Cotton Valley
Tight Sands
Anadarko BasinDeep Gas
Tuscaloosa Oil/Wet Gas
Barnett Gas/Oil "Combo" Play
Piceance Basin
Uinta Basin(Natural Buttes Field)Wet Gas, Monument
Butte Oil
San JuanBasin
Fayetteville, Woodford,and Caney Shales
Delaware BasinBone Spring/
Avalon Oil
CollingwoodAntrim Gas Shale
Denver Julesburg BasinWattenburg Niobrara
Oil and Gas
Utica Shale
Marcellus
Shale
HaynesvilleGas Shale
Eagle FordOil and
GasShale
Midand BasinWolfberry Oil
Bakken/Three Forks Oil
Powder River BasinCoal Bed Methane (CBM)
MississippianLime Oil/Gas
Granite WashCleveland/TonkawaGas/Oil Tight Sands
Monterey Oil

© 2011, IHS CERA Inc. No portion of this presentation may be reproduced, reused, or otherwise distributed in any form without prior written consent.
US Lower-48 Rig Count Shifts Toward Oil
17
AAPG_09211
Gas
Oil
0
200
400
600
800
1,000
1,200
1,400
Rigs
1,600
1,800
2007 2008 2009 2010 2011 2012
Source: IHS CERA.
July 2011
40916-104
For more information about this presentation or
IHS CERA in general, please contact
Robert W. Esser +1 631 427 7086
55 Cambridge Parkway Cambridge, Massachusetts 02142, USA
IHSCERA.com
Beijing San Francisco
Washington, DC
Cambridge, MA
Calgary
Mexico City
Rio de Janeiro
Paris
Moscow
Dubai
Singapore
Houston
Denver
London
Top Related