


Languages
Pages
Legal


Contrasting inherent optical properties and carbon metabolism
in four northeastern (USA) estuary-plume systems
D. Vandemark, NASA/GSFC & UNH J. Salisbury, C. Hunt, J. Campbell, Univ. of New Hampshire
W. McGillis, Columbia University - LDEO
Program Goals
• Examine freshwater control upon Gulf of Maine coastal waters in terms of carbonate, nutrient, and productivity dynamics
• Develop techniques to retrieve metabolic information from inherent optical properties and eventually from satellite measurements
This talk : first observations
1. Contrast amongst four river systems
2. Empirically relate bio-optical & metabolic terms using clustering analysis

Observational program
• UNH/COOA : NOAA-sponsored (COTS)
• Flo-thru suite: physical + fluor. + IOP + metabolic (pCO2,O2) variables
• Discrete sampling and phys. + IOP profiling along salinity gradient
• Four rivers sampled seasonally in Gulf of Maine
• Hudson river also sampled 7/1-7/2, 2004 (see McGillis)
2004 COOA Gulf of Maine measurement program

COOA shipboard measurements
Fast-rate CO2 equilibrator
Profiler: AC-9, AC-S, fl_CDOM,CHL,PEB, and CTD
Infrared CO2 gas analyzer
Camden Belle -26’ riverine sampling vessel
R/V Gulf Challenger – majority of 2004 data set
Flo-thru O2, fl_Chl, fl_CDOM, beam_c, T, S

Four rivers in four days
Androscoggin- Kennebec
Penobscot
Pleasant
Merrimack
N
EW
S
50075010001250
DOC flux (kg km-2)
Aitkenhead and McDowell (2001)
- summer climatology
• varied watersheds, 3 of GoMaine’s largest sources
• Sampled plumes -> 0 psu, 27-30 July 2004Boston
Acadia

Androscoggin- Kennebec
Penobscot
Pleasant
Merrimack
N
EW
S
255075100
DIN flux (kg km-2)
Green et al., (2004)
Four rivers in four days

Contrasts between riversJuly 2004
CDOM surrogate for DOC
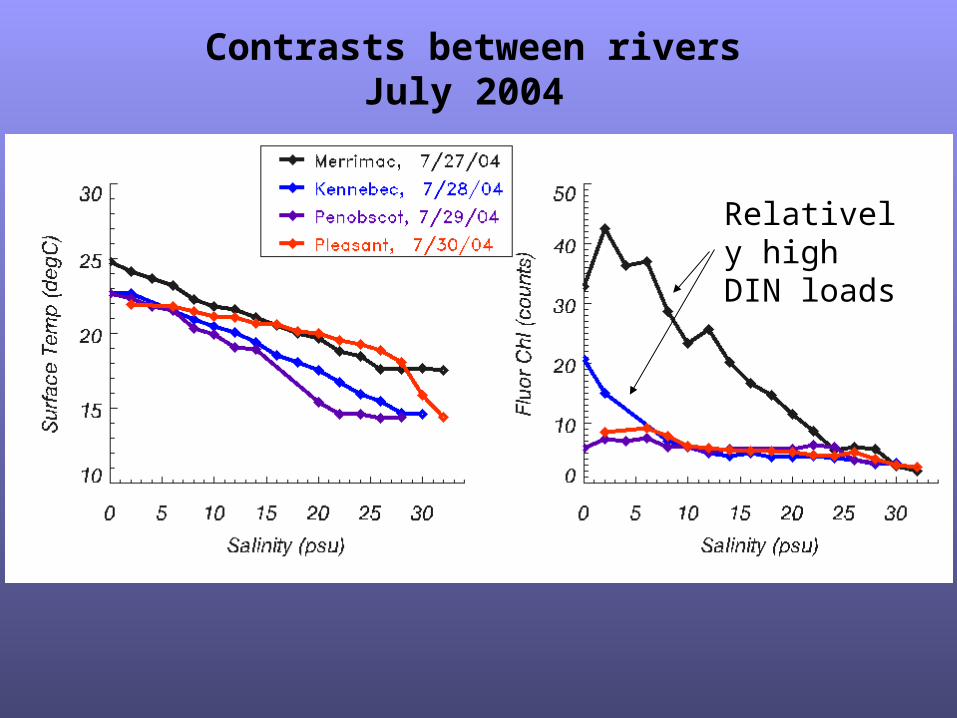
Contrasts between riversJuly 2004
Relatively high DIN loads

Contrasts between riversJuly 2004
Atm
120
110
100
90
80
70
BOUNDS Merrimac – autotrophic
Pleasant – strongly heterotrophic

Study in progress
• Diverse watersheds conditions in optical, trophic, and gas flux terms
• Some consistency with modeled basin attributes• Coming work - conservative mixing vs. localized
processing along salinity gradient and vs. season• …including profile & discrete data: nutrients, TA,
pH, DIC, DOC, DON, POC, HPLC

Merrimac River
Covariance between surface variables

Classification via clustering analysis - end goal is to link satellite retrievals to ecosystem metabolism
4 Observables[ T, fl_CDOM, fl_CHL, c660 ]i = 1,n
Objective clustering n=30000 (S < 31 psu)
Present result: 22 classes
Metabolic indicator?
O2
pCO2
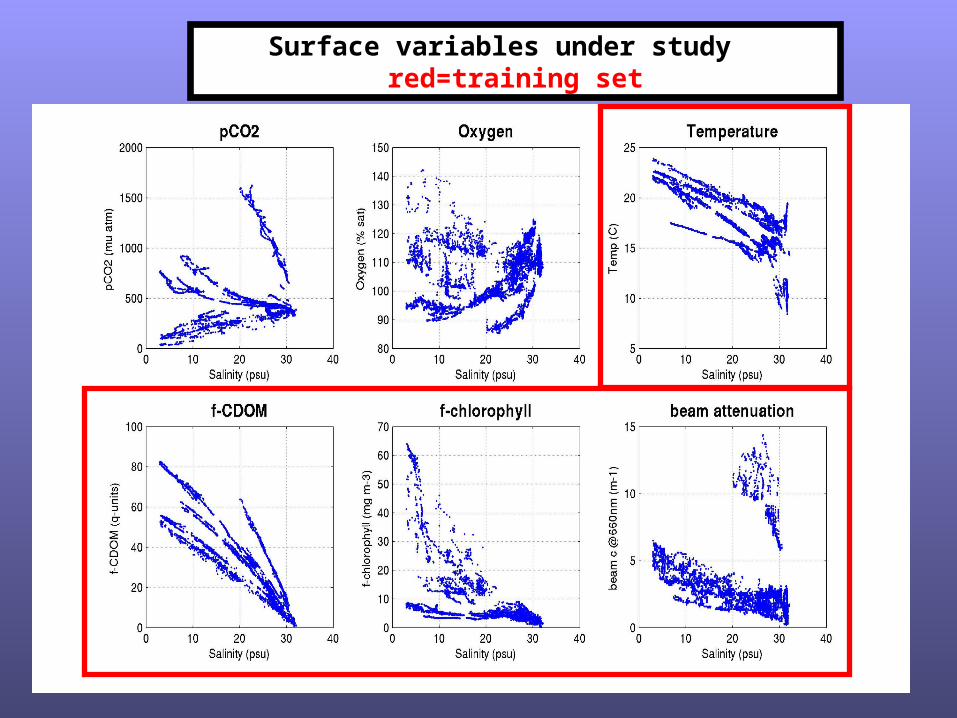
Surface variables under study red=training set
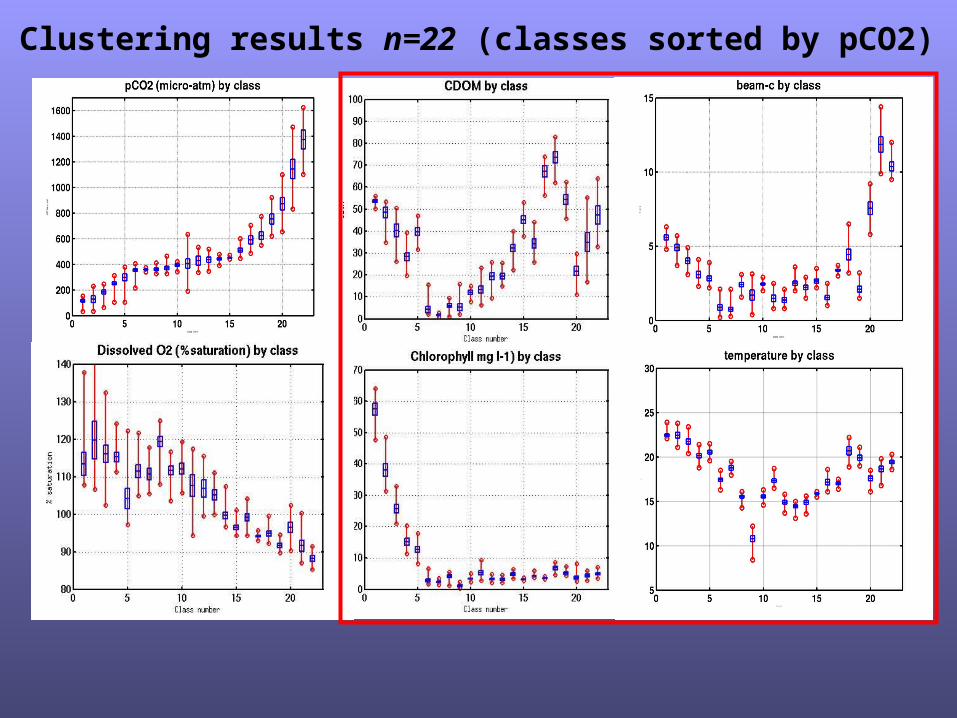
Clustering results n=22 (classes sorted by pCO2)
Top Related