


Languages
Pages
Legal

1

Contents
Dhanlaxmi Bank -Profile
Vision & Mission
Profile of Board of Directors & Key Management Personnel
Overview of Distribution Network
Share Holding Pattern
Overview of Organization Structure
Comprehensive range of Products
Business Results-Performance Overview
Income & Margins
Balance Sheet comparison
Way Forward
2

Incorporated in 1927 at Thrissur, Kerala
by a group of ambitious andenterprising entrepreneurs.
Over the 91 years that followed,
earned the trust and goodwill of
clients.
Our strength is the number of
customers, scale of business, breadth
of our product offerings, banking
experience we offer and the trust thatpeople invest in us.
626 touch points including 250
branches, 346 ATMs and 17 BCs across
14 States and 1 Union Territory; our
focus has always been on customizing
services and personalizing relations.
Dhanlaxmi Bank- Profile
3
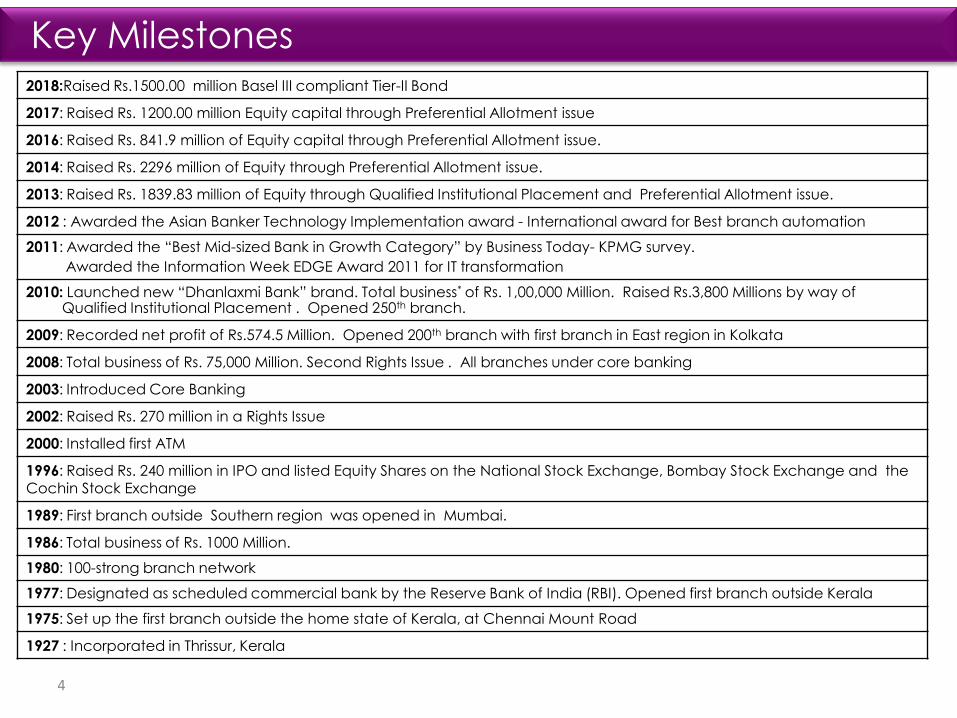
2018:Raised Rs.1500.00 million Basel III compliant Tier-II Bond
2017: Raised Rs. 1200.00 million Equity capital through Preferential Allotment issue
2016: Raised Rs. 841.9 million of Equity capital through Preferential Allotment issue.
2014: Raised Rs. 2296 million of Equity through Preferential Allotment issue.
2013: Raised Rs. 1839.83 million of Equity through Qualified Institutional Placement and Preferential Allotment issue.
2012 : Awarded the Asian Banker Technology Implementation award - International award for Best branch automation
2011: Awarded the “Best Mid-sized Bank in Growth Category” by Business Today- KPMG survey.
Awarded the Information Week EDGE Award 2011 for IT transformation
2010: Launched new “Dhanlaxmi Bank” brand. Total business* of Rs. 1,00,000 Million. Raised Rs.3,800 Millions by way of Qualified Institutional Placement . Opened 250th branch.
2009: Recorded net profit of Rs.574.5 Million. Opened 200th branch with first branch in East region in Kolkata
2008: Total business of Rs. 75,000 Million. Second Rights Issue . All branches under core banking
2003: Introduced Core Banking
2002: Raised Rs. 270 million in a Rights Issue
2000: Installed first ATM
1996: Raised Rs. 240 million in IPO and listed Equity Shares on the National Stock Exchange, Bombay Stock Exchange and the
Cochin Stock Exchange
1989: First branch outside Southern region was opened in Mumbai.
1986: Total business of Rs. 1000 Million.
1980: 100-strong branch network
1977: Designated as scheduled commercial bank by the Reserve Bank of India (RBI). Opened first branch outside Kerala
1975: Set up the first branch outside the home state of Kerala, at Chennai Mount Road
1927 : Incorporated in Thrissur, Kerala
Key Milestones
4
5
Vision & Mission
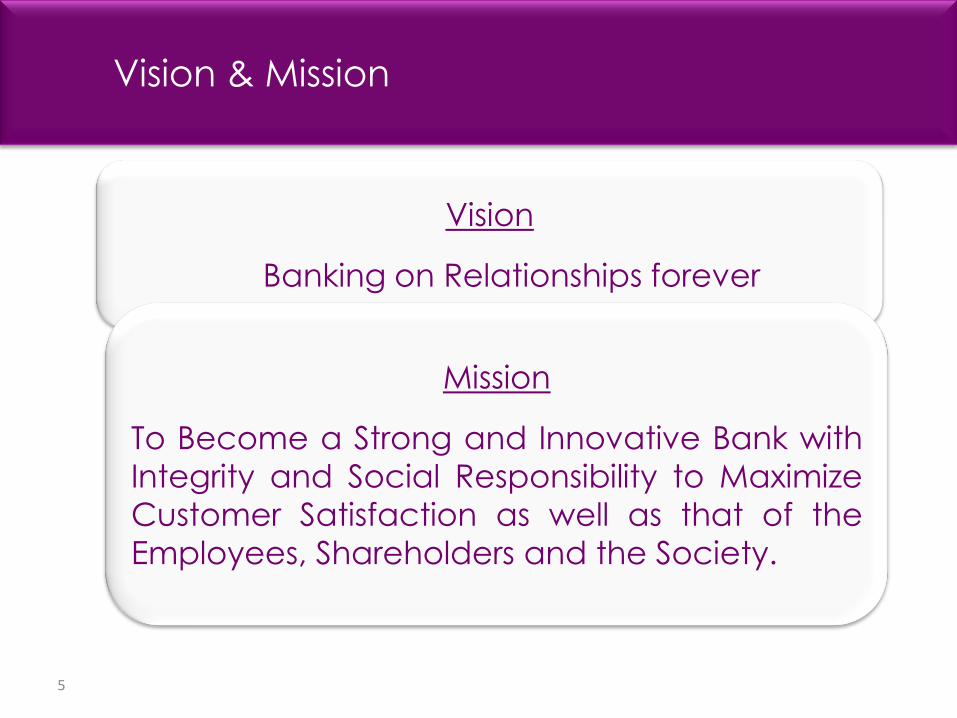
Vision
Banking on Relationships forever
Mission
To Become a Strong and Innovative Bank with
Integrity and Social Responsibility to Maximize
Customer Satisfaction as well as that of the
Employees, Shareholders and the Society.

Name Experience & Other Directorships
Sajeev Krishnan Chairman
(Part –time)
Mr. Sajeev Krishnan appointed as Part-time Chairman and took charge on
23.05.2018 He has been with the State Bank group since 1977. He has handled
large credits and projects and internal audit at State Bank of India (SBI) at the
Republic of Maldives from 1998 to 1999. He was Vice President (NRI) at SBI
Toronto, Canada from 2000 to 2003 and also stand-by dealer in forex
transactions. He also headed the rupee treasury department of the bank
which included trading, bidding for new issues, maintenance of SLR and CRR
and also taking care of the liquidity needs of the bank.
T. Latha
MD & CEO
Ms T Latha assumed charge as Managing Director & Chief Executive Officer
of the Bank on July 02, 2018. She has 35 years of banking experience with
Punjab National Bank across a host of roles and responsibilities including
Branch Management, Regional Management and National Level Credit
Manaaement handling a portfolio of approximately INR 40,000 crore. She is a
MBA holder in finance and post graduate in MA literature. She has also
passed the Limited Insolvency Exam and CAIIB.
Chella K Srinivasan Independent Director
Mr. Chella K Srinivasan is a Practicing Chartered Accountant for more than 34
years. He has professional expertise in accounting, auditing and corporate
taxation and has varied experience in audits of manufacturing companies,
hotels, Insurance companies, NBFCs and Banks (Statutory Audits of Bank of
India and RBI). On behalf of his firm, he has carried out inspection of NBFC
registration as directed by the RBI and also NSE members on behalf of SEBI.
Mr.Srinivasan is the past National President of the Indo-American Chamber of
Commerce (IACC) and was also a member of the Vision Committee of the
Institute of Chartered Accountants of India.
Profile of Board of Directors
6

Profile of Board of Directors
7
Name Experience & Other Directorships
Dr. Lakshmy Devi K.R
Independent Director
Dr. Lakshmy Devi K.R. was Head of Department of Economics of
University of Calicut. She completed her Ph.D in Economics from
Calicut University in 1986. Her post doctoral experience includes
Ford Foundation Post Doctoral Fellowship at University of
Maryland, Washington DC, U.S.A and Senior Fellowship of the
Social Sciences Research Council, New York, U.S.A.
P. S Sreekumar
Independent Director
Mr. P. S Sreekumar was Supervisory Officer in the Co-operation
department with Government of Kerala. He is a government
nominee on the Board of Mannam Sugar Mills Co-operative
Limited. He has worked as Special Secretary in the Public Works
Department, Government of Kerala and Secretary of Institute of
Management in Government. He holds bachelor's degrees in
Commerce and law, master's degree in Public Administration and
Post-graduate Diploma in Journalism.
C.K.Gopinathan
Director
Mr.C.K.Gopinathan is promoter Director of C.K.G.Supermarket. He
was also Director in the Catholic Syrian Bank Limited for 8 years.
Mr.C.K.Gopinathan is a major share holder of our Bank. He has
more than 25 years of experience in banking and finance sectors

8
Profile of Board of Directors
Name Experience & Other Directorships
K.N Murali
Independent Director
Mr. K.N Murali had worked in State Bank of Travancore, State Bank
of Saurashtra and State Bank of Hyderabad in various positions
across the country. He had handled credit, inspection and audit. As
General Manager (Commercial Network) of State Bank of
Travancore, Mr. K.N Murali was responsible for all large advances of
the Bank. He was also a regular invitee to the Board and Board
Committees to present the credit proposals. He has also undergone
training program at Kellogg’s Institute of Management, Chicago.
Dr. B Ravindran PillaiDirector
Dr.RavindranPillai is an Industrialist. He is the promoter/Managing
Director/Director of several companies in India and Middle East. He
holds a degree in Business Administration from Cochin university of
Science and Technology .Government of India honored him Pravasi
Bharathya Samman and with fourth highest Indian civilian award of
“Padma Shri” in 2010.
S T Kannan
RBI Additional Director
Mr .S. T. Kannan has been appointed as Additional Director on the
Board by Reserve Bank of India. He is a serving General Manager in
the Reserve Bank of India, and in charge of Reserve Bank India,
Regional Office, Goa.

Name Experience
Mr. P. Manikandan
Chief General Manager
Experience of 39 years in banking sector
Experience of 11 years in Planning, Operations, Credit, HRD, Inspection,
Vigilance, Third Party Products, Premises and Cash Management System areas
of the Bank.
He holds M Com, LLB and PGDCA. He is also a Certified Associate of the Indian
Institute of Bankers.
Mr. Ramesh AJ
Chief Financial Officer
Experience of 32 years in banking sector.
Worked in SBI/SBT in various areas like Finance & Accounts ,Large Value Credit
intensive branches etc.
He holds a degree in chemistry and is also a Certified Associate of the Indian
Institute of Bankers (CAIIB).
He is also a qualified Chartered Accountant.
Mr. Venkatesh .H
Company Secretary
He is an Associate Member (ACS) of the Institute of Company Secretaries of
India and joined in the Bank on 04.11.2013 as Assistant Company Secretary.
He holds CA, M Com, JAIIB
He is also an associate member of Institute of Chartered Accountants of India,
Associate member of Institute of Cost Accountants of India and a post
graduate in Commerce.
Profile of Key Management Personnel
9

Name Experience
Mr. Muraleedharan M
Head Inspection
38 years of Banking Experience.
Has worked in various capacities in Branches and also as Branch Head.
In charge of various Regional Offices of the Bank in various locations ,in
the capacity of Regional Head and Zonal Head.
Well experienced in Credit and Recovery functions of the Bank.
Commerce graduate and Certified Associate of Indian Institute of
Bankers.
Mr. L. Chandran
Chief Recovery Officer
Experience of 26 years in banking/financial sector. Worked in Branch,
Zonal Office, Credit Department (SME & Corporate underwriting). He
also headed Integrated Risk Management Department of the Bank.
Had a key role in formulation of Credit Policy, Credit Appraisal Formats
and Credit Rating Models of the Bank.
Worked in Government sector, Public Sector Financial Institution for
about 7 years and Bank for 19 years in different capacities in various
geographical areas.
A post graduate in Science, he holds an MBA (Finance)and B.Ed.
Degree. He is also a Certified Associate of the Indian Institute of Bankers.
Mr. John Varughese
(Chief Compliance Officer &
Head IT , Digital Banking)
26 years experience in IT & Banking of which 21 years Banking Domain.
Worked as Head – Alternate Channels, AGM-IT and Regional Head,
Engineering graduate with CISA qualification, Certified Associate of the
Indian Institute of Bankers, ISMS Lead Auditor and BS 7799 Implementer
Mr. Ramakrishnan CS
Chief Risk Officer
25 years of Experience in Banking Sector.
He has worked in branches and also as Branch Head, Regional
Manager, Head – Inspection, Head - HR and leadership positions in
other process departments.
A graduate in mathematics and also is a Certified Associate of the
Indian Institute of Bankers 10
Profile of Senior Management
11
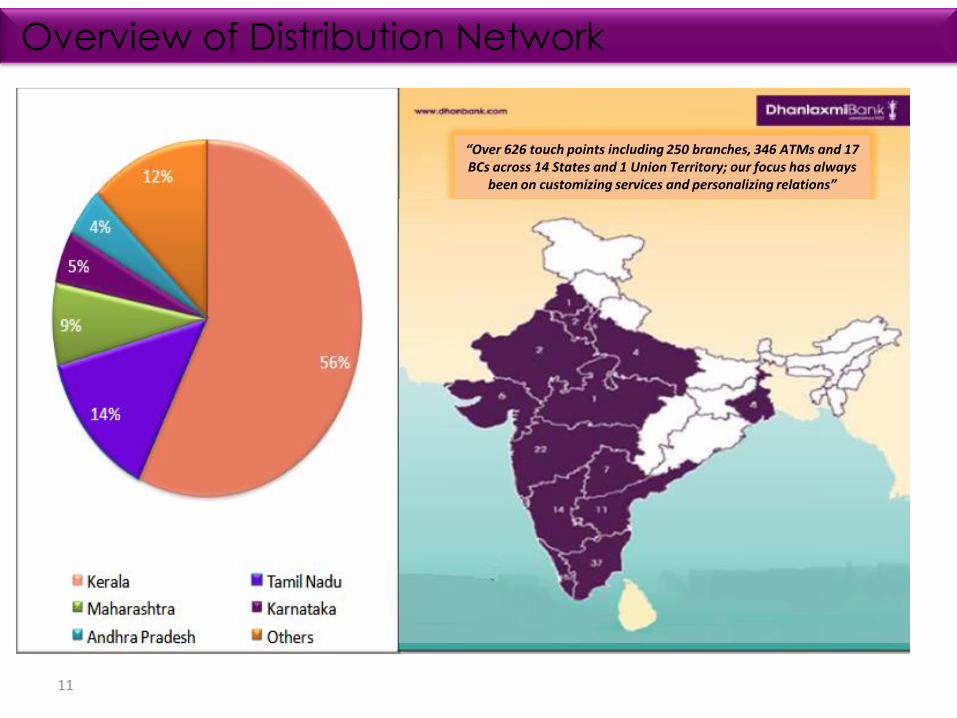
Overview of Distribution Network
“Over 626 touch points including 250 branches, 346 ATMs and 17 BCs across 14 States and 1 Union Territory; our focus has always
been on customizing services and personalizing relations”
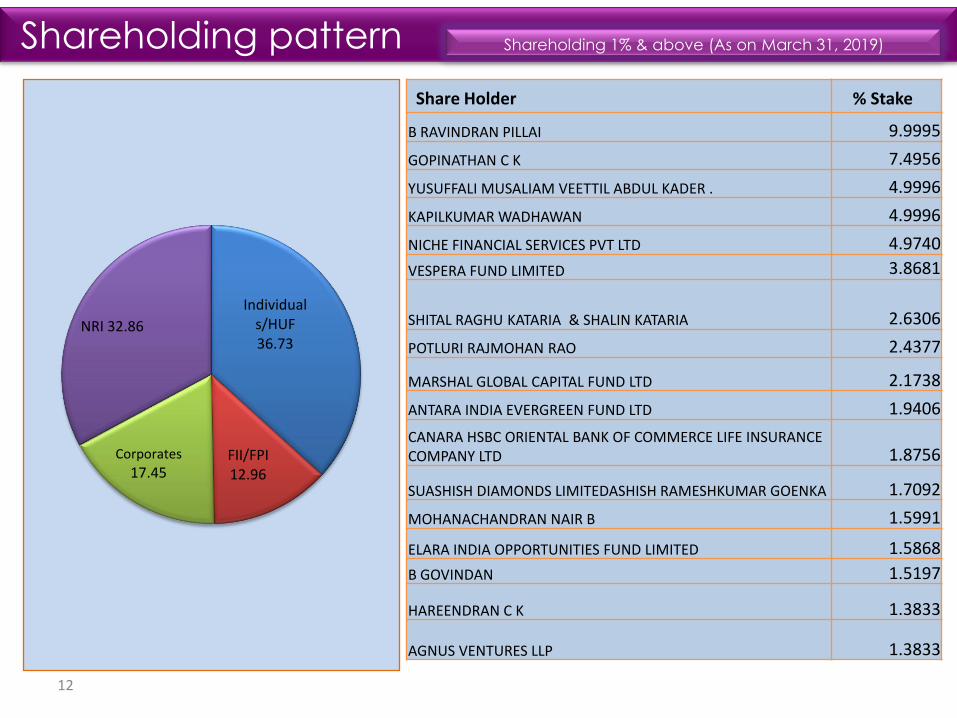
Shareholding pattern Shareholding 1% & above (As on March 31, 2019)
12
Share Holder % Stake
B RAVINDRAN PILLAI 9.9995
GOPINATHAN C K 7.4956
YUSUFFALI MUSALIAM VEETTIL ABDUL KADER . 4.9996
KAPILKUMAR WADHAWAN 4.9996
NICHE FINANCIAL SERVICES PVT LTD 4.9740
VESPERA FUND LIMITED 3.8681
SHITAL RAGHU KATARIA & SHALIN KATARIA 2.6306
POTLURI RAJMOHAN RAO 2.4377
MARSHAL GLOBAL CAPITAL FUND LTD 2.1738
ANTARA INDIA EVERGREEN FUND LTD 1.9406
CANARA HSBC ORIENTAL BANK OF COMMERCE LIFE INSURANCE COMPANY LTD 1.8756
SUASHISH DIAMONDS LIMITEDASHISH RAMESHKUMAR GOENKA 1.7092
MOHANACHANDRAN NAIR B 1.5991
ELARA INDIA OPPORTUNITIES FUND LIMITED 1.5868
B GOVINDAN 1.5197
HAREENDRAN C K 1.3833
AGNUS VENTURES LLP 1.3833
Individuals/HUF 36.73
FII/FPI 12.96
Corporates
17.45
NRI 32.86

Deposits Corporate Products Retail Products Other ServicesTechnology Related
products
Current Account Cash Credit *Agriculture / Kissan VahanaLoan/ Kissan Card
Insurance BusinessRetail & Corporate
Internet Banking
Savings Account OverdraftHome Loan / Loan against
property
Mutual Fund
Distribution
Missed Call Services
Term Deposit Term LoansGold Loan/ Loan against Sovereign Gold Bonds
Depository Services Mobile Banking
Corporate Salary Corporate Loans Vehicle Loan Locker Services IMPS
NRE Account Project Finance Live Stock Loan Forex Services e-IT Return Filing
NRO AccountBill Advance and Packing Credit Advance
Personal Loans/ Educational Loan
Bankers to Issue /ASBA
Remittances – Real Time
Gross Settlement (RTGS)
/ National Electronics
Funds Transfer
(NEFT)/MTS
Foreign Currency Non
Repatriable Fixed
Deposit
Foreign Currency Loans
Loan against LIC policy/ Deposit/ Overdraft against Shares
Cash Management
Services/ Aadhaar
Based Payments
Online trading
3 in 1 account (Saving
Account, Demat
Account & Trading
Account)
Invoice / Dealer Financing
Micro Credit Loan/ Self Help Group Loans
Import Export relatedPoint of Sale
Business
Correspondents
Lease Rental
DiscountingMedical Equipment Loan Sovereign Gold Bonds Pay Smart
Office Equipment Loan
International Debit cards / Credit Cards / Gift Cards/Forex Cards
PAN Card ServicesBill Payment
* New Product under Cash Credit- DHANAM GST BUSINESS LOAN is also available
13
Comprehensive range of Products

* As on 31.03.2019
Bank at a Glance
14
No : Branches 250
No : ATMs 346
Deposit (Rs. in Crore)
10603
Advances(Gross) (Rs. in Crore)
6636
Total Business (Rs. in Crore)
17239
Total Assets (Rs. in Crore)
11799

Performance Overview
15
Bank has reported net profit of Rs. 11.67 crore for the year ended 31.03.2019 compared to
net Loss of Rs. 24.87 crore during the same period of last financial year.
Total expenses has been reduced by 4.16 % on Y-o-Y basis (Rs.969.60 Cr to Rs.929.30 Cr)
Employee cost also reduced by 1.31% on Y-o-Y basis (Rs.163.58 Cr to Rs.161.43 Cr
Cost of funds has been reduced from 5.98% to 5.73% on Y-o-Y basis
Income on investments improved by 5.31 % on Y-o-Y basis.
Yield on investments has been improved from 6.50% to 6.77 % on Y-o-Y basis.
Net Interest Margin has been improved from 2.90% to 3.00 % on Y-o-Y basis
Net NPA improved to 2.41% from 3.19% on Y-o-Y basis (Rs.194.65 Cr to Rs.151.71 Cr)
Business per employee improved from Rs. 9.19 Crs to Rs. 9.72 Crs on Y-o-Y basis
Provision Coverage Ratio improved from 80.02% to 84.72% on Y-o-Y basis
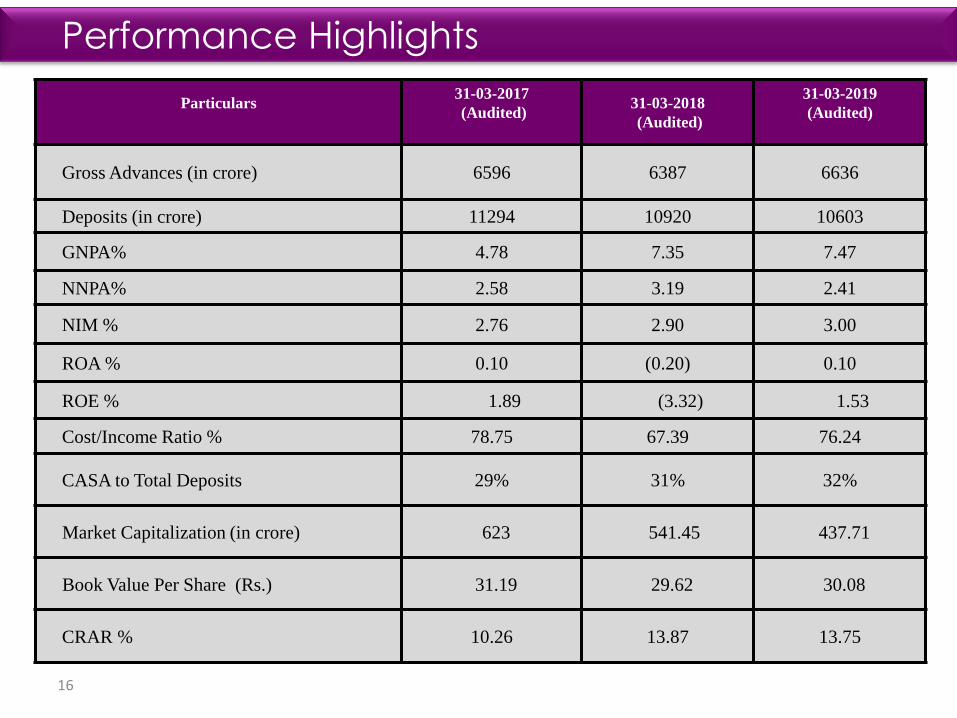
Particulars 31-03-2017
(Audited) 31-03-2018
(Audited)
31-03-2019
(Audited)
Gross Advances (in crore) 6596 6387 6636
Deposits (in crore) 11294 10920 10603
GNPA% 4.78 7.35 7.47
NNPA% 2.58 3.19 2.41
NIM % 2.76 2.90 3.00
ROA % 0.10 (0.20) 0.10
ROE % 1.89 (3.32) 1.53
Cost/Income Ratio % 78.75 67.39 76.24
CASA to Total Deposits 29% 31% 32%
Market Capitalization (in crore) 623 541.45 437.71
Book Value Per Share (Rs.) 31.19 29.62 30.08
CRAR % 10.26 13.87 13.75
Performance Highlights
16

Performance Highlights (Rs. in Cr)
17
Trend in movement of CASA %DEPOSITS
3363 3403 3407 3316 3394
7557 7511 7410 7409 7209
2018(Q4) 2019(Q1) 2019(Q2) 2019(Q3) 2019(Q4)
CASA TD
10920 10914 10725 1060310817
31
31
31
31
32
CASA %
2018(Q4)
2019(Q1)
2019(Q2)
2019(Q3)
2019(Q4)
45
45
4646
52
RETAIL %2018(Q4)2019(Q1)2019(Q2)2019(Q3)2019(Q4)
18
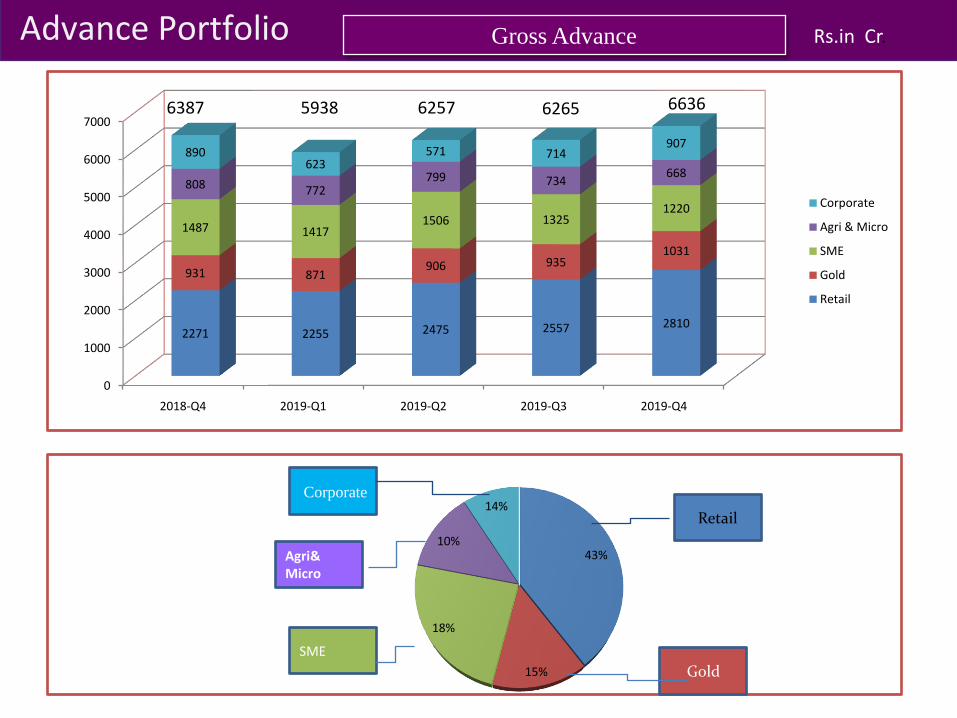
Advance Portfolio Rs.in Cr.Gross Advance
43%
15%
18%
10%
14%
SME
Retail
Corporate
Gold
Agri& Micro
0
1000
2000
3000
4000
5000
6000
7000
2018-Q4 2019-Q1 2019-Q2 2019-Q3 2019-Q4
2271 2255 2475 2557 2810
931 871906 935
1031
1487 14171506 1325
1220
808 772799 734
668
890623
571 714907
Corporate
Agri & Micro
SME
Gold
Retail
66366265625759386387
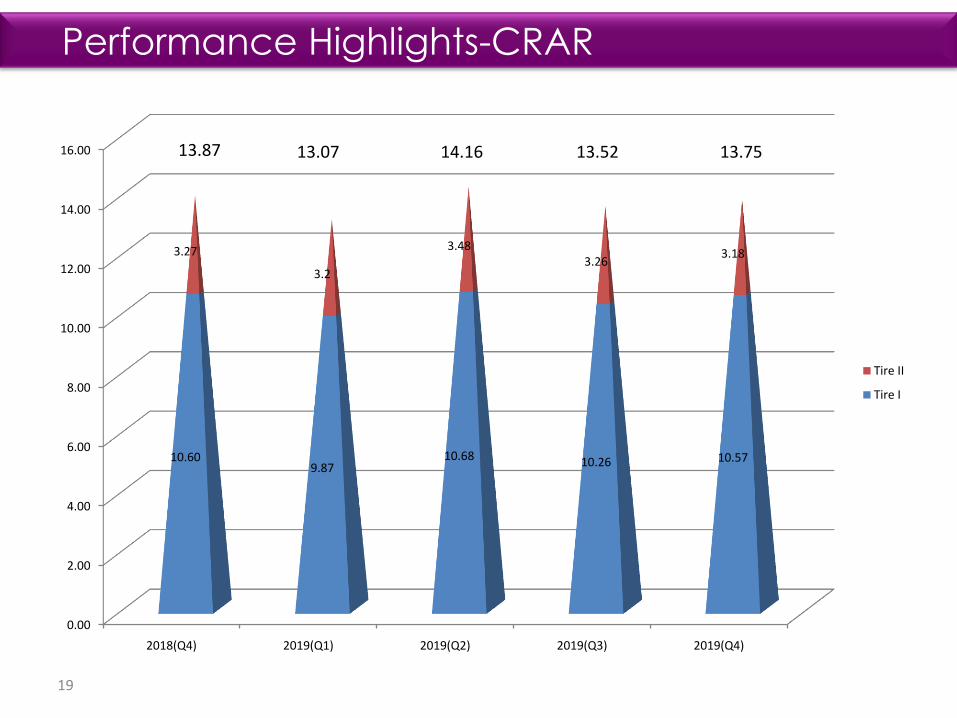
Performance Highlights-CRAR
19
0.00
2.00
4.00
6.00
8.00
10.00
12.00
14.00
16.00
2018(Q4) 2019(Q1) 2019(Q2) 2019(Q3) 2019(Q4)
10.609.87
10.68 10.26 10.57
3.27
3.2
3.483.26
3.18
Tire II
Tire I
13.7513.5214.1613.0713.87
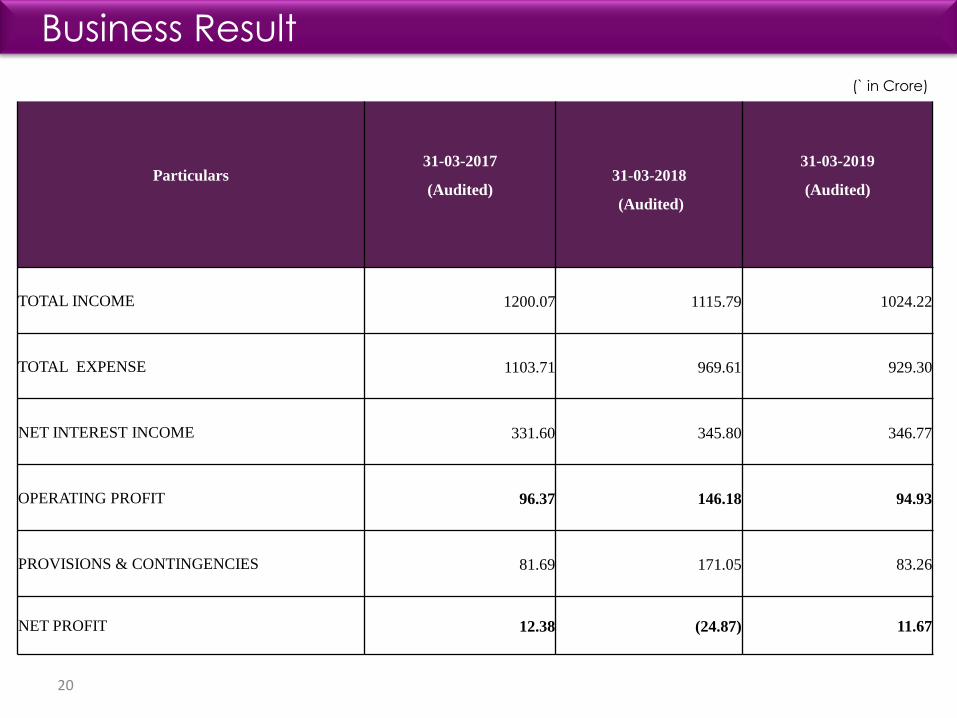
Business Result
20
Particulars 31-03-2017
(Audited) 31-03-2018
(Audited)
31-03-2019
(Audited)
TOTAL INCOME 1200.07 1115.79 1024.22
TOTAL EXPENSE 1103.71 969.61 929.30
NET INTEREST INCOME 331.60 345.80 346.77
OPERATING PROFIT 96.37 146.18 94.93
PROVISIONS & CONTINGENCIES 81.69 171.05 83.26
NET PROFIT 12.38 (24.87) 11.67
(` in Crore)
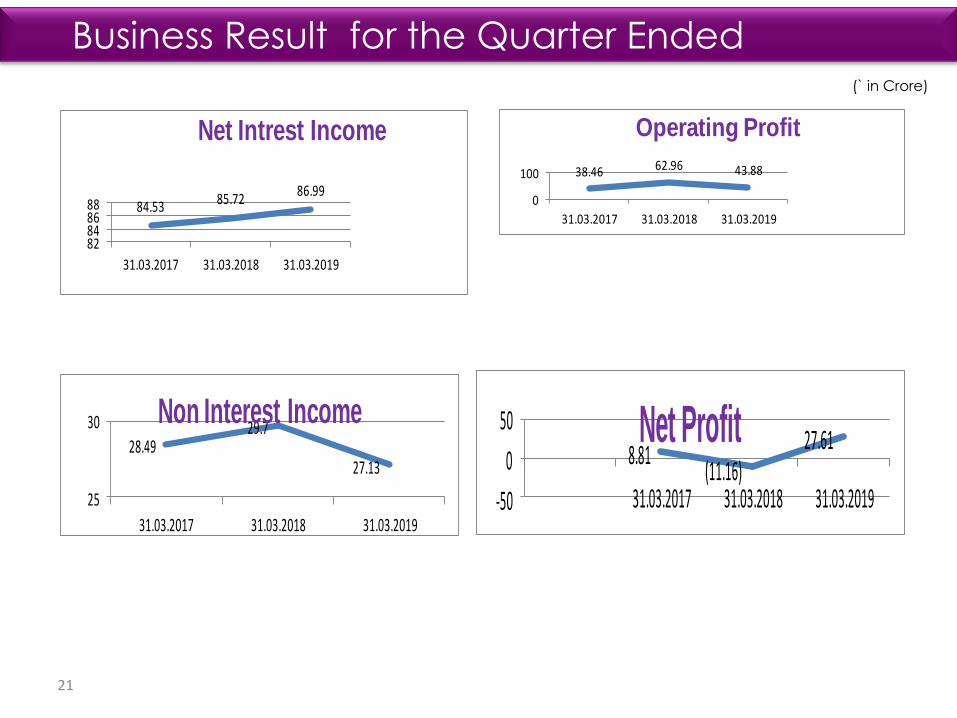
Business Result for the Quarter Ended
38.46 62.96 43.88
0
100
31.03.2017 31.03.2018 31.03.2019
Operating Profit
28.4929.7
27.13
25
30
31.03.2017 31.03.2018 31.03.2019
Non Interest Income
21
(` in Crore)
8.81 (11.16)
27.61
-50
0
50
31.03.2017 31.03.2018 31.03.2019
Net Profit
84.53 85.7286.99
82848688
31.03.2017 31.03.2018 31.03.2019
Net Intrest Income

22

Net Interest Income for the Quarter Ended
2018 (Q4) 85.72
2019(Q1) 81.14
2019(Q2) 87.43
2019(Q3) 91.21
2019(Q4) 86.99
Net Interest Margin (%)
2018 (Q4) 2.90
2019(Q1) 2.74
2019(Q2) 2.84
2019(Q3) 2.97
2019(Q4) 3.00
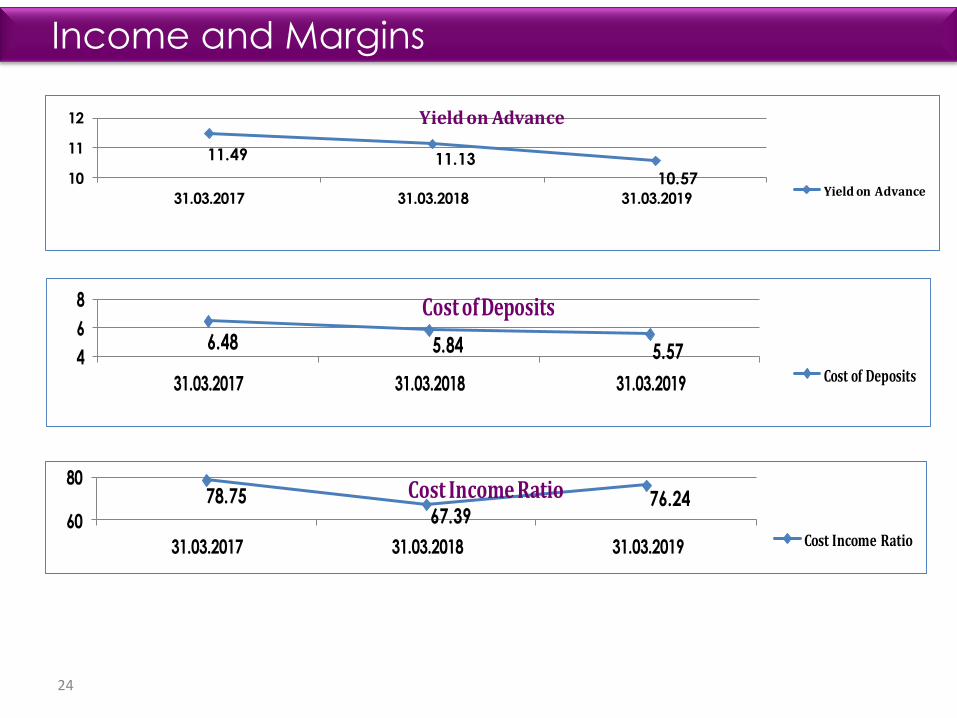
Income and Margins
23
70
80
90
100
Net Interest Income
Net Interest Margin
(in crore)
2.6
2.8
3
3.2
Net Interest Margin
Net Interest Margin
24
Income and Margins
11.49 11.1310.5710
11
12
31.03.2017 31.03.2018 31.03.2019
Yield on Advance
Yield on Advance
6.48 5.84 5.574
6
8
31.03.2017 31.03.2018 31.03.2019
Cost of Deposits
Cost of Deposits
78.7567.39
76.2460
80
31.03.2017 31.03.2018 31.03.2019
Cost Income Ratio
Cost Income Ratio
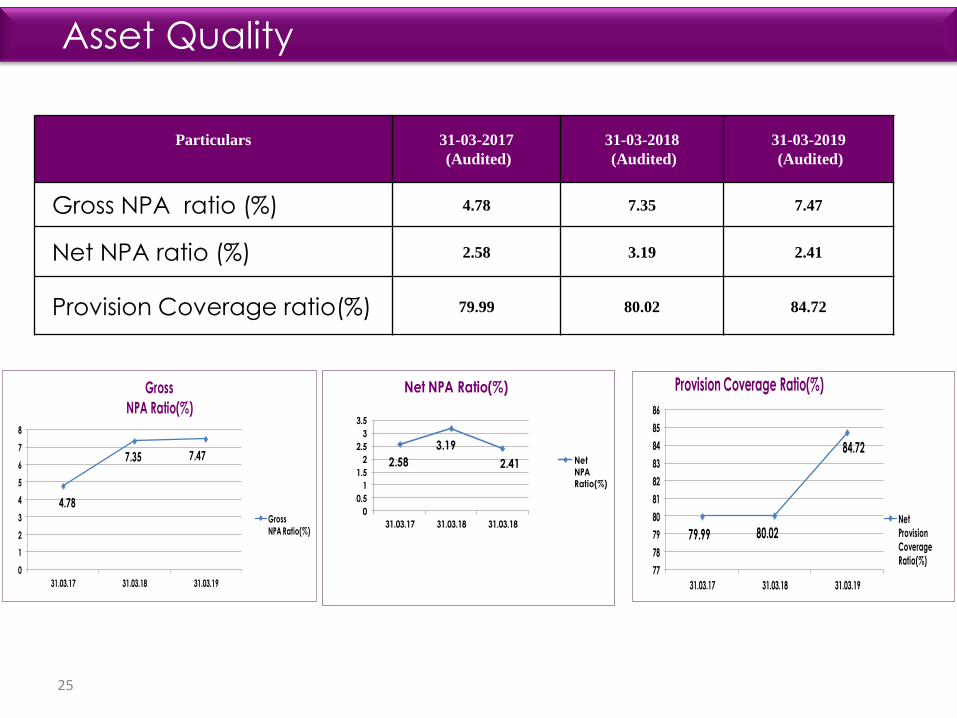
Particulars 31-03-2017
(Audited)
31-03-2018
(Audited)
31-03-2019
(Audited)
Gross NPA ratio (%) 4.78 7.35 7.47
Net NPA ratio (%) 2.58 3.19 2.41
Provision Coverage ratio(%) 79.99 80.02 84.72
Asset Quality
25
4.78
7.35 7.47
0
1
2
3
4
5
6
7
8
31.03.17 31.03.18 31.03.19
Gross
NPA Ratio(%)
Gross
NPA Ratio(%) 79.99 80.02
84.72
77
78
79
80
81
82
83
84
85
86
31.03.17 31.03.18 31.03.19
Provision Coverage Ratio(%)
Net
Provision
Coverage
Ratio(%)
2.58
3.19
2.41
0
0.5
1
1.5
2
2.5
3
3.5
31.03.17 31.03.18 31.03.18
Net NPA Ratio(%)
Net
NPA
Ratio(%)
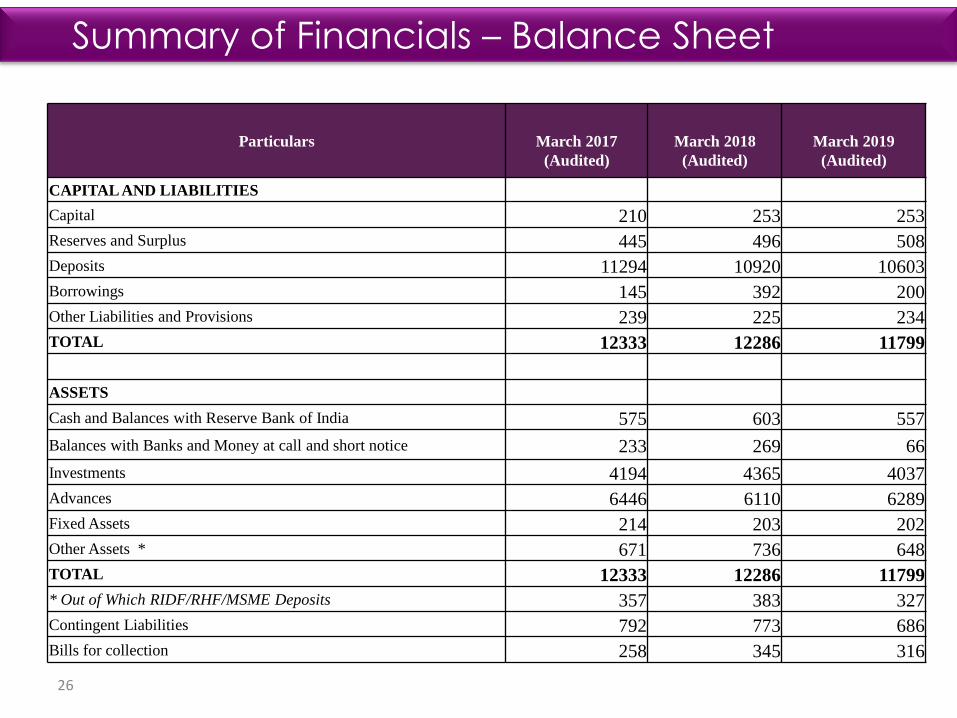
Summary of Financials – Balance Sheet
26
Particulars March 2017
(Audited)
March 2018
(Audited)
March 2019
(Audited)
CAPITAL AND LIABILITIES
Capital 210 253 253
Reserves and Surplus 445 496 508
Deposits 11294 10920 10603
Borrowings 145 392 200
Other Liabilities and Provisions 239 225 234
TOTAL 12333 12286 11799
ASSETS
Cash and Balances with Reserve Bank of India 575 603 557
Balances with Banks and Money at call and short notice 233 269 66
Investments 4194 4365 4037
Advances 6446 6110 6289
Fixed Assets 214 203 202
Other Assets * 671 736 648
TOTAL 12333 12286 11799
* Out of Which RIDF/RHF/MSME Deposits 357 383 327
Contingent Liabilities 792 773 686
Bills for collection 258 345 316

27
Liability Strategy
Asset Strategy
Cost Rationalization
Focus on Non Interest Income
Other Initiatives
•Systematic Growth in Deposits
• Increasing CASA
• Increasing Retail / Low cost Deposits
• Quality Advance Portfolio
• Increasing Retail Advances
• Lending based on Collaterals
• Better Pricing
• Relocating high Cost Premises & low hit ATMs
• Renegotiating with vendors for cost reduction
• Other Cost Rationalization Measures
• Focus on recovery efforts by recourse to enabling
provisions in law including IBC,RR,OTS etc
• Continued focus on Cross Selling
• Focus on Insurance and Mutual Fund Products
• Increased focus on Non Fund based facilities
• Uniform Processing fee structure
• Leveraging of Technology Products
• Transformation Projects
• Effective use of data mining tools
• Improved Visibility Measures
Pro
fita
bili
ty A
pp
roa
ch
Way Forward
This presentation has been prepared by Dhanlaxmi Bank (the “Bank”) solely for your information and for your use and may not be
taken away, reproduced, redistributed or passed on, directly or indirectly, to any other person (whether within or outside your
organization or firm) or published in whole or in part, for any purpose. By attending this presentation, you are agreeing to be bound
by the foregoing restrictions and to maintain absolute confidentiality regarding the information disclosed in these materials.
The information contained in this presentation does not constitute or form any part of any offer, invitation or recommendation to
purchase or subscribe for any securities in any jurisdiction, and neither the issue of the information nor anything contained herein shall
form the basis of, or be relied upon in connection with, any contract or commitment on the part of any person to proceed with any
transaction. This presentation is not and should not be construed as a prospectus (as defined under Companies Act, 1956) or offer
document under the Securities and Exchange Board of India (Issue of Capital and Disclosure Requirements) Regulation, 2009, as
amended, or advertisement for a private placement or public offering of any security or investment.
The information contained in these materials has not been independently verified. No representation or warranty, express or
implied, is made and no reliance should be placed on the accuracy, fairness or completeness of the information presented or
contained in these materials. Such information and opinions are in all events, not current after the date of the presentation. The
recipients of this presentation and the information contained herein are not to construe the document as tax, investment or legal
advice.
Any forward-looking statements in this presentation are subject to risks and uncertainties that could cause actual results or financial
conditions or performance or industry results to differ materially from those that may be inferred to being expressed in, or implied
by, such statements. Such forward-looking statements are not indicative or guarantees of future performance. Any forward-looking
statements, projections and industry data made by third parties included in this presentation are not adopted by the Bank, and the
Bank is not responsible for such third party statements and projections. This presentation may not be all inclusive and may not contain
all of the information that you may consider material. The information presented or contained in these materials is subject to change
without notice. Neither the Bank nor any of its affiliates, advisers or representatives accepts liability whatsoever for any loss
howsoever arising from any information presented or contained in these materials. You should not place undue reliance on forward-
looking statements, which speak only as of the date of this presentation.
This presentation is for general information purposes only, without regard to any specific objectives, financial situation or
informational needs of any particular person. The Bank may alter, modify or otherwise change in any manner the content of this
presentation, without obligation to notify any person of such change or changes.
THIS PRESENTATION DOES NOT CONSTITUTE OR FORM ANY PART OF ANY OFFER, INVITATION OR RECOMMENDATION TO PURCHASE OR
SUBSCRIBE FOR ANY SECURITIES IN THE UNITED STATES OR ELSEWHERE.
Disclaimer
28

Dhanlaxmi Bankestablished 1927
Top Related