


![[Infographic] The Science of Content Marketing for Real Estate](https://static.fdocuments.us/doc/165x107/53fad22d8d7f72b82e8b51e4/infographic-the-science-of-content-marketing-for-real-estate.jpg)

Languages
Pages
Legal

Marketing ContentMarketing Content
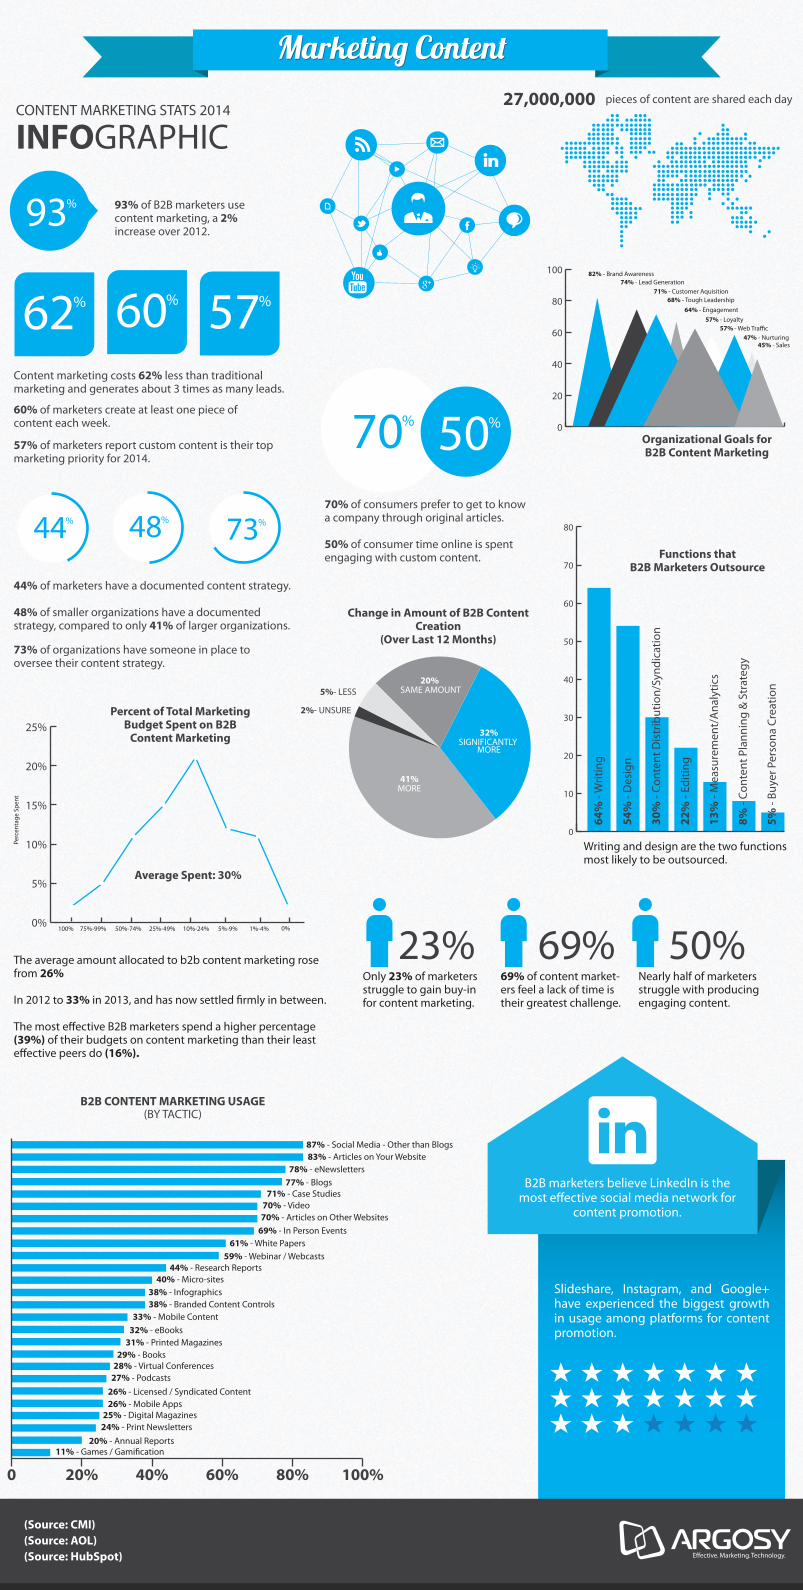
INFOGRAPHICCONTENT MARKETING STATS 2014
B2B CONTENT MARKETING USAGE(BY TACTIC)
0 20% 40% 60% 80% 100%
87% - Social Media - Other than Blogs83% - Articles on Your Website
78% - eNewsletters
71% - Case Studies70% - Video70% - Articles on Other Websites
69% - In Person Events 61% - White Papers
59% - Webinar / Webcasts 44% - Research Reports
40% - Micro-sites 38% - Infographics38% - Branded Content Controls
33% - Mobile Content 32% - eBooks
31% - Printed Magazines29% - Books
28% - Virtual Conferences27% - Podcasts
26% - Licensed / Syndicated Content 26% - Mobile Apps
25% - Digital Magazines 24% - Print Newsletters
20% - Annual Reports 11% - Games / Gami�cation
77% - Blogs B2B marketers believe LinkedIn is the most e�ective social media network for
content promotion.
Slideshare, Instagram, and Google+ have experienced the biggest growth in usage among platforms for content promotion.
27,000,000 pieces of content are shared each day
93% 93% of B2B marketers use content marketing, a 2% increase over 2012.
60% of marketers create at least one piece of content each week.
Content marketing costs 62% less than traditional marketing and generates about 3 times as many leads.
57% of marketers report custom content is their top marketing priority for 2014.
62% 57%60%
44% 73%48%
44% of marketers have a documented content strategy.
48% of smaller organizations have a documented strategy, compared to only 41% of larger organizations.
73% of organizations have someone in place to oversee their content strategy.
50%
70% of consumers prefer to get to know a company through original articles.
50% of consumer time online is spent engaging with custom content.
70% 0
20
40
60
80
100
Organizational Goals for B2B Content Marketing
82% - Brand Awareness 74% - Lead Generation
71% - Customer Aquisition68% - Tough Leadership
45% - Sales47% - Nurturing
64% - Engagement 57% - Loyalty
57% - Web Tra�c
Change in Amount of B2B Content Creation
(Over Last 12 Months)
2%- UNSURE
5%- LESS
41%MORE
20% SAME AMOUNT
32%SIGNIFICANTLY
MORE
0%
5%
10%
15%
20%
25%Percent of Total Marketing
Budget Spent on B2B Content Marketing
The average amount allocated to b2b content marketing rose from 26% In 2012 to 33% in 2013, and has now settled �rmly in between.
The most e�ective B2B marketers spend a higher percentage (39%) of their budgets on content marketing than their least e�ective peers do (16%).
100% 75%-99% 50%-74% 25%-49% 10%-24% 5%-9% 1%-4% 0%
Average Spent: 30%
0
10
20
30
40
50
60
70
80
Functions thatB2B Marketers Outsource
64%
- W
ritin
g
54%
- D
esig
n
30%
- Co
nten
t Dis
trib
utio
n/Sy
ndic
atio
n
22%
- Ed
iting
13%
- M
easu
rem
ent/
Ana
lytic
s
8% -
Cont
ent P
lann
ing
& S
trat
egy
5% -
Buye
r Per
sona
Cre
atio
n
Writing and design are the two functions most likely to be outsourced.
(Source: CMI)(Source: AOL)(Source: HubSpot)
69% of content market-ers feel a lack of time is their greatest challenge.
Nearly half of marketers struggle with producing engaging content.
Only 23% of marketers struggle to gain buy-in for content marketing.
23% 69% 50%
Top Related