


Languages
Pages
Legal

Consumption of non-public water: Implications for children’s caries experience
Authors:
Jason Mathew Armfield1
Andrew John Spencer1
Affiliations:
1 Dental School, Faculty of Health Sciences
The University of Adelaide
South Australia 5005
Running Title:
Consumption of non-public water and children’s caries
Address for correspondence:
Prof AJ Spencer
Dental School, Faculty of Health Sciences
The University of Adelaide
South Australia 5005
Phone: 61 8/(08) 8303 5438
Fax: 61 8/(08) 8303 4858
Email: [email protected]

2
Armfield JM, Spencer AJ
Consumption of non-public water: Implications for children’s caries experience
Community Dent Oral Epidemiol
Abstract:
There are concerns that the consumption of unfluoridated bottled and tank water may put
children at increased risk of developing caries. The aim of this study was to investigate the
relationship between non-public water consumption (either from bottles or rainwater tanks)
and socio-economic status and both deciduous and permanent caries experience. A random
sample of children enrolled in the School Dental Service of South Australia participated in the
study (response rate = 71.8%, N = 9,988). Forty-five percent of children had greater than 50%
lifetime consumption of non-public water while 36% of children had 0% lifetime
consumption. Increased use of non-public water occurred for children from lower socio-
economic groups, two-parent families and children from non-metropolitan areas, with these
results most likely a result of the residential location of the children. Multivariate modelling
revealed a significant positive relationship between deciduous caries experience and
consumption of non-public water, even after controlling for the age and sex of the child,
socio-economic status and residential location. This relationship was significant only for
those children with 100% lifetime availability of fluoridated water. The effect of consumption
of non-public water on permanent caries experience was not significant. It is postulated that
these findings may result from the lower caries activity in the permanent dentition of children
aged 10–15 and possible dietary confounders. Recommendations are made for the addition of
fluoride to bottled water, especially with regard to the oral health of younger children.
Key words: water consumption; caries; children; fluoridated; socioeconomic status
3
Recently, concerns have been raised over the consumption of both bottled water and water
from rainwater tanks. The nature of these concerns are several and reflect varying
perspectives. From a public health perspective, the quality of bottled water has been brought
into question by studies finding bacteria and other chemicals in some bottled waters that have
breached the standards laid down by authorities in a number of countries (1–4), although
more recent studies indicate an improvement in this regard (5). Concerns about the safety of
drinking water from rainwater tanks revolve around the leaching of lead, lime, or paint
substrates into the rainwater run-off, the collection of pollutants in tank water in urban or
industrial areas, and the capacity for foreign matter to enter the rainwater tank (6–8). From a
dental public health perspective, however, concerns have been voiced for some time about the
substitution in the diet of tank or bottled water for fluoridated tap water (9,10). More recently,
this sentiment has been reiterated by the Centers for Disease Control and Prevention in the
US, which stated that the full benefits of community water fluoridation might not be received
by persons substituting unfluoridated bottled water for fluoridated mains water (11).
However, while fluoridated bottled water is becoming more common in the United States,
with more than 20 companies offering the product in 2002 (12), companies in Australia have
been reluctant to produce bottled water with what is considered to be appropriate fluoride
concentrations (2).
Although maximum fluoride levels have been set at 1.5 mg/L for public drinking
water in Australia (13), no guidelines have been specified for bottled or packaged waters.
This is despite the wide spread practice in Australia of adding fluoride to public water
supplies. Beginning in 1964 with fluoridation of Hobart, the capital of Tasmania, by 1977
every capital city except one was receiving fluoridated water, and approximately two-thirds of
the Australian population were resident in fluoridated areas (14). Numerous studies in the last
two decades (15–20) and recent reviews (21–22) provide support for the positive health

4
consequences of the consumption of fluoridated water. The regular ingestion of adequately
fluoridated water, currently considered in Australia to be between 0.6 and 1.1 parts per
million depending on the locality (23), has been found to lower the prevalence and experience
of dental caries. Reductions in caries experience of between 20% and 40% have been
commonly reported. For example, looking at lifetime residents of fluoridated Townsville and
unfluoridated Brisbane (24), 6 year-old children with 100% lifetime exposure to optimally
fluoridated water had a dmfs score 36% lower than children with no exposure to fluoridated
water. Twelve year-old DMFS scores were 48% lower for children with 100% lifetime
exposure than for children with 0% exposure. These effects remained significant after
controlling for sex, tooth-brushing frequency, and household income.
The relevance of the concern over the consumption of bottled and tank waters goes
hand-in-hand with the increase in consumption of water from non-public sources. Figures
released by the Beverage Marketing Corporation in the US show that bottled water
consumption in that country has climbed by almost 10% per year between 1991 and 2001,
with over 7% compound annual growth rate predicted to 2005 (25). In Australia in 2001, an
estimated 1.2 million households, or 16% of all households in Australia consumed bottled
water, with 6.9% of the adult population using bottled water as their main source of drinking
water (26). Approximately 840 thousand adults, or 11.4% of Australia’s adult population,
derived their main source of drinking water from a rainwater tank and this was highest in
South Australia where 1 in 3 adults consumed tank water as their main source of drinking
water. Although the percentage of adults using tank water increased by only 0.5% between
1994 and 2001, there had been an almost sixfold increase in the percentage of adults
consuming bottled water as the primary source of drinking water across the same period.
The reasons behind the increasing popularity of mineral, spring and purified waters
are not difficult to identify. One factor is a raised health-consciousness in Australia and it is,

5
perhaps, not surprising that bottled non-carbonated waters are pitched as being a healthy
alternative to other beverages, containing no kilojoules, no fat, and no cholesterol. A US
study found that 35% of people drinking bottled water were doing so primarily as a substitute
for the consumption of other beverages (27). Advertising campaigns promote bottled water as
being using terms such as “tasty”, “fresh”, “pure”, and “naturally clean”, and companies
claim that their water is “the way nature meant it to be”. As such, bottled waters are not only
seen as a healthy alternative to alcoholic or sweetened beverages but are increasingly seen as
an alternative to tap water as well.
At the same time there exists a poor perception of tap water. In a 2001 survey over a
quarter of all Australians adults, or almost 3.6 million people, were not satisfied with the
quality of their tap water for drinking, dissatisfaction ranging from 7.8% of people in the
Northern Territory and Australian Capital Territory to 42.2% of people in South Australia
(21). Of those people who reported being dissatisfied with their water quality, the main
problems identified were taste and chlorine, reported by 51.7% and 32.3% of people
respectively. Perceptions of differences in the taste of bottled waters versus tap water prevail
despite tap water often performing well in blind comparative tastings (28).
In Australia the use of domestic rainwater tanks has had a long history. Australia has a
generally hot, dry climate and water is therefore widely perceived as a valuable commodity.
Certainly, in rural areas, historical problems with connections to mains water and
inadequacies with bore water have led to rainwater tanks becoming widely adopted. However,
in states such as South Australia, which receives less rainfall than any other state or territory
in the country, the prevalence of rainwater tanks in towns and cities is also high. A survey
conducted in South Australia in 1996 showed that while 82% of the rural population used
rainwater as their primary source of water for drinking, 28% of the population in metropolitan
Adelaide, the capital city, also used water from rainwater tanks (29). The South Australian

6
government encourages the installation of rainwater tanks throughout the state as a result of
perceived problems with the quantity and quality of reticulated water supplies (30).
Both bottled and tank water have been promoted as healthy alternatives to other
beverages. Complimenting this appeal to health consciousness are concerns over the safety of
public water supplies. Contamination by bacteria, viruses, blue-green algae, lead, nitrates and
synthetic organic chemicals such as pesticides and herbicides are perennial troubles for public
water supplies. Such concerns are highlighted by events such as the outbreak of
cryptosporidiosis in Milwaukee, Wisconsin in 1993 where over 400,000 persons were
affected by the disease (31), resulting in the death of an estimated 100 people (32). In
Australia, the protozoa Giardia and Cryptosporidium were detected in the drinking water
supply of Sydney, New South Wales in 1998 (33) leading to widespread concern over the
quality of public water supplies. At the peak of the scare, sales of bottled waters had increased
by 330% over the same period the previous year (34). Families with younger children were
the most likely to be purchasing bottled water for the first time. The impact of the scare in
Australia is demonstrated by figures released three years later by the Australian Bureau of
Statistics which found that in 2001, 25.4% of those people dissatisfied with mains water in
New South Wales attributed this to concerns regarding microbial and algae contamination,
compared to between 4.6% and 12.2% in Australia’s other states and territories (26).
All these factors indicate that the consumption of bottled and tank waters is not merely
a temporary fad. Consumption of non-public water is increasingly coming to replace mostly
fluoridated tap water as the drinking water of choice. This is reflected in the continuing
decline in the percentage of adults using mains/town water as their main source of drinking
water and the increase in the percentage of adults using bottled water (26). Although it
appears intuitively likely that a decrease in consumption of fluoridated water accompanying
the use of bottled or tank water may lead to an increase in caries, literature searches fail to
7
identify previous studies that have investigated this matter. The current study, therefore,
sought to describe the relationship between consumption of non-public water and dental
caries experience among South Australian children with varying levels of lifetime availability
of optimally fluoridated water. It was hypothesised that the relationship between non-public
water consumption and caries would only be significant for children living continuously in
fluoridated areas. Additionally, the influence of socioeconomic status (SES) on bottled and
tank water consumption was investigated. Although 95.4% of South Australians had access to
mains water in 1994 and therefore almost all families have the choice of using public water
(26), it was predicted that children from lower socio-economic status families would have
higher use of non-public water than children from higher socio-economic status families.
Method
This study reports on cross-sectional results from the baseline component of a
longitudinal study of caries experience in South Australian children conducted between 1991
and 1995. Despite the age of the data set, the data still represent a rare opportunity to
investigate this increasingly important oral health issue due to the paucity of scientific data
related to the relationship between the consumption of non-public water and caries
experience.
Participants
This study sampled children from fluoridated and non-fluoridated metropolitan and
rural areas of South Australia. Children attending the South Australian School Dental Service
for a periodic dental examination between June 1991 and May 1992 were randomly sampled
on the basis of birth date, the sampling frame varying by the fluoridation status of the region

8
in which a patient lived. The School Dental Service provides routine dental care to children
whose parents consent to their enrolment in the service. Routine dental care involved regular
examinations occurring approximately yearly at the time of data collection, as well as
preventive services, restorations and oral surgery as required. In 1991/92 the Service operated
from 85 fixed clinics although a number of mobile clinics were also in operation, mostly in
rural areas. Services were provided free of charge to all students up to and including the year
in which they turned 18. Participation rates in 1991/92 were 82.2% among preschool and
primary school children and 69.6% among secondary school students.
Children were randomly sampled from two strata. One stratum was Adelaide, the state
capital, where approximately 1 in 12 patients were selected (those born on the 13th, 30th or
31st day of any month). In 1992 the estimated resident population of 5–15-year-olds in
Adelaide was 139,018. The other stratum comprised South Australia rest-of-state, where
children were selected if their day of birth fell on the 13th or between the 26th and 31st day
inclusive of any month, giving a sampling ratio of approximately 1 in 5. Outside of the
capital, South Australia is predominantly non-fluoridated and the population of 5–15-year-
olds in 1992 was 61,763. The sampling scheme was adopted to provide for approximately
equal numbers of children to be sampled at each stratum and the 5–15-year-old age group was
used for these calculations because population figures available from the Australian Bureau of
Statistics only provided for specific age range groupings (59, 1014) by Statistical Divisions,
not individual age year statistics.
Oral examinations
Data describing caries experience were recorded by either dental therapists or dentists
from the School Dental Service during the course of scheduled periodic examinations. In
South Australia, dental therapists are qualified to examine and diagnose, and provide
restorative, preventive and community dental services for children under the supervision of a
9
dentist. Written instructions were supplied to clinical staff concerning criteria for recording
the decayed, missing and filled indices on deciduous (dmfs) and permanent tooth surfaces
(DMFS). The instructions made use of visual criteria only within the approach advocated by
the World Health Organization (35) with further guidelines for their surface level application
from the US NIDR (36). The scoring of decay was based on visual criteria and was recorded
if cavitation had occurred and/or the lesion extended into the dentine. All surfaces of teeth
missing due to decay were recorded in dmfs and DMFS scores. Information was collected on
five surfaces for each molar and premolar tooth and four surfaces for each canine and incisor
tooth in the deciduous and permanent dentition. The written guidelines were discussed with
the researchers during in-service training and other staff meetings. The large number of
examiners and their widespread geographical distribution across South Australia precluded
further calibration procedures. However, it should be noted that the dental therapists all
operated within the one state and had received training in the one school, leading to an
amelioration of possible systematic geographic variations in the application of diagnostic
criteria which may have led to biased estimates of caries experience. Moreover, the design
aspects employed in this study were deemed consistent with the orientation of the project
towards community effectiveness using a practitioner perspective on the diagnosis of disease
experience. Nonetheless, reliability studies conducted within the South Australian School
Dental Service subsequent to this study demonstrated that examiners reach satisfactory levels
of reliability on the observation of caries experience. Between dental therapists, a Kappa
statistics of 0.98 was obtained for inter-examiner reliability for DMFT and the inter-examiner
reliability between dentists and dental therapists reached 0.87 for DMFT.
Parental questionnaire
At the time of a child’s visit to a School Dental Service clinic a questionnaire was
given to each sampled student to be delivered to their parent or guardian. Up to two reminder

10
notices were mailed to parents or guardians who did not respond to the questionnaire. Also,
an effort was made to obtain missing questionnaire data and correct erroneous information by
telephoning the parents or guardians of the participants. Principally, missing or erroneous
information regarding residency history and water use (e.g., where dates indicated residencies
commencing prior to a child’s birth or where years of residency were missing) were sought.
Parents were contacted at either their stated address on the questionnaire or through a contact
person indicated by the parents on the questionnaire. Up to six attempts were made to
telephone the parents and approaches were made at various times of the day. As a result of
this process, the percentages of South Australian children with missing water consumption
history of two years or greater decreased from 9.1% to 1.2% of the sample.
The parental questionnaire was used to obtain information on lifetime residential
history, usual source of drinking water and socioeconomic status. Parents or guardians were
asked to specify the location of each residence that their child had lived at for greater than 6
months, the length of time at each residence and the usual source of drinking water at each
residence (‘Public Supply’, ‘Tank/Other’, or ‘Don’t Know’). This enabled a calculation of
both percent lifetime consumption of non-public water and percent lifetime availability of
fluoridated water.
Lifetime consumption of non-public water was calculated by summing, across all
residences, time spent at each residence where non-public water was the usual source of
drinking water. This was then divided by the child’s age to obtain a measure ranging from
zero (no consumption of non-public water) to 100% (all of lifetime consumption of non-
public water).
Per cent lifetime availability of appropriately fluoridated water was calculated in the
following manner. Postcode information supplied by the parents or guardians was matched
with an electronic database of fluoride content of water for each postcode within Australia.

11
This information was derived from a variety of health and water authorities within Australia.
For children who had spent time in countries outside Australia, fluoridation status was
obtained where necessary from various authorities from those countries or from reported
assays of local water content. Due to variations in the precision with which fluoride
concentrations were specified, fluoride content was categorised as being negligible or 0 ppm
(less than 0.3 ppm F), sub-optimal or 0.5 ppm (0.3 to 0.7 ppm F), or optimal or 1 ppm (greater
than 0.7 ppm F). For each residence the time spent at that residence was multiplied by the
categorised fluoride content of the public water supply for that area. Availability of
fluoridated tap water was summed across each residential location to obtain the measure of
per cent lifetime availability of appropriately fluoridated water. The percent could range from
zero (no availability) to 100 (all of lifetime availability of 1.0 ppm F). No assumption is made
in this measure of the actual consumption of fluoridated tap water, only its availability, and
this should be differentiated from calculations of percent lifetime exposure to fluoridated
water as described in earlier research (15). Cases with more than two years missing fluoride
access data were not included in the analysis.
Socioeconomic status was assessed by both the highest level of education completed
by either parent and total family income before tax. Annual pre-tax income was reported
using 10 groupings which for this analysis were collapsed into five categories: up to $20,000;
$20,001–$30,000; $30,001–$40,000; $40,001–$50,000; and over $50,000. Education was
assessed for each parent using six groupings. For this study, highest level of education
attained by either the female or male parent or guardian was collapsed into four categories by
combining the lowest educational attainment responses. Categories were: not completed
secondary school; completed secondary school; some university or college; and completed
university or college. Occupational prestige, an indicator measure of social class, was
measured using the Daniel Scale (37). Occupational prestige was coded into five categories:

12
12–27 (highest occupational prestige), 28–41, 42–55, 56–69 (lowest occupational prestige)
and ‘No Usual Occupation’. An aspect of family structure was also used in the analyses, with
children recorded as being from either single-parent families or not.
Residential location was measured using the Rural, Remote and Metropolitan Areas
classification (RRMA), an index of remoteness developed by the Australian Department of
Primary Industries and Energy and the Department of Human Services and Health (1994).
The RRMA describes six levels of remoteness, however for the purpose of analyses here they
were collapsed into three categories: metropolitan, rural and remote.
Analysis
The dmfs (deciduous dentition) and DMFS (permanent dentition) indices, which
represent the number of decayed, missing or filled tooth surfaces per child, were the principal
outcome variables in this investigation. The mean dmfs index was analysed only for children
aged between 4 and 9 years old while the mean DMFS index was analysed only for children
aged between the ages of 10 and 15 years old. The primary explanatory variable was percent
equivalent of lifetime consumption of non-public water.
For descriptive purposes, age-specific per cent lifetime use of non-public water is
presented graphically for the two extreme values of consumption of non-public water (0% and
100%) and for two intermediate consumption levels: 1–50% and 51–99%. Although this
creates non-equivalent intervals of non-public water consumption, the purpose of this
categorization was to use the polar extreme groups of 0% and 100% consumption while still
allowing comparison of various ranges among children with two intermediate levels of
exposure.
Descriptive statistics are presented for both mean caries experience indices and
percent lifetime consumption of non-public water by the socio-economic variables of highest
parental education, gross household income, occupational prestige, single-parent status and

13
residential location. Statistics are presented for both children aged 4–9 and those aged 10–15.
In addition, the bivariate association between each independent and dependent variable was
explored using general linear modelling analysis of variance.
Multivariate modelling was performed using the UNIANOVA procedure in SPSS 11.0
for Windows. This analytic procedure provides regression analysis and analysis of variance
for one dependent variable by one or more factors and/or covariates. The partitioning of the
sum-of-squares of each effect utilized the sum of squares adjusted for any other effects that
did not contain it, and orthogonal to any effects that contained it. For each model percent
lifetime consumption of non-public water was used as the chief explanatory variable and was
used as a categorical variable. Other categorical variables included in the modelling were sex,
income, education, occupational prestige, family type and residential location. Age was
entered as a continuous variable.
Multivariate models were constructed for three different conditions: 0% lifetime
availability of fluoridated tap water, 100% lifetime availability of fluoridated tap water, and
intermediate availability (1–99%) of fluoridated tap water. The intention of running models
under the three different conditions was to circumvent the problem of comparing children
with and without consumption of non-fluoridated bottled and tank water even in areas where
there is no fluoridated water available in any event. In this circumstance, the substitution of
bottled or tank water for public water has no effect on the exposure to fluoridated tap or mains
water. However, where children have spent their entire lives at a residence with access to
fluoridated tap water, it might be expected that in this case a higher percentage intake of non-
public water would lead to a greater reduction in exposure to fluoridated water compared to
children who consumed little or no non-public water.

14
Results
A total of 13,911 children were sampled with data obtained on 9,988 children aged 3–
18 years old (response rate = 71.8%). Because very small numbers of children were aged less
than 4 or greater than 15, children from these ages were excluded from the analyses. Results
have been presented for two age groups. Children aged 4–9 (n = 5,129) were used for
analyses of deciduous dentition, while children aged 10–15 (n = 4,803) were used for
analyses of permanent dentition.
Lifetime consumption of non-public water by age group is shown in Figure 1. From
the age of five there was little variation in water consumption across age groups. Overall,
36% of children had 0% lifetime consumption while 45% of children had greater than 50%
lifetime consumption. This compares well with statistics from 1994 showing that 36.7% of
South Australian people were reported as using tank water as their main source of drinking
water and 7.9% of people reportedly consumed bottled water as their main source of drinking
water (21). The results for 4-year-olds can be considered unreliable due to the small number
of these children in the sample (n = 22). It should be noted that all subsequent analyses were
conducted both with and without 4-year-old children however the results varied little as a
result of their exclusion. Therefore all results for the deciduous dentition are presented with
the inclusion of 4-year-old children.
Mean dmfs and DMFS scores by demographic and socio-economic variables are
shown in Table 1. For both the deciduous and permanent dentition caries experience scores
decreased with increasing parental education. Mean dmfs scores were 81.8% and 48.6%
higher in the deciduous and permanent dentition respectively for children whose parents had
not completed secondary school compared to children whose parents had completed
university or college. A similar effect was born out for household income, with children from

15
the families with the lowest household income having 52.9% and 68.3% higher mean caries
scores in their deciduous and permanent dentitions respectively than children from families
with incomes over $50,000 per year. The socio-economic differentials were even more
marked with relation to occupational prestige. Children whose parents had no usual
occupation had 137.9% and 115.6% higher caries experience in the deciduous and permanent
dentitions respectively, than did children with at least one parent with the highest
occupational prestige scores, between 12 and 27 on the Daniel Score. The differences in
caries experience by single-parent status were not as appreciable as for the other socio-
economic variables, and for children aged 4–9 was not statistically significant. However,
mean DMFS among 10–15-year-old children was 24.4% higher for those children living
within a single-parent family compared to children not in a single-parent family and this was
statistically significant. Caries experience also varied according to geographic location
although this was only statistically significant among 4–9-year-olds in the deciduous
dentition, where children living in rural or remote areas had 68.9% and 111.4% higher caries
experience respectively than children living in metropolitan Adelaide.
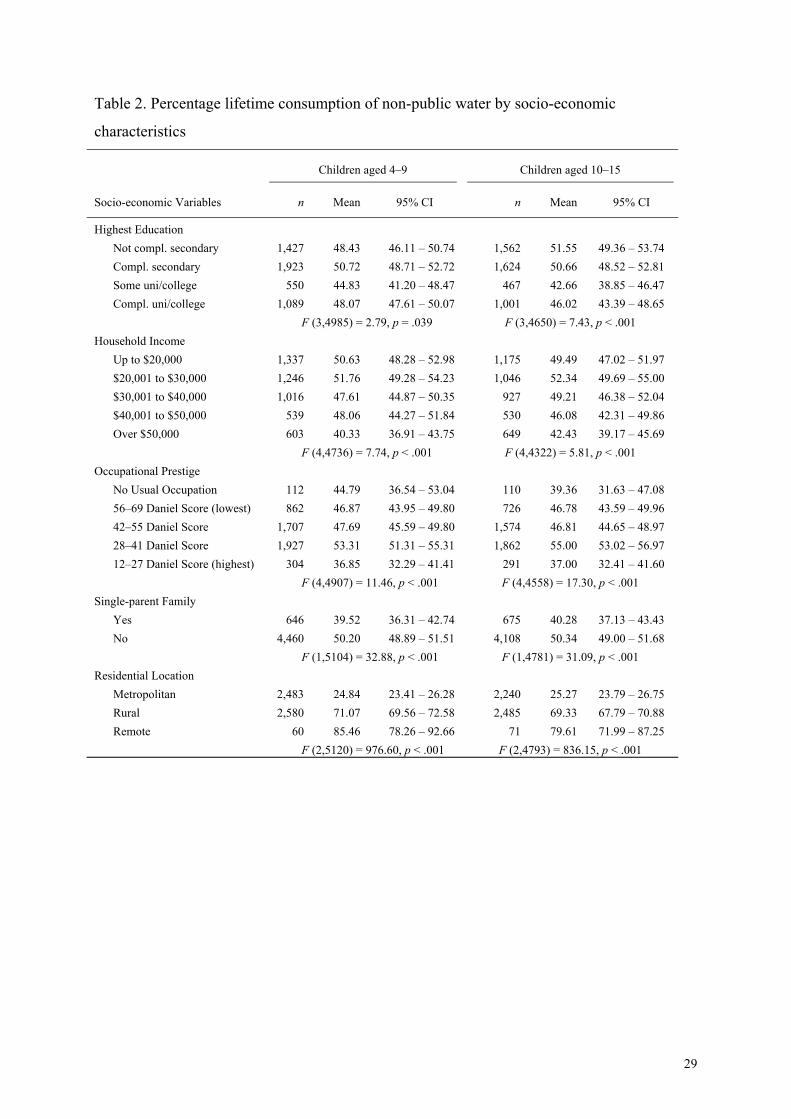
Differences in consumption of non-public tank and bottled waters by socioeconomic
status are shown in Table 2, with results again presented for both 4–9-year-old children and
10–15-year-old children. Using the highest level of education completed by either parent, the
relationship with non-public water consumption was most clear for the older children, where
lower educational attainment was related to increased exposure to non-public water. The
relationship between SES and water consumption was more apparent for taxable family
income, where there was a significant decline in lifetime consumption of non-public water
across income groups for both the younger and older children. Similarly, children of parents
with the highest occupational prestige (lowest scores) had consumed less non-public water
across their lives. However, there was a trend for an increase in consumption of non-public

16
water with higher occupational prestige up to the second highest category (Daniel Score =
28–41). Single-parent status was also related to consumption; children in single parent
families were found to have lower lifetime consumption of non-public water than children in
two-parent families. This was despite the lower socio-economic status of parents in a single-
parent family. Finally, children from metropolitan areas consumed considerably less non-
public water than did children in rural and remote locations.
There was a strong and consistent relationship between consumption of bottled or tank
water and caries experience in the deciduous dentition (Table 3). Male and female children
who had consumed non-public water as their main source of drinking water for their entire
life had a mean dmfs score 47.9% and 57.1% higher respectively than children who had never
consumed tank or bottled water as their main source of drinking water. However, the pattern
is less clear in the permanent dentition, where differences across groups for males were
minimal and the overall means appeared to be driven by results for females who had a mean
DMFS score 11.3% higher for children with 100% lifetime consumption of non-public water
than for children with 0% consumption of non-public water.
To test the significance of the apparent relationship between caries experience and
consumption of either tank or bottled water, a series of general linear models were computed
using deciduous dmfs and permanent DMFS scores as the dependent variables. To control for
variations in the availability of fluoridated tap water, the models were run under three
conditions: no lifetime availability of fluoridated tap water, some lifetime availability of
fluoridated tap water (between 1 and 99%), and 100% lifetime availability of fluoridated tap
water. The distributions of socio-economic variables and percent lifetime consumption of
non-public water across these conditions are shown in Table 4. The relationships were similar
in both the deciduous and permanent dentitions. Not surprisingly, the consumption of non-
public water was greatest where the availability of fluoridated tap water was least. Also

17
consistent with expectations, residential location was strongly related to availability of
fluoridated tap water, with children from rural areas more likely to have no availability of
fluoridated tap water than 100% lifetime availability. All SES variables were also
significantly related to percent lifetime availability of fluoridated tap water, with lower SES
being related to lower lifetime availability and higher SES being characterised by increased
availability of fluoridated tap water. The exception to this was single-parent status, with
children from a single-parent household more likely to have had increased availability of
fluoridated tap water than were children not from a single-parent household.
Two models were evaluated under each category of access to fluoridated water. The
first looked at the relationship between lifetime consumption of non-public water and caries
experience after controlling for the demographic variables of age and sex. The second model
again examined the relationship between consumption of non-public water and caries
experience, this time controlling for the demographic variables of age and sex, the socio-
demographic variables of family income, parental education, occupational prestige, family
type (assessed by single-parent status), residential location, and the potentially confounding
fluoride exposure sources of fluoridated toothpaste (assessed by frequency of tooth brushing
with fluoridated toothpaste) and fluoride tablets (assessed by whether or not children had at
any time consumed fluoride tablets or drops).
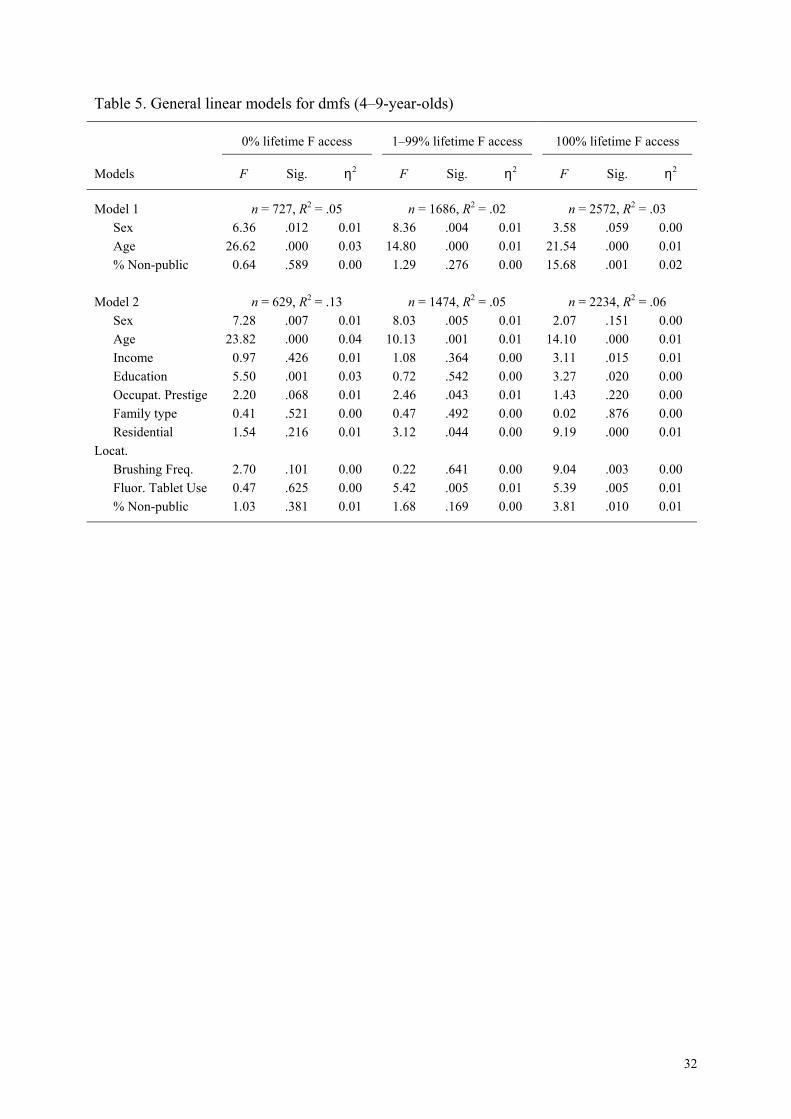
Looking at the deciduous dentition, in the first model, per cent lifetime consumption
of non-public water was entered with age and sex as covariates for children who had had no
access to fluoridated water across their lifetime (see Table 5). The relationship between
consumption of non-public water and dmfs scores was not significant, p>.05. In the second
model per cent lifetime consumption of non-public water was entered with age, sex, family
income, parental education, occupational prestige, family type, residential location, frequency
of brushing with fluoridated toothpaste and fluoride tablet use. Again, the relationship
18
between consumption of non-public water and caries experience was not significant. Similar
results were apparent for both models under the second condition, mixed lifetime access to
fluoridated water. Again, in both models the relationship between consumption of non-public
water and dmfs was not significant. However, under the third condition, children who had
spent their entire life in localities with fluoridated water available, the relationship between
consumption of non-public water and dmfs scores was significant after controlling for age and
sex. Indeed, after controlling for age, sex, income, education, occupational prestige, family
type, residential location, frequency of brushing with fluoridated toothpaste and fluoride
tablet use the association between caries experience and percent lifetime consumption of non-
public water remained significant, although the effect size (measured using partial eta-
squared) of this relationship was small (η2 = 0.01).
Running the same series of models, this time using the permanent DMFS scores as the
dependent variable (see Table 6), it can be seen that the effect of consumption of non-public
water on caries experience was not significant for either of the models under any of the three
conditions of access to fluoridated tap water.
Although the multivariate models control for residential location, due to the possible
confounding of the relationship between socio-economic status and consumption of non-
public water with residential location, the models were also run using only those children
living in metropolitan areas. No differences were found in the outcome of the results and
these results are therefore not presented here.
Discussion
This study found that children of lower socio-economic status were more likely to
consume non-public water. Deciduous caries experience was highest for children with the

19
greatest lifetime consumption of tank and bottled water. For children who had lifetime
availability of fluoridated tap water, the effect of consumption of non-public water was
significant even after controlling for family income, residential location, age, sex and
exposure to discretionary fluorides such as fluoridated toothpaste and fluoride tablets.
Although children from lower socio-economic backgrounds were found to be more
likely to consume non-public water it is quite possible that this result was confounded with
residential location. Children aged between 4 and 9, for example, living in rural locations had
a mean lifetime consumption of non-public water of 71%, compared to only 25% for children
living in metropolitan areas. Indeed, looking across income categories, the ratio of
metropolitan to rural and remote children was 1:1.56 in the lowest income group (up to
$20,000) yet 1:0.56 in the highest income group (more than $50,000), and within residential
location consumption of non-public water did not vary appreciably across income categories.
A similar confounding most likely explains the unexpected relationship between family
structure and consumption of non-public water, where children of one-parent families were
found to consume less non-public water than two-parent families. The ratio of metropolitan to
rural and remote children was 1:1.08 in one-parent households and 1:0.92 in two-parent
households.
The significant effect for consumption of non-public water on deciduous caries
experience is consistent with the idea that children are substituting bottled or tank water for
fluoridated tap water. In this case, the higher experience of caries would be seen as resulting
from the decreased exposure to fluoride obtained from tap water. It makes intuitive sense
therefore that non-public water consumption does not have a significant effect for children
who have had either no access or intermediate access to fluoridated tap water. It makes little
difference to children living in non-fluoridated localities whether they consume non-
fluoridated tap water or non-fluoridated bottle or tank water in terms of fluoride consumption.

20
The results also show that the explanation for the significant effect of non-public water
consumption is not due to differences in income or other socio-economic variables between
the water consumption groups. After controlling for socio-economic characteristics, the effect
of consumption of non-public water on caries experience in the deciduous dentition remained
significant.
A less unexpected result of this study, given the findings for the deciduous dentition,
was the lack of a significant relationship between consumption of non-public water and caries
experience in the permanent dentition across any of the differing conditions of access to
fluoridated tap water. Earlier research using these data on South Australian children had noted
the small absolute mean number of permanent tooth surfaces upon which caries was
prevented by exposure to fluoridated water supplies. The benefit was considerably less than
noted for the deciduous dentition, and was smaller in South Australia than another
comparison state, Queensland. Slade et al. suggested that these results reflected the lower
caries experience of children in their permanent dentition, the possible impact of fissure
sealants and the possible operation of a halo effect in South Australia (15). Although the halo
effect would be expected to pertain to deciduous as well as to permanent teeth, the lower
caries experience in permanent teeth may make the halo effect more of a problem in obtaining
significant results in the permanent dentition than in the deciduous dentition. Against this
background it was not unexpected that the association for exposure to non-public water was
not strong, or statistically significant, for the permanent dentition. Another possible
explanation for this is that children with higher lifetime consumption of tank or bottled water
are substituting the drinking of non-public water for the drinking of soft drinks, effectively
counter-balancing the reduced caries prevention of non-public water with a reduced
consumption of caries promoting soft drinks. In the Australian population there is a noticeable
increase between the ages of 4 and 15 in both the total consumption of soft drinks (128.9

21
average gms/person increasing to 525.4 average gms/person) and consumption of soft drinks
as a percentage of total non-alcoholic beverages (15.0% increasing to 34.4%) (38). It may be
that those children consuming bottled water at older ages are substituting water for the
generally high consumption of soft drinks of their peers. However, because dietary intake was
not assessed in the current study, this possibility could not be investigated. Further
explanation of how non-public water is consumed and its potential substitution for either
fluoridated tap water or sugary, acidic soft drinks and other beverages by age would be highly
desirable.
The differential effect between the deciduous and permanent dentitions might be
explained in a number of ways. Caries activity is greater in the deciduous dentition. For
instance at approximately the same interval after the first deciduous and permanent teeth
erupt, i.e. at ages 6 and 12 years, the mean deciduous caries experience is 1.51 while for the
permanent teeth it is 0.83 (39). Any association with permanent caries experience will be
more difficult to observe. Cumulative caries experience might be greater in the deciduous
teeth because of differences in the timing and/or incorporation of fluoride in developing
enamel, tooth morphology, risk behaviours across the early life-course or the impact of home
or professional preventive measures like brushing with toothpaste, or application of fissure
sealants.
The use of an existing data set for this study created a number of limitations that could
be considered in conducting research specifically planned to study non-tap water
consumption. In general, such research would seem best conducted only in areas with
availability of fluoridated water. Resources would then be put to their most productive use in
maximising participation and thereby representativeness, increasing reliability of both
measures of water consumption and caries experience.

22
It should be noted that, as discussed here, the drinking of bottled or tank water is
neither immediately deleterious nor beneficial to oral health in and of itself. The consumption
of non-public water is associated with a number of other factors and it is these that impact
upon the progression of dental disease. Such factors include diet and exposure to fluoride.
There is a need for recognition, therefore, that when children are consuming non-public water
they are also consuming non-fluoridated water. Although this may be more beneficial than the
consumption of high sugar and/or acidity beverages, it is less beneficial, from an oral health
perspective, than the consumption of fluoridated water.
It should also be noted that this study could not differentiate between people
consuming water from rainwater tanks and those drinking bottled water. However, it is likely
that non-public water consumption, especially in rural areas, is principally comprised of
rainwater consumption. There appears to be a need for more information to be circulated
concerning the consumption of water from rainwater tanks. Across Australia, rainwater tanks
provide the main source of drinking water for 11.4% of the population, with this being 33.1%
in South Australia (26). Considering that children with 100% lifetime consumption of non-
public water had 52.7% higher deciduous caries scores than children with 0% lifetime
consumption of non-public water, it is important that an effort be made to remedy the present
situation. Efforts could be directed at either reducing the use of tank water for domestic
drinking water consumption or further encouraging the appropriate use of fluoride to
compensate for the lack of fluoride in the drinking water. Given the higher percentage of
children in rural or remote areas using non-tap water and the higher caries experience of
lower socio-economic status households such efforts should be both geographically and
individually targeted. Although fluoride tablets have been suggested for those people using
rainwater only for drinking (30), this regimen has not been widely adopted. Only in
circumstances of established high risk to caries would the use of fluoride tablets under dental

23
advice as an individual preventive measure be encouraged. Alternatively, emphasis could be
given to increased frequency of toothbrushing with fluoridated toothpaste among children
with little or no exposure to fluoridated tap water.
It is also time that bottled water manufacturers in Australia began marketing
fluoridated water. In the US more than 20 companies produce water with optimum fluoride
concentrations. This is becoming increasingly important as consumption of tap water
decreases and bottled water’s share of all consumed drinks increases (25). Between 1998 and
2001 there was a further increase in the percentage of Australians consuming bottled water as
their main source of drinking water, from 5.1% to 6.9% (26). However, consumers currently
have little choice in Australia and the imminent introduction of fluoride-containing bottled
water does not look likely. The Australian Chapter of the International Bottled Water
Association proposes that one reason why people are drinking bottled water is actually to
avoid chemicals such as fluoride used in the treatment of public water supplies (40). Bottled
water is promoted as a healthy, chemical-free alternative. There is a need for bottled water
manufacturers to take a stand on the issue of the benefits of appropriately fluoridated water
and provide consumers with choice.

24
References
1. Hunter PR, Burge SH. The bacteriological quality of bottled natural mineral water.
Epidemiol Infect 1987;99:439–43.
2. Wasser Difference [editorial]. Choice 1992 Jan:6–9.
3. National Research Defense Council (NRDC). Bottled water: pure drink or pure hype?
1999, Mar [cited April 24, 2002]. Available from: URL:
http://www.nrdc.org/water/drinking/bw/bwinx.asp.
4. Sefcova H. Survey of the microbiological quality of bottled water. Cent Eur J Public
Health 1998;6:42–4.
5. Grant MA. Analysis of bottled water for Escherichia coli and total coliforms. J Food Prot
1998;61:334–8.
6. Health Department of Western Australia. Is the water in your rainwater tank safe to drink?
[pamphlet] Environmental Health Service Publication No. EH0003. Perth: Health
Department of WA, 1999 [cited April 24, 2002]. Available from: URL:
http://www.public.health.wa.gov.au/environ/applied/RAINWATER.PDF.
7. Bannister, R; Westwood J; McNeill, A (Water Ecoscience Pty Ltd.). Investigation of
microbiological and chemical water quality in rainwater tanks in Victoria, Report No.
139/97. Melbourne: Victorian Department of Natural Resources and Environment, 1997.
8. Cunliffe D. Guidance on the use of rainwater tanks. National Environmental Health
Forum Monographs, Water Series No. 3. Adelaide: NEHF, 1998.
9. Iadarola P. Fluoride and bottled water. J Am Dent Assoc 1986;113:724.
10. McGuire S. Fluoride content and bottled water. N Engl J Med 1989;321:836-7.
11. US Department of Health and Human Services Centers for Disease Control and
Prevention. Recommendations for using fluoride to prevent and control dental caries in
the United States. MMWR 2001;50(No. RR-14).
12. International Bottled Water Association. Bottled water with fluoride added list; updated
August 12, 2002 [cited March 6, 2003]. Available from: URL:
http://www.bottledwater.org.au/public/fluorida.htm.
13. National Health and Medical Research Council. Australian Drinking Water Guidelines.
Cat. No. 9627022. 1996 [cited April 24, 2002]. Available from: URL:
http://www.health.gov.au/nhmrc/publications/pdf/eh19.pdf.

25
14. Spencer AJ, Slade GD, Davies M. Water fluoridation in Australia. Community Dent
Health 1996;13(S2):27-37.
15. Slade GD, Davies MJ, Spencer AJ, Stewart JF. Associations between exposure to
fluoridated drinking water and dental caries experience among children in two Australian
States. J Public Health Dent 1995;55:218-28.
16. Brown LP, Mulqueen TF, Storey E. The effect of fluoride consumption and social class
on dental caries in 8-year-old children. Aust Dent J 1990;35:61-68.
17. Riordan PJ. Dental caries and fluoride exposure in Western Australia. J Dent Res
1991;70:1029-34.
18. Riordan PJ. Dental fluorosis, dental caries and fluoride exposure among 7-year-olds.
Caries Res 1993;27:71-77.
19. Stockwell AJ, Medcalf GW, Rutledge GJ, Holman CDJ, Roberts M. Dental caries
experience in schoolchildren in fluoridated and non-fluoridated communities in Western
Australia. Community Dent Oral Epidemiol 1990;18:184-89.
20. Hopcroft MS, Morgan MV. Exposure to fluoridated drinking water and dental caries
experience in Australian army recruits. Community Dent Oral Epidemiol 2003;31:68-74.
21. Locker D. Benefits and risks of water fluoridation. Report prepared for Ontario’s public
consultation on water fluoridation levels. Toronto: Community Dental Health Services
Research Unit; 1999 Nov.
22. McDonagh M, Whiting P, Bradley M, Cooper J, Sutton A, Chestnutt I, Misso K, Wilson
P, Treasure E, Kleijnen J. A systematic review of water fluoridation. York: NHS Centre
for Reviews and Dissemination; 2000 Sep.
23. National Health and Medical Research Council. Review of water fluoridation and
fluoride intake from discretionary fluoride supplements. Melbourne: NHMRC; 1999.
24. Slade GD, Spencer AJ, Davies MJ, Stewart JF. Caries experience among children in
fluoridated Townsville and unfluoridated Brisbane. Aust N Z J Pub Health 1996;20:623–
629.
25. Beverage Marketing Corporation. 2001 bottled water in the U.S. New York: Beverage
Marketing Corporation, 2001.
26. Australian Bureau of Statistics. Environmental issues: people’s views and practices. Cat
No 4602.0. Canberra: ABS, 2001.
27. Hurd RE. Consumer attitude survey on water quality issues. Denver CO: American Water
Works Association Research Foundation, 1993.
26
28. Cooperative Research Centre for Water Quality and Treatment. Tap water wins the taste
test. Health Stream 1997;7:6-7.
29. Heyworth JS, Maynard EJ, Cunliffe D. Who consumes what: potable water consumption
in South Australia. Water 1998;25:9-13.
30 Department for Environment Heritage and Aboriginal Affairs. Rainwater tanks - their
selection, use and maintenance. Revised edition. Adelaide: DEHAA, Government of
South Australia, 1999.
31. Kramer MH, Herwaldt BL, Craun GF, Calderon RL, Juranek DD. Surveillance for
waterborne-disease outbreaks - United States, 1993–1994. MMWR 1996;45(No. SS-1):1-
33.
32 Hoxie NJ, Davis JP, Vergeront JM, Nashold RD, Blair KA. Cryptosporidiosis-associated
mortality following a massive waterborne outbreak in Milwaukee, Wisconsin. Am J Pub
Health 1997;87:2032-5.
33 New South Wales Premiers Department. Sydney water enquiry. Final Report. Sydney:
Premiers Department, NSW Government, 1998.
34. ACNielson. Sydney sticks with bottled water since crisis. News release. March 3, 1999.
35. World Health Organization. Oral health surveys. basic methods. Geneva: WHO, 1987.
36. National Institute of Dental Research, Epidemiology and Oral Disease Prevention
Program. Oral health of United States children. Washington, DC: US Department of
Health and Human Services, Public Health Service, National Institute of Health, 1989;
NIH Publication No. 89-2247, pp. 353–368.
37. Daniel AE. Power, privilege and prestige. Melbourne: Longman Cheshire, 1983.
38. McLennan W, Podger A. National nutrition survey: foods eaten, Australia. ABS Cat No
4804.0. Canberra: Australian Bureau of Statistics; 1999.
39. Armfield JM, Roberts-Thomson KF, Spencer AJ. The Child Dental Health Survey,
Australia 1999: Trends across the 1990s. AIHW Cat. No. DEN 95. Adelaide: The
University of Adelaide, 2003.
40. Australasian Bottled Water Institute. What is bottled water. [cited April 29, 2002].
Available from: URL: http://www.bottledwater.org.au/html/about_bottled_water.html .

27
Figure 1. Per cent lifetime use of non-public water by age
0%
10%
20%
30%
40%
50%
60%
70%
80%
90%
100%
4 5 6 7 8 9 10 11 12 13 14 15
Age (years)
Perc
ent o
f chi
ldre
n
100%51-99%1-50%0%

28
Table 1. Mean dmfs and DMFS scores by socio-economic characteristics
Children aged 4–9 Children aged 10–15
Socio-economic Variables n Mean dmfs 95% CI n Mean DMFS 95% CI
Highest Education Not compl. secondary 1,383 4.40 4.04 – 4.75 1,526 1.62 1.49 – 1.75 Compl. secondary 1,875 3.61 3.35 – 3.88 1,582 1.34 1.22 – 1.46 Some uni/college 538 3.46 2.98 – 3.94 458 1.26 1.03 – 1.49 Compl. uni/college 1,058 2.42 2.14 – 2.71 972 1.09 0.97 – 1.22 F (3,4950) = 22.63, p < .001 F (3,4534) = 10.21, p < .001 Household Income Up to $20,000 1,297 4.22 3.87 – 4.57 1,144 1.70 1.52 – 1.88 $20,001 to $30,000 1,212 4.07 3.70 – 4.45 1,022 1.39 1.26 – 1.52 $30,001 to $40,000 991 3.17 2.86 – 3.47 901 1.29 1.15 – 1.44 $40,001 to $50,000 525 2.61 2.20 – 3.02 510 1.14 0.97 – 1.31 Over $50,000 590 2.76 2.32 – 3.19 639 1.01 0.88 – 1.15 F (4,4610) = 13.54, p < .001 F (4,4211) = 10.49, p < .001 Occupational Prestige No Usual Occupation 109 5.21 4.00 – 6.42 110 2.07 1.43 – 2.71 56–69 Daniel Score (lowest) 844 4.53 4.07 – 4.99 711 1.59 1.38– 1.80 42–55 Daniel Score 1,655 3.38 3.11 – 3.65 1,537 1.43 1.31 – 1.55 28–41 Daniel Score 1,873 3.33 3.07 – 3.59 1,809 1.27 1.16 – 1.37 12–27 Daniel Score (highest) 298 2.19 1.74 – 2.65 284 0.96 0.75 – 1.17 F (4,4774) = 13.16, p < .001 F (4,4446) = 7.06, p < .001 Single-parent Family Yes 629 3.92 3.42 – 4.42 654 1.68 1.48 – 1.88 No 4,340 3.53 3.36 – 3.71 4,010 1.35 1.27 – 1.42 F (1,4967) = 2.35, p = .125 F (1,4662) = 10.60, p = .001 Residential Location Metropolitan 2,417 2.64 2.45 – 2.83 2178 1.33 1.24 – 1.42 Rural 2,519 4.46 4.20 – 4.72 2437 1.45 1.35 – 1.56 Remote 50 5.58 3.62 – 7.54 62 1.47 0.86 – 2.08 F (2,4983) = 62.48, p < .001 F (2,4674) = 1.54, p = .214
29
Table 2. Percentage lifetime consumption of non-public water by socio-economic
characteristics
Children aged 4–9 Children aged 10–15
Socio-economic Variables n Mean 95% CI n Mean 95% CI
Highest Education Not compl. secondary 1,427 48.43 46.11 – 50.74 1,562 51.55 49.36 – 53.74 Compl. secondary 1,923 50.72 48.71 – 52.72 1,624 50.66 48.52 – 52.81 Some uni/college 550 44.83 41.20 – 48.47 467 42.66 38.85 – 46.47 Compl. uni/college 1,089 48.07 47.61 – 50.07 1,001 46.02 43.39 – 48.65 F (3,4985) = 2.79, p = .039 F (3,4650) = 7.43, p < .001 Household Income Up to $20,000 1,337 50.63 48.28 – 52.98 1,175 49.49 47.02 – 51.97 $20,001 to $30,000 1,246 51.76 49.28 – 54.23 1,046 52.34 49.69 – 55.00 $30,001 to $40,000 1,016 47.61 44.87 – 50.35 927 49.21 46.38 – 52.04 $40,001 to $50,000 539 48.06 44.27 – 51.84 530 46.08 42.31 – 49.86 Over $50,000 603 40.33 36.91 – 43.75 649 42.43 39.17 – 45.69 F (4,4736) = 7.74, p < .001 F (4,4322) = 5.81, p < .001 Occupational Prestige No Usual Occupation 112 44.79 36.54 – 53.04 110 39.36 31.63 – 47.08 56–69 Daniel Score (lowest) 862 46.87 43.95 – 49.80 726 46.78 43.59 – 49.96 42–55 Daniel Score 1,707 47.69 45.59 – 49.80 1,574 46.81 44.65 – 48.97 28–41 Daniel Score 1,927 53.31 51.31 – 55.31 1,862 55.00 53.02 – 56.97 12–27 Daniel Score (highest) 304 36.85 32.29 – 41.41 291 37.00 32.41 – 41.60 F (4,4907) = 11.46, p < .001 F (4,4558) = 17.30, p < .001 Single-parent Family Yes 646 39.52 36.31 – 42.74 675 40.28 37.13 – 43.43 No 4,460 50.20 48.89 – 51.51 4,108 50.34 49.00 – 51.68 F (1,5104) = 32.88, p < .001 F (1,4781) = 31.09, p < .001 Residential Location Metropolitan 2,483 24.84 23.41 – 26.28 2,240 25.27 23.79 – 26.75 Rural 2,580 71.07 69.56 – 72.58 2,485 69.33 67.79 – 70.88 Remote 60 85.46 78.26 – 92.66 71 79.61 71.99 – 87.25 F (2,5120) = 976.60, p < .001 F (2,4793) = 836.15, p < .001

30
Table 3. Deciduous (4–9-year-old) and permanent (10–15-year-old) caries experience by
consumption of non-public water
Male Female Total
Number Mean (SD) Number Mean (SD) Number Mean (SD)
4–9-year-old dmfs
0% 954 3.25 (6.01) 900 2.63 (4.75) 1,854 2.95 (5.45) 1–50% 482 3.64 (5.90) 412 2.66 (4.78) 894 3.19 (5.43) 51–99% 239 3.62 (5.78) 208 3.31 (5.96) 447 3.48 (5.86) 100% 940 4.82 (6.85) 850 4.09 (6.23) 1,790 4.47 (6.57) 10–15-year-old DMFS 0% 779 1.38 (2.37) 830 1.33 (2.19) 1,609 1.35 (2.28) 1–50% 473 1.32 (2.23) 471 1.39 (2.52) 944 1.35 (2.38) 51–99% 289 1.37 (2.45) 261 1.63 (3.51) 550 1.49 (3.00) 100% 793 1.38 (2.24) 781 1.48 (2.53) 1,574 1.43 (2.39)

31
Table 4. Non-public water use and SES characteristics by availability of fluoridated tap water
Lifetime availability of fluoridated tap water
Children aged 4–9 Children aged 10–15
0% (n=754)
1-99% (n=1,722)
100% (n=2,653)
0% (n=672)
1-99%(n=1,925)
100%(n=2,206)
% % % % % %
% lifetime non-public water use (n=754) (n=1,717) (n=2,653) (n=672) (n=1,921) (n=2,206) 0% 18.3 22.1 52.3 17.3 22.4 50.4 1–50% 6.0 24.5 17.0 6.4 25.3 19.8 51–99% 4.2 16.4 5.6 5.1 20.5 6.1 100% 71.5 37.0 25.0 71.3 31.8 23.7 χ2 (6) = 953.97, p < .001 χ2 (6) = 949.65, p < .001
Highest Education (n=734) (n=1,671) (n=2,585) (n=653) (n=1,867) (n=2,135) Not compl. secondary 33.2 29.3 26.9 39.5 32.7 32.6 Compl. secondary 42.4 38.9 37.2 38.6 34.5 34.1 Some uni/college 7.1 10.7 12.4 5.2 10.9 10.8 Compl. uni/college 17.3 21.2 23.5 16.7 22.0 22.6 χ2 (6) = 37.92, p < .001 χ2 (6) = 36.99, p < .001
Household Income (n=688) (n=1,600) (n=2,454) (n=586) (n=1,747) (n=1,995) Up to $20,000 32.4 31.6 24.9 31.1 30.7 22.9 $20,001 to $30,000 33.0 24.2 25.8 30.9 21.9 24.2 $30,001 to $40,000 18.8 21.5 22.1 20.0 22.5 20.9 $40,001 to $50,000 8.3 10.4 12.9 8.0 10.6 14.9 Over $50,000 7.6 12.4 14.4 10.1 14.3 17.1 χ2 (8) = 70.02, p < .001 χ2 (8) = 80.88, p < .001
Occupational Prestige (n=724) (n=1,639) (n=2,550) (n=644) (n=1,833) (n=2,087) No Usual Occupation 2.2 3.4 1.6 1.2 3.4 1.9 56–69 Daniel Score (lowest) 18.8 18.9 16.4 16.1 17.3 14.6 42–55 Daniel Score 33.4 24.3 35.4 32.8 34.1 35.4 28–41 Daniel Score 42.5 35.9 40.4 46.7 37.8 41.6 12–27 Daniel Score (highest) 3.0 7.6 6.2 3.1 7.3 6.6 χ2 (8) = 44.21, p < .001 χ2 (8) = 42.86, p < .001
Single-parent Family (n=752) (n=1,711) (n=2,644) (n=668) (n=1,919) (n=2,197) Yes 6.8 15.0 12.8 9.0 15.3 14.7 No 93.2 85.0 87.2 91.0 84.7 85.3 χ2 (10) = 32.18, p < .001 χ2 (10) = 17.23, p < .001
Residential Location (n=754) (n=1,718) (n=2,653) (n=672) (n=1,921) (n=2,205) Metropolitan 1.2 21.7 79.2 0.7 26.5 78.2 Rural 94.7 76.7 20.7 94.0 71.7 21.7 Remote 4.1 1.6 0.1 5.2 1.8 0.1 χ2 (4) = 2199.59, p < .001 χ2 (4) = 1797.50, p < .001
32
Table 5. General linear models for dmfs (4–9-year-olds)
0% lifetime F access 1–99% lifetime F access 100% lifetime F access
Models F Sig. η2 F Sig. η2 F Sig. η2
Model 1 n = 727, R2 = .05 n = 1686, R2 = .02 n = 2572, R2 = .03 Sex 6.36 .012 0.01 8.36 .004 0.01 3.58 .059 0.00 Age 26.62 .000 0.03 14.80 .000 0.01 21.54 .000 0.01 % Non-public 0.64 .589 0.00 1.29 .276 0.00 15.68 .001 0.02 Model 2 n = 629, R2 = .13 n = 1474, R2 = .05 n = 2234, R2 = .06 Sex 7.28 .007 0.01 8.03 .005 0.01 2.07 .151 0.00 Age 23.82 .000 0.04 10.13 .001 0.01 14.10 .000 0.01 Income 0.97 .426 0.01 1.08 .364 0.00 3.11 .015 0.01 Education 5.50 .001 0.03 0.72 .542 0.00 3.27 .020 0.00 Occupat. Prestige 2.20 .068 0.01 2.46 .043 0.01 1.43 .220 0.00 Family type 0.41 .521 0.00 0.47 .492 0.00 0.02 .876 0.00 Residential Locat.
1.54 .216 0.01 3.12 .044 0.00 9.19 .000 0.01
Brushing Freq. 2.70 .101 0.00 0.22 .641 0.00 9.04 .003 0.00 Fluor. Tablet Use 0.47 .625 0.00 5.42 .005 0.01 5.39 .005 0.01 % Non-public 1.03 .381 0.01 1.68 .169 0.00 3.81 .010 0.01

33
Table 6. General linear models for DMFS (10–15-year-olds)
0% lifetime F access 1–99% lifetime F access 100% lifetime F access
Models F Sig. η2 F Sig. η2 F Sig. η2
Model 1 n = 650, R2 = .11 n = 1884, R2 = .07 n = 2143, R2 = .10 Sex 2.88 .090 0.00 1.63 .202 0.00 0.64 .423 0.00 Age 70.50 .000 0.10 134.06 .000 0.07 222.31 .000 0.09 % Non-public 1.09 .354 0.01 1.60 .188 0.00 0.60 .612 0.00 Model 2 n = 523, R2 = .16 n = 1593, R2 = .09 n = 1795, R2 = .12 Sex 4.22 .040 0.01 3.37 .067 0.00 0.13 .715 0.00 Age 53.90 .000 0.10 108.70 .000 0.07 199.13 .000 0.10 Income 0.57 .685 0.01 1.89 .109 0.01 1.88 .112 0.00 Education 0.96 .410 0.01 2.78 .040 0.01 0.46 .709 0.00 Occupat. Prestige 2.43 .047 0.02 0.60 .666 0.00 0.89 .472 0.00 Family type 0.41 .523 0.00 0.09 .764 0.00 0.10 .747 0.00 Residential Locat.
0.19 .824 0.00 1.06 .347 0.00 2.24 .107 0.00
Brushing Freq. 4.27 .039 0.01 7.23 .007 0.01 5.26 .022 0.00 Fluor. Tablet Use 1.06 .348 0.00 0.39 .678 0.00 6.32 .002 0.01 % Non-public 2.29 .078 0.01 1.38 .247 0.00 0.71 .548 0.00
Top Related