


Languages
Pages
Legal


Considering the Impact of Social Determinants on Readmissions
June 26, 2014
Intermountain HEN
Andrew Masica, MD, MSCIChief Clinical Effectiveness Officer
Baylor Scott & White Health

Readmissions within 30 Days of Discharge
• Common, costly, & potentially hazardous• Major focus in virtually all hospitals/systems• Effectiveness of many suggested interventions
to reduce rates are often disappointing when rigorously evaluated
• …literature clearly shows that ‘one size does not fit all’ and implementation of readmission strategies should be accompanied by robust evaluations (McAlister, 2013)

Leppin et al. JAMA Int Med 2014

Transitional Care Interventions to Prevent HF Readmissions
• AHRQ-funded evidence report #133• Examined 47 relevant trial-based studies
evaluating reported interventionsHF All Cause
Intervention Type Readmits Readmits Mortality
Intensive Home Visits + + +
Multidisciplinary HF Clinic - + +
Structured Phone Support + - +
Telemonitoring - - -
Nurse-led Interventions - - -

Understanding the relative effects of social factors on reported readmission rates may help hospitals better target improvement efforts at an organizational level.
Nagasako et al., 2014

Joynt K, Jha AK NEJM 2013
Association of SES with Readmissions
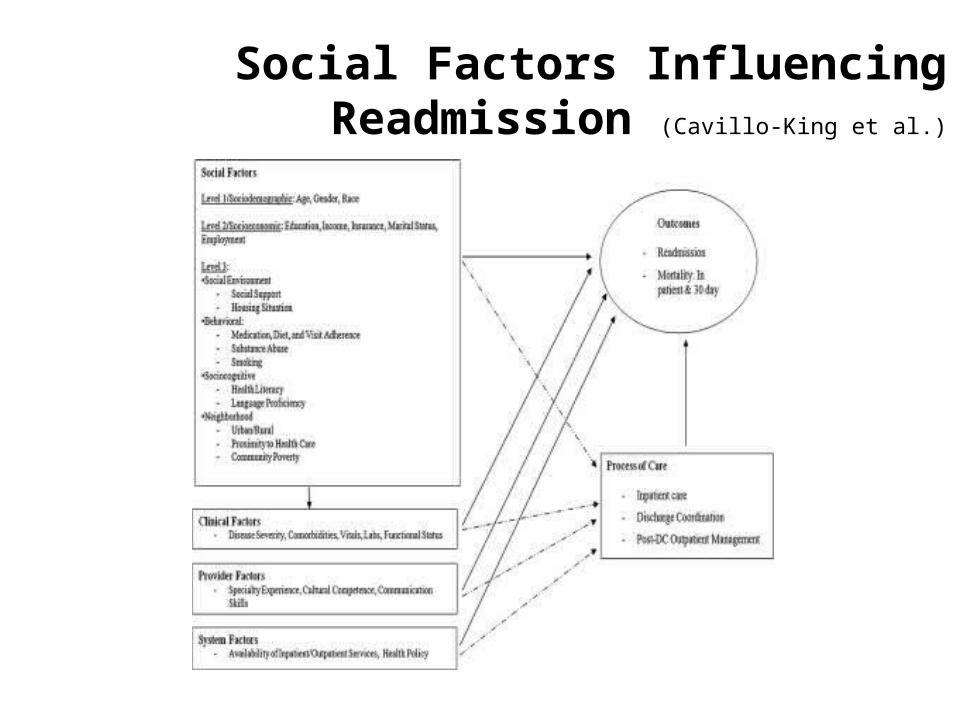
Social Factors Influencing Readmission (Cavillo-King et al.)

Considering Cause & Effect
• Readmission rate as a quality metric & basis for financial penalties assumes that:– Readmissions are a result of poor quality, clinical care after
adjustment for comorbidities and disease severity
• Socioeconomic factors at the patient and community levels are shown to be related to the probability of readmission– Individual level: Poverty, illiteracy, English proficiency, social support– Community level: poverty, housing vacancy, educational attainment
rates
• DebateShould we reformulate risk adjustment models and penalties?

Selected References
• Calvillo-King, L et al. “Impact of Social Factors on Risk of Readmission or Mortality in Pneumonia and Heart Failure: Systematic Review,” J Gen Intern Med, 28(2):269-82, 2013.
• Feltner, C et al. Transitional Care Interventions to Prevent Readmission for People with Heart Failure, Comparative Effectiveness Review #133, AHRQ Publication No. 14-EHC021-EF, Rockville, MD, May, 2014.
• Hu, J. “Socioeconomic Status and Readmissions: Evidence form an Urban Teaching Hospital,” Health Affairs, 33(5):778-785, 2014.
• McAlister, FA. “Decreasing Readmissions: It Can Be Done But One Size Does Not Fit All,” Qual Saf, 22:975-976, 2013.
• Nagasako, EM et al. “Adding Socioeconomic Data to Hospital Readmissions Calculations may Produce More Useful Results,” Health Affairs, 33(5):786-791, 2014.
• Joynt KE, Jha AK. A path forward on Medicare readmissions. NEJM 2013;368:1175-1177.
• Leppin A, et al. Preventing 30-day hospital readmissions: a systematic review and meta-analysis. JAMA Int Med May 2014 (E pub)

Care Navigator Pilot Study at Baylor Scott & White Health

Context• Evidence to support the clinical benefits of medical
homes
• Less clarity surrounding the financial impacts of these programs, particularly in underserved populations
• Current health care market (shifts in reimbursements, budget pressures, scarce resources) precipitated a need to examine the impact of the BSWH subsidized community clinics
• $50K of grant support awarded by the Irving Healthcare Foundation to formally investigate this question using a robust methodology

Baylor Irving HospitalInpt/Obs/ER Encounter
Pt. referral to Clinic Staff
Clinic Staff enrolls eligible pts. Baseline data collected:
• Demographics• Comorbidities• Home status
• Other variables
BCC Irving Medical Home “Connected”
(Pts. establish follow-up in clinic)
1:3 Randomization
Usual Care + Care Navigation Intervention
Usual Care
“Unconnected”(Pts. do not make follow-up visit)
Outcomes Tracking
Outcomes Tracking
Comparative Analyses
BCC Irving Impact EvaluationStudy Design

Care Navigator Intervention-90 Days

14
Enrollment/Tracking Data418 Eligible Patients Referred to BCC Irving Clinic December 2012-December 2013
341 Patients Established Clinic Follow-up with Data Available for Analysis
77 Patients “Unconnected”
86 Patients: Care Navigator Intervention
255 Patients: Usual Care
Randomization
341 Patients (100%): 90 Days332 Patients (97%): 180 Days
208 Patients (61%): 365 Days
Follow-up PeriodFollow-up Period
77 Patients (100%): 90 Days72 Patients (94%): 180 Days
40 Patients (52%): 365 Days

15
Study Population- CN Intervention vs. Control Group
Table 2. Demographics Summary - BCCCN vs. Usual Care
Enrollment Group
Outcome Category A: BCCCN B: Usual Care P-value
Number 86 ( 100) 255 ( 100) .
Age, mean (SD) 45.0(11.3) 44.7(12.0) 0.50
Age (category) 18-39 26 ( 30.2) 86 ( 33.7) 0.83
40-49 28 ( 32.6) 75 ( 29.4)
50-59 26 ( 30.2) 71 ( 27.8)
60+ 6 ( 7.0) 23 ( 9.0)
Sex Female 50 ( 58.1) 142 ( 55.7) 0.69
Male 36 ( 41.9) 113 ( 44.3)
Ethnicity Hispanic 44 ( 51.2) 112 ( 43.9) 0.38
Non-Hispanic 42 ( 48.8) 141 ( 55.3)
Unknown 0 2 ( 0.8)
Race Caucasian 71 ( 82.6) 208 ( 81.6) 0.20
African-American 10 ( 11.6) 41 ( 16.1)
Other 5 ( 5.8) 6 ( 2.4)
Home Status Lives alone 4 ( 4.7) 18 ( 7.1) 0.43
Lives w/family 76 ( 88.4) 214 ( 83.9)
Lives w/others 6 ( 7.0) 17 ( 6.7)
Unknown 0 6 ( 2.4)
Marital Status Married 29 ( 33.7) 110 ( 43.1) 0.16
Single 48 ( 55.8) 130 ( 51.0)
Unknown 9 ( 10.5) 15 ( 5.9)
Substance Abuse
Yes 9 ( 10.5) 35 ( 13.7) 0.66
No 71 ( 82.6) 199 ( 78.0)
Unknown 6 ( 7.0) 21 ( 8.2)
Substance Alcohol 5 ( 55.6) 14 ( 41.2) 0.70
Other 2 ( 22.2) 8 ( 23.5)
Tobacco 2 ( 22.2) 12 ( 35.3)
* Comorbidities also similar between groups

16
Preliminary Results I: Care Navigator vs. Usual Care
• P<0.05 considered as statistically significant
• Number of CN interventions needed to prevent 1 hospital admission (1/.075)= 13
Hospital Admissions Comparison for Patients with Established Clinic Follow-up (Random Assignment to Care Navigator vs. Usual Care)
Randomization Group Changes
Time (Days) After Index Encounter A: Care Navigator B: Usual Care P-value Absolute Diff. % Change
30 2.3 ( 2 / 86) 5.9 ( 15 / 255) 0.190 -3.6 -60.5 60 3.5 ( 3 / 86) 9.0 ( 23 / 255) 0.095 -5.5 -61.3 90 4.7 ( 4 / 86) 12.2 ( 31 / 255) 0.047 -7.5 -61.7
*Care Navigator Intervention was 90-days in duration 180 15.7 ( 13 / 83) 15.7 ( 39 / 249) 1.000 0 0 365 17.3 ( 9 / 52) 22.4 ( 35 / 156) 0.433 -5.1 -22.9
Masica et al. BSWH internal data

Preliminary Results II: Incremental Benefit of Support
Unconnected Connected Connected + CN
28.9 13.5 4.7
Hospital Admission Rate at 90-days after Index Encounter per 100 patients
Hospital Admission Rate at 365-days after Index Encounter per 100 patients
Unconnected Connected Connected + CN
76.1 50.5 54.1*
*Care Navigator Intervention was 90-days in duration
Masica et al. BSWH internal data

18
• For patients establishing clinic follow-up, the Care Navigation intervention reduced hospital utilization rates at 90-days compared to usual care (matching the duration of the intervention)
• Hospital admission utilization converged between groups during the extended follow-up period without the Care Navigation intervention
• This intervention was successful in a high-risk population
Discussion Points

19
Next Steps at BSWH
• Collect remaining follow-up data through 12/14
• Cross-check readmissions with DFW Hospital Council database and assess subgroups
• Statistical adjustments
• Cost-effectiveness analyses
• Share the story with the outside world-National meetings, journal publication
• Consider operational use of care navigators at the community clinic sites

Open Forum

We have reached our Gooooaaal!30 Day All Cause Readmissions
20.6%Reduction
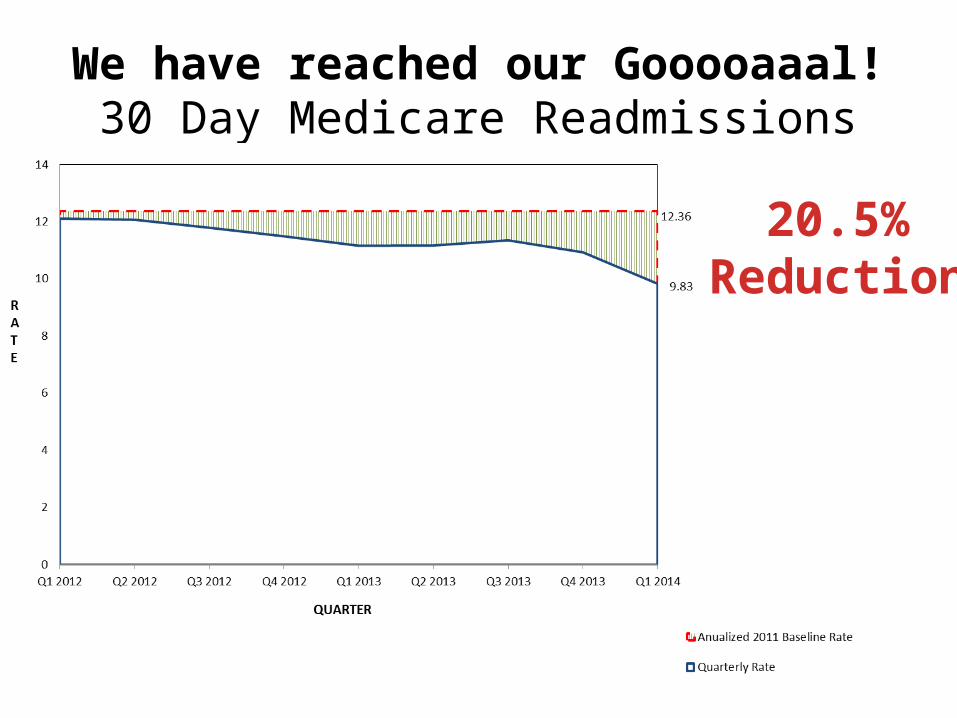
We have reached our Gooooaaal!30 Day Medicare Readmissions
20.5%Reduction
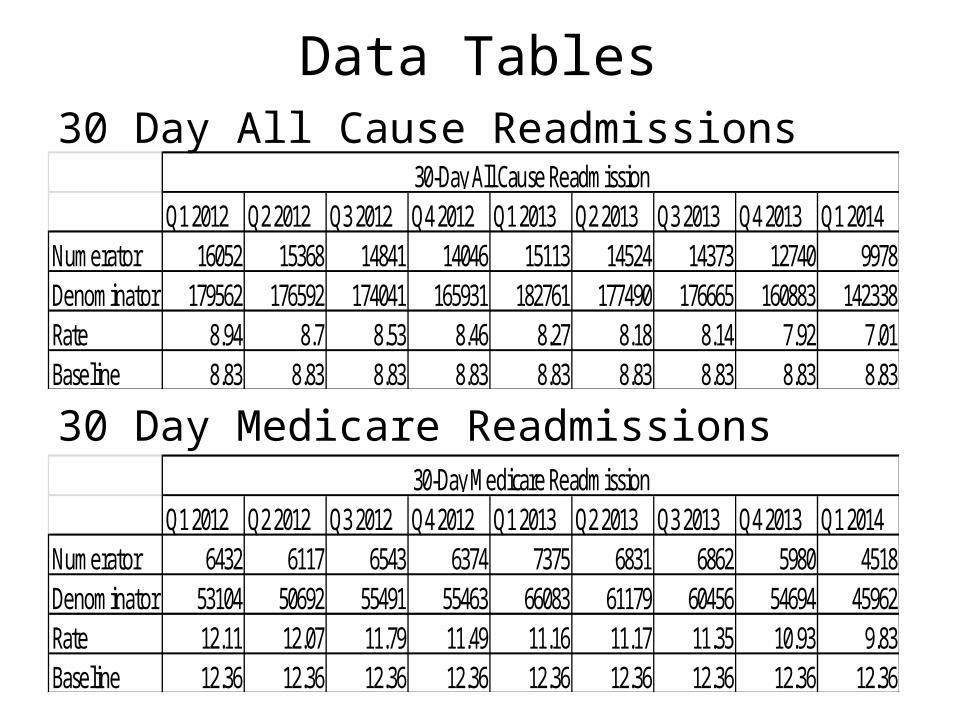
Data Tables30 Day All Cause Readmissions
30 Day Medicare Readmissions
Q1 2012 Q2 2012 Q3 2012 Q4 2012 Q1 2013 Q2 2013 Q3 2013 Q4 2013 Q1 2014Numerator 16052 15368 14841 14046 15113 14524 14373 12740 9978Denominator 179562 176592 174041 165931 182761 177490 176665 160883 142338Rate 8.94 8.7 8.53 8.46 8.27 8.18 8.14 7.92 7.01Baseline 8.83 8.83 8.83 8.83 8.83 8.83 8.83 8.83 8.83
30-Day All Cause Readmission
Q1 2012 Q2 2012 Q3 2012 Q4 2012 Q1 2013 Q2 2013 Q3 2013 Q4 2013 Q1 2014Numerator 6432 6117 6543 6374 7375 6831 6862 5980 4518Denominator 53104 50692 55491 55463 66083 61179 60456 54694 45962Rate 12.11 12.07 11.79 11.49 11.16 11.17 11.35 10.93 9.83Baseline 12.36 12.36 12.36 12.36 12.36 12.36 12.36 12.36 12.36
30-Day Medicare Readmission

Reminders
July 11: Falls & Immobility Affinity Call
July 18: Leadership-Followership Webinar
August 13:CLABSI Affinity Call
Additional information available on the website at: http://www.henlearner.org/about/calendar/
Top Related