


Languages
Pages
Legal

REVIEW
Considerations for accurate gene expression measurementby reverse transcription quantitative PCR when analysingclinical samples
Rebecca Sanders & Deborah J. Mason & Carole A. Foy &
Jim F. Huggett
Received: 28 February 2014 /Revised: 17 April 2014 /Accepted: 24 April 2014# The Author(s) 2014. This article is published with open access at Springerlink.com
Abstract Reverse transcription quantitative PCR is anestablished, simple and effective method for RNA mea-surement. However, technical standardisation challengescombined with frequent insufficient experimental detailrender replication of many published findings challeng-ing. Consequently, without adequate consideration of ex-perimental standardisation, such findings may be suffi-cient for a given publication but cannot be translated towider clinical application. This article builds on earlierstandardisation work and the MIQE guidelines, discussingprocesses that need consideration for accurate, reproduc-ible analysis when dealing with patient samples. By ap-plying considerations common to the science of measure-ment (metrology), one can maximise the impact of geneexpression studies, increasing the likelihood of their trans-lation to clinical tools.
Keywords RNA . Uncertainty . Normalisation . Reversetranscription quantitative PCR . Standardisation
Introduction
The real-time quantitative polymerase chain reaction (qPCR)[1], developed from the revolutionary method of polymerasechain reaction (PCR) pioneered by Kary Mullis in the 1980s[2–4], has emerged as a widely used method for biologicalinvestigation because it can detect and precisely quantify verysmall amounts of specific nucleic acid sequences. This iscoupled to an inherent simplicity that makes qPCR assaysstraightforward to design and perform. The characterisationof gene expression patterns through quantification of messen-ger RNA (mRNA), by coupling reverse transcription withPCR, as a surrogate of cell metabolism is a major applicationof this technology. Reverse transcription qPCR (RT-qPCR)makes possible rapid and precise assessment of changes ingene expression as a result of physiology, pathophysiology ordevelopment [5]. However, for RNA analyses to be clinicallyinformative, reliable measurements that are reproducible be-tween laboratories are essential. As much as 30 % of the costsof medical care budgets are in measurements and tests relatedto diagnosis [6]. This necessitates sustained efforts to improvethe reliability of such measurements and tests, which play akey role in the continual development of effective health caresystems.
In research studies, RT-qPCR has been used to measurebacterial gene expression [7, 8] or RNAviral loads [9–12], toevaluate cancer status or to track disease progression andresponse to treatment [13–15]. As a consequence, this methodis being applied to the discovery and development of putativebiomarkers. An example of successful translation of an RT-qPCR method to the patient is the Oncotype Dx assay, whichpredicts the potential benefits of chemotherapy and the likeli-hood of cancer recurrence [16–19] and thus can be used tostratify patients to different treatment regimens [20].Furthermore, viral load monitoring using RT-qPCR is nowroutine for a number of RNA viruses [21].
Published in the topical collectionNucleic Acid Quantificationwith guesteditors Hendrik Emons and Philippe Corbisier.
C. A. Foy : J. F. HuggettMolecular & Cell Biology, LGC, Queens Road,Teddington TW11 0LY, UK
R. Sanders :D. J. MasonSchool of Biosciences, Cardiff University, Sir Martin EvansBuilding, Museum Avenue, Cardiff CF10 3AX, UK
Present Address:R. Sanders (*)Molecular & Cell Biology, LGC, Queens Road,Teddington TW11 0LY, UKe-mail: [email protected]
Anal Bioanal ChemDOI 10.1007/s00216-014-7857-x
RT-qPCR is used extensively in clinical research investi-gating putative biomarkers for disease diagnosis as well as forpredictive and prognostic monitoring. However, on review ofthe literature, articles published reporting RT-qPCR data fre-quently do not report all experimental details relating to RT-qPCR experiments. Fundamental experimental details are of-ten omitted when reporting gene expression measurements,including information pertaining to RNA quality, the rationalefor the choice of the normalisation strategy, the location of theamplicon or detailed descriptions of the reverse transcriptaseand PCR assay conditions [22, 23].
To facilitate good repeatability (measurements made by thesame operator or instrument, and under the same conditionsover a short period of time) and reproducibility (measure-ments made by different operators or instruments, and/orunder different conditions) [24], key aspects of RT-qPCRexperimental processes need to be reported, as outlined inthe MIQE (from ‘minimum information for publication ofquantitative real-time PCR experiments’) guidelines, whichpropose a minimum standard for the provision of informationfor publications reporting qPCR experiments [25]. These cov-er key aspects including sample acquisition, assay design andvalidation as well as details about data analysis, enabling otherscientists to easily assess and, if necessary, repeat the experi-ment [25, 26]. This is fundamental if findings are to becorroborated, which is in turn crucial for the observation tobe translated into a clinically useful tool.
RNA measurement on a complex biological sample (suchas a tissue biopsy sample) requires a series of steps, each ofwhich contributes error that is often severalfold greater thanthe difference in the mRNA to be measured. Consequently,determining differences in gene expression in real scenariosrequires consideration of the sources of error and appropriatenormalisation mechanisms to control for them.
Yet measurement claims of biologically significant geneexpression differences are routinely made without apparentconsideration (or reporting) of such technical factors [27].Consequently, although often statistically significant, theseresults may not be due to the biological phenomenon underinvestigation and/or may not be reproducible. Without assess-ment and consideration of the technical variability introducedat each stage of the experimental process, findings may be oflimited practical use in the clinic because they are difficult toreproduce.
From sample to final result: a series of steps
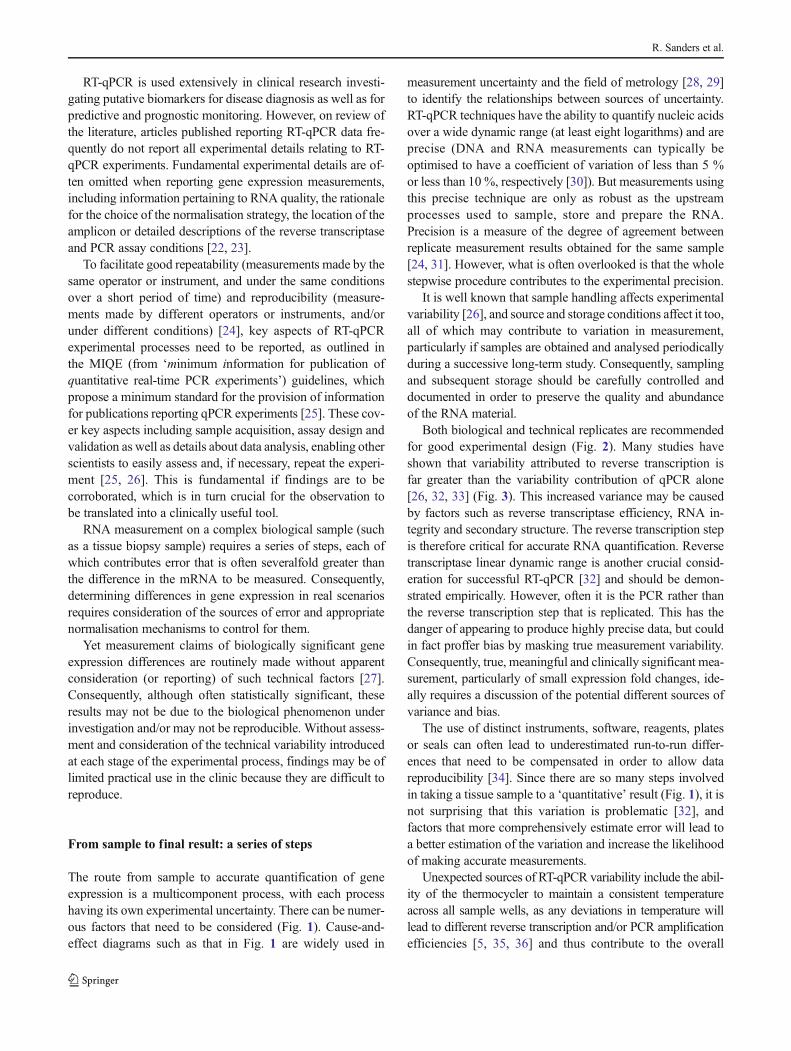
The route from sample to accurate quantification of geneexpression is a multicomponent process, with each processhaving its own experimental uncertainty. There can be numer-ous factors that need to be considered (Fig. 1). Cause-and-effect diagrams such as that in Fig. 1 are widely used in
measurement uncertainty and the field of metrology [28, 29]to identify the relationships between sources of uncertainty.RT-qPCR techniques have the ability to quantify nucleic acidsover a wide dynamic range (at least eight logarithms) and areprecise (DNA and RNA measurements can typically beoptimised to have a coefficient of variation of less than 5 %or less than 10 %, respectively [30]). But measurements usingthis precise technique are only as robust as the upstreamprocesses used to sample, store and prepare the RNA.Precision is a measure of the degree of agreement betweenreplicate measurement results obtained for the same sample[24, 31]. However, what is often overlooked is that the wholestepwise procedure contributes to the experimental precision.
It is well known that sample handling affects experimentalvariability [26], and source and storage conditions affect it too,all of which may contribute to variation in measurement,particularly if samples are obtained and analysed periodicallyduring a successive long-term study. Consequently, samplingand subsequent storage should be carefully controlled anddocumented in order to preserve the quality and abundanceof the RNA material.
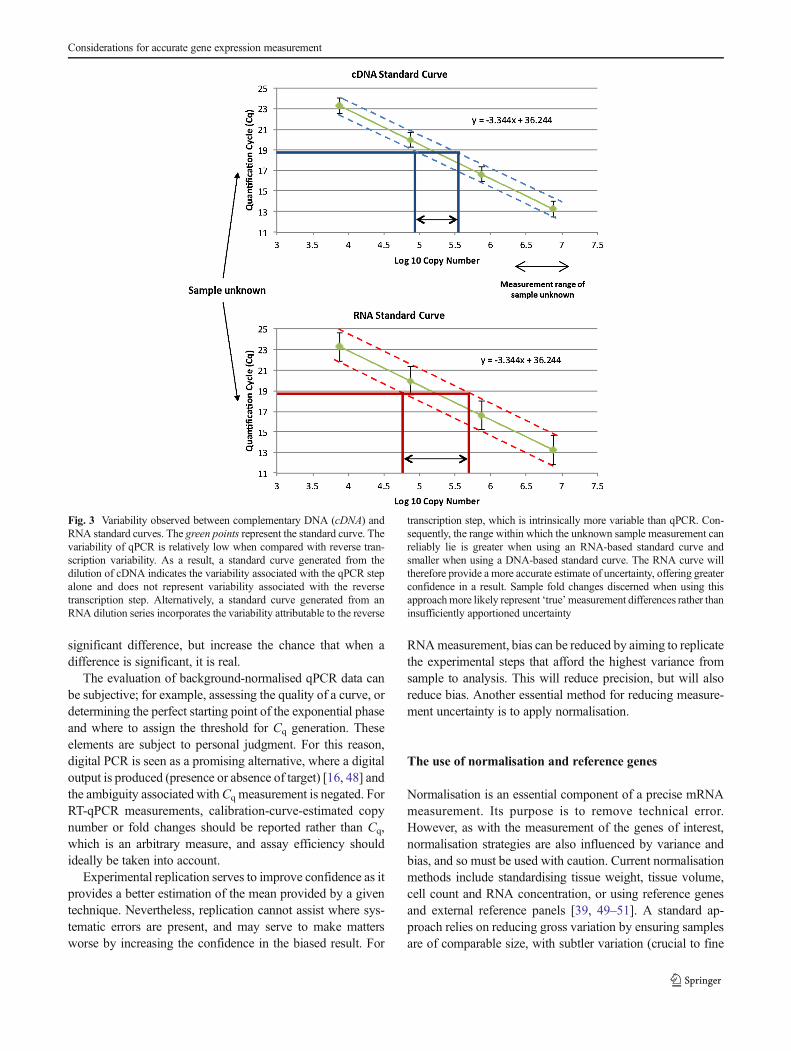
Both biological and technical replicates are recommendedfor good experimental design (Fig. 2). Many studies haveshown that variability attributed to reverse transcription isfar greater than the variability contribution of qPCR alone[26, 32, 33] (Fig. 3). This increased variance may be causedby factors such as reverse transcriptase efficiency, RNA in-tegrity and secondary structure. The reverse transcription stepis therefore critical for accurate RNA quantification. Reversetranscriptase linear dynamic range is another crucial consid-eration for successful RT-qPCR [32] and should be demon-strated empirically. However, often it is the PCR rather thanthe reverse transcription step that is replicated. This has thedanger of appearing to produce highly precise data, but couldin fact proffer bias by masking true measurement variability.Consequently, true, meaningful and clinically significant mea-surement, particularly of small expression fold changes, ide-ally requires a discussion of the potential different sources ofvariance and bias.
The use of distinct instruments, software, reagents, platesor seals can often lead to underestimated run-to-run differ-ences that need to be compensated in order to allow datareproducibility [34]. Since there are so many steps involvedin taking a tissue sample to a ‘quantitative’ result (Fig. 1), it isnot surprising that this variation is problematic [32], andfactors that more comprehensively estimate error will lead toa better estimation of the variation and increase the likelihoodof making accurate measurements.
Unexpected sources of RT-qPCR variability include the abil-ity of the thermocycler to maintain a consistent temperatureacross all sample wells, as any deviations in temperature willlead to different reverse transcription and/or PCR amplificationefficiencies [5, 35, 36] and thus contribute to the overall
R. Sanders et al.
variability in measurement. This extends to differences betweendifferent thermocycler platforms, with differences observed intiming and heat transfer capabilities [36]. Expectation of lot-to-lot consistency may be a reason for selecting commerciallyavailable kits rather than preparing mixes in-house. In addition,maintenance of primer/probe stability is often assumed be-tween different syntheses or suppliers. However, although themultitude of commercial kits and protocols available offerundeniable benefits, reagent preparations from distinct batcheshave been shown to contribute significant experimental vari-ability, with up to sevenfold differences in calculated mRNAquantities observed [32, 37].
For some commercially supplied primers and probes, thelocation of the amplicon selected for gene expression is omit-ted, a fact that makes it difficult to adhere to the MIQEguidelines. The problem with not providing this informationmeans the researcher does not know which part of a giventranscript is being detected. This information is fundamentalfor any hope of reproducibility due to transcript differences,including alternative splicing, polyadenylation and alternativepromoters. An amendment to the MIQE guidelines [38] of-fered a compromise to commercial vendors who do not
disclose this information by alternatively requiring a contextsequence to enable the researcher to locate which portion of agiven sequencewas being detected [25, 26, 38].Where neitherprimer information nor a context sequence is provided, re-searchers using such commercial assays are strongly advisedto sequence the PCR products to obtain the location of thetranscript being measured.
The issues described above highlight the importance ofincluding appropriate controls, designed to enable researchersto identify and account for these differences, andharmonisation of experimental design [39, 40]. There are anumber resources that support experimental design as basicguides [41] and as extensive repositories of information [42],as well comprehensive software tools, including GenEx [43],Qbase [44] and RealTime StatMiner [45].
Accuracy and measurement uncertainty
Accuracy is essentially how close the measurement is to thetruth and is influenced by both precision and bias [24]. Thechallenge when measuring patient samples is that the truth is
Fig. 1 Cause and effect: uncertainty contributions for gene expressionanalysis. The central arrow represents the experimental process fromRNA to the quantification method. Branches feeding into experimentalprogression characterise sources of variability that contribute to uncer-tainty at various stages of the process. There are numerous methods
available for the final quantification step. conc concentration, HPLChigh-performance liquid chromatography, ICP-OES inductively coupledplasma optical emission spectroscopy, NGS next-generation sequencing,qPCR quantitative PCR, RT reverse transcription
Considerations for accurate gene expression measurement
often a moving target that can vary from patient to patient andwithin a patient, over time. The added danger with RT-qPCRis that its high precision can lead to considerable bias. This canproduce results that are difficult to reproduce, either simply asa result of repeated measurements providing different estima-tions of the truth or, potentially worse, results that are repro-ducible but still biased and therefore all incorrect; this situa-tion is problematic because agreement between laboratoriesleads to further confidence that the wrong result is correct.
To further understand measurement accuracy, consider-ations of uncertainty should be applied to indicate scientificconfidence. Uncertainty has two components: systematic andrandom variation. Systematic errors lead to bias in the mea-surement. These error components are fixed and predictableand may be inherent to various instruments and methods.Random variation occurs when making repeated measure-ments (related to precision; a measure of the degree of agree-ment between replicate measurement results obtained for thesame sample). Contributing factors are multitude and includeissues of sampling, different analysts and each stage of thestepwise protocol necessary for a measurement [31].
The concept of accuracy includes the effect of both preci-sion and bias and describes how close a single result is to thetrue value. Although it cannot be given a numerical value,measurement results are said to be ‘more accurate’ whenmeasurement errors are reduced. Results with a small bias
that are also very precise are considered highly accurate; thatis, the average result is close to the true value and the dataspread (standard deviation) is small. Equally, methods gener-ating data with a large bias (large difference between the truevalue and the average value of the results), or imprecision(large variance), or both, would be considered inaccurate.
RT-qPCR is typically performed either by estimating copynumber using a calibration curve or by simply assessing thefold changewithout considering the absolute abundance of therespective RNAs; the latter is termed the ΔCq (or ΔCt)method [46, 47]. Considerations aroundwhat is accurate differbetween the two methods. The former has the added challengeof how appropriate and transmutable the choice of calibratoris. A calibration curve provides an estimation of the magni-tude and dynamic range of a given measurement, but canreduce or increase bias of the estimated copy number (depend-ing on the initial value assignment).
A calibration curve also provides an estimation of the PCRefficiency, which is an important source of bias when estimat-ing both copy number and fold change. Consequently, al-though the ΔCq method ignores magnitude, PCR efficiencyshould ideally be estimated [47] to avoid biases. Where PCRefficiency is not routinely estimated, which is commonest fortheΔCq method [46], biases could be avoided by factoring inadditional uncertainty to account for the unknown PCR effi-ciency. This would reduce the chance of measuring a
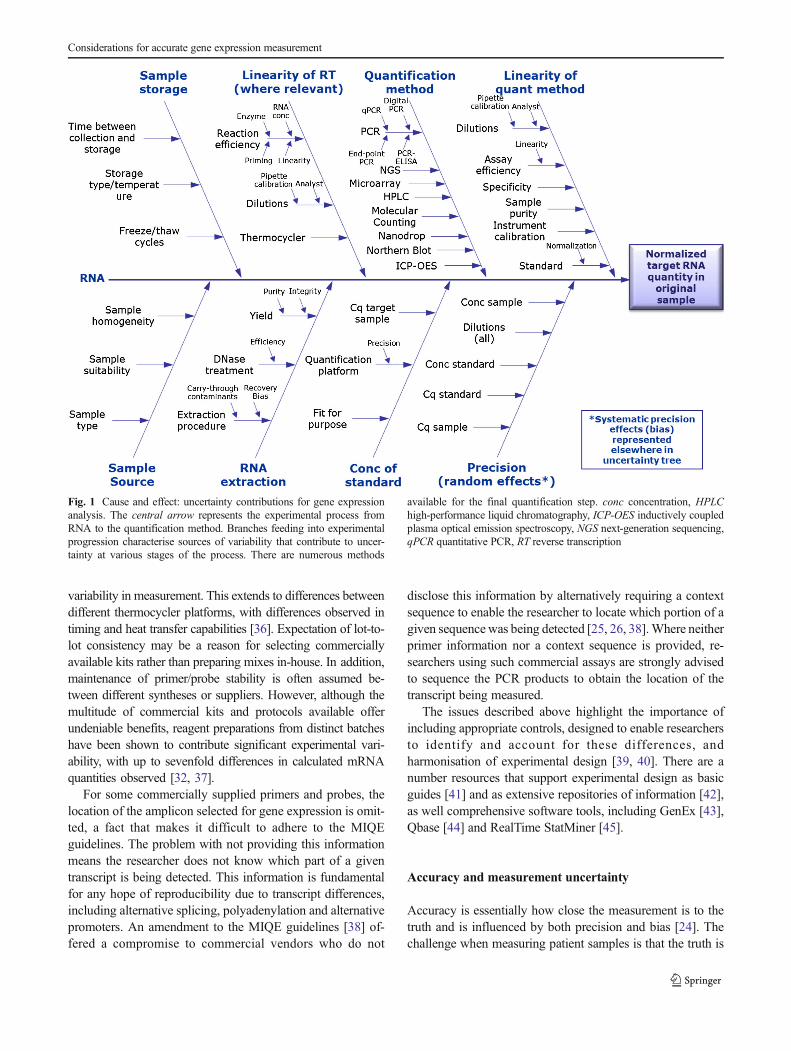
Fig. 2 Different experimentaldesigns representing biologicalversus technical replication.Generally, data variabilityincreases as replication isincluded from higher stageswithin the experimental process.For example, to ascertain truepatient variability, replicatebiological samples must beanalysed (different samples fromone patient, samples fromdifferent tissues from the samepatient, or samples from differentpatients). The RNA extractionand reverse transcriptioncomponents of the process maycontribute more variability to thefinal measurement thanquantitative PCR (qPCR) alone.Definition of all sources oftechnical variability allows theactual biological variability to bediscerned, and as such, moreconfidence can be conferred to theresults when this variability isincluded. cDNA complementaryDNA, RT reverse transcription
R. Sanders et al.
significant difference, but increase the chance that when adifference is significant, it is real.
The evaluation of background-normalised qPCR data canbe subjective; for example, assessing the quality of a curve, ordetermining the perfect starting point of the exponential phaseand where to assign the threshold for Cq generation. Theseelements are subject to personal judgment. For this reason,digital PCR is seen as a promising alternative, where a digitaloutput is produced (presence or absence of target) [16, 48] andthe ambiguity associated withCq measurement is negated. ForRT-qPCR measurements, calibration-curve-estimated copynumber or fold changes should be reported rather than Cq,which is an arbitrary measure, and assay efficiency shouldideally be taken into account.
Experimental replication serves to improve confidence as itprovides a better estimation of the mean provided by a giventechnique. Nevertheless, replication cannot assist where sys-tematic errors are present, and may serve to make mattersworse by increasing the confidence in the biased result. For
RNAmeasurement, bias can be reduced by aiming to replicatethe experimental steps that afford the highest variance fromsample to analysis. This will reduce precision, but will alsoreduce bias. Another essential method for reducing measure-ment uncertainty is to apply normalisation.
The use of normalisation and reference genes
Normalisation is an essential component of a precise mRNAmeasurement. Its purpose is to remove technical error.However, as with the measurement of the genes of interest,normalisation strategies are also influenced by variance andbias, and so must be used with caution. Current normalisationmethods include standardising tissue weight, tissue volume,cell count and RNA concentration, or using reference genesand external reference panels [39, 49–51]. A standard ap-proach relies on reducing gross variation by ensuring samplesare of comparable size, with subtler variation (crucial to fine
Fig. 3 Variability observed between complementary DNA (cDNA) andRNA standard curves. The green points represent the standard curve. Thevariability of qPCR is relatively low when compared with reverse tran-scription variability. As a result, a standard curve generated from thedilution of cDNA indicates the variability associated with the qPCR stepalone and does not represent variability associated with the reversetranscription step. Alternatively, a standard curve generated from anRNA dilution series incorporates the variability attributable to the reverse
transcription step, which is intrinsically more variable than qPCR. Con-sequently, the range within which the unknown sample measurement canreliably lie is greater when using an RNA-based standard curve andsmaller when using a DNA-based standard curve. The RNA curve willtherefore provide a more accurate estimate of uncertainty, offering greaterconfidence in a result. Sample fold changes discerned when using thisapproachmore likely represent ‘true’measurement differences rather thaninsufficiently apportioned uncertainty
Considerations for accurate gene expression measurement
measurements) being further removed using (preferably mul-tiple) internal reference genes, and/or synthetic internal posi-tive controls.
Challenges associated with representative sampling of clin-ical samples are discussed in detail in the following sections,but ensuring samples are comparable can be a further chal-lenge. Under controlled conditions of reproducibly extracted,good-quality RNA, initial gene transcript number is ideallystandardised to cell number, but accurate enumeration of cellsis often precluded when starting with solid tissue [49].Another frequently applied normalisation scalar is RNA con-centration. Following RNA extraction, the quantity and qual-ity of extracts may be measured [26, 39, 52].
Normalisation to RNA quantity
There are a number of methods for RNA quantification.Fluorescent nucleic acid binding dyes, such as RiboGreen(Life Technologies), exploit the increase in fluorescence seenon association with RNA. The reagent literature states thatRiboGreen does not detect significant sample contaminationby free nucleotides and thus more accurately measures theamount of intact RNA in potentially degraded samples thanA260. Measuring the absorbance at 260 nm using spectropho-tometry is a common and simple method for RNA quantifi-cation. Studies have shown both A260 and RiboGreen analysismethods generate comparable results when the RNA concen-tration exceeds a minimum of 100 ng/μL. Although A260
analysis becomes less reliable at lower RNA concentrations[32], it should be remembered that methods that use fluores-cent dyes typically require a calibration curve and that thecalibrator used for this must also be assigned a value (usuallyby A260 measurement). As with any measurement, these ap-proaches have their own inaccuracies when used for estimat-ing nucleic acid concentration [32, 53–57].
When using RNA concentration for normalisation, RNAquality is also an important consideration. Methods for esti-mating RNA quality based primarily on the detection ofribosomal RNAs (rRNAs) are very popular. Agarose gels or‘lab-on-a-chip’-based capillary electrophoresis platforms al-low RNA sample quality assessment, with the latter alsooffering an estimation of quantity [32]. Ribosomal RNA(rRNA) ratios, with additional electrophoretic trace features,are used to calculate total RNA integrity (e.g. RNA integritynumber and RNA quality indicator). However, it should benoted that rRNAs yielding similar RNA integrity numbers/RNA quality indicators generated by these instruments cancontain mRNAs that differ significantly in their integrity [58],so good-quality rRNA is not necessarily indicative of good-quality mRNA. In some instances it is impossible to quantifythis parameter; for example, when minimal RNA is availablefrom microdissected tissues [49]. A further drawback to the
use of 18S or 28S rRNA molecules as standards is theirabsence in purified mRNA samples.
Normalisation to reference genes
RT-qPCR analysis of mRNA should also be normalisedusing internal reference genes. Their suitability must bevalidated experimentally for particular tissues or cell typeson an experimental-specific basis [59]. Ideally, normalisa-tion should be performed against validated multiple refer-ence genes. Further support for reference gene selectionmay be found using algorithms such as geNorm [49],NormFinder [60] or BestKeeper [61]. In general, usingfewer than three reference genes is not advisable [25, 49,62–64]. Single reference genes may be used if the mea-surement of small differences is not necessary, but thetarget chosen must be validated across the range of ex-perimental conditions under investigation [65]. Crucially,any difference that is measured would need to be suffi-ciently greater than the inherent variation of the singlereference gene measurements (incorporating all the stepsfrom sampling to measurement) used to normalise thedata, to be sure the observation is due to the gene ofinterest and not due to the reference gene or a combina-tion of both.
It is increasingly evident that a number of classically des-ignated reference genes demonstrate inconsistent expressionbetween different tissues and treatment regimens [25, 49, 50,59, 64, 66, 67]. For example, despite continuing reports formore than a decade that emphasise the problems associatedwith its use, glyceraldehyde 3-phosphate dehydrogenase con-tinues to be used as a normaliser [32, 68, 69]. It is welldocumented that glyceraldehyde 3-phosphate dehydrogenasemRNA levels are not always constant [63, 67, 70], and itcontributes to diverse cellular functions, such as nuclearRNA export, DNA replication, DNA repair, exocytotic mem-brane fusion, cytoskeletal organisation and phosphotransfer-ase activity [71]. Although contemporary publications still failto use appropriate reference gene(s), since the publication ofthe MIQE guidelines there has been an escalation in thenumber of publications directly evaluating reference genevalidation [66, 72–74].
A recently described alternative normalisation techniquetargets expressed repetitive elements (expressed Alu repeats)[58] that are abundant in the human genome (approximatelyone million copies). This strategy uses Alu repeat sequencesembedded in the untranslated regions of mRNAs, to estimatethe global mRNA quantity. As a result, it has the potential tobe used as a ‘universal’ internal target; that is, it is suitable touse for normalisation in all human RT-qPCR experiments.However, further work is needed to assess the validity of thisproposed method.
R. Sanders et al.
Other sources of bias: extraction and inhibition
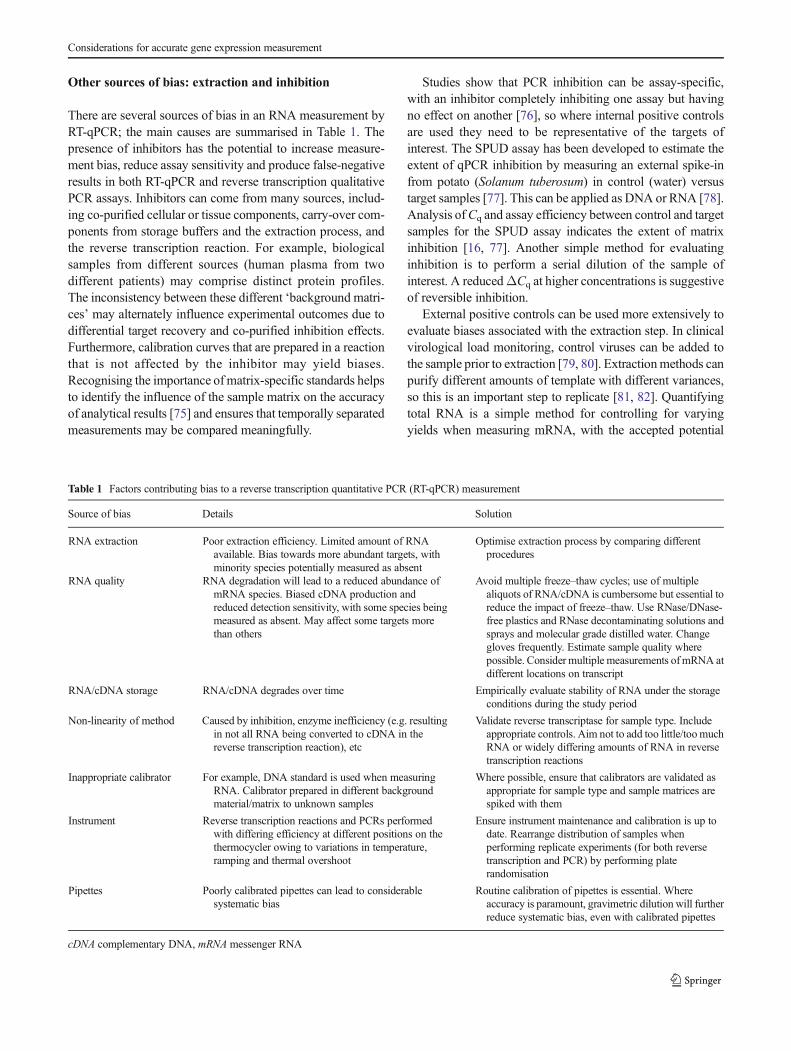
There are several sources of bias in an RNA measurement byRT-qPCR; the main causes are summarised in Table 1. Thepresence of inhibitors has the potential to increase measure-ment bias, reduce assay sensitivity and produce false-negativeresults in both RT-qPCR and reverse transcription qualitativePCR assays. Inhibitors can come from many sources, includ-ing co-purified cellular or tissue components, carry-over com-ponents from storage buffers and the extraction process, andthe reverse transcription reaction. For example, biologicalsamples from different sources (human plasma from twodifferent patients) may comprise distinct protein profiles.The inconsistency between these different ‘background matri-ces’ may alternately influence experimental outcomes due todifferential target recovery and co-purified inhibition effects.Furthermore, calibration curves that are prepared in a reactionthat is not affected by the inhibitor may yield biases.Recognising the importance ofmatrix-specific standards helpsto identify the influence of the sample matrix on the accuracyof analytical results [75] and ensures that temporally separatedmeasurements may be compared meaningfully.
Studies show that PCR inhibition can be assay-specific,with an inhibitor completely inhibiting one assay but havingno effect on another [76], so where internal positive controlsare used they need to be representative of the targets ofinterest. The SPUD assay has been developed to estimate theextent of qPCR inhibition by measuring an external spike-infrom potato (Solanum tuberosum) in control (water) versustarget samples [77]. This can be applied as DNA or RNA [78].Analysis ofCq and assay efficiency between control and targetsamples for the SPUD assay indicates the extent of matrixinhibition [16, 77]. Another simple method for evaluatinginhibition is to perform a serial dilution of the sample ofinterest. A reducedΔCq at higher concentrations is suggestiveof reversible inhibition.
External positive controls can be used more extensively toevaluate biases associated with the extraction step. In clinicalvirological load monitoring, control viruses can be added tothe sample prior to extraction [79, 80]. Extractionmethods canpurify different amounts of template with different variances,so this is an important step to replicate [81, 82]. Quantifyingtotal RNA is a simple method for controlling for varyingyields when measuring mRNA, with the accepted potential
Table 1 Factors contributing bias to a reverse transcription quantitative PCR (RT-qPCR) measurement
Source of bias Details Solution
RNA extraction Poor extraction efficiency. Limited amount of RNAavailable. Bias towards more abundant targets, withminority species potentially measured as absent
Optimise extraction process by comparing differentprocedures
RNA quality RNA degradation will lead to a reduced abundance ofmRNA species. Biased cDNA production andreduced detection sensitivity, with some species beingmeasured as absent. May affect some targets morethan others
Avoid multiple freeze–thaw cycles; use of multiplealiquots of RNA/cDNA is cumbersome but essential toreduce the impact of freeze–thaw. Use RNase/DNase-free plastics and RNase decontaminating solutions andsprays and molecular grade distilled water. Changegloves frequently. Estimate sample quality wherepossible. Consider multiple measurements ofmRNA atdifferent locations on transcript
RNA/cDNA storage RNA/cDNA degrades over time Empirically evaluate stability of RNA under the storageconditions during the study period
Non-linearity of method Caused by inhibition, enzyme inefficiency (e.g. resultingin not all RNA being converted to cDNA in thereverse transcription reaction), etc
Validate reverse transcriptase for sample type. Includeappropriate controls. Aim not to add too little/toomuchRNA or widely differing amounts of RNA in reversetranscription reactions
Inappropriate calibrator For example, DNA standard is used when measuringRNA. Calibrator prepared in different backgroundmaterial/matrix to unknown samples
Where possible, ensure that calibrators are validated asappropriate for sample type and sample matrices arespiked with them
Instrument Reverse transcription reactions and PCRs performedwith differing efficiency at different positions on thethermocycler owing to variations in temperature,ramping and thermal overshoot
Ensure instrument maintenance and calibration is up todate. Rearrange distribution of samples whenperforming replicate experiments (for both reversetranscription and PCR) by performing platerandomisation
Pipettes Poorly calibrated pipettes can lead to considerablesystematic bias
Routine calibration of pipettes is essential. Whereaccuracy is paramount, gravimetric dilution will furtherreduce systematic bias, even with calibrated pipettes
cDNA complementary DNA, mRNA messenger RNA
Considerations for accurate gene expression measurement
problems discussed above. However, if further rigour is re-quired, then external RNA standards can be used. An exampleof such a resource is the External RNA Controls Consortiumpanel of synthetic RNA oligonucleotides, which has beendeveloped for this purpose [83].
Although external RNA standards added to biologicalsamples may provide an assessment of the variability withinthe proceeding experimental steps, they cannot account forany variability upstream (e.g. sampling or cell lysis). Also,purified RNAs may not always be compatible with a givenextraction method. Consequently, application of external stan-dards needs to be validated empirically, and a combinedapproach in conjunction with validated reference genes maybe most effectual.
Clinical measurement
RT-qPCR is an important tool that may assist in the under-standing of the molecular events underlying human diseases,but it also offers a method for measuring biomarkers for theidentification and stratification of a range of diseases [32, 84].Studies have reported applying RT-qPCR for the identificationof micrometastases or minimal residual disease in colorectalcancer [85], neuroblastoma [86], prostate cancer [87] andleukaemia [88]. It has been used to distinguish different typesof lymphoma [89], for the analysis of cellular immune re-sponses in the peripheral blood [90, 91], for the detection ofbacterial [92] and viral [93] RNA signatures in clinical sam-ples and for monitoring the response of human cancer totreatment [13]. Other clinically relevant applications includeits use for the analysis of tissue-specific gene expression [94],identifying cytokine gene expression on ex vivo stimulation ofperipheral blood mononuclear cells [95] and for cytokinemRNA profiling [96]. Novel gene expression approaches areconstantly being evaluated for diagnostic purposes for numer-ous human diseases.
These developments may ultimately lead to the implemen-tation of truly personalised medicine, whereby the course oftreatment chosen, the response and the prognosis may centreon molecular measurements. Yet what is ominous is thatdespite the vast amount of published clinical research usingRT-qPCR to measure putative mRNA biomarkers, few testshave as yet been transferred to the clinic for routine use.Where RNA measurements are routinely used, such as mon-itoring viral loads in disease states or response to a particulartreatment regime, the measurements made at the beginning ofthe study must be compatible with those made at the end; thatis, the measurement standards used to calibrate them musthave long-term stability [6]. These considerations applyequally to gene expression biomarkers and collectively con-tribute to measurable improvements in the quality of analyti-cal results.
In terms of clinical measurement, different capabilities maybe required depending on the measurement need. For exam-ple, viral load and specific gene signatures, such as the BCR–ABL fusion transcript, require differentiation between grosschanges of the target, whereas cellular gene expression issubtler and much more challenging to measure reproducibly.For example, when measuring HIV viral load, clinicians workon orders of magnitude (log10 scale), whereas research thatmeasures normalised gene expression by RT-qPCR frequentlypresents much smaller significant differences (e.g. often lessthan threefold).
Biological variability
Biological variability is one of the principal unknown entitiesin terms of the aforementioned considerations and representsthe final factor determining whether a given RNA measure-ment will be of clinical value; that is, once the technical factorshave been resolved, the measurement is still dependent onbiology. Previously, it was assumed that the findings ofrandomised controlled trials were applicable to all patients.However, it is becoming increasingly apparent that this is notthe case [97, 98]. Treatment outcomes as well as diseaseprogression and manifestation have been shown to differbetween patient groups, with women and ethnic minoritiesbeing under-represented in vascular surgery randomised con-trolled trials [99], and to depend on patient chronotype and itsrelationship with cancer treatment schedules [100]. The un-derlying cause for these findings will be due to physiologicaldifferences, many of which will manifest themselves in thegene expression profiles, suggesting that many putative sur-rogate mRNA biomarkers are likely to be similarly variablebetween different patient groups.
Gene expression profiles may change on a cyclical basis,influenced by circadian rhythms, growth and development,and other environmental factors such as stress, sustenance/nutrition, physical activity and infection, in conjunction withvariability attributable to gender, race, age and time of samplecollection, to name a few. These factors must additionally beconsidered over and above general experimental issues suchas the choice of procedure, sources of error and sample con-tamination, in order to select a useful biomarker that can yieldreproducible results. Unpicking the sources of biological ver-sus technical variance is a crucial yet frequently neglected stepin translating a measurement to the clinic.
Sample source and storage
RNA storage and isolation must be performed to ensure bothRNA integrity and removal of contaminating nucleases, ge-nomic DNA, and reverse transcriptase or PCR inhibitors. Thiscan be a problem with any sample source, but clinical samplesare of special concern because of their complexity, and
R. Sanders et al.
potential inconsistencies in sample size, collection, storage,and transport can lead to variable quality of RNA templates[5]. ThemRNA used for clinical diagnostics and research maybe derived from various tissues, obtained from biopsies, lum-bar puncture, blood, urine or buccal swabs, each posing theirown challenges for accurate measurement. In each case, thelimitations of sample handling in real-life clinical situationswill be different. It is well known that RNA is sensitive todegradation by postmortem processes and inadequate samplehandling or storage [84, 101].
The sample source is a major contributor to measurementvariation. RNA extractions and subsequent analyses per-formed from whole-tissue biopsy samples with little regardfor the different cell types contained within that sample inev-itably result in the averaging of the expression of different celltypes, and the expression profile of a specific cell type may bemasked, lost or ascribed to and dismissed as an incorrectmeasurement [102] because of the bulk of the surroundingcells [32, 103]. When one is working with versatile tissuessuch as blood, the cell number and composition may differbetween two samples (even from the same patient); conse-quently blood volume may not be an appropriate metric tobegin with, and separation of the different cell types is oftenperformed. However, it should be remembered that any pro-cessing of live cells will impact on the cellular physiology andmay directly alter the expression of the genes of interest.
Cellular separation is more difficult to achieve whenanalysing solid tissue samples, but may be important as sig-nificant differences have been detected in the gene expressionprofiles between microdissected and bulk tissue samples [103,104]. This is particularly relevant when comparing gene ex-pression profiles in complex tissue with multiple, phenotypi-cally distinct cell types, within a given tumour or betweennormal and cancer tissue where phenotypically normal cellsadjacent to a tumour may exhibit altered gene expressionprofiles owing to their proximity to the tumour [32, 105]. Itmay be possible to alleviate these pressures of sample source/cell type by performing single-cell analysis. This rapidlygrowing field has much to offer, but also comes with amultitude of unique challenges associated with sample pro-cessing, low mRNA abundance and data normalisation[106–109]. It should also be remembered that cell sizes maydiffer between different samples (such as tumour biopsy sam-ples or where tissues are undergoing hypertrophy as part ofnormal physiological processes), which adds an additionalchallenge to data interpretation.
Practical clinical challenges
In certain clinical situations, for example where surgical sam-pling is required, some of the points detailed here will reflect autopian view that will not be practical to implement. For
instance, tissue-sampling methods may differ among institutesand even among individuals within the same institution. Thiscan be very challenging to standardise with respect to the timespan of surgery, how long it takes for a sample to be fixed orfrozen, etc. To ensure data comparability and increased clin-ical impact within such challenging circumstances, it is crucialthat such conditions are defined as accurately as possible andthe associated limitations are fully considered within the dis-cussions around a given finding.
A particular mRNA result may only be possible under avery specific sampling procedure that is not easily repeatable(owing to specialist skill and/or equipment). Such findingsmay reveal new biological mechanisms, but unless they can becorroborated, they will be of questionable value. An exampleby which this can be performed could be that the samples arere-analysed (ideally including re-extraction) by a differentlaboratory to confirm the measurement. However, such anal-ysis may never be translated to routine clinical care as bio-markers, and as mRNAs are frequently measured as surro-gates for protein-driven physiology, additional confirmatoryexperiments considering the proteins and/or physiology inquestion are essential.
It is also crucial that other factors within the protocol(Fig. 1) that can be controlled are detailed within a givenstudy. Factors that frequently vary but which are easily con-trolled, and easily reported, such as storage conditions andduration, may differ among laboratories (e.g. type of freezer,storage in liquid nitrogen by immersion or by vapour phase),and so they must be comprehensively described.Documentation of such factors will facilitate identification ofany associated discrepancies that might arise, a fact that isparticularly pertinent to biobanking, which may compriselarge numbers of samples that may have been stored fordifferent durations.
Conclusion
Accurate RT-qPCR analysis could improve clinical diagnosisas well as predictive and prognostic monitoring. Furthermore,improved analytical measurement sensitivity may offer toolsto detect and quantify disease markers at earlier stages ofprogression, facilitating more timely treatment and improvedoutcome. Moreover, diagnostic tests conferring superior ac-curacy and analytical confidence may change the treatmentregimens patients are offered. For example, therapies may beeffective in treating only certain tumour genotypes and mayhave serious contraindications. As such, they are offered onlyto those patients for whom there is definitive molecular proofthat they harbour the associated specific mutation. Humanepidermal growth factor 2 status in breast cancer is one suchexample and is used as a predictive therapy-selection factorfor the humanised monoclonal antibody trastuzumab
Considerations for accurate gene expression measurement
(Herceptin, Genentech) [110]. Current diagnostic methods,including fluorescent in situ hybridisation and immunohisto-chemistry, can be subjective and insensitive. Advances inaccurate molecular quantification of RNA [111, 112] couldoffer enhanced analytical power for this and many similarclinical challenges, and may in the future become gold stan-dards in clinical diagnostics. RT-qPCR currently offers apowerful tool both to identify and to translate the clinicaluse of such biomarkers.
Yet for preclinical research using RT-qPCR to make a trans-latable impact, accuracy must be seen as more than just goodprecision. Accurate clinical measurement must also includeconsiderations of both potential bias and good technical repro-ducibility. By application of this notion to the whole stepwiseprocess from sampling to preparing the RNA sample andsubsequent methods for normalisation, RT-qPCR will becomemore reproducible, which in turn will improve the impact andlikelihood that findings will be translated to routine clinical use.Although accomplishing all the standardisation measures de-tailed in this review all the time may not always be possible,particularly in preclinical research, the key is to considersources of error so that, where possible, they can be capturedin the experimental design. Such an approach will improvemeasurement reproducibility and the likelihood that significantfindings are both real and translatable to routine clinical care.
Acknowledgments We are grateful to Alison Devonshire for criticalreview of the manuscript. This study was partly funded by the UKNational Measurement System.
Open Access This article is distributed under the terms of the CreativeCommons Attribution License which permits any use, distribution, andreproduction in any medium, provided the original author(s) and thesource are credited.
References
1. Higuchi R, Fockler C, Dollinger G, Watson R (1993) Kinetic PCRanalysis: real-time monitoring of DNA amplification reactions.Biotechnology (N Y) 11(9):1026–1030
2. Mullis KB (1990) The unusual origin of the polymerase chainreaction. Sci Am 262(4):56–61, 64-55
3. Mullis KB, Faloona FA (1987) Specific synthesis of DNA in vitrovia a polymerase-catalyzed chain reaction. Methods Enzymol 155:335–350
4. Saiki RK, Scharf S, Faloona F, Mullis KB, Horn GT, Erlich HA,ArnheimN (1985) Enzymatic amplification of beta-globin genomicsequences and restriction site analysis for diagnosis of sickle cellanemia. Science 230(4732):1350–1354
5. Valasek MA, Repa JJ (2005) The power of real-time PCR. AdvPhysiol Educ 29(3):151–159. doi:10.1152/advan.00019.2005
6. Quinn T, Kovalevsky J (2005) The development of modern metrol-ogy and its role today. Philos Trans Roc Soc A 363(1834):2307–2327. doi:10.1098/rsta.2005.1642
7. Mulvey MC, Sacksteder KA, Einck L, Nacy CA (2012) Generationof a novel nucleic acid-based reporter system to detect phenotypic
susceptibility to antibiotics in Mycobacterium tuberculosis. MBio3(2):e00312–11. doi:10.1128/mBio.00312-11
8. Mannonen L, Markkula E, Puolakkainen M (2011) Analysis ofChlamydia pneumoniae infection in mononuclear cells by reversetranscription-PCR targeted to chlamydial gene transcripts. MedMicrobiol Immunol 200(3):143–154. doi:10.1007/s00430-011-0184-3
9. Botelho-Souza LF, Dos Santos AD, Borzacov LM, Honda ER,Villalobos-Salcedo JM, Vieira DS (2013) Development of a reversetranscription quantitative real-time PCR-based system for rapiddetection and quantitation of hepatitis delta virus in the westernAmazon region of Brazil. J Virol Methods 197:19–24. doi:10.1016/j.jviromet.2013.11.016
10. Delarue S, Didier E, Damond F, Ponscarme D, Brengle-Pesce K,Resche-Rigon M, Vray M, Gueudin M, Simon F (2013) Highlysensitive plasma RNA quantification by real-time PCR in HIV-2group A and group B infection. J Clin Virol 58(2):461–467. doi:10.1016/j.jcv.2013.08.003
11. Katsoulidou A, Manesis E, Rokka C, Issaris C, Pagoni A, Sypsa V,Hatzakis A (2013) Development and assessment of a novel real-time PCR assay for quantitation of hepatitis D virus RNA to studyviral kinetics in chronic hepatitis D. J Viral Hepat 20(4):256–262.doi:10.1111/jvh.12000
12. Shahzamani K, Merat S, Rezvan H, Mirab-Samiee S, Khademi H,Malekzadeh R, Sabahi F (2010) Development of a low-cost real-time reverse transcriptase-polymerase chain reaction technique forthe detection and quantification of hepatitis C viral load. Clin ChemLab Med 48(6):777–784. doi:10.1515/cclm.2010.134
13. Takahashi S, Miura N, Harada T, Wang Z, Wang X, Tsubokura H,Oshima Y, Hasegawa J, Inagaki Y, Shiota G (2010) Prognosticimpact of clinical course-specific mRNA expression profiles in theserum of perioperative patients with esophageal cancer in the ICU: acase control study. J Transl Med 8:103. doi:10.1186/1479-5876-8-103
14. Bennour A, Ouahchi I, Moez M, Elloumi M, Khelif A, Saad A,Sennana H (2012) Comprehensive analysis of BCR/ABL variantsin chronic myeloid leukemia patients using multiplex RT-PCR. ClinLab 58(5–6):433–439
15. Moore FR, Rempfer CB, Press RD (2013) Quantitative BCR-ABL1 RQ-PCR fusion transcript monitoring in chronic mye-logenous leukemia. Methods Mol Biol 999:1–23. doi:10.1007/978-1-62703-357-2_1
16. Devonshire AS, Sanders R, Wilkes TM, Taylor MS, Foy CA,Huggett JF (2013) Application of next generation qPCR and se-quencing platforms to mRNA biomarker analysis. Methods 59(1):89–100. doi:10.1016/j.ymeth.2012.07.021
17. Genomic Health (2004–2013) Oncotype DX®. http://www.oncotypedx.com. Accessed 16 Oct 2013
18. Knezevic D, Goddard AD, Natraj N, Cherbavaz DB, Clark-Langone KM, Snable J, Watson D, Falzarano SM, Magi-GalluzziC, Klein EA, Quale C (2013) Analytical validation of the OncotypeDX prostate cancer assay - a clinical RT-PCR assay optimized forprostate needle biopsies. BMC Genomics 14:690. doi:10.1186/1471-2164-14-690
19. Sapino A, Roepman P, Linn SC, Snel MH, Delahaye LJ, van denAkker J, Glas AM, Simon IM, Barth N, de Snoo FA, van’t Veer LJ,Molinaro L, Berns EM, Wesseling J, Riley LB, Anderson D,Nguyen B, Cox CE (2014) MammaPrint molecular diagnostics onformalin-fixed, paraffin-embedded tissue. J Mol Diagn 16(2):190–197. doi:10.1016/j.jmoldx.2013.10.008
20. Ru Y, Dancik GM, Theodorescu D (2011) Biomarkers forprognosis and treatment selection in advanced bladder cancerpatients. Curr Opin Urol 21(5):420–427. doi:10.1097/MOU.0b013e32834956d6
21. Glaubitz J, SizmannD, SimonCO, HoffmannKS, Drogan D, HesseM, Lang G, Kroeh M, Simmler P, Dewald M, Haberhausen G,
R. Sanders et al.
Lindauer A, Beyser K, Reber A, Baumeister A, Wolf E, Jaeger H,Babiel R (2011) Accuracy to 2nd international HIV-1 RNAWHOstandard: assessment of three generations of quantitative HIV-1RNA nucleic acid amplification tests. J Clin Virol 50(2):119–124.doi:10.1016/j.jcv.2010.10.017
22. Bustin SA (2010) Why the need for qPCR publication guide-lines?—the case for MIQE. Methods 50(4):217–226. doi:10.1016/j.ymeth.2009.12.006
23. Huggett JB, Bustin SA (2011) Standardisation and reporting fornucleic acid quantification. Accred Qual Assur 16(8–9):399–405.doi:10.1007/s00769-011-0769-y
24. Joint Committee for Guides in Metrology (2012) Internationalvocabulary of metrology – basic and general concepts and associ-ated terms (VIM), 3rd edn. 2008 version with minor corrections.http://www.eurachem.org
25. Bustin SA, Benes V, Garson JA, Hellemans J, Huggett J, KubistaM,Mueller R, Nolan T, Pfaffl MW, Shipley GL, Vandesompele J,Wittwer CT (2009) The MIQE guidelines: minimum informationfor publication of quantitative real-time PCR experiments. ClinChem 55(4):611–622. doi:10.1373/clinchem.2008.112797
26. Bustin SA, Beaulieu JF, Huggett J, Jaggi R, Kibenge FS, Olsvik PA,Penning LC, Toegel S (2010) MIQE précis: practical implementa-tion of minimum standard guidelines for fluorescence-based quan-titative real-time PCR experiments. BMC Mol Biol 11:74. doi:10.1186/1471-2199-11-74
27. Bustin SA, Benes V, Garson J, Hellemans J, Huggett J, Kubista M,Mueller R, Nolan T, Pfaffl MW, Shipley G, Wittwer CT, SchjerlingP, Day PJ, Abreu M, Aguado B, Beaulieu JF, Beckers A, Bogaert S,Browne JA, Carrasco-Ramiro F, Ceelen L, Ciborowski K, CornillieP, Coulon S, Cuypers A, De Brouwer S, De Ceuninck L, De CraeneJ, De Naeyer H, De Spiegelaere W, Deckers K, Dheedene A,Durinck K, Ferreira-Teixeira M, Fieuw A, Gallup JM, Gonzalo-Flores S, Goossens K, Heindryckx F, Herring E, Hoenicka H, IcardiL, Jaggi R, Javad F, KarampeliasM,Kibenge F, KibengeM, KumpsC, Lambertz I, Lammens T, Markey A, Messiaen P, Mets E, MoraisS, Mudarra-Rubio A, Nakiwala J, Nelis H, Olsvik PA, Perez-NovoC, Plusquin M, Remans T, Rihani A, Rodrigues-Santos P, RondouP, Sanders R, Schmidt-Bleek K, Skovgaard K, Smeets K, Tabera L,Toegel S, Van Acker T, Van den Broeck W, Van der Meulen J, VanGele M, Van Peer G, Van Poucke M, Van Roy N, Vergult S,Wauman J, Tshuikina-Wiklander M, Willems E, Zaccara S, ZekaF, Vandesompele J (2013) The need for transparency and goodpractices in the qPCR literature. Nat Methods 10(11):1063–1067.doi:10.1038/nmeth.2697
28. Ellison S, Barwick V (1998) Using validation data for ISO mea-surement uncertainty estimation, part 1: principles of an approachusing cause and effect analysis. Analyst 123:1387–1392
29. Ellison S, Williams A (eds) (2012) EURACHEM/CITAC guide:quantifying uncertainty in analytical measurement, 3rd edn. http://www.eurachem.org
30. Devonshire AS, Elaswarapu R, Foy CA (2011) Applicability ofRNA standards for evaluating RT-qPCR assays and platforms.BMC Genomics 12:118. doi:10.1186/1471-2164-12-118
31. Joint Committee for Guides in Metrology (2008) Evaluation ofmeasurement data - guide to the expression of uncertainty in mea-surement (GUM). http://www.eurachem.org
32. Bustin SA (2002) Quantification of mRNA using real-time reversetranscription PCR (RT-PCR): trends and problems. J MolEndocrinol 29(1):23–39
33. Bustin SA, Nolan T (2004) Pitfalls of quantitative real-time reverse-transcription polymerase chain reaction. J Biomol Tech 15(3):155–166
34. Vermeulen J, Pattyn F, De Preter K, Vercruysse L, Derveaux S,Mestdagh P, Lefever S, Hellemans J, Speleman F, Vandesompele J(2009) External oligonucleotide standards enable cross laboratorycomparison and exchange of real-time quantitative PCR data.Nucleic Acids Res 37(21):e138. doi:10.1093/nar/gkp721
35. Linz U (1990) Thermocycler temperature variation invalidates PCRresults. Biotechniques 9(3):286, 288, 290-293
36. Schoder D, Schmalwieser A, Schauberger G, Hoorfar J, Kuhn M,Wagner M (2005) Novel approach for assessing performance ofPCR cyclers used for diagnostic testing. J Clin Microbiol 43(6):2724–2728. doi:10.1128/JCM.43.6.2724-2728.2005
37. BushonRN, Kephart CM, Koltun GF, FrancyDS, Schaefer FW 3rd,Alan Lindquist HD (2010) Statistical assessment of DNA extractionreagent lot variability in real-time quantitative PCR. Lett ApplMicrobiol 50(3):276–282. doi:10.1111/j.1472-765X.2009.02788.x
38. Bustin SA, Benes V, Garson JA, Hellemans J, Huggett J, KubistaM,Mueller R, Nolan T, Pfaffl MW, Shipley GL, Vandesompele J,Wittwer CT (2011) Primer sequence disclosure: a clarification ofthe MIQE guidelines. Clin Chem 57(6):919–921. doi:10.1373/clinchem.2011.162958
39. Huggett J, Dheda K, Bustin S, Zumla A (2005) Real-time RT-PCRnormalisation; strategies and considerations. Genes Immun 6(4):279–284. doi:10.1038/sj.gene.6364190
40. Burns M, Ellison S (2011) The fitness for purpose of randomisedexperimental designs for analysis of genetically modified ingredi-ents. Eur Food Res Technol 233(1):71–78
41. Nolan T, Huggett JF, Sanchez E (2013) Good practice guide for theapplication of quantitative PCR (qPCR). http://www.nmschembio.org.uk/PublicationArticle.aspx?m=115&amid=7994
42. Pfaffl M (2014) gene-quantification.com& gene-quantification.info- the reference in qPCR - academic & industrial information plat-form. http://www.gene-quantification.info
43. TATAA Biocenter (2012) TATAA Biocenter. http://www.tataa.com44. Biogazelle (2014) Biogazelle. http://www.biogazelle.com45. Integromics (2014) Integromics. http://www.integromics.com46. Livak KJ, Schmittgen TD (2001) Analysis of relative gene expres-
sion data using real-time quantitative PCR and the 2-ΔΔCT method.Methods 25(4):402–408. doi:10.1006/meth.2001.1262
47. Pfaffl MW (2001) A new mathematical model for relative quantifi-cation in real-time RT-PCR. Nucleic Acids Res 29(9):e45
48. Sanders R, Mason DJ, Foy CA, Huggett JF (2013) Evaluation ofdigital PCR for absolute RNA quantification. PLoS One 8(9):e75296. doi:10.1371/journal.pone.0075296
49. Vandesompele J, De Preter K, Pattyn F, Poppe B, Van Roy N, DePaepe A, Speleman F (2002) Accurate normalization of real-timequantitative RT-PCR data by geometric averaging of multiple inter-nal control genes. Genome Biol 3(7), RESEARCH0034
50. Tunbridge EM, Eastwood SL, Harrison PJ (2011) Changed relativeto what? Housekeeping genes and normalization strategies in hu-man brain gene expression studies. Biol Psychiatry 69(2):173–179.doi:10.1016/j.biopsych.2010.05.023
51. Marullo M, Zuccato C, Mariotti C, Lahiri N, Tabrizi SJ, Di DonatoS, Cattaneo E (2010) Expressed Alu repeats as a novel, reliable toolfor normalization of real-time quantitative RT-PCR data. GenomeBiol 11(1):R9. doi:10.1186/gb-2010-11-1-r9
52. English CA, Merson S, Keer JT (2006) Use of elemental analysis todetermine comparative performance of established DNA quantifica-tion methods. Anal Chem 78(13):4630–4633. doi:10.1021/ac060174k
53. Bhat S, Curach N, Mostyn T, Bains GS, Griffiths KR, EmslieKR (2010) Comparison of methods for accurate quantificationof DNA mass concentration with traceability to the interna-tional system of units. Anal Chem 82(17):7185–7192. doi:10.1021/ac100845m
54. Blotta I, Prestinaci F, Mirante S, Cantafora A (2005) Quantitativeassay of total dsDNAwith PicoGreen reagent and real-time fluores-cent detection. Ann Ist Super Sanita 41(1):119–123
55. Cavaluzzi MJ, Borer PN (2004) Revised UVextinction coefficientsfor nucleoside-5′-monophosphates and unpaired DNA and RNA.Nucleic Acids Res 32(1):e13. doi:10.1093/nar/gnh015
56. Haque KA, Pfeiffer RM, Beerman MB, Struewing JP, Chanock SJ,Bergen AW (2003) Performance of high-throughput DNA
Considerations for accurate gene expression measurement
quantification methods. BMC Biotechnol 3:20. doi:10.1186/1472-6750-3-20
57. Sanders R, Huggett JF, Bushell CA, Cowen S, Scott DJ, Foy CA(2011) Evaluation of digital PCR for absolute DNA quantification.Anal Chem 83(17):6474–6484. doi:10.1021/ac103230c
58. Vermeulen J, De Preter K, Lefever S, Nuytens J, De Vloed F,Derveaux S, Hellemans J, Speleman F, Vandesompele J (2011)Measurable impact of RNA quality on gene expression results fromquantitative PCR. Nucleic Acids Res 39(9):e63. doi:10.1093/nar/gkr065
59. Dheda K, Huggett JF, Bustin SA, Johnson MA, Rook G, Zumla A(2004) Validation of housekeeping genes for normalizing RNAexpression in real-time PCR. Biotechniques 37(1):112–114, 116,118-119
60. Andersen CL, Jensen JL, Orntoft TF (2004) Normalization of real-time quantitative reverse transcription-PCR data: a model-basedvariance estimation approach to identify genes suited for normali-zation, applied to bladder and colon cancer data sets. Cancer Res64(15):5245–5250. doi:10.1158/0008-5472.CAN-04-0496
61. Pfaffl MW, Horgan GW, Dempfle L (2002) Relative expressionsoftware tool (REST) for group-wise comparison and statisticalanalysis of relative expression results in real-time PCR. NucleicAcids Res 30(9):e36
62. Bustin SA (2000) Absolute quantification of mRNA using real-timereverse transcription polymerase chain reaction assays. J MolEndocrinol 25(2):169–193
63. Erkens T, Van Poucke M, Vandesompele J, Goossens K, VanZeveren A, Peelman LJ (2006) Development of a new set ofreference genes for normalization of real-time RT-PCR data ofporcine backfat and longissimus dorsi muscle, and evaluation withPPARGC1A. BMC Biotechnol 6:41. doi:10.1186/1472-6750-6-41
64. Schmittgen TD, Zakrajsek BA (2000) Effect of experimental treat-ment on housekeeping gene expression: validation by real-time,quantitative RT-PCR. J Biochem Biophys Methods 46(1–2):69–81
65. Fox BC, Devonshire AS, Schutte ME, Foy CA, Minguez J,Przyborski S, Maltman D, Bokhari M, Marshall D (2010)Validation of reference gene stability for APAP hepatotoxicitystudies in different in vitro systems and identification of novelpotential toxicity biomarkers. Toxicol In Vitro 24(7):1962–1970.doi:10.1016/j.tiv.2010.08.007
66. Fedrigo O, Warner LR, Pfefferle AD, Babbitt CC, Cruz-Gordillo P,Wray GA (2010) A pipeline to determine RT-QPCR control genesfor evolutionary studies: application to primate gene expressionacross multiple tissues. PLoS One 5(9):e12545. doi:10.1371/journal.pone.0012545
67. Glare EM, Divjak M, Bailey MJ, Walters EH (2002) β-Actin andGAPDH housekeeping gene expression in asthmatic airways isvariable and not suitable for normalising mRNA levels. Thorax57(9):765–770
68. Ke LD, Chen Z, Yung WK (2000) A reliability test of standard-based quantitative PCR: exogenous vs endogenous standards. MolCell Probes 14(2):127–135. doi:10.1006/mcpr.2000.0288
69. Suzuki T, Higgins PJ, Crawford DR (2000) Control selection forRNA quantitation. Biotechniques 29(2):332–337
70. Zhu G, Chang Y, Zuo J, Dong X, Zhang M, Hu G, Fang F (2001)Fudenine, a C-terminal truncated rat homologue ofmouse prominin,is blood glucose-regulated and can up-regulate the expression ofGAPDH. Biochem Biophys Res Commun 281(4):951–956. doi:10.1006/bbrc.2001.4439
71. Sirover MA (1999) New insights into an old protein: the functionaldiversity of mammalian glyceraldehyde-3-phosphate dehydroge-nase. Biochim Biophys Acta 1432(2):159–184
72. Hruz T, Wyss M, Docquier M, Pfaffl MW, Masanetz S, Borghi L,Verbrugghe P, Kalaydjieva L, Bleuler S, Laule O, Descombes P,Gruissem W, Zimmermann P (2011) RefGenes: identification ofreliable and condition specific reference genes for RT-qPCR data
normalization. BMC Genomics 12:156. doi:10.1186/1471-2164-12-156
73. Maess MB, Sendelbach S, Lorkowski S (2010) Selection of reliablereference genes during THP-1 monocyte differentiation into mac-rophages. BMC Mol Biol 11:90. doi:10.1186/1471-2199-11-90
74. Zyzynska-Granica B, Koziak K (2012) Identification of suitablereference genes for real-time PCR analysis of statin-treated humanumbilical vein endothelial cells. PLoS One 7(12):e51547. doi:10.1371/journal.pone.0051547
75. Keen CL, Jue T, Tran CD, Vogel J, Downing RG, Iyengar V, RuckerRB (2003) Analytical methods: improvements, advancements andnew horizons. J Nutr 133(5 Suppl 1):1574S–1578S
76. Huggett JF, Novak T, Garson JA, Green C, Morris-Jones SD, MillerRF, Zumla A (2008) Differential susceptibility of PCR reactions toinhibitors: an important and unrecognised phenomenon. BMC ResNotes 1:70. doi:10.1186/1756-0500-1-70
77. Nolan T, Hands RE, Ogunkolade W, Bustin SA (2006) SPUD: aquantitative PCR assay for the detection of inhibitors in nucleic acidpreparations. Anal Biochem 351(2):308–310. doi:10.1016/j.ab.2006.01.051
78. Honeyborne I, McHugh TD, Phillips PP, Bannoo S, Bateson A,Carroll N, Perrin FM, Ronacher K,Wright L, van Helden PD,WalzlG, Gillespie SH (2011)Molecular bacterial load assay, a culture-freebiomarker for rapid and accurate quantification of sputumMycobacterium tuberculosis bacillary load during treatment. JClin Microbiol 49(11):3905–3911. doi:10.1128/JCM.00547-11
79. Ferns RB, Garson JA (2006) Development and evaluation of a real-time RT-PCR assay for quantification of cell-free human immunode-ficiency virus type 2 using a Brome Mosaic Virus internal control. JVirol Methods 135(1):102–108. doi:10.1016/j.jviromet.2006.02.005
80. Garson JA, Grant PR, Ayliffe U, Ferns RB, Tedder RS (2005) Real-time PCR quantitation of hepatitis B virus DNA using automatedsample preparation and murine cytomegalovirus internal control. JVirol Methods 126(1–2):207–213. doi:10.1016/j.jviromet.2005.03.001
81. Wahlberg K, Huggett J, Sanders R, Whale AS, Bushell C,Elaswarapu R, Scott DJ, Foy CA (2012) Quality assessment ofbiobanked nucleic acid extracts for downstreammolecular analysis.Biopreserv Biobank 10(3):266–275. doi:10.1089/bio.2012.0004
82. MathiesonW, Thomas GA (2013) Simultaneously extracting DNA,RNA, and protein using kits: is sample quantity or qualityprejudiced? Anal Biochem 433(1):10–18. doi:10.1016/j.ab.2012.10.006
83. External RNA Controls Consortium (2005) Proposed methods fortesting and selecting the ERCC external RNA controls. BMCGenomics 6:150. doi:10.1186/1471-2164-6-150
84. Perez-Novo CA, Claeys C, Speleman F, Van Cauwenberge P,Bachert C, Vandesompele J (2005) Impact of RNA quality onreference gene expression stability. Biotechniques 39(1):52, 54, 56
85. Yang ZL, Zheng Q, Yan J, Pan Y, Wang ZG (2011) UpregulatedCD133 expression in tumorigenesis of colon cancer cells. World JGastroenterol 17(7):932–937. doi:10.3748/wjg.v17.i7.932
86. Vermeulen J, Derveaux S, Lefever S, De Smet E, De Preter K, YigitN, De Paepe A, Pattyn F, Speleman F, Vandesompele J (2009) RNApre-amplification enables large-scale RT-qPCR gene-expressionstudies on limiting sample amounts. BMC Res Notes 2:235. doi:10.1186/1756-0500-2-235
87. Rizzi F, Belloni L, Crafa P, Lazzaretti M, Remondini D, Ferretti S,Cortellini P, Corti A, Bettuzzi S (2008) A novel gene signature formolecular diagnosis of human prostate cancer by RT-qPCR. PLoSOne 3(10):e3617. doi:10.1371/journal.pone.0003617
88. Foroni L, Wilson G, Gerrard G, Mason J, Grimwade D, White HE,de Castro DG, Austin S, Awan A, Burt E, Clench T, Farruggia J,Hancock J, Irvine AE, Kizilors A, Langabeer S,Milner BJ, NicklessG, Schuh A, Sproul A, Wang L, Wickham C, Cross NC (2011)Guidelines for the measurement of BCR-ABL1 transcripts in
R. Sanders et al.
chronic myeloid leukaemia. Br J Haematol 153(2):179–190. doi:10.1111/j.1365-2141.2011.08603.x
89. Gomes AQ, Correia DV, Grosso AR, Lanca T, Ferreira C, LacerdaJF, Barata JT, Silva MG, Silva-Santos B (2010) Identification of apanel of ten cell surface protein antigens associated withimmunotargeting of leukemias and lymphomas by peripheral bloodγδ T cells. Haematologica 95(8):1397–1404. doi:10.3324/haematol.2009.020602
90. Schultz-Thater E, Frey DM, Margelli D, Raafat N, Feder-MengusC, Spagnoli GC, Zajac P (2008)Whole blood assessment of antigenspecific cellular immune response by real time quantitative PCR: aversatile monitoring and discovery tool. J Transl Med 6:58. doi:10.1186/1479-5876-6-58
91. Kammula US, Marincola FM, Rosenberg SA (2000) Real-timequantitative polymerase chain reaction assessment of immune reac-tivity in melanoma patients after tumor peptide vaccination. J NatlCancer Inst 92(16):1336–1344
92. Abdeldaim GM, Stralin K, Korsgaard J, Blomberg J, Welinder-Olsson C, Herrmann B (2010) Multiplex quantitative PCR fordetection of lower respiratory tract infection and meningitis causedby Streptococcus pneumoniae, Haemophilus influenzae andNeisseria meningitidis. BMC Microbiol 10:310. doi:10.1186/1471-2180-10-310
93. Pollara CP, Corbellini S, Chiappini S, Sandrini S, De Tomasi D,Bonfanti C, Manca N (2011) Quantitative viral load measurementfor BKV infection in renal transplant recipients as a predictive toolfor BKVAN. New Microbiol 34(2):165–171
94. Schmid F, Glaus E, Cremers FP, Kloeckener-GruissemB, BergerW,Neidhardt J (2010) Mutation- and tissue-specific alterations ofRPGR transcripts. Invest Ophthalmol Vis Sci 51(3):1628–1635.doi:10.1167/iovs.09-4031
95. Provenzano M, Panelli MC, Mocellin S, Bracci L, Sais G, StroncekDF, Spagnoli GC, Marincola FM (2006) MHC-peptide specificityand T-cell epitope mapping: where immunotherapy starts. TrendsMol Med 12(10):465–472. doi:10.1016/j.molmed.2006.08.008
96. Zhou Y, Wei Y, Wang L, Wang X, Du X, Sun Z, Dong N, Chen X(2011) Decreased adiponectin and increased inflammation expres-sion in epicardial adipose tissue in coronary artery disease.Cardiovasc Diabetol 10(1):2. doi:10.1186/1475-2840-10-2
97. Geller SE, Koch A, Pellettieri B, Carnes M (2011) Inclusion,analysis, and reporting of sex and race/ethnicity in clinical trials:have we made progress? J Wom Health 20(3):315–320. doi:10.1089/jwh.2010.2469
98. Stronks K, Wieringa NF, Hardon A (2013) Confronting diversity inthe production of clinical evidence goes beyond merely includingunder-represented groups in clinical trials. Trials 14:177. doi:10.1186/1745-6215-14-177
99. Hoel AW, Kayssi A, Brahmanandam S, Belkin M, Conte MS,Nguyen LL (2009) Under-representation of women and ethnicminorities in vascular surgery randomized controlled trials. J VascSurg 50(2):349–354. doi:10.1016/j.jvs.2009.01.012
100. Bernard S, Cajavec Bernard B, Levi F, Herzel H (2010) Tumorgrowth rate determines the timing of optimal chronomodulated
treatment schedules. PLoS Comput Biol 6(3):e1000712. doi:10.1371/journal.pcbi.1000712
101. Holland NT, Smith MT, Eskenazi B, Bastaki M (2003) Biologicalsample collection and processing for molecular epidemiologicalstudies. Mutat Res 543(3):217–234
102. Chelly J, Concordet JP, Kaplan JC, Kahn A (1989) Illegitimatetranscription: transcription of any gene in any cell type. Proc NatlAcad Sci U S A 86(8):2617–2621
103. Sugiyama Y, Farrow B, Murillo C, Li J, Watanabe H, Sugiyama K,Evers BM (2005) Analysis of differential gene expression patternsin colon cancer and cancer stroma using microdissected tissues.Gastroenterology 128(2):480–486
104. Fink L, Kohlhoff S, Stein MM, Hanze J, Weissmann N, Rose F,Akkayagil E, Manz D, Grimminger F, Seeger W, Bohle RM (2002)cDNA array hybridization after laser-assisted microdissection fromnonneoplastic tissue. Am J Pathol 160(1):81–90. doi:10.1016/s0002-9440(10)64352-0
105. Deng G, Lu Y, Zlotnikov G, Thor AD, Smith HS (1996) Loss ofheterozygosity in normal tissue adjacent to breast carcinomas.Science 274(5295):2057–2059
106. Bengtsson M, Stahlberg A, Rorsman P, Kubista M (2005) Geneexpression profiling in single cells from the pancreatic islets ofLangerhans reveals lognormal distribution of mRNA levels.Genome Res 15(10):1388–1392. doi:10.1101/gr.3820805
107. Fox BC, Devonshire AS, Baradez MO, Marshall D, Foy CA (2012)Comparison of reverse transcription-quantitative polymerase chainreaction methods and platforms for single cell gene expressionanalysis. Anal Biochem 427(2):178–186. doi:10.1016/j.ab.2012.05.010
108. Stahlberg A, Rusnakova V, Forootan A, Anderova M, Kubista M(2013) RT-qPCR work-flow for single-cell data analysis. Methods59(1):80–88. doi:10.1016/j.ymeth.2012.09.007
109. Devonshire AS, Baradez MO, Morley G, Marshall D, Foy CA(2014) Validation of high-throughput single cell analysis method-ology. Anal Biochem 452:102–113. doi:10.1016/j.ab.2014.03.001
110. Nitta H, Hauss-Wegrzyniak B, Lehrkamp M, Murillo AE, Gaire F,Farrell M, Walk E, Penault-Llorca F, Kurosumi M, Dietel M, WangL, Loftus M, Pettay J, Tubbs RR, Grogan TM (2008) Developmentof automated brightfield double in situ hybridization (BDISH) ap-plication for HER2 gene and chromosome 17 centromere (CEN 17)for breast carcinomas and an assay performance comparison tomanual dual color HER2 fluorescence in situ hybridization(FISH). Diagn Pathol 3:41. doi:10.1186/1746-1596-3-41
111. Schobesberger M, Baltzer A, Oberli A, Kappeler A, Gugger M,Burger H, Jaggi R (2008) Gene expression variation betweendistinct areas of breast cancer measured from paraffin-embedded tissue cores. BMC Cancer 8:343. doi:10.1186/1471-2407-8-343
112. Whale AS, Huggett JF, Cowen S, Speirs V, Shaw J, Ellison S,Foy CA, Scott DJ (2012) Comparison of microfluidic digitalPCR and conventional quantitative PCR for measuring copynumber variation. Nucleic Acids Res 40(11):e82. doi:10.1093/nar/gks203
Considerations for accurate gene expression measurement
Top Related