


Languages
Pages
Legal


computational systems biology
Computational Systems Biology
Kinetic models of gene regulation
Hongwu MaComputational Systems Biology Group
23 February 2010

computational systems biology
Zaslaver et al, Nature Genetics, 36-486 (2004)
From static network to dynamic behaviorEnzyme expression dynamics after arginine off
ArgRarg
Arg synthesis genes
Expression dynamics can not be described by network model!
Also has a nice model to explain why.

computational systems biology
Dynamic models are needed
++Y
X
Z+
Sx

computational systems biology
From Interactions to Processes
RNApol
Promotor
Transportormetabolite
σfactor
TF
TF
Binding site
Enzyme
Transport
Metabolite-protein binding
DNA-protein binding
Transcription and translation
Enzyme catalyzed metabolic reaction
Protein degradation
Two component signal transduction
…………
Kinetic models needed to describe the processes!

computational systems biology
First step: Represent processes as reactions
• Transport: mout min
• M-P binding: m+TFmTF• Transcription:• Translation:• Metabolic reaction: m1m2• Degradation: proteinnull, mRNAnull(?)
)(xfv Which factors affect reaction rate? In which function?
Not as interactions as in the static picture of the graph analysis
Most important: determine the rate of these reactions?
In gene regulation process the mass balance is not important
mRNAmTFNA proteinAA mRNA

computational systems biology
Kinetic equations
nSSSkv 21 **
SSvv m
sK
h
h
mh
hm
KS
KS
vSSvv
1
Kh
h: Hill coefficient
Michaelis-Menten Kinetics
Hill equation
Mass action kinetics

computational systems biology
Hill equation
Sigmoid function, a switch mechanism

computational systems biology
Start from a simple model• M-TF binding: Sx+XXSx• Transcription: XSx +DNA XSx
+mRNAz
• Translation: mRNAzmRNAz+Z• Degradation: Znull
1S if 0S if 0
x
x
XXSx
X
Z
+
Sx
Simplification• M-TF binding is a switch process:
• Transcription and Translation combined: XSx +DNA XSx +Z
• Degradation:hx
h
hxm
z XSKXSvBv
Zv z
Bz=0

computational systems biology
Simulation (switch on Sx=1)• Which are the variables in the system? • regulator X is not controlled by other TFs, therefore
assume X constant: X=1• Only one variable Z
ZKvZ
XSKXSv
dtdZ
zhm
zhx
h
hxm
1
Initial concentration Z0=0
Vm=1, K=0.1, h=2, az=1
Production Degradation

computational systems biology
Metabolite-TF interactions
• bind to active an activator: 20• bind to deactive a repressor: 14• Bind to deactive an activator: 5 • Bind to active a repressor: 11

computational systems biology
other models• X bind to DNA to active transcription while XSx not: X
+DNA X +mRNAz
0S if 1S if 0
x
x
XX
hh
hm
XKXvv
• X bind to DNA to repress transcription while XSx not (ArsR, lac operon, inducer)
hh
hm
XKKvv
• XSx bind to DNA to repress transcription (ArgR+arginine, corepressor)
hx
h
hm
XSKKvv

computational systems biology
Combinatorial regulation
)()( YfXfv
hh
hh
m
KyY
KxX
KyY
KxXv
v
1
hh
h
m
KyY
KxX
KxXv
v
1
1
X
Z
Sx
Y
Sy AND relationship
OR relationship
++ +-
-+ --
hh
h
m
KyY
KxX
KyYv
v
1
1
hhm
KyY
KxX
vv
1
Mangan and Alon, (2003) PNAS, 100:11980

computational systems biology
Feed forward loop
YXSKXSv
dtdY
yhx
hXY
hxmy
Z
KyzYS
KxzXS
KyzYS
KxzXSv
dtdZ
zhy
hx
hy
hx
m
1
X
Z
Sx
Y
Sy The regulator Y is also regulated by X, therefore the concentration of Y is also changed but not constant
ZYSKXSK
YSXSvdtdZ
zhy
hyz
hx
hxz
hy
hxm
AND
OR
Easily simulated with the Matlab ODE solver or in Copasi!

computational systems biology
Dynamics of FFL
Simple combinatorial regulation
The response to Sx switch on is delayed for FFL controlled genes. The target gene only respond to persistent signal but not noise
Mangan and Alon, (2003) PNAS, 100:11980

computational systems biology
Other gene circuit models
LacI LCI or TetR
Toggle switch
Gardner et al, Nature, 403-339, 2000
Elwitz et al, Nature, 403-335, 2000
Repressilator
AcCoA
AcP
NtrC
LacI
PtaAcs
Metabolator
Fung et al, Nature, 435-118, 2005

computational systems biology
Network motif and gene circuit
• Network motif: statistically highly represented substructures in a large network
• Gene circuit: A functionally independent regulatory unit involving different types of interactions
• Synthetic Biology: design and build of an artificial biological circuit with a novel function
• Experimental Design always needs guidance from computational modelling

computational systems biology
A real world example: ammonium assimilation model

computational systems biology
Reactions
PII (GlnK, GlnB) modification
PII+UTP PIIUMP
PIIUMP+UTP PIIUMP2
PIIUMP2+UTP PIIUMP3
PIIUMP3 PIIUMP2 +UMP
PIIUMP2 PIIUMP +UMP
PIIUMP PII +UMP
GS modification
GS+ATP GSAMP
GSAMP GS +ADP
AmtB binding
AmtB+GlnK = AmtBGlnK
Transport reactionsNH3ex = NH3inAmtB + NH4ex = AmtBNH4AmtBNH4 = AmtBNH3 + HexAmtBNH3 = AmtB + NH3inNH3in + Hin = NH4in
Metabolic reactionsNH4in + GLU + ATP = GLN + ADPAKG +GLN +NADPH = 2 GLU + NADPNH4in + AKG + NADPH = GLU + NADP
Exchange reactionsGLU proteinGLN proteinGLU AKGGLN GLU
NtrC phosphorylation
NtrBP+NtrC=NtrCP+NtrB; PII
GS regulation
GS; NtrCP
GS
GSAMP
AmtB, GlnK regulation
AmtB; NtrCP
GlnK; NtrCP
AmtB
GlnK
AmtBGlnK
AmtBNH3
AmtBNH4
GlnKUMP(1-3)
Transport & Metabolite
Protein level regulation
Gene level regulation

computational systems biology
Gene regulationNtrBC two component system: dual regulator. GS gene regulation through two promoters
NtrCNtrB
Weak glnAp1 is rpoD dependent while strong glnAp2 is rpoN dependent
GS

computational systems biology
GS gene regulationGS production: -> GS; NtrCP
hh
NtrCPKp+1
vp+
KpNtrCP+1
vpr2
2
1
1
Promoter 1 is weak (low vp1), repressed by NtrCPPromoter 2 is strong (high vp1), activated by NtrCP
Steady state GS concentration change around six times, 25 uM at very low NH4ex
computational systems biology
Model analysis
• Steady state fluxes and concentrations at various NH4/NH3 concentrations and various pHs (fit experimental data)
• Cellular dynamic responses to suddenly changed environment
• Effect of gene knock out• Parameter sensitivity analysis and
contribution from different regulation mechanisms (like MCA for metabolic pathway model)

computational systems biology
Dynamic simulation: 5 to 500 µM
Gene regulation takes a very long time, but in consistence with the protein half life at about 1 hour.
Protein level regulation is much fast! Active protein reduced quickly.

computational systems biology
Dynamic simulation: 500 to 5 µM
Slow gene regulation response leads to very low GLN concentration (less than 0.01mM), very low N assimilation rate (0.01mM/s) and negative GDH flux (nearly 50s).
May use a FFL to speed up the response

computational systems biology
Softwares for modelling
• Copasi: www.copasi.org, very good software for kinetic model analysis but not for visualization
• Jdesigner/Jarnec: sys-bio.org, diagram+simulation
• CellDesigner: automatic layout+simulation• Simbiology: by mathworks, powerful and
expensive, only tool to deal with the currency metabolites in visualization
Alves, et al: Tools for kinetic modeling of biochemical networks, Nature Biotechnology, v24:667, 2006
computational systems biology
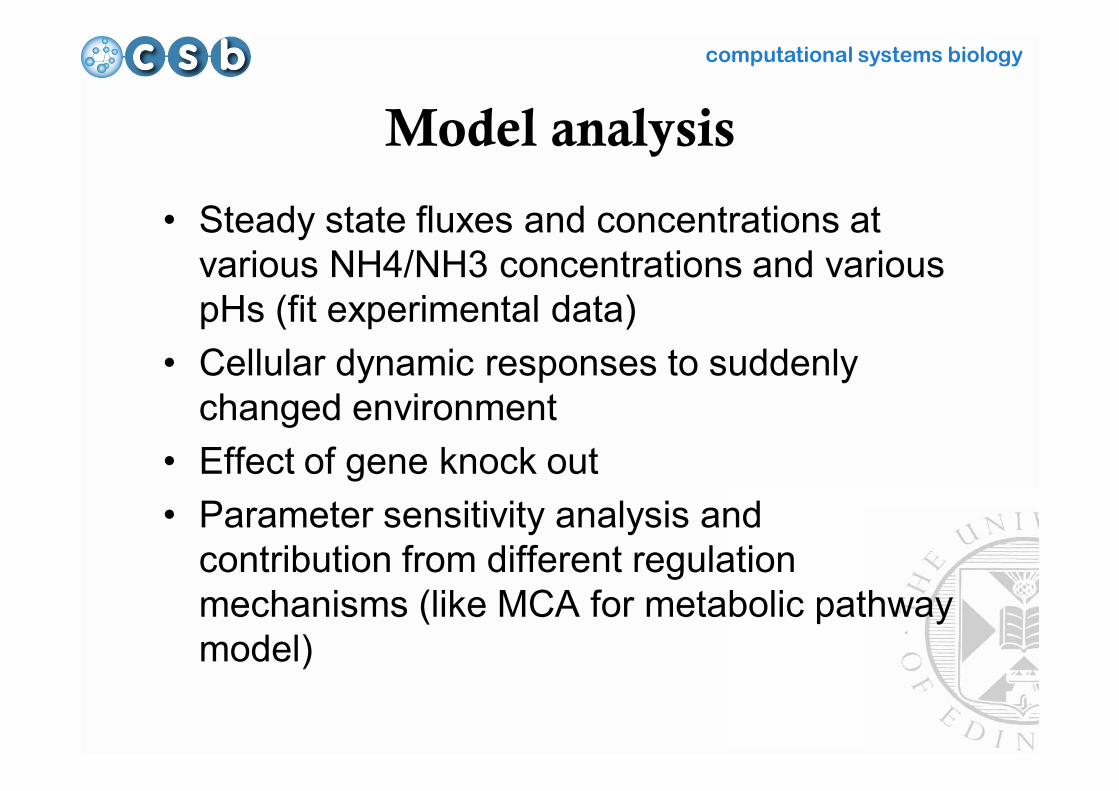
Desired features
• SBML import and export• Built-in kinetic laws to select and user-defined
kinetic laws for easy reuse• Give the parameter values and initial
concentrations of variables (species such as ATP can be set at constant)
• Run the simulation and see the results in graph or data

computational systems biology
Databases on models
• Biomodels database http://www.ebi.ac.uk/biomodels/
• over 200 Curated models from literature on metabolic pathways, gene regulatory circuits and signal transduction pathways
• SBML files can be directly imported by many software for simulation (http://sbml.org)
• Graph visualization for easy checking
computational systems biology
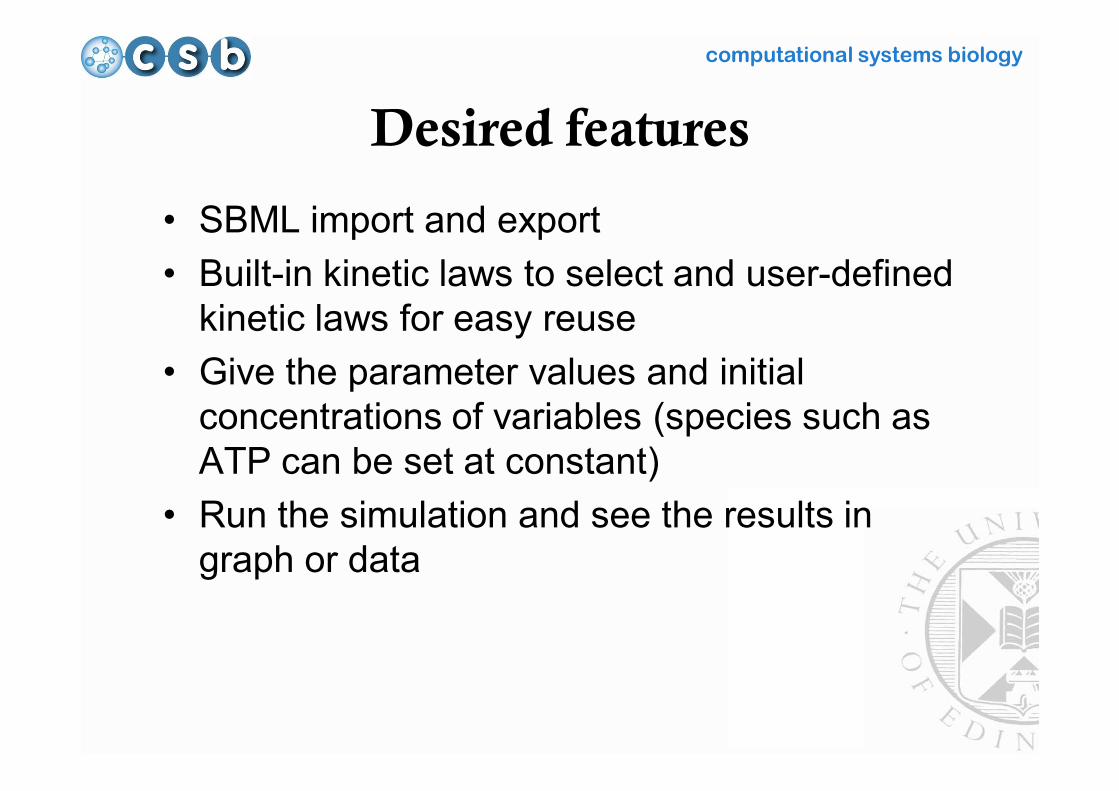
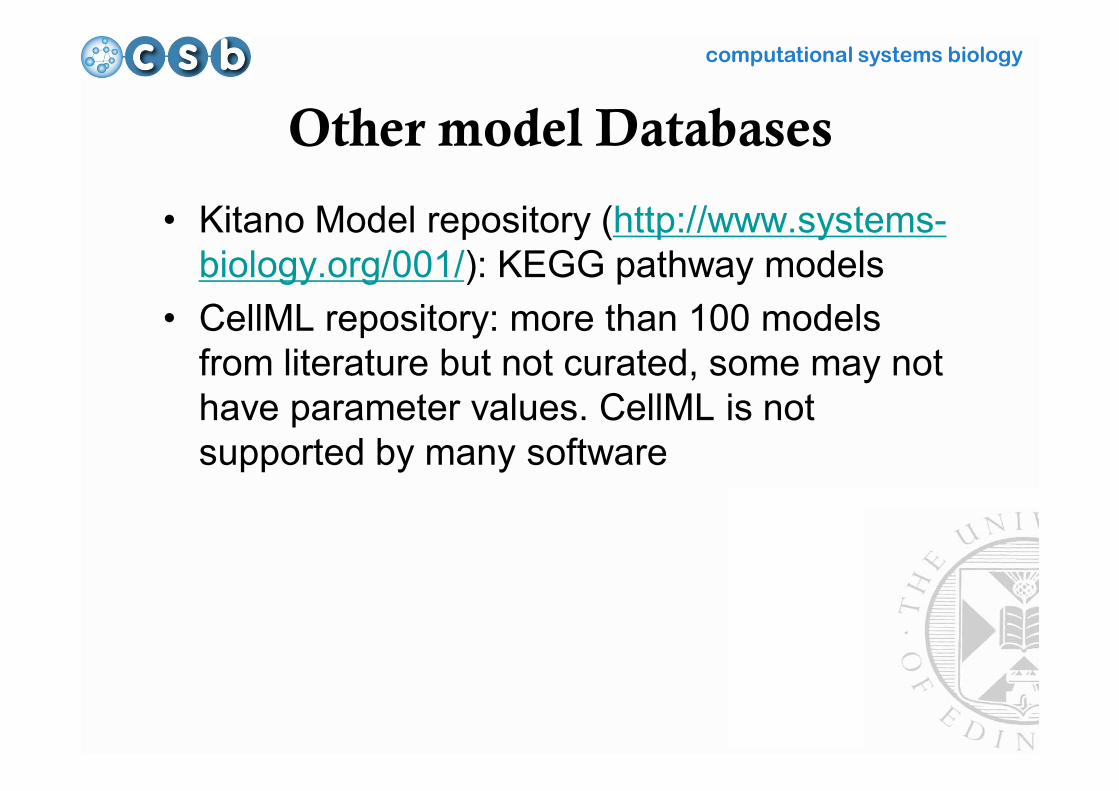
Other model Databases
• Kitano Model repository (http://www.systems-biology.org/001/): KEGG pathway models
• CellML repository: more than 100 models from literature but not curated, some may not have parameter values. CellML is not supported by many software
Top Related