


Languages
Pages
Legal


Computational Redesign of Acyl-ACP Thioesterase with Improved Selectivity toward Medium-Chain-Length Fatty Acids
Matthew J. Grisewooda,*, Néstor J. Hernandez Lozadab,*, James B. Thodenc, Nathanael P. Gifforda, Daniel Mendez-Perezb, Haley A. Schoenbergerb, Matthew F. Allana, Martha E. Floyb, Rung-Yi Laib, Hazel M. Holdenc, Brian F. Pflegerb, and Costas D. Maranasa,d
aDepartment of Chemical Engineering; Pennsylvania State University; 158 Fenske Laboratory; University Park, PA, 16802
bDepartment of Chemical and Biological Engineering; University of Wisconsin-Madison; 1415 Engineering Drive; Madison, WI, 53706
cDepartment of Biochemistry; University of Wisconsin-Madison; 440 Henry Mall; Madison, WI, 53706
Abstract
Enzyme and metabolic engineering offer the potential to develop biocatalysts for converting
natural resources into a wide range of chemicals. To broaden the scope of potential products
beyond natural metabolites, methods of engineering enzymes to accept alternative substrates
and/or perform novel chemistries must be developed. DNA synthesis can create large libraries of
enzyme-coding sequences, but most biochemistries lack a simple assay to screen for promising
enzyme variants. Our solution to this challenge is structure-guided mutagenesis in which
optimization algorithms select the best sequences from libraries based on specified criteria (i.e.
binding selectivity). Here, we demonstrate this approach by identifying medium-chain (C6-C12)
acyl-ACP thioesterases through structure-guided mutagenesis. Medium-chain fatty acids, products
of thioesterase-catalyzed hydrolysis, are limited in natural abundance compared to long-chain fatty
acids; the limited supply leads to high costs of C6-C10 oleochemicals such as fatty alcohols,
amines, and esters. Here, we applied computational tools to tune substrate binding to the highly-
active ‘TesA thioesterase in Escherichia coli. We used the IPRO algorithm to design thioesterase
variants with enhanced C12- or C8-specificity while maintaining high activity. After four rounds of
structure-guided mutagenesis, we identified three thioesterases with enhanced production of
dodecanoic acid (C12) and twenty-seven thioesterases with enhanced production of octanoic acid
(C8). The top variants reached up to 49% C12 and 50% C8 while exceeding native levels of total
free fatty acids. A comparably sized library created by random mutagenesis failed to identify
promising mutants. The chain length-preference of ‘TesA and the best mutant were confirmed in vitro using acyl-CoA substrates. Molecular dynamics simulations, confirmed by resolved crystal
structures, of ‘TesA variants suggest that hydrophobic forces govern ‘TesA substrate specificity.
We expect that the design rules we uncovered and the thioesterase variants identified will be useful
dTo whom correspondence should be addressed; [email protected]; (814) 863-9958.*Denotes co-first authorship
HHS Public AccessAuthor manuscriptACS Catal. Author manuscript; available in PMC 2018 January 25.
Published in final edited form as:ACS Catal. 2017 June 2; 7(6): 3837–3849. doi:10.1021/acscatal.7b00408.
Author M
anuscriptA
uthor Manuscript
Author M
anuscriptA
uthor Manuscript
to metabolic engineering projects aimed at sustainable production of medium-chain
oleochemicals.
Keywords
Molecular Dynamics; IPRO; Thioesterase; ‘TesA; Fatty Acid; Redesign; Dodecanoic Acid; Tetradecanoic Acid
Introduction
Free fatty acids (FFAs) are energy-rich precursors of membrane lipids, natural oils, liquid
transportation fuels (a.k.a. biodiesel), and high-value oleochemicals (e.g. fatty alcohols,
aldehydes, olefins, and waxes)1–4. Oleochemical properties such as energy content, melting
point, and volatility are dictated by the chain length, degree of saturation, and branching
pattern of the acyl-chain5. Fuels and oleochemicals derived from microbially produced FFAs
could displace current, unsustainable plant feedstocks and reduce carbon footprints relative
to petrochemical alternatives6–7. Unfortunately, natural sources of medium-chain length
FFAs and lipids are significantly less abundant than longer chain compounds. The limited
supply and costly petrochemical synthesis alternative leads to higher selling prices for
medium-chain oleochemicals (e.g., 1-octanol costs approximately twice as much as 1-
hexadecanol per pound)4. These economic drivers make bioproduction of medium-chain
length FFA and oleochemicals an attractive opportunity if biosynthesis pathways with high
yield and selectivity can be assembled and optimized.
While many oleochemical pathways have been demonstrated in model hosts, chain length
selectivity remains an unsolved challenge. The product distribution of most metabolic
engineering efforts has been restricted to the chain-length of the most abundant acyl-
thioester in the cell or the distribution created by expression of a thioesterase. Acyl chains
that comprise FFAs, lipids, and oleochemicals are made by an iterative series of elongation,
keto-reduction, dehydration and enoyl-reduction reactions acting on acyl-coenzyme A (acyl-
CoA) or acyl-acyl-carrier protein (acyl-ACP) thioesters4. An acyl-chain is elongated by two
carbon atoms per cycle until it is trans-esterified (into phospholipids, waxes, or esters),
reduced (to a fatty aldehyde or alcohol), or hydrolyzed (yielding a FFA)1. The chain length
distribution of these terminal products is controlled by the relative kinetics of elongation,
transesterification, reduction, and/or hydrolysis. In Escherichia coli, the activity of
phospholipid synthases (PlsB, PlsC) and fatty acid synthases (FabB, FabF, FabH) constrain
the lipid composition to mostly C16 or C18 acyl-chains with little FFA content8. In contrast,
E. coli can produce high titers of FFA with a wide range of chain-length distributions by the
upregulation of native thioesterases (TesA and TesB) or heterologous expression of plant and
bacterial thioesterases (see Table S1). In the absence of pathways for catabolizing FFA
and/or acyl-thioesters (i.e. beta-oxidation), the specificity of the acyl-ACP thioesterase
controls the chain-length distribution and the chemical properties of downstream
oleochemicals (see Figure 1). Collectively, thioesterases exhibit a wide range of substrate
specificities2, 9–14 that has been further diversified through protein engineering and
evolution15–17. Even with this known diversity, very few thioesterases are specific towards a
Grisewood et al. Page 2
ACS Catal. Author manuscript; available in PMC 2018 January 25.
Author M
anuscriptA
uthor Manuscript
Author M
anuscriptA
uthor Manuscript

single aliphatic chain length10. Worse, heterologous expression of thioesterases frequently
begets unexpected product distributions4, 10, poor FFA yields18–19, or both. Of the many
studied thioesterases, ‘TesA (a cytosolic E. coli TesA lacking the N-terminal signal peptide)
has been used extensively in metabolic engineering studies and has a crystallographically
resolved structure20. However, ‘TesA has broad substrate specificity with relatively low
medium-chain content2, 9. For these reasons, ‘TesA is an attractive system for applying
enzyme engineering to improve thioesterase selectivity towards medium chain lengths.
Enzyme engineering is generally pursued using directed evolution approaches that rely on
high-throughput screening of large mutant libraries21. These large libraries are constructed
using various mechanisms for diversifying the gene pool, including homologous (e.g., DNA
shuffling) or non-homologous (e.g., overlap extension PCR) recombination, random
mutagenesis (e.g., error-prone PCR), or combinations thereof (see Ref.22 for review). Large
library sizes rely on high-throughput screening that takes advantage of optical properties,
such as fluorescent or colorimetric assays. Currently, no high-throughput screen that can
discriminate between different FFA chain lengths has been developed. When optical screens
are unsuitable, more laborious experiments (e.g., mass spectrometry or NMR spectroscopy)
can be used in low-throughput screens that mandate small, more focused libraries. Focused
libraries can be generated through site saturation mutagenesis (e.g., degenerate
oligonucleotide-primed PCR) but this approach can only include a small number of sites
(three saturated sites would yield 8,000 variants) with a high percentage of inactive mutants.
Smaller library sizes can be formed through site-directed mutagenesis23 (i.e., rational
design) but so far it has been very difficult to forecast the effect of multiple mutations. When
a protein structure is known, molecular modeling tools can suggest a handful of promising
mutations while considering sequence-structure relationships as well as ther approximations.
Structure-based protein redesign procedures such as the Iterative Protein Redesign and
Optimization (IPRO) method24 used here, offer several advantages over tools that simply
suggest “hot spot” residues25–30, as they can capture the simultaneous effect of multiple
mutations. Another class of computational protein redesign tools uses mostly sequence
information to suggest crossover locations for generating combinatorial libraries31–37.
However, these combinatorial libraries are limited by the parental sequence space and do not
take full advantage of available structural information. De novo enzyme designs38–42 are
usually less active than native ones (without the aid of directed evolution)38–39, 41. Thus,
structure-based protein redesign can harness natural protein performance and suggest
directed modifications using structural insight to meet a single or multiple design objectives.
IPRO differs from other structure-based protein redesign procedures in that it employs a
mixed-integer linear program to guarantee a global minimum for a given protein backbone
structure, it can handle multiple decision criterion simultaneously, and distance restraints can
be easily imposed to keep catalytic machinery intact24, 43–44. More extensive reviews of
existing computational protein engineering procedures have been provided by Pantazes et al.45, Samish et al.46, and Huang et al.40
In this study, we applied the Iterative Protein Redesign and Optimization (IPRO) method24
to guide ‘TesA mutagenesis in search of variants that both improve medium-chain FFA
specificity and maintain high thioesterase activity. Specifically, we engineered ‘TesA to
Grisewood et al. Page 3
ACS Catal. Author manuscript; available in PMC 2018 January 25.
Author M
anuscriptA
uthor Manuscript
Author M
anuscriptA
uthor Manuscript
yield additional dodecanoic acid (C12:0) and octanoic acid (C8:0) at the expense of the
natively preferred tetradecanoic acid (C14:0). The employed redesign procedure involved
recursively predicting in silico ‘TesA mutants with enhanced binding capabilities, analyzing
the in vivo FFA composition, and modifying the computational explorations in a Design-
Build-Test-Learn cycle47. We identified three separate ‘TesA mutants that exhibited a
statistically significant (p<0.05) improvement in C12 composition over wild-type (WT) and
twenty-two mutants with a statistically significant improvement in C8 composition. In
comparison to previously studied thioesterases (see Table S1), our computationally predicted
mutants include four of the ten most C12-specific and one of the ten most C8-specific
thioesterases. While computational enzyme redesign that reaches industrially relevant
performance metrics has so far remained elusive45, the results presented here demonstrate
the potential of the adopted Design-Build-Test-Learn paradigm to pinpoint promising
enzyme mutants45, 47–48.
Results and Discussion
Overview of the Design-Build-Test-Learn approach
In support of efforts to alter the product profile of ‘TesA towards medium chain length
FFAs, we performed four rounds of site-directed mutagenesis structured around a Design-
Build-Test-Learn cycle (Figure 2). In each round, mutagenesis targets and specific amino
acid substitutions were selected after analyzing simulations of enzyme-substrate binding
performed with IPRO24. Genes encoding the designed ‘TesA variants were constructed by
Quikchange® or Gibson Assembly® of PCR products (Materials and Methods) and cloned
into arabinose-inducible expression vectors. The impact of each mutation was assessed by
quantifying the FFA content of a ‘TesA expressing E. coli culture (see Table S1). After each
round, the product distributions for each mutant were analyzed and used to improve to the
IPRO framework24 via changes in the scoring function parameters or refocusing the
mutagenesis targets. The following sections describe the deployment of our computational
enzyme Design phase, results of the Build-Test phase, and a discussion of what we have
Learned about thioesterase selectivity after each round.
IPRO constraints and implementation
IPRO enzyme redesign requires a three-dimensional model of the protein complex structure,
a set of predetermined mutatable residues known as design positions, and a set of constraints
that quantify the desired improvements that protein variants need to reach relative to wild-
type. Examples of such constraints include imposing relations that require a (i) stronger
interaction energy with the new substrate and (ii) weaker interaction energy with the native
substrate compared to wild-type. Here, we constructed a structural model of ‘TesA bound to
an acyl-ACP with acyl chains ranging from C8 to C14. The model was assembled from
published structures of ‘TesA (PDB 1U8U)20 and decanoyl-ACP (PDB 2FAE)49. Docking
between ‘TesA and octanoyl-ACP was modeled by systematically rotating the octanoyl-ACP
structure about its phosphopantetheine linker until it aligned with bound octanoic acid in the
‘TesA crystal structure (PDB 1U8U, Materials and Methods). Other ‘TesA:acyl-ACP
complexes were derived from the ‘TesA:octanoyl-ACP complex structure by adding atoms
to the ω-1 carbon (i.e., the carbon furthest from ACP) of the octanoyl-ACP structure. The
Grisewood et al. Page 4
ACS Catal. Author manuscript; available in PMC 2018 January 25.
Author M
anuscriptA
uthor Manuscript
Author M
anuscriptA
uthor Manuscript
IPRO algorithm was used to search for mutations that led to improved binding between
‘TesA and the desired substrate while simultaneously discouraging binding of undesired
substrate(s). Design positions for ‘TesA were selected based on proximity to the ω-1 carbon
of bound tetradecanoyl-ACP while not considering positions vital for catalytic turnover
(Materials and Methods). The fitness of each predicted variant was assessed using
interaction energy as a proxy for binding energy (i.e., ΔG) thereby reducing force field
dependence and requiring fewer calculations. Interaction energy is defined as GEnz:FFA,mm-
GEnz-GFFA, where G is Gibbs free energy, “Enz” represents the enzyme (‘TesA or a variant
thereof), and “min” indicates that the molecule(s) have undergone an energy minimization.
In contrast, binding energy is defined as GEnz:FFA,min -GEnz,min -GFFA,min. The first
constraint is aimed at worsening the interaction energy between ‘TesA and the native
substrate, tetradecanoyl-ACP (e.g., C14). This first constraint safeguards against binding to
even longer acyl-ACPs (e.g., C16, C18) because the repulsive interactions, which disfavor
interactions with the long acyl-ACP (e.g., C14 and longer), are further exaggerated due to
steric clashes or hydrophobicity. The second constraint requires interaction energy
improvements between ‘TesA and the medium-chain acyl-ACP (e.g., C12). The imposition
of the second constraint attempts to enhance binding with C12 or even shorter acyl-ACPs
(e.g., C8, C10).
IPRO operates by successively performing redesign iterations for a preset number of cycles
until a variant that simultaneously satisfies all constraints and optimizes the objective
function is found. IPRO has been applied previously to modify E. coli β-glucuronidase
substrate specificity50, alter the cofactor specificity of Candida boidnii xylose reductase51,
graft a calciumbinding pocket into Thermoactinomyces vulgaris thermitase or a copper-
binding pocket into E. coli thioredoxin52, and de novo design antibody variable regions that
target influenza hemagglutinin, HIV gp120 and Ebola GP1-GP2 viruses42. Each IPRO
iteration begins with a local backbone perturbation nearby a randomly selected design
position from the requisite input set. The second step implements a mixed integer linear
program (MILP) to identify the optimal set of amino acids for the new backbone
conformation. The third step of IPRO executes a local, rigid-body docking (i.e.,
intramolecular movements are prohibited and only relative positioning between the enzyme
and ligand is considered) to reorient the ligand (i.e., the acyl-ACP) within the binding site.
The fourth and fifth steps perform an energy minimization of the entire enzyme complex.
The sixth step and final steps evaluate the constraints set forth (i.e., (i) reducing binding to
C14 and (ii) increasing binding to C12). The results of the iteration are retained or discarded
based on the Metropolis criterion whereby worsening solutions are accepted with a decaying
exponential probability as in simulated annealing (see Ref.24 for further details). The two
constraints are imposed only at the ground state of the thioester hydrolysis with no
additional calculations at the transition state. Instead, simple restraints on catalytic distances
were imposed during all IPRO iterations so as to preserve, but not necessarily boost,
catalytic activity50. Multiple IPRO trajectories (~10 independent trajectories) were simulated
to discover alternative routes for improving specificity. For each variant, the difference of
interaction energies for the short and long acyl-ACP with ‘TesA (i.e., ΔIE = IEC12 − IEC14)
was calculated. The variants were prioritized based on the extent of the energy differences,
and 10-20 variants were selected to build a focused library for experimental testing.
Grisewood et al. Page 5
ACS Catal. Author manuscript; available in PMC 2018 January 25.
Author M
anuscriptA
uthor Manuscript
Author M
anuscriptA
uthor Manuscript
Method implementation for ‘TesA redesign
The first round (R1) of IPRO-guided mutagenesis helped tune the parameters of the scoring
function to improve prediction accuracy. Our initial objective was a modest shift in substrate
preference from C14 to C12, that makes up to 20% of the native ‘TesA product profile, in
order to assess the efficacy of the redesign protocol. Of twelve tested variants, one improved
C12 composition) and maintained WT production levels (i.e., ≥ WTTotal, p<0.05; R1.M1;
Table S1). In contrast, ten were inactive (i.e., < ControlTotal) and included more than two
charged substitutions (all except R1.M1 and R1.M2). The scoring function implemented
within IPRO’s MILP rotamer-residue selection algorithm was identified as the source of the
charged residue bias. The scoring function energy terms were re-weighted using logistic
regression on a dataset of high-quality protein structures53. The updated scoring function
roughly doubled native rotamer recovery relative to the existing scoring function (Materials
and Methods). The former scoring function was adequate for earlier systems24, 42, 50–52, but
the high hydrophobicity of ‘TesA (the energy term that was underemphasized in the former
scoring function) made this enzyme especially susceptible to unsuccessful designs.
The modified scoring function was used to design a second round (R2) of variants with
improved activity on C12 acyl chains. While all fourteen variants were active, thirteen
mutants (all except R2.M5) produced less total FFA than WT and none improved the C12
fraction (p<0.05). All thirteen variants incorporated a mutation at either position L11 or
G72. These positions were in hindsight deemed conserved (exhibiting 86.3% and 60.0%
sequence conservation, respectively, across the L1-like lysophospholipase subgroup of the
SGNH-hydrolase family) as they are immediately adjacent to S10 and N73 which are part of
the oxyanion hole20. Therefore, both L11 and G72 were eliminated from the list of design
positions in subsequent rounds.
The third round (R3) of mutagenesis, based on the updated set of design positions and
revised scoring function, resulted in a higher fraction of variants that maintained WT activity
(80.0%) compared to that of R1 and R2 (8.3% and 7.1%, respectively). Of the ten tested R3
designs, two improved the C12 product composition (R3.M1, R3.M8; p<0.05) and one led to
a major increase in the C8 mole fraction (R3.M4; p<0.005). Notably, as the design
constraints imposed by IPRO in rounds R1 through R3 did not preclude binding to acyl-
ACPs smaller than C12 (i.e., C6, C8, C10), it led to the serendipitous isolation of an octanoyl-
ACP dominant variant (R3.M4). The discovery of a C8 mutant R3.M4 and the higher
commercial value of octanoic acid4 prompted a final round of computational predictions
focusing on C8 composition only.
In the fourth round (R4), the IPRO imposed design constraints were similar to that of rounds
R1 through R3 except that dodecanoyl-ACP (the “desired substrate”) was replaced with
octanoyl-ACP, while tetradecanoyl-ACP (the “undesired substrate”) was replaced with
dodecanoyl-ACP. These changes were made to drive more aggressive mutagenesis towards
C8 preference. Of the eighteen R4 variants tested, all were active, sixteen maintained WT
FFA production levels (all except R4.M11 and R4.M12), thirteen improved the C8 mole
fraction, but none produced more octanoic acid than R3.M4. The reduced production levels
for R4.M11 and R4.M12 could be explained by the rearrangement of aromatic side chains in
Grisewood et al. Page 6
ACS Catal. Author manuscript; available in PMC 2018 January 25.
Author M
anuscriptA
uthor Manuscript
Author M
anuscriptA
uthor Manuscript
the binding crevice (i.e., R108F, F139, Y145, and Y145F) relative to the active R4 variants,
which may have disrupted the hydrophobicity of the binding crevice.
Through four rounds of the Design-Build-Test-Learn paradigm, 54 variants were tested, 43
were active, 25 maintained WT production levels (23 in R3-R4), 3 improved the C12 mole
fraction, and 27 raised C8 composition (see Tables S1 and S2). All three C12-specific
variants and all but six of the 27 C8-specific variants (R1.M2, R2.M2, R2.M3, R2.M4,
R3.M3, and R4.M12) maintained or exceeded WT production levels. The success rate of
computational enzyme design varies drastically based on the procedures employed, the
system studied and the ambition of the (re)design (published values can range from as low as
7% to as high as 78%), and the frequency of favorable outcomes from IPRO in this study
(24% for R1-R4, 43% for R3-R4) falls in line with these previously reported
values47–48, 54–57. The variant with the highest C12 mole fraction (48±8%, a 1.8-fold
improvement over WT), R3.M1, consisted of three mutations: S122K, Y145K, and L146K.
Despite attempting to target octanoic acid production in R4, the variant with the highest C8
mole fraction was R3.M4 (50±3%, a 10-fold improvement over WT), containing mutations
M141L, Y145K, and L146K. The FFA profiles for the top C12- and C8-specific variants are
summarized in Figure 3.
Computation-guided design outperforms random mutagenesis
Several of our best performing variants have a small number of mutations that may have
been recovered from classical random mutagenesis approaches. Therefore, we created a
small library of randomly mutated ‘TesA variants by error-prone PCR mutagenesis and
screened for changes in product profile. The purpose of this library was to provide a negative
control for testing that a library not directed by IPRO would not achieve the same level of
success. The FFA profile of 61 E. coli cultures harboring expression vectors for unique
‘TesA variants was measured (N=1). Of the 61 random mutants (RMs) screened, 46 were
active (i.e., ≥ 240 μM), and 20 maintained WT FFA production levels (i.e., ≥ 1750 μM). The
best dodecanoic acid producing RM (RM.M39, 44±6%) demonstrated a comparable C12
composition to the top computationally predicted variant (R3.M1, 48±8%) but at the
expense of a substantial reduction in total FFA titer (p<0.05, 80% of R3.M1). The best
octanoic acid producing RM (RM.M29, 21.9%) produced a lower fraction of C8 than R3.M4
(50±3%, 44% reduction) and displayed only 58% of the total activity of R3.M4 (see Table
S3). A comparison of these results shows that IPRO-guided mutagenesis generated more
hits, more active mutants, and better leads than a library of similar size made through
random mutagenesis.
Analysis of successful ‘TesA redesigns
The best C12 producing variants were dominated by three mutations: S122K, Y145K, and
L146K. Mutation S122K (R3.RD3, Table S1) alone was sufficient to shift the C12 fraction to
35% of total FFAs, equal to the best C12-producing mutant R3.M1. A non-polar mutation at
the same position (S122L – R3.RD4) had a similar but less pronounced shift towards C12 at
the expense of C14, indicating that S122 is an important residue in the active site (see Figure
S1). The additional mutations in R3.M1 (Y145K and L146K – equivalent to the R3.M7
mutation) also reduced the long-chain composition but produced a higher fraction of C8 and
Grisewood et al. Page 7
ACS Catal. Author manuscript; available in PMC 2018 January 25.
Author M
anuscriptA
uthor Manuscript
Author M
anuscriptA
uthor Manuscript
lower total activity. Nearly all of the top C8 producing variants contained a mutation at Y145
with lysine or phenylalanine as the dominant substituents. The best C8 producing mutant
(R3.M4) contained Y145K and L146K mutations as well as a M141L, which by itself
(R3.M2) was able to dramatically increase the C8 composition. The Y145K mutation
drastically increased the fraction of unsaturated products in the C12 and C14 chain lengths.
Crystal structures and simulations show that hydrophobic interactions govern specificity
Crystal structures of WT ‘TesA and R3.M4 bound to octanoic acid were solved to confirm
the structures predicted by IPRO and facilitate analysis of helpful mutations. The WT crystal
structure was very similar to the previously published structure20 with an all-atom root-
mean-square deviation (RMSD) of 1.1 Å. The X-ray resolved structures corroborated the
structures predicted by our computational methods, quantified by an all-atom RMSD of 1.6
Å for R3.M4:octanoyl-ACP (Figure 4). The structural differences in loop111-120 may have
affected IPRO’s ability to accept or reject mutations. However, the strong structural
similarity between the crystallized and modeled structure at positions M141L, Y145K and
L146K indicate that the conformation of these side chains is favorable despite the movement
of loop111-120. Comparison of the WT and R3.M4 structures reveal that the largest
differences (RMSD ≥ 2.5 Å) occur at (i) the mutated positions (M141L, Y145K, L146K),
(ii) the flexible regions as suggested by MD-derived B factors (L11-A19, Q32-S33, G44-
D45, N73, I107-R115 and D153-I156), (iii) the solvent-exposed residues adjacent to these
flexible loops (i.e., H157 and R160), and (iv) the C-terminus (i.e., L177, Figure 5). Whereas
structural differences in the flexible regions are possibly artifacts due to high residue
mobility, the structural differences at the mutated positions provide insight to enzyme
specificity determinants. The M141L side chain extends laterally towards the ω-1 carbon of
the FFA yielding an attractive dispersion force (Figure 6A). Y145K partially occludes the
binding crevice by forming a barrier between the ω-1 carbon of the FFA and solvent. L146K
forms a salt bridge with E143 that may stabilize the conformation of Y145K but does not
directly influence binding. Because mutant R3.M4’s (and all other active variants’) catalytic
machinery includes an oxyanion hole that necessitates a negative charge for binding, R3.M4
in complex with octanoic acid (pKa 4.9) was also crystallized at a higher pH to ensure
binding site occupancy. The additional experiments included crystallization at pH 7.5 and
crystallization at pH 5.0 followed by additional octanoic acid buffered at pH 7.5. These
additional experiments revealed substantial differences (RMSD ≥ 2.5 Å) at R16 (2.534 Å),
K34 (3.024 Å), A111 (4.362 Å), Y113 (9.311 Å), G114 (3.536 Å), and L177 (3.723 Å,
Figure S2). These highly flexible regions indicate that their movement is highly sensitive to
changes in hydrophobicity and their motion may be essential for catalytic turnover. The
structure of N112 was not solved for R3.M4 at pH 5.0 because of low-resolution electron
density maps.
MD simulations were used to elucidate the mechanisms by which FFA composition is
controlled. Seven total trajectories were analyzed using MD. These included WT (bound to
C14, C14, or C8 acyl-ACPs), R3.M1 (bound to C14 or C12), and R3.M4 (bound to C12 or C8).
The MD results revealed an alternate binding mode nearby T46, S47, N73, and R77 that is
only assumed for preferred chain lengths in the WT and R3.M4 trajectories. This binding
mode is likely not observed for R3.M1:dodecanoyl-ACP because of insufficient
Grisewood et al. Page 8
ACS Catal. Author manuscript; available in PMC 2018 January 25.
Author M
anuscriptA
uthor Manuscript
Author M
anuscriptA
uthor Manuscript
conformational sampling. In addition to the alternate binding mode, MD analysis revealed
that enzymes bound to acyl-ACPs beyond their preferred chain lengths have a deformed loop
between G75 and Q80. With the exception of R3.M4:octanoyl-ACP and WT:octanoyl-ACP,
all other enzymes bound to an acyl-ACP equal to or just below (≤ 2 carbon atoms) its
preferred chain length maintain a constant conformation of this loop (Figure S3). Finally, B
factors for each of the seven simulated enzymes were estimated and exhibited six regions
with increased mobility. These regions were found from L11-A19, Q32-S33, G44-D45, N73,
I107-R115, and D153-I156 .
Combining the MD and crystallography results with previously published investigations of
‘TesA acyl-ACP specificity20 support the theory that hydrophobic interactions formed
between loop75-80 (i.e., residues forming the loop between G75 and Q80), the acyl chain of
acyl-ACP, and loop111-120 govern substrate selectivity. Lo et al.20 previously postulated that
loop75-80, described therein as the “switch loop” that is in one conformation (i.e., “on”)
when the acyl-ACP is bound and in another conformation (i.e., “off’) when the substrate is
not bound. The switch loop is dependent on the acyl chain length and stabilizes the
enzyme:substrate complex during hydrolysis. Our MD simulations are consistent with these
findings, as the switch loop is in the “on” position for variants bound to an acyl-ACP equal
to or just less than (≤ 2 carbon atoms; i.e., WT bound to C12) its preferred chain length. Prior
studies20, 58 revealed that rigidity of the switch loop or the lack of a bound acyl-ACP force
the switch loop into the “off” conformation. MD simulations for WT:octanoyl-ACP,
R3.M1:tetradecanoyl-ACP, and R3.M4:dodecanoyl-ACP occupy intermediate states between
the “on” and “off” conformations. The switch loop is in a completely different conformation
for R3.M4:octanoyl-ACP, which is due to the increased hydrophobicity in the binding
crevice towards the C-1 terminus caused by M141L. For R3.M4:octanoyl-ACP, the
movement of the switch loop towards loop111-120 allows octanoyl-ACP to slide underneath
the switch loop into the alternate binding cavity, which could be important for octanoic acid
release. The pH-dependent conformation of loop111-120 for R3.M4 from the crystallography
experiments suggests that a change in protonation state of a titratable residue (i.e., an acidic
or basic amino acid) causes a major conformational change, demonstrating the sensitivity of
the hydrophobic region to electrostatics. At pH 7.5, the hydrophobic loop111-120 extends
away from the typically hydrophobic binding crevice towards the highly hydrophilic bulk
solvent (Figure S2), which is unexpected since nonpolar substances typically aggregate (i.e.,
the hydrophobic effect). This movement of loop111-120 is postulated to be due to a newly
charged residue in the binding crevice, weakening the binding crevice’s hydrophobic
environment. This observation is consistent with octanoic acid serving as the titratable
residue. While M141L increases the hydrophobicity near the C-8 of R3.M4, Y145K limits
hydrolysis of longer acyl-ACPs by reducing binding crevice hydrophobicity near the ω-1
atom (i.e., C-10, C-12, C-14) thereby disrupting the conformation of the switch loop. A
simple two-atom model involving the FFA ω-1 carbon and the ε-amino nitrogen (i.e., the
side chain nitrogen) atom had pairwise energies calculated and demonstrates that the
Lazaridis-Karplus solvation term, a computationally accessible proxy for hydrophobicity,
governs unfavorable interactions with the ω-1 carbon (Figure 6B). The two-atom model
illustrates that solvation energy dominates the phase space with the exception of the van der
Waals region. The ω-1 carbon would not be expected to occupy the van der Waals region
Grisewood et al. Page 9
ACS Catal. Author manuscript; available in PMC 2018 January 25.
Author M
anuscriptA
uthor Manuscript
Author M
anuscriptA
uthor Manuscript
because the energy is much more unfavorable (i.e., positive) at these close distances (E~r−12
for van der Waals, E~exp(-r2) for Lazaridis-Karplus solvation). Longer FFA chain lengths
extend closer to the ε-amino nitrogen, exacerbating the repulsive solvation energy. Adding
additional carbon atoms to the point where the ω-1 is further from the ε-amino nitrogen will
only add to the total repulsive energy, although the marginal cost will decrease with each
additional carbon. Finally, the large degree of switch loop and loop111-120 mobility could
explain the broad substrate specificity that is typically observed for ‘TesA.
ΔΔG (ΔGVariant−ΔGwt) values estimated from the computations exhibited good agreement
with experimentally derived values (Supporting Information). A Pearson correlation
coefficient of 0.6 ± 0.2 was found for R3 and 0.43 ± 0.07 for R4. These correlation
coefficients are in line with earlier computational studies24, 59–60. Notably, the regions with
elevated B factors from the MD trajectories (loop11-19, loop32-33, loop44-45, loop73,
loop107-115, and loop153-156) overlap with the regions with elevated B factors from the
crystallography experiments (loop30-35, loop59-62, loop98-100, loop111-115, and loop153) and
other published20, 58 crystallographic structures (loop31-35, loop75-80, and loop111-120).
In vitro assays of ‘TesA WT and R3.M4 C8-specific confirms in vivo results
‘TesA can catalyze hydrolysis of both acyl-CoA and acyl-ACP substrates. Given the relative
availability of these substrates, we compared the kinetic activity of WT ‘TesA and R3.M4 on
acyl-CoAs ranging from 6-16 carbons in length. We monitored reaction progress by tracking
the abundance of free CoA released by hydrolysis. The highest in vitro ‘TesA WT activity
(Figure 7A) was observed for C12-CoA, C14-CoA and C16-CoA, consistent with the in vivo data for release of FFAs from acyl-ACPs (Figure 3). In contrast, R3.M4 showed a significant
increase in activity on C8-CoA compared to WT, consistent with the observed in vivo production of octanoic acid, and a modest decrease in activity on C12-CoA and C14-CoA
activity. For both enzymes, we observed an unexpected drop in activity on hexadecanoyl-
CoA (C16-CoA) beyond a threshold concentration. Interestingly, in the R3.M4 mutant the
inhibitory effect of C16-CoA is exacerbated and C14-CoA also shows inhibition (not seen on
‘TesA WT). Given the linear reaction progress curves we observed, we suspected that the
enzymes were substrate inhibited. Therefore, we performed assays with both C8-CoA and
the inhibitory CoA species (Figure 7B–E). Competitive binding assays were performed at a
constant concentration of C8-CoA (50 μM) and variable concentrations of C14-CoA (Figure
7B for WT and 7C for R3.M4) and C16-CoA (Figure 7D for WT and 7E for R3.M4). In all
cases, production of free CoA was inhibited by C14-CoA and C16-CoA in a concentration
dependent manner consistent with the original assay in Figure 7A.
Conclusions
The potential of the IPRO algorithm to aid in protein engineering efforts was demonstrated
using a Design-Build-Test-Learn approach to alter the substrate preference of ‘TesA. Our
approach leverages computational protein design procedures to achieve successful
experimental redesign beyond what has been achievable so far15–17, yielding two top
variants. One, R3.M1, produced 48±8% C12 composition, a 1.8-fold improvement over WT,
while maintaining native production levels. Despite a preference for C14 production in WT
Grisewood et al. Page 10
ACS Catal. Author manuscript; available in PMC 2018 January 25.
Author M
anuscriptA
uthor Manuscript
Author M
anuscriptA
uthor Manuscript
‘TesA, three amino acid substitutions constitute R3.M1, which is the third most C12-specific
thioesterase known to date (see Table 1). Similarly, R3.M4 produced 50±3% C8
composition, a 10-fold improvement, while maintaining WT production levels. R3.M4 is the
tenth most C8-specific thioesterase described to date. In total, the Design-Build-Test-Learn
paradigm yielded three and twenty-one variants with significant (p<0.05) improvements in
C12 and C8 mole fraction, respectively, while maintaining WT production levels.
Despite sampling a similar library size, random mutagenesis yielded fewer active mutants
than the computationally guided library. In addition, the random library produced two fewer
C12-specific variants with native production levels and twenty fewer C8-specific variants
with at least WT productivity. Unlike random mutagenesis, variants from R3 and R4
achieved high levels of activity by directly enforcing catalytic contacts through imposed
restraints and preserving conserved amino acids. Furthermore, R3 and R4 variants
systematically tailored the binding crevice environment to generate hydrophobic clusters
between loop111-120, the acyl-ACP, and the switch loop (loop75-80). MD and crystallography
results from this work and elsewhere20, 58 suggest that this hydrophobic packing is essential
for enzyme functionality. Whereas the in silico method directly accounts for hydrophobicity
(albeit only approximately) through the Lazaridis-Karplus solvation energy term, random
mutagenesis techniques can only improve binding site hydrophobicity by chance alone.
The results from this work not only establish the potential of computational methods in
enzyme redesign, but the lessons learned from earlier rounds of design (i.e., R1 and R2) may
inform redesign work with other systems. Computational procedures are especially valuable
when high throughput screening is impractical. We found that the number of inactive
designs was reduced by applying a modified scoring function that alleviated bias towards
senseless mutations and avoiding design positions that are highly conserved in family
sequence alignments. These initial rounds thus established the essentiality of working with a
correctly calibrated scoring function and carefully selecting design positions with the aid of
sequence alignments. The integrated deployment of computations with experiments in a
sequential manner allows for the “early on” identification of deficiencies in molecular
modeling and erroneously targeted design positions, providing a tractable workflow for
engineering enzymes for higher specificity and activity.
Materials and methods
‘TesA model construction
The structure of ‘TesA was derived from PDB 1U8U, where it is in complex with octanoic
acid20. The acyl-ACP structures were derived from PDB 2FAE, where decanoyl-ACP is held
in an internal binding cavity49. Other acyl-ACP structures include hexanoyl-ACP from PDB
2FAC49 and heptanoyl-ACP from PDB 2FAD49 are similar to decanoyl-ACP as
demonstrated by respective all-atom RMSDs of 1.1 Å and 1.1 Å. In order to dock octanoyl-
ACP with ‘TesA, the acyl chain was systematically rotated about the phosphopantetheine
linker and superimposed with the bound octanoic acid in 1U8U. The rotation that led to the
lowest root-mean-square deviation was energy-minimized within CHARMM3461. Acyl-
ACPs with different chain lengths were adapted from this initial complex by either deleting
atoms or adding atoms using CHARMM’s internal coordinate system. Lazaridis-Karplus
Grisewood et al. Page 11
ACS Catal. Author manuscript; available in PMC 2018 January 25.
Author M
anuscriptA
uthor Manuscript
Author M
anuscriptA
uthor Manuscript

solvation files and CHARMM input files were constructed using published parameters for
lipids and proteins. The constructed topology and parameter files were in close agreement
with CGenFF-derived parameters62–63.
Structure-based redesign and analysis
All computationally-predicted mutants were identified using multiple IPRO trajectories that
each ran for 1000 iterations without ensemble structure refinements24. The primary
constraint of each trajectory was to eliminate binding to a larger acyl-ACPs (C14 for Rounds
1-3, C12 for Round 4) with a secondary constraint to improve binding to the shorter acyl-
ACPs (C12 for Rounds 1-3, C8 for Round 4). Round 4 C8/C14 and C8/C12 fraction ratios
correlate with r = 0.88 ± 0.02, alluding to a similar repulsive force for C12 and C14 binding
(Figure S4). Design position selection is described in the “Design Position Selection”
subsection. Restraints were imposed to ensure that the intermolecular catalytic distances
(± 0.2 Å) were maintained (i.e., S10, G44, N73, D154 and H157). All other IPRO
parameters were set to their standard values, and calculations were run on the Lion-XF
system at Penn State University. Error propagation was performed manually and replicated
using the Python uncertainties module64. Statistical differences were calculated using
Welch’s t-test between the WT and mutant FFA profiles. For a given enzyme-FFA complex,
the interaction energy is found using IE=GEnz-FFA,min−GEnz−GFFA. Mutants were sorted by
the interaction energy difference between the short-chain FFA and C14
(ΔIE=IEC12,C8−IEC14,C12). Therefore, for a given round, Mutant 1 (smallest ΔIE) would be
expected to show the biggest change in specificity.
Design Position Selection
For R1, ‘TesA residues were sorted by distance to carbon atoms in the acyl group of the
‘TesA:tetradecanoyl-ACP complex (i.e., C-1 through C-14). The minimum interatomic
distance between the residue’s heavy atoms (i.e., not hydrogen atoms) and the acyl carbon
atoms was used for sorting. In R1, residues constituting the catalytic triad (i.e., S10, D154,
H157) and the oxyanion hole (i.e., S10, G44, N73) were not considered during design
position selection. At the time design positions for R1 were designated, IPRO was unable to
handle mutations from proline so these residues were not considered during the selection of
design positions24. L109 was considered to be important for ‘TesA functionality and was
also removed from consideration as a design position20. Residues that were near the
undesired end of the acyl group (i.e., near C-1 instead of ω-1) were no longer regarded as
potential design positions. Residues considered “near C-1” were those that contained a
heavy atom within 4.5 Å of the thioester sulfur atom. A final set of residues that were
strongly oriented away from the ω-1 terminus of the acyl moiety were also no longer
considered as potential design positions. Residues “strongly oriented away from the ω-1
terminus” were those whose Cα atom was over 0.75 Å closer to the ω-1 atom than the Cβ atom (glycines not considered). The sorted residues are provided in Table S4 with any
exceptions annotated. The eight nearest residues that were not filtered out were selected as
design positions. The set of design positions used for R1 were L11, G72, L76, I107, R108,
A111, F139, and Y145.
Grisewood et al. Page 12
ACS Catal. Author manuscript; available in PMC 2018 January 25.
Author M
anuscriptA
uthor Manuscript
Author M
anuscriptA
uthor Manuscript
For R2, ‘TesA residues were once again sorted by distance to carbon atoms in the acyl group
of the ‘TesA:tetradecanoyl-ACP complex. Residues constituting the catalytic triad and
oxyanionic hole, proline residues, residues near the C-1 terminus of the acyl moiety, and
L109 were once again removed from consideration, as described for the R1 design position
selection procedure. In addition, residues belonging to the three flexible loops (i.e.,
loop31-35, loop75-80, loop111-120) were no longer recognized as prospective design positions
for the same reason that L109 was removed from consideration20. Finally, I107 and R108
were removed as possible design positions because these positions invariably mutated to
lysines in R1 and all instances of I107K and R108K abolished catalytic activity (see Figure
2, Table S2). The set of design positions (i.e., the eight nearest residues that were not filtered
out) employed for R2 was L11, G72, F139, M141, E142, Y145, G155, and I156.
For R3 and R4, a very different approach was used when compared to R1 and R2. Instead of
sorting residues by distance to carbon atoms in the acyl group of ‘TesA:tetradecanoyl-ACP,
residues were sorted by distance between the residue’s Cβ atom and the ω-1 atom of
dodecanoyl-ACP from the ‘TesA: dodecanoyl-ACP complex. In lieu of the Cβ atom, Cα was used to calculate interatomic distances for glycine residues, and Cγ was used for H180
because Cα and Cβ were not part of the solved crystal structure20. Unlike R1 and R2, only
residues that were aligned to gaps or had ≥40% sequence conservation were not considered
as candidate design positions. Sequence alignment was performed using the conserved
domain database, where 81 members (including ‘TesA) of the lysophospholipase L1-like
subgroup from the SGNH-hydrolase superfamily were found65. The sorted residues are
provided in Table S4. Residues aligned to gaps or conserved residues are also noted in Table
S4. The final set of design positions (i.e., the eight nearest residues that were not filtered out)
used for R3 and R4 was I107, R108, L109, S122, M141, E142, Y145, and L146.
Scoring function re-weighting
A new set of weights for the IPRO scoring function was found that approximately doubles
native rotamer recovery relative to the unmodified scoring function. The scoring function
was modified using a symmetric logistic regression within Weka, a collection of machine-
learning algorithms66. A dataset of native and non-native rotamers was collected from the
top8000 database, which is a dataset of 8000 high-resolution (< 2 Å), quality-filtered (< 2.0
MolProbity score67), nonhomologous (<70% identity) protein structures53. Of these
structures, 50 were randomly selected for use with the machine-learning training set. A
separate set of 80 structures was randomly selected to validate the results. From these 130
structures, the native rotamer was found by finding the rotamer (of the same amino acid
type) with the lowest root-mean-square deviation to the crystallized side chain. Then the van
der Waals, electrostatic, and Lazaridis-Karplus solvation energies were calculated for each
rotamer (regardless of amino acid type) as well as a binary indicator as to whether this was
the native rotamer at the position or not. The data was separated for residues at the protein
surface (≤ 20 Cβ atoms within 10 Å) and within the core of the protein (> 20 Cβ atoms
within 10 Å) using a distance-based metric developed by Kuhlman and Baker68. Finally,
since the number of non-native rotamers heavily outweighed the number of native rotamers,
non-native rotamers were randomly removed until there was approximately a 60:40 split of
non-native:native rotamers. The rotamer data was used to determine the set of weights that
Grisewood et al. Page 13
ACS Catal. Author manuscript; available in PMC 2018 January 25.
Author M
anuscriptA
uthor Manuscript
Author M
anuscriptA
uthor Manuscript
can optimally classify a rotamer as native or non-native. The updated energy equation for the
core residues is E = 0.04 EVDW + 0.02 EElec + 0.16 ELK. For the surface residues, the
updated energy equation is E = 0.03 EVDW + 0.01 EElec + 0.09 ELK. The inaccuracy of the
original scoring function that used equally-weighted energy terms (i.e., E = 0.01 EVDW
+ 0.01 EElec + 0.01 ELK) stemmed mostly from the Lazaridis-Karplus implicit solvation
energy term.
Using the modified scoring function weights, the classifier was able to correctly classify
78.4% of the core rotamers and 68.1% of the surface rotamers as either native or non-native
from the validation set. Revisiting the complete validation set (before modifying to the 60:40
ratio), the full set of rotamers for each position was sorted from lowest energy to highest.
The native rotamer was found to be the lowest-energy rotamer for 8.48% of the total dataset
for the modified scoring function, up from 3.46%. Furthermore, the native rotamer was in
the top 1.5%, 3.0%, and 6.0% of the energy-sorted rotamers in 19.09%, 31.64%, and 45.89%
of the time. This was up from 9.09%, 16.86%, and 30.36%, respectively, for the original
scoring function. Similar improvements were demonstrated on two different validation sets:
one used to train the Rosetta scoring function69 (native: 8.38% (3.57%), 1.5%: 18.56%
(8.79%), 3.0%: 13.01% (16.30%), 6.0%: 45.07% (29.20%)) and one on high-quality
antibody structures (native: 8.02% (4.00%), 1.5%: 16.68% (9.05%), 3.0%: 28.31%
(16.46%), 6.0%: 43.10% (30.19%)). The success of the modified scoring function on diverse
sets of protein structures that do not include ‘TesA implies that the new scoring function is
equally accurate across most (if not all) systems.
DNA synthesis and ‘TesA variant construction
All mutants were created starting with WT ‘tesA gene cloned into a pBAD18 plasmid70 to
link ‘TesA expression to the presence of L-arabinose. Round 1 mutants were constructed
using Agilent technologies QuickChange II site directed mutagenesis kit following the given
protocol. For Rounds 2-4, all mutants were constructed using Gibson assembly strategies
using primers containing the desired mutations in the 5′ tails. All cloning was performed in
E. coli DH5α strain.
‘TesA in pBad18 was randomly mutagenized using Gene Morph II random mutagenesis kit
following the kit protocol to make a library of 61 mutants with a mutation rate of 1.8 amino
acids per gene (Table S2). Primers were designed to include the start and stop codons to
ensure keeping those positions of the mutants invariant.
Bacterial culturing and fatty acid production
FFA production was assayed from small batch cultures (5-50 mL) of E. coli strain RL08ara
(K-12 MG1655 ΔfadD ΔaraBAD ΔaraFGH Φ(ΔaraEp PCP18-araE)3) harboring each
thioesterase expression vector. Three single colonies of each mutant were grown overnight
on LB media containing 100 mg/L of ampicillin. Overnight cultures of each strain were
diluted 1:100 into 25 mL of LB media containing 100 mg/L of ampicillin and 0.4% w/v
glycerol in a 250 mL baffled shake flask and grown at 37°C and 250 rpm. When the OD600
reached 0.2-0.3, cultures were induced with 0.2% w/v L-arabinose and shaken for 24 h. All
Grisewood et al. Page 14
ACS Catal. Author manuscript; available in PMC 2018 January 25.
Author M
anuscriptA
uthor Manuscript
Author M
anuscriptA
uthor Manuscript
mutants were tested in triplicate and error bars represent the standard error of the
measurements.
Lipid extraction and quantification
After 24 h post induction, 2.5 mL culture samples were collected in 10 mL glass centrifuge
tubes, and 5 μL of 10 g/L heptadecanoic acid in ethanol solution was added as an internal
standard. For fatty acid extraction into a chloroform layer, 100 mL of glacial acetic acid was
added, followed by 5 mL of a 1:1 v/v solution of chloroform and methanol. Samples were
vortexed and centrifuged for 10 min at 1000g to separate the layers. The chloroform extract
was dried using a SpeedVac SC250EXP concentrator at no heat setting for 75 minutes and
1.0 torr. Samples were further dried for 30 min in a lyophilizer to remove any residual liquid.
To methylate the dried extract, 0.5 mL of 1.25 M HCl in methanol was added and left
overnight at 50°C. Finally, 5 mL of a 100 g/L sodium bicarbonate solution was added and
fatty acid methyl esters were then extracted twice with 0.5 mL hexane for GC-FID
quantification. Samples were collected and analyzed using a GC-FID model Shimadzu
GC-2010 equipped with an AOC-20i auto-injector and a 30 m, 0.25 mm ID RTX-5 column.
The GC temperature protocol was 100°C for 2 min, ramp to 150°C (at 80°C/min), hold for 4
min, ramp to 218°C (at 4°C/min), ramp to 250°C (at 8°C/min), and hold for 2.5 min.
Protein expression and purification of WT ‘TesA
The WT ‘tesA gene was cloned into pET28t, a vector previously modified to contain a TEV
protease site rather than a thrombin cleavage site between ‘tesA and a N-terminal
polyhistidine tag71. When translated, the modified enzyme was fused to the following
peptide: MGSSHHHHHHSSENLYFQGGGG. The pET28t-tesA plasmid was used to
transform E. coli Rosetta2(DE3) cells (Novagen). Cultures were grown at 37°C with shaking
in lysogeny broth supplemented with 50 mg/L kanamycin and 50 mg/L chloramphenicol
until the OD600 reached 0.8. Flasks were cooled in an ice bath, induced with 1 mM
isopropyl-β-D-thiogalactopyranoside, and incubated overnight at 21°C. Cells were harvested
by centrifugation and frozen as pellets in liquid nitrogen. The frozen cell pellets were
sonicated on ice in a lysis buffer composed of 50 mM sodium phosphate, 20 mM imidazole,
10% glycerol, and 300 mM NaCl (pH 8.0). The lysate was cleared by centrifugation, and
‘TesA was purified at 4°C utilizing Ni-nitrilotriacetic acid resin (Qiagen) according to the
manufacturer’s instructions. TEV protease was added in a 1:20 molar ratio to the pooled
protein solution and subsequently dialyzed against 50 mM sodium phosphate, 300 mM
NaCl, and 20 imidazole (pH 8.0) at 4°C for 36 h. Both the TEV protease and the uncleaved
protein were removed by passage over a Ni-nitrilotriacetic acid resin. The cleaved protein
was collected and dialyzed against 10 mM Tris-HCl (pH 8.0) and 200 mM NaCl and
concentrated to ~35 g/L based on an extinction coefficient of 0.62 (g/L)−1cm−1.
Crystallization and structural analysis of WT ‘TesA
Crystallization conditions for ‘TesA were surveyed by the hanging drop method of vapor
diffusion using a laboratory-based sparse matrix screen. The enzyme was initially tested
either in the presence or absence of 3 mM C8 FFA. Crystals were subsequently grown from
22-26% poly(ethylene glycol) (PEG) 5000 with 100 mM Homo-PIPES buffer (pH 5.0). The
protein solution used contained 3 mM C8 FFA. Crystals belonged to the monoclinic space
Grisewood et al. Page 15
ACS Catal. Author manuscript; available in PMC 2018 January 25.
Author M
anuscriptA
uthor Manuscript
Author M
anuscriptA
uthor Manuscript

group P21 with unit cell dimensions of a = 40.9 Å, b = 82.1 Å, c = 53.9 Å, and P = 90.4°.
The asymmetric unit was comprised of two monomers. Prior to X-ray data collection at
100K, the crystals were transferred to a cryoprotectant solution composed of 30% PEG
5000, 250 mM NaCl, 3 mM C8 FFA, and 13% ethylene glycol with Homo-PIPES buffer
(pH 5.0). An X-ray data set was collected with a Bruker AXS Platinum-135 CCD detector
using the PROTEUM software suite (Bruker AXS Inc.) The X-ray source was Cu Ka
radiation from a Rigaku RU200 X-ray generator equipped with Montel optics and operated
at 50 kV and 90 mA. Data were processed with SAINT and scaled with SADABS (Bruker
AXS Inc.). X-ray data collection statistics are listed in Table S5. The structure of WT ‘TesA
was solved via molecular replacement using the software package PHASER72 and the PDB
1U8U as the search model20. Model refinement with REFMAC73 and manual model
building with COOT74–75 reduced the overall R-factor to 18.8% at 1.65 A resolution.
Refinement statistics are presented in Table S6.
Crystallization and structural analysis of R3.M4
The R3.M4 ‘tesA gene was subcloned, expressed, and purified as described for WT. Crystals
were obtained at both pH 5.0 and pH 7.5. Those obtained at pH 5.0 were grown from
20-25% PEG 5000 with 100 mM Homo-PIPES buffer (protein solution contained 3 mM C8
FFA). The crystals were cryoprotected as described for WT ‘TesA. Crystals belonged to the
monoclinic space group P21 with unit cell dimensions of a = 40.7 Å, b = 55.2 Å, c = 42.3 Å,
and P = 105.2° with a single monomer in the asymmetric unit. R3.M4 crystals obtained at
pH 7.5 were grown from 24-28% PEG with 100 mM HEPES buffer (pH 7.5). Again the
protein solution contained 3 mM C8 FFA. These crystals were isomorphous to those
obtained at pH 5.0 and were cryoprotected with a solution composed of 32% PEG, 250 mM
NaCl, 3 mM C8 FFA, and 13% ethylene glycol with 100 mM HEPES buffer (pH 7.5). Given
the concern that at pH 5.0 the C8 FFA would most likely not bind at full occupancy, these
crystals were subsequently moved in a final experiment to solutions buffered at pH 7.5 that
contained an additional 3 mM C8 FFA. These “soaked” crystals were cryoprotected in a
similar manner to those grown at pH 7.5. X-ray data from R3.M4 crystals obtained at pH
5.0, pH 7.5, and from the “soaked” crystals were collected as described for WT. The
structure R3.M4 at pH 5.0 was solved by molecular replacement using the WT model as the
search probe whereas the structures either grown or soaked at pH 7.5 were solved via
Fourier difference analyses. X-ray data collection statistics and model refinement statistics
are provided in Tables S5 and S6, respectively.
Purification for enzymatic assays of WT ‘TesA and R3.M4
The ‘tesA gene was subcloned as described for WT. Expression followed the same
procedure, except the construct was transformed into BL21(DE3) cells. The frozen cell
pellets were sonicated on ice in a lysis buffer composed of 50 mM sodium phosphate, 10
mM imidazole, and 300 mM NaCl (pH 8.0). The lysate was cleared by centrifugation, and
‘TesA was purified at 20°C utilizing Ni-nitrilotriacetic acid resin (Qiagen) according to the
manufacturer’s instructions. TEV protease was added in a 1:20 molar ratio to the pooled
protein solution and subsequently dialyzed against 10 mM Tris-HCl (pH 7.5) at 4°C for 18
h. Both the TEV protease and the uncleaved protein were removed by passage over a Ni-
nitrilotriacetic acid resin. The cleaved protein was concentrated to 2.5 mL to be solvent
Grisewood et al. Page 16
ACS Catal. Author manuscript; available in PMC 2018 January 25.
Author M
anuscriptA
uthor Manuscript
Author M
anuscriptA
uthor Manuscript
exchanged into 50mM potassium phosphate (pH 7.0), and 30% glycerol using a PD-10
desalting column (GE) according to the manufacturer’s instructions.
Enzymatic assays of WT ‘TesA and R3.M4
Enzymatic thioesterase assay was performed with WT and R3.M4 ‘TesA to compare their
activities on various chain lengths. The reaction conditions follow as per Shin et al. (63),
except the enzyme concentration used was 40 nM and substrate concentrations ranged 0-120
μM for six saturated acyl-CoA substrates of 6-16 carbons (hexanoyl-CoA, octanoyl-CoA,
decanoyl-CoA, dodecanoyl-CoA, tetradecanoyl-CoA and hexadecanoyl-CoA). The assay
tracks generation of free-CoA as ‘TesA hydrolyses the thiol bond in the acyl-CoA. This
hydrolysis is tracked by the increase of absorbance at 412 nm due to the free-CoA dependent
reduction of 5,5′-dithiobis-(2-nitrobenzoic acid) (DTNB) present in the reaction mixture
(63). Absorbance at 412 nm was followed using a NanoDrop 2000c (Thermo Scientific)
using a path length of 10 mm and measurements were taken for 2 minutes in 10 second
intervals.
Molecular dynamics
VMD was used to solvate enzyme-FFA complexes within a 12.0 Å water box with 0.17 M
NaCl and contained ≈49,000 atoms76. Each complex was minimized and slowly heated to
310K and 1 atm over 7 ns using Langevin dynamics. Force field parameters were identical to
those used for the IPRO trajectories. Periodic boundary conditions were applied, and long-
range electrostatic forces were considered using the particle mesh Ewald method. 40 ns
production simulations were performed using NAMD over 30 nodes on the Lion-XF cluster
at Penn State University using the NVE ensemble77.
Supplementary Material
Refer to Web version on PubMed Central for supplementary material.
Acknowledgments
Support for this work was provided by the National Science Foundation Award CBET-0967062, CBET-1149678, the Advanced Research Projects Agency-Energy Award DE-AR0000431, and the National Institutes of Health (NIH GM115921). Nestor Hernandez-Lozada is the recipient of a NIH Chemistry-Biology Interface Training Program fellowship (T32 GM008505) and a Graduate Engineering Research Scholars fellowship from the UW-Madison College of Engineering.
References
1. Lennen RM, Pfleger BF. Microbial production of fatty acid-derived fuels and chemicals. Curr Opin Biotech. 2013; 24(6):1044–1053. [PubMed: 23541503]
2. Steen EJ, Kang YS, Bokinsky G, Hu ZH, Schirmer A, McClure A, del Cardayre SB, Keasling JD. Microbial production of fatty-acid-derived fuels and chemicals from plant biomass. Nature. 2010; 463(7280):559–U182. [PubMed: 20111002]
3. Lennen RM, Braden DJ, West RM, Dumesic JA, Pfleger BF. A Process for Microbial Hydrocarbon Synthesis: Overproduction of Fatty Acids in Escherichia coli and Catalytic Conversion to Alkanes. Biotechnol Bioeng. 2010; 106(2):193–202. [PubMed: 20073090]
4. Pfleger BF, Gossing M, Nielsen J. Metabolic engineering strategies for microbial synthesis of oleochemicals. Metabolic engineering. 2015; 29:1–11. [PubMed: 25662836]
Grisewood et al. Page 17
ACS Catal. Author manuscript; available in PMC 2018 January 25.
Author M
anuscriptA
uthor Manuscript
Author M
anuscriptA
uthor Manuscript

5. Knothe G. “Designer” biodiesel: Optimizing fatty ester (composition to improve fuel properties. Energ Fuel. 2008; 22(2):1358–1364.
6. Howard TP, Middelhaufe S, Moore K, Edner C, Kolak DM, Taylor GN, Parker DA, Lee R, Smirnoff N, Aves SJ, Love J. Synthesis of customized petroleum-replica fuel molecules by targeted modification of free fatty acid pools in Escherichia coli. Proceedings of the National Academy of Sciences of the United States of America. 2013; 110(19):7636–7641. [PubMed: 23610415]
7. Liao JC, Mi L, Pontrelli S, Luo S. Fuelling the future: microbial engineering for the production of sustainable biofuels. Nat Rev Microbiol. 2016; 14(5):288–304. [PubMed: 27026253]
8. Magnuson K, Jackowski S, Rock CO, Cronan JE Jr. Regulation of fatty acid biosynthesis in Escherichia coli. Microbiol Rev. 1993; 57(3):522–42. [PubMed: 8246839]
9. Choi YJ, Lee SY. Microbial production of short-chain alkanes. Nature. 2013; 502(7472):571–+. [PubMed: 24077097]
10. Jing FY, Cantu DC, Tvaruzkova J, Chipman JP, Nikolau BJ, Yandeau-Nelson MD, Reilly PJ. Phylogenetic and experimental characterization of an acyl-ACP thioesterase family reveals significant diversity in enzymatic specificity and activity. Bmc Biochem. 2011; 12
11. Zhang X, Li M, Agrawal A, San KY. Efficient free fatty acid production in Escherichia coli using plant acyl-ACP thioesterases. Metabolic engineering. 2011; 13(6):713–22. [PubMed: 22001432]
12. Lu X, Vora H, Khosla C. Overproduction of free fatty acids in E. coli: implications for biodiesel production. Metabolic engineering. 2008; 10(6):333–9. [PubMed: 18812230]
13. Voelker TA, Davies HM. Alteration of the specificity and regulation of fatty acid synthesis of Escherichia coli by expression of a plant medium-chain acyl-acyl carrier protein thioesterase. J Bacteriol. 1994; 176(23):7320–7. [PubMed: 7961504]
14. Dormann P, Voelker TA, Ohlrogge JB. Cloning and Expression in Escherichia-Coli of a Novel Thioesterase from Arabidopsis-Thaliana Specific for Long-Chain Acyl-Acyl Carrier Proteins. Arch Biochem Biophys. 1995; 316(1):612–618. [PubMed: 7840673]
15. Hom L, Trinh N, Alibhai M. Methods and compositions related to thioesterase enzymes. 2010
16. Jing, F. ProQuest Dissertations. 2013. Characterization of acyl-ACP thioesterases for the purpose of diversifying fatty acid synthesis pathway. Publishing
17. Mayer KM, Shanklin J. Identification of amino acid residues involved in substrate specificity of plant acyl-ACP thioesterases using a bioinformatics-guided approach. Bmc Plant Biol. 2007; 7
18. Zhang FZ, Carothers JM, Keasling JD. Design of a dynamic sensor-regulator system for production of chemicals and fuels derived from fatty acids. Nature biotechnology. 2012; 30(4):354–U166.
19. Liu T, Vora H, Khosla C. Quantitative analysis and engineering of fatty acid biosynthesis in E. coli. Metabolic engineering. 2010; 12(4):378–86. [PubMed: 20184964]
20. Lo Y-C, Lin S-C, Shaw J-F, Liaw Y-C. Substrate Specificities of Escherichia coli Thioesterase I/Protease I/Lysophospholipase L1 Are Governed by Its Switch Loop Movement†. Biochemistry. 2005; 44(6):1971–1979. [PubMed: 15697222]
21. Bloom JD, Meyer MM, Meinhold P, Otey CR, MacMillan D, Arnold FH. Evolving strategies for enzyme engineering. Curr Opin Struc Biol. 2005; 15(4):447–452.
22. Packer MS, Liu DR. Methods for the directed evolution of proteins. Nat Rev Genet. 2015; 16(7):379–394. [PubMed: 26055155]
23. Gajewski J, Pavlovic R, Fischer M, Boles E, Grininger M. Engineering fungal de novo fatty acid synthesis for short chain fatty acid production. Nat Commun. 2017; 8:14650. [PubMed: 28281527]
24. Pantazes RJ, Grisewood MJ, Li T, Gifford NP, Maranas CD. The Iterative Protein Redesign and Optimization (IPRO) suite of programs. J Comput Chem. 2014
25. Pavelka A, Chovancova E, Damborsky J. HotSpot Wizard: a web server for identification of hot spots in protein engineering. Nucleic Acids Res. 2009; 37:W376–83. (Web Server issue). [PubMed: 19465397]
26. Grosdidier S, Fernandez-Recio J. Identification of hot-spot residues in protein-protein interactions by computational docking. BMC bioinformatics. 2008; 9:447. [PubMed: 18939967]
27. Zheng H, Reetz MT. Manipulating the stereoselectivity of limonene epoxide hydrolase by directed evolution based on iterative saturation mutagenesis. J Am Chem Soc. 2010; 132(44):15744–51. [PubMed: 20958062]
Grisewood et al. Page 18
ACS Catal. Author manuscript; available in PMC 2018 January 25.
Author M
anuscriptA
uthor Manuscript
Author M
anuscriptA
uthor Manuscript
28. Kortemme T, Baker D. A simple physical model for binding energy hot spots in protein-protein complexes. Proceedings of the National Academy of Sciences of the United States of America. 2002; 99(22):14116–21. [PubMed: 12381794]
29. Kortemme T, Kim DE, Baker D. Computational alanine scanning of protein-protein interfaces. Sci STKE. 2004; 2004(219):pl2. [PubMed: 14872095]
30. Darnell SJ, Page D, Mitchell JC. An automated decision-tree approach to predicting protein interaction hot spots. Proteins. 2007; 68(4):813–23. [PubMed: 17554779]
31. Kawarasaki Y, Griswold KE, Stevenson JD, Selzer T, Benkovic SJ, Iverson BL, Georgiou G. Enhanced crossover SCRATCHY: construction and high-throughput screening of a combinatorial library containing multiple non-homologous crossovers. Nucleic Acids Res. 2003; 31(21):e126. [PubMed: 14576326]
32. Meyer MM, Hochrein L, Arnold FH. Structure-guided SCHEMA recombination of distantly related beta-lactamases. Protein Eng Des Sel. 2006; 19(12):563–70. [PubMed: 17090554]
33. Voigt CA, Martinez C, Wang ZG, Mayo SL, Arnold FH. Protein building blocks preserved by recombination. Nature structural biology. 2002; 9(7):553–8. [PubMed: 12042875]
34. Pantazes RJ, Saraf MC, Maranas CD. Optimal protein library design using recombination or point mutations based on sequence-based scoring functions. Protein Eng Des Sel. 2007; 20(8):361–73. [PubMed: 17686879]
35. Moore GL, Maranas CD. Computational challenges in combinatorial library design for protein engineering. AIChE Journal. 2004; 50(2):262–272.
36. Saraf MC, Maranas CD. Using a residue clash map to functionally characterize protein recombination hybrids. Protein engineering. 2003; 16(12):1025–34. [PubMed: 14983083]
37. Moore GL, Maranas CD. Identifying residue-residue clashes in protein hybrids by using a second-order mean-field approach. Proceedings of the National Academy of Sciences of the United States of America. 2003; 100(9):5091–6. [PubMed: 12700353]
38. Rothlisberger D, Khersonsky O, Wollacott AM, Jiang L, DeChancie J, Betker J, Gallaher JL, Althoff EA, Zanghellini A, Dym O, Albeck S, Houk KN, Tawfik DS, Baker D. Kemp elimination catalysts by computational enzyme design. Nature. 2008; 453(7192):190–U4. [PubMed: 18354394]
39. Jiang L, Althoff EA, Clemente FR, Doyle L, Rothlisberger D, Zanghellini A, Gallaher JL, Betker JL, Tanaka F, Barbas CF, Hilvert D, Houk KN, Stoddard BL, Baker D. De novo computational design of retro-aldol enzymes. Science. 2008; 319(5868):1387–1391. [PubMed: 18323453]
40. Huang PS, Boyken SE, Baker D. The coming of age of de novo protein design. Nature. 2016; 537(7620):320–7. [PubMed: 27629638]
41. Garrabou X, Wicky BI, Hilvert D. Fast Knoevenagel Condensations Catalyzed by an Artificial Schiff-Base-Forming Enzyme. J Am Chem Soc. 2016; 138(22):6972–4. [PubMed: 27196438]
42. Li T, Pantazes RJ, Maranas CD. OptMAVEn–a new framework for the de novo design of antibody variable region models targeting specific antigen epitopes. PLoS One. 2014; 9(8):e105954. [PubMed: 25153121]
43. Fazelinia H, Cirino PC, Maranas CD. Extending Iterative Protein Redesign and Optimization (IPRO) in protein library design for ligand specificity. Biophys J. 2007; 92(6):2120–30. [PubMed: 17208966]
44. Saraf MC, Moore GL, Goodey NM, Cao VY, Benkovic SJ, Maranas CD. IPRO: an iterative computational protein library redesign and optimization procedure. Biophys J. 2006; 90(11):4167–80. [PubMed: 16513775]
45. Pantazes RJ, Grisewood MJ, Maranas CD. Recent advances in computational protein design. Curr Opin Struct Biol. 2011; 21(4):467–72. [PubMed: 21600758]
46. Samish I, MacDermaid CM, Perez-Aguilar JM, Saven JG. Theoretical and computational protein design. Annual review of physical chemistry. 2011; 62:129–49.
47. Privett HK, Kiss G, Lee TM, Blomberg R, Chica RA, Thomas LM, Hilvert D, Houk KN, Mayo SL. Iterative approach to computational enzyme design. Proceedings of the National Academy of Sciences of the United States of America. 2012; 109(10):3790–5. [PubMed: 22357762]
48. Baker D. An exciting but challenging road ahead for computational enzyme design. Protein Sci. 2010; 19(10):1817–1819. [PubMed: 20717908]
Grisewood et al. Page 19
ACS Catal. Author manuscript; available in PMC 2018 January 25.
Author M
anuscriptA
uthor Manuscript
Author M
anuscriptA
uthor Manuscript
49. Roujeinikova A, Simon WJ, Gilroy J, Rice DW, Rafferty JB, Slabas AR. Structural studies of fatty acyl-(acyl carrier protein) thioesters reveal a hydrophobic binding cavity that can expand to fit longer substrates. J Mol Biol. 2007; 365(1):135–45. [PubMed: 17059829]
50. Grisewood MJ, Gifford NP, Pantazes RJ, Li Y, Cirino PC, Janik MJ. OptZyme: Computational Enzyme Redesign Using Transition State Analogues. PLoS ONE. 2013; 8(10):e75358. [PubMed: 24116038]
51. Khoury GA, Fazelinia H, Chin JW, Pantazes RJ, Cirino PC, Maranas CD. Computational design of Candida boidinii xylose reductase for altered cofactor specificity. Protein Sci. 2009; 18(10):2125–38. [PubMed: 19693930]
52. Fazelinia H, Cirino PC, Maranas CD. OptGraft: A computational procedure for transferring a binding site onto an existing protein scaffold. Protein Sci. 2009; 18(1):180–95. [PubMed: 19177362]
53. Richardson JS, Keedy DA, Richardson DC. “the Plot” Thickens: More Data, More Dimensions, More Uses. Biomolecular Forms and Functions: A Celebration of 50 Years of the Ramachandran Map. 2013:46–61.
54. Feldmeier K, Hocker B. Computational protein design of ligand binding and catalysis. Curr Opin Chem Biol. 2013; 17(6):929–33. [PubMed: 24466576]
55. Khare SD, Kipnis Y, Greisen PJr, Takeuchi R, Ashani Y, Goldsmith M, Song Y, Gallaher JL, Silman I, Leader H, Sussman JL, Stoddard BL, Tawfik DS, Baker D. Computational redesign of a mononuclear zinc metalloenzyme for organophosphate hydrolysis. Nat Chem Biol. 2012; 8(3):294–300. [PubMed: 22306579]
56. Gordon SR, Stanley EJ, Wolf S, Toland A, Wu SJ, Hadidi D, Mills JH, Baker D, Pultz IS, Siegel JB. Computational design of an alpha-gliadin peptidase. J Am Chem Soc. 2012; 134(50):20513–20. [PubMed: 23153249]
57. Chen CY, Georgiev I, Anderson AC, Donald BR. Computational structure-based redesign of enzyme activity. Proceedings of the National Academy of Sciences of the United States of America. 2009; 106(10):3764–9. [PubMed: 19228942]
58. Lo YC, Lin SC, Shaw JF, Liaw YC. Crystal structure of Escherichia coli thioesterase I/protease I/lysophospholipase L-1: Consensus sequence blocks constitute the catalytic center of SGNH-hydrolases through a conserved hydrogen bond network. J Mol Biol. 2003; 330(3):539–551. [PubMed: 12842470]
59. Morozov AV, Havranek JJ, Baker D, Siggia ED. Protein-DNA binding specificity predictions with structural models. Nucleic Acids Res. 2005; 33(18):5781–98. [PubMed: 16246914]
60. Meiler J, Baker D. ROSETTALIGAND: protein-small molecule docking with full side-chain flexibility. Proteins. 2006; 65(3):538–48. [PubMed: 16972285]
61. Brooks BR, Brooks CL 3rd, Mackerell AD Jr, Nilsson L, Petrella RJ, Roux B, Won Y, Archontis G, Bartels C, Boresch S, Caflisch A, Caves L, Cui Q, Dinner AR, Feig M, Fischer S, Gao J, Hodoscek M, Im W, Kuczera K, Lazaridis T, Ma J, Ovchinnikov V, Paci E, Pastor RW, Post CB, Pu JZ, Schaefer M, Tidor B, Venable RM, Woodcock HL, Wu X, Yang W, York DM, Karplus M. CHARMM: the biomolecular simulation program. J Comput Chem. 2009; 30(10):1545–614. [PubMed: 19444816]
62. Vanommeslaeghe K, MacKerell AD. Automation of the CHARMM General Force Field (CGenFF) I: Bond Perception and Atom Typing. J Chem Inf Model. 2012; 52(12):3144–3154. [PubMed: 23146088]
63. Vanommeslaeghe K, Raman EP, MacKerell AD. Automation of the CHARMM General Force Field (CGenFF) II: Assignment of Bonded Parameters and Partial Atomic Charges. J Chem Inf Model. 2012; 52(12):3155–3168. [PubMed: 23145473]
64. Lebigot, EO. Uncertainties: a Python package for calculations with uncertainties. http://pythonhosted.org/uncertainties/ (accessed February 23)
65. Marchler-Bauer A, Derbyshire MK, Gonzales NR, Lu SN, Chitsaz F, Geer LY, Geer RC, He J, Gwadz M, Hurwitz DI, Lanczycki CJ, Lu F, Marchler GH, Song JS, Thanki N, Wang ZX, Yamashita RA, Zhang DC, Zheng CJ, Bryant SH. Cdd: Ncbi’s Conserved Domain Database. Nucleic Acids Res. 2015; 43(D1):D222–D226. [PubMed: 25414356]
Grisewood et al. Page 20
ACS Catal. Author manuscript; available in PMC 2018 January 25.
Author M
anuscriptA
uthor Manuscript
Author M
anuscriptA
uthor Manuscript
66. Hall M, Frank E, Holmes G, Pfahringer B, Reutemann P, Witten IH. The WEKA data mining software: an update. SIGKDD Explor Newsl. 2009; 11(1):10–18.
67. Davis IW, Murray LW, Richardson JS, Richardson DC. MolProbity: structure validation and all-atom contact analysis for nucleic acids and their complexes. Nucleic Acids Res. 2004; 32:W615–W619. [PubMed: 15215462]
68. Kuhlman B, Baker D. Native protein sequences are close to optimal for their structures. Proceedings of the National Academy of Sciences of the United States of America. 2000; 97(19):10383–10388. [PubMed: 10984534]
69. Huang YM, Bystroff C. Expanded Explorations into the Optimization of an Energy Function for Protein Design. Ieee Acm T Comput Bi. 2013; 10(5):1176–1187.
70. Guzman LM, Belin D, Carson MJ, Beckwith J. Tight Regulation, Modulation, and High-Level Expression by Vectors Containing the Arabinose P-Bad Promoter. J Bacteriol. 1995; 177(14):4121–4130. [PubMed: 7608087]
71. Thoden JB, Holden HM. The molecular architecture of human N-acetylgalactosamine kinase. The Journal of biological chemistry. 2005; 280(38):32784–91. [PubMed: 16006554]
72. McCoy AJ, Grosse-Kunstleve RW, Adams PD, Winn MD, Storoni LC, Read RJ. Phaser crystallographic software. J Appl Cryst. 2007; 40:658–674. [PubMed: 19461840]
73. Murshudov GN, Vagin AA, Dodson EJ. Refinement of macromolecular structures by the maximum-likelihood method. Acta Crystallogr D Biol Crystallogr. 1997; 53:240–55. [PubMed: 15299926]
74. Emsley P, Cowtan K. Coot: model-building tools for molecular graphics. Acta Crystallogr D Biol Crystallogr. 2004; 60(Pt 12 Pt 1):2126–32. [PubMed: 15572765]
75. Emsley P, Lohkamp B, Scott WG, Cowtan K. Features and development of Coot. Acta Crystallogr D Biol Crystallogr. 2010; 66(Pt 4):486–501. [PubMed: 20383002]
76. Humphrey W, Dalke A, Schulten K. VMD: visual molecular dynamics. Journal of molecular graphics. 1996; 14(1):33–8. 27–8. [PubMed: 8744570]
77. Phillips JC, Braun R, Wang W, Gumbart J, Tajkhorshid E, Villa E, Chipot C, Skeel RD, Kale L, Schulten K. Scalable molecular dynamics with NAMD. J Comput Chem. 2005; 26(16):1781–1802. [PubMed: 16222654]
78. Ghosh SK, Bhattacharjee A, Jha JK, Mondal AK, Maiti MK, Basu A, Ghosh D, Ghosh S, Sen SK. Characterization and cloning of a stearoyl/oleoyl specific fatty acyl-acyl carrier protein thioesterase from the seeds of Madhuca longifolia (latifolia). Plant Physiol Bioch. 2007; 45(12):887–897.
79. Jha JK, Maiti MK, Bhattacharjee A, Basu A, Sen PC, Sen SK. Cloning and functional expression of an acyl-ACP thioesterase FatB type from Diploknema (Madhuca) butyracea seeds in Escherichia coli. Plant Physiol Bioch. 2006; 44(11-12):645–655.
80. Dong SB, Huang JC, Li YN, Zhang J, Lin SZ, Zhang ZX. Cloning, characterization, and expression analysis of acyl-acyl carrier protein (ACP)-thioesterase B from seeds of Chinese Spicehush (Lindera communis). Gene. 2014; 542(1):16–22. [PubMed: 24631366]
81. Chen G, Peng ZY, Shan L, Xuan N, Tang GY, Zhang Y, Li L, He QF, Bi YP. Cloning of acyl-ACP thioesterase FatA from Arachis hypogaea L. and its expression in Escherichia coli. Journal of biomedicine & biotechnology. 2012; 2012:652579. [PubMed: 23093853]
82. Zheng Y, Li L, Liu Q, Qin W, Yang J, Cao Y, Jiang X, Zhao G, Xian M. Boosting the free fatty acid synthesis of Escherichia coli by expression of a cytosolic Acinetobacter baylyi thioesterase. Biotechnology for biofuels. 2012; 5(1):76. [PubMed: 23057831]
83. Jha JK, Sinha S, Maiti MK, Basu A, Mukhopadhyay UK, Sen SK. Functional expression of an acyl carrier protein (ACP) from Azospirillum brasilense alters fatty acid profiles in Escherichia coli and Brassica juncea. Plant physiology and biochemistry : PPB / Societe francaise de physiologie vegetale. 2007; 45(6-7):490–500.
84. Gong Y, Guo X, Wan X, Liang Z, Jiang M. Characterization of a novel thioesterase (PtTE) from Phaeodactylum tricornutum. Journal of basic microbiology. 2011; 51(6):666–72. [PubMed: 21656819]
Grisewood et al. Page 21
ACS Catal. Author manuscript; available in PMC 2018 January 25.
Author M
anuscriptA
uthor Manuscript
Author M
anuscriptA
uthor Manuscript

85. Serrano-Vega MJ, Garces R, Martinez-Force E. Cloning, characterization and structural model of a FatA-type thioesterase from sunflower seeds (Helianthus annuus L. Planta. 2005; 221(6):868–80. [PubMed: 15841386]
86. Lee S, Park S, Park C, Pack SP, Lee J. Enhanced free fatty acid production by codon-optimized Lactococcus lactis acyl-ACP thioesterase gene expression in Escherichia coli using crude glycerol. Enzyme and microbial technology. 2014; 67:8–16. [PubMed: 25442943]
87. Laskowski RA, Macarthur MW, Moss DS, Thornton JM. Procheck - a Program to Check the Stereochemical Quality of Protein Structures. J Appl Crystallogr. 1993; 26:283–291.
Grisewood et al. Page 22
ACS Catal. Author manuscript; available in PMC 2018 January 25.
Author M
anuscriptA
uthor Manuscript
Author M
anuscriptA
uthor Manuscript
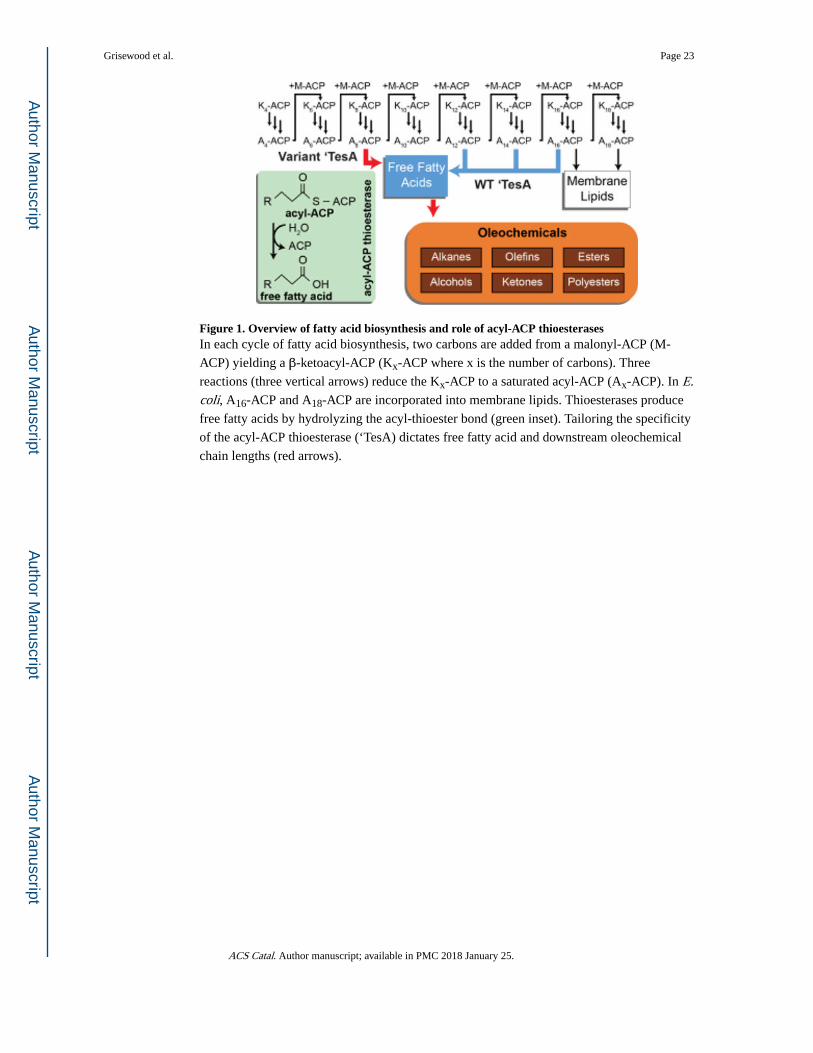
Figure 1. Overview of fatty acid biosynthesis and role of acyl-ACP thioesterasesIn each cycle of fatty acid biosynthesis, two carbons are added from a malonyl-ACP (M-
ACP) yielding a β-ketoacyl-ACP (Kx-ACP where x is the number of carbons). Three
reactions (three vertical arrows) reduce the Kx-ACP to a saturated acyl-ACP (Ax-ACP). In E. coli, A16-ACP and A18-ACP are incorporated into membrane lipids. Thioesterases produce
free fatty acids by hydrolyzing the acyl-thioester bond (green inset). Tailoring the specificity
of the acyl-ACP thioesterase (‘TesA) dictates free fatty acid and downstream oleochemical
chain lengths (red arrows).
Grisewood et al. Page 23
ACS Catal. Author manuscript; available in PMC 2018 January 25.
Author M
anuscriptA
uthor Manuscript
Author M
anuscriptA
uthor Manuscript
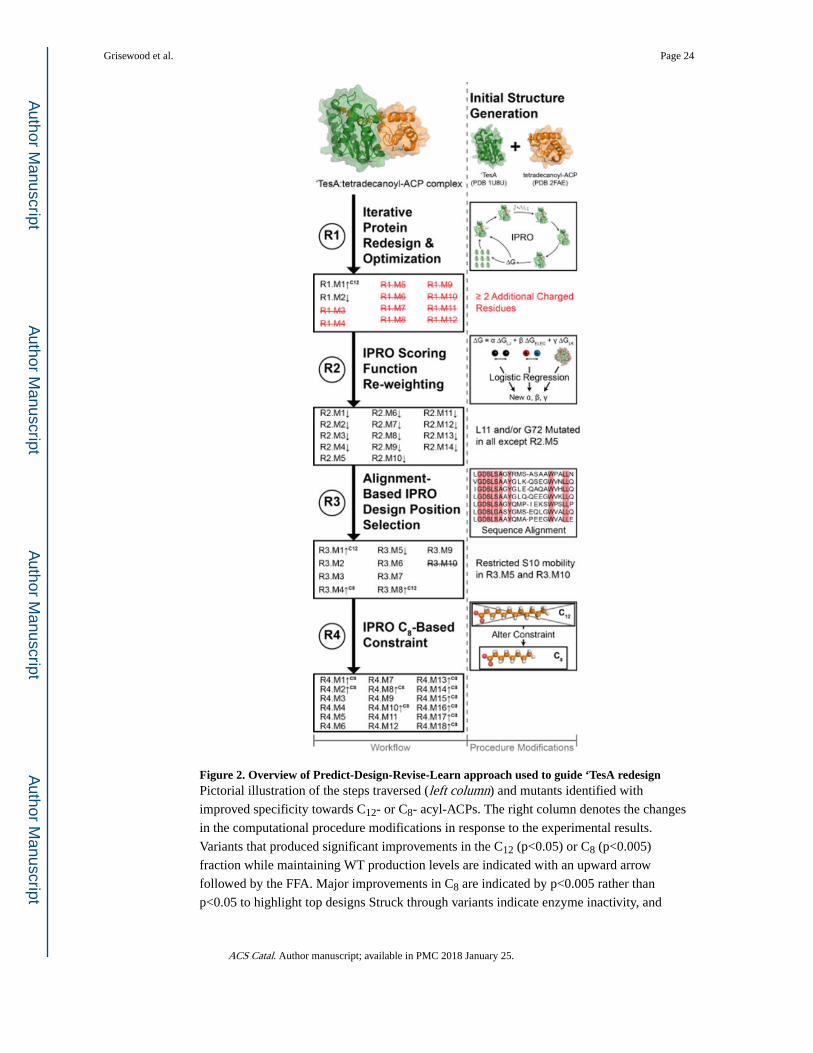
Figure 2. Overview of Predict-Design-Revise-Learn approach used to guide ‘TesA redesignPictorial illustration of the steps traversed (left column) and mutants identified with
improved specificity towards C12- or C8- acyl-ACPs. The right column denotes the changes
in the computational procedure modifications in response to the experimental results.
Variants that produced significant improvements in the C12 (p<0.05) or C8 (p<0.005)
fraction while maintaining WT production levels are indicated with an upward arrow
followed by the FFA. Major improvements in C8 are indicated by p<0.005 rather than
p<0.05 to highlight top designs Struck through variants indicate enzyme inactivity, and
Grisewood et al. Page 24
ACS Catal. Author manuscript; available in PMC 2018 January 25.
Author M
anuscriptA
uthor Manuscript
Author M
anuscriptA
uthor Manuscript
names followed by a downward arrow represent variants with reduced total production levels
relative to WT.
Grisewood et al. Page 25
ACS Catal. Author manuscript; available in PMC 2018 January 25.
Author M
anuscriptA
uthor Manuscript
Author M
anuscriptA
uthor Manuscript
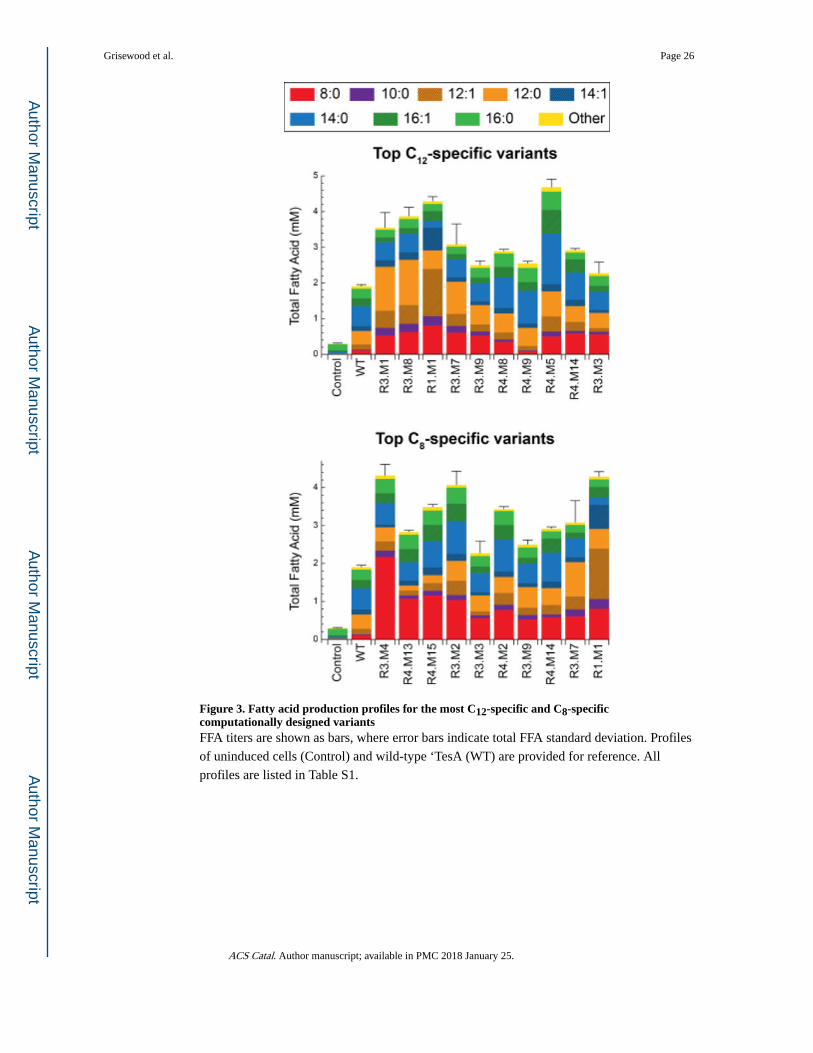
Figure 3. Fatty acid production profiles for the most C12-specific and C8-specific computationally designed variantsFFA titers are shown as bars, where error bars indicate total FFA standard deviation. Profiles
of uninduced cells (Control) and wild-type ‘TesA (WT) are provided for reference. All
profiles are listed in Table S1.
Grisewood et al. Page 26
ACS Catal. Author manuscript; available in PMC 2018 January 25.
Author M
anuscriptA
uthor Manuscript
Author M
anuscriptA
uthor Manuscript
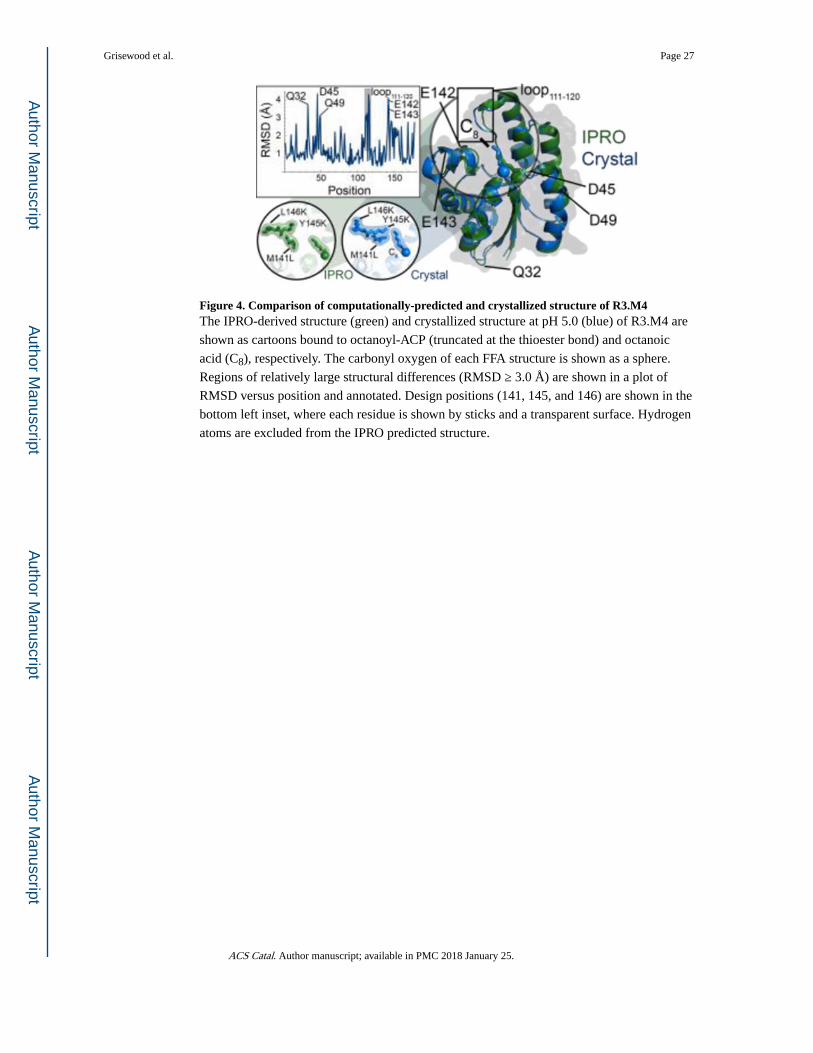
Figure 4. Comparison of computationally-predicted and crystallized structure of R3.M4The IPRO-derived structure (green) and crystallized structure at pH 5.0 (blue) of R3.M4 are
shown as cartoons bound to octanoyl-ACP (truncated at the thioester bond) and octanoic
acid (C8), respectively. The carbonyl oxygen of each FFA structure is shown as a sphere.
Regions of relatively large structural differences (RMSD ≥ 3.0 Å) are shown in a plot of
RMSD versus position and annotated. Design positions (141, 145, and 146) are shown in the
bottom left inset, where each residue is shown by sticks and a transparent surface. Hydrogen
atoms are excluded from the IPRO predicted structure.
Grisewood et al. Page 27
ACS Catal. Author manuscript; available in PMC 2018 January 25.
Author M
anuscriptA
uthor Manuscript
Author M
anuscriptA
uthor Manuscript
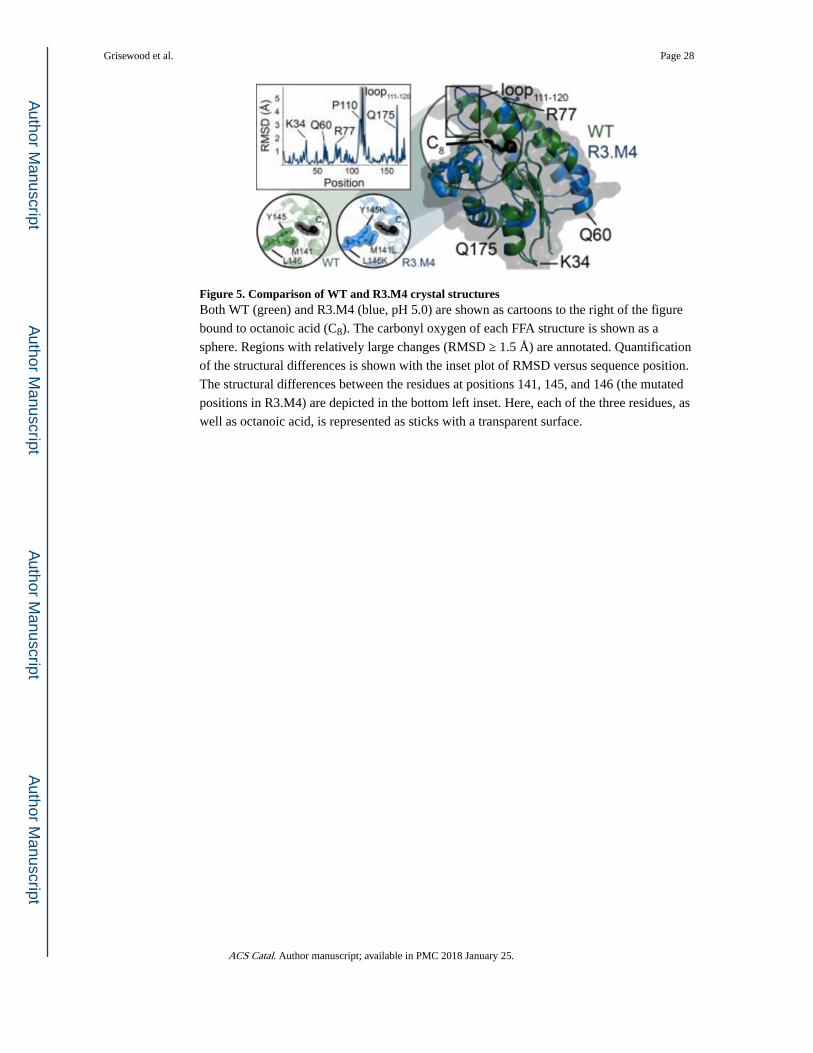
Figure 5. Comparison of WT and R3.M4 crystal structuresBoth WT (green) and R3.M4 (blue, pH 5.0) are shown as cartoons to the right of the figure
bound to octanoic acid (C8). The carbonyl oxygen of each FFA structure is shown as a
sphere. Regions with relatively large changes (RMSD ≥ 1.5 Å) are annotated. Quantification
of the structural differences is shown with the inset plot of RMSD versus sequence position.
The structural differences between the residues at positions 141, 145, and 146 (the mutated
positions in R3.M4) are depicted in the bottom left inset. Here, each of the three residues, as
well as octanoic acid, is represented as sticks with a transparent surface.
Grisewood et al. Page 28
ACS Catal. Author manuscript; available in PMC 2018 January 25.
Author M
anuscriptA
uthor Manuscript
Author M
anuscriptA
uthor Manuscript
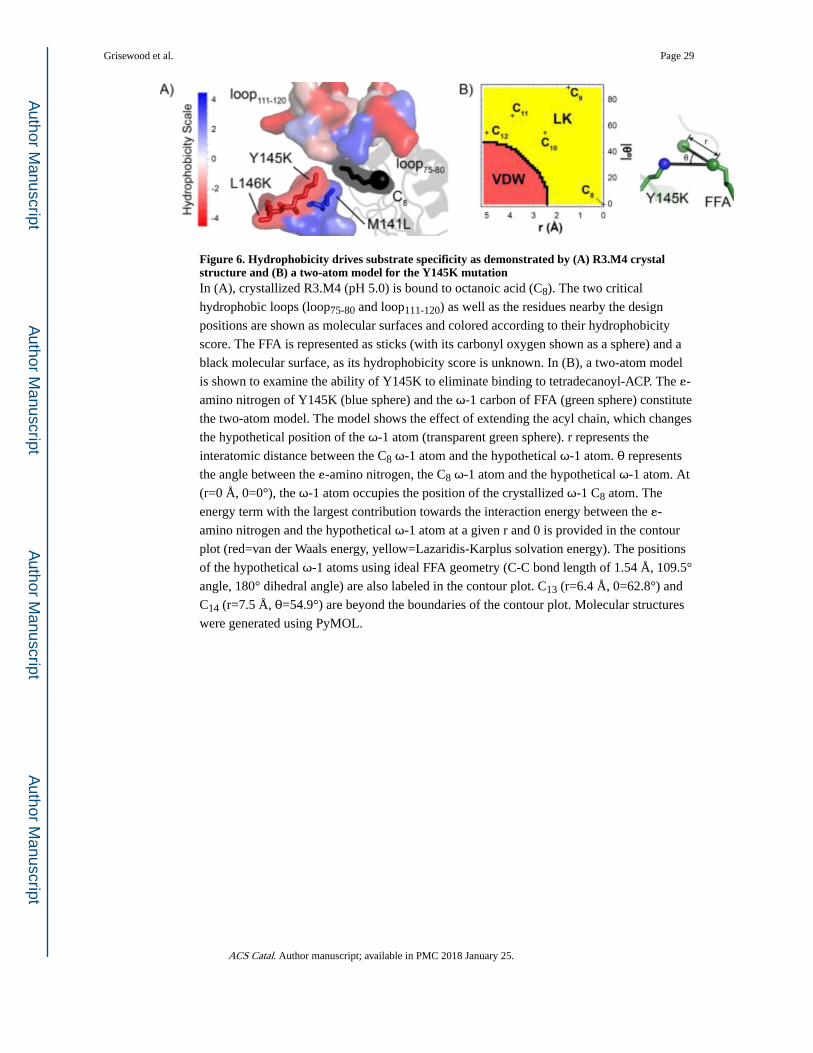
Figure 6. Hydrophobicity drives substrate specificity as demonstrated by (A) R3.M4 crystal structure and (B) a two-atom model for the Y145K mutationIn (A), crystallized R3.M4 (pH 5.0) is bound to octanoic acid (C8). The two critical
hydrophobic loops (loop75-80 and loop111-120) as well as the residues nearby the design
positions are shown as molecular surfaces and colored according to their hydrophobicity
score. The FFA is represented as sticks (with its carbonyl oxygen shown as a sphere) and a
black molecular surface, as its hydrophobicity score is unknown. In (B), a two-atom model
is shown to examine the ability of Y145K to eliminate binding to tetradecanoyl-ACP. The ε-
amino nitrogen of Y145K (blue sphere) and the ω-1 carbon of FFA (green sphere) constitute
the two-atom model. The model shows the effect of extending the acyl chain, which changes
the hypothetical position of the ω-1 atom (transparent green sphere). r represents the
interatomic distance between the C8 ω-1 atom and the hypothetical ω-1 atom. θ represents
the angle between the ε-amino nitrogen, the C8 ω-1 atom and the hypothetical ω-1 atom. At
(r=0 Å, 0=0°), the ω-1 atom occupies the position of the crystallized ω-1 C8 atom. The
energy term with the largest contribution towards the interaction energy between the ε-
amino nitrogen and the hypothetical ω-1 atom at a given r and 0 is provided in the contour
plot (red=van der Waals energy, yellow=Lazaridis-Karplus solvation energy). The positions
of the hypothetical ω-1 atoms using ideal FFA geometry (C-C bond length of 1.54 Å, 109.5°
angle, 180° dihedral angle) are also labeled in the contour plot. C13 (r=6.4 Å, 0=62.8°) and
C14 (r=7.5 Å, θ=54.9°) are beyond the boundaries of the contour plot. Molecular structures
were generated using PyMOL.
Grisewood et al. Page 29
ACS Catal. Author manuscript; available in PMC 2018 January 25.
Author M
anuscriptA
uthor Manuscript
Author M
anuscriptA
uthor Manuscript

Figure 7. Enzymatic assays of ‘TesA WT and R3.M4 (A) confirm the mutant’s increase in specificity for C8 species, and competitive binding assays (B-E) show ‘TesA WT and R3.M4 activity on C8-CoA as a function of C14-CoA (B and C) and C16-CoA (D and E) concentrationIn (A), the activity of ‘TesA WT (left) and R3.M4 (right) as a function of substrate
concentration for six different acyl-CoA substrates. Open and closed circles indicate
measurements taken in separate days. Competitive binding assays (B-E) were done to see
the effect that an increase in C14-CoA and C16-CoA would have on the activity of the
enzymes on C8-CoA. Competitive binding assays were done at a constant C8-CoA
concentration of 50 μM and variable concentrations of C14-CoA ((B) for WT and (C) for
R3.M4) and C16-CoA ((D) for WT and (E) for R3.M4). In all cases the activity of ‘TesA was
impacted by the C14-CoA and C16-CoA in a concentration dependent manner consistent
with the original assay in (A).
Grisewood et al. Page 30
ACS Catal. Author manuscript; available in PMC 2018 January 25.
Author M
anuscriptA
uthor Manuscript
Author M
anuscriptA
uthor Manuscript

Author M
anuscriptA
uthor Manuscript
Author M
anuscriptA
uthor Manuscript
Grisewood et al. Page 31
Tab
le 1
Top
ten
C12
-spe
cifi
c an
d C
8-sp
ecif
ic t
hioe
ster
ases
pub
lishe
d to
dat
e
Dat
a w
as c
olle
cted
fro
m T
able
S1
and
sort
ed b
y do
deca
noic
aci
d (e
ither
sat
urat
ed o
r un
satu
rate
d) a
nd o
ctan
oic
acid
mol
e fr
actio
ns in
the
prod
uct p
ool.
WT
com
posi
tions
wer
e pr
ovid
ed a
s a
refe
renc
e. “
Com
posi
tion”
ref
ers
to m
ole
frac
tion
of th
e co
rres
pond
ing
FFA
. Nam
es m
atch
thos
e pr
ovid
ed in
Tab
le
S1. T
he m
ost C
12-s
peci
fic
and
C8-
spec
ific
‘Te
sA v
aria
nts
foun
d in
R1-
R4
corr
espo
nd to
the
thir
d m
ost C
12-s
peci
fic
and
tent
h m
ost C
8-sp
ecif
ic
thio
este
rase
s id
entif
ied
to d
ate
resp
ectiv
ely.
Dod
ecan
oic
Aci
d (C
12)
Oct
anoi
c A
cid
(C8)
Ran
kN
ame
Com
posi
tion
Sour
ceN
ame
Com
posi
tion
Sour
ce
–W
T28
±1
Thi
s st
udy
WT
5.9±
0.3
Thi
s st
udy
1Q
4163
576
.9a,
b13
AA
C49
179
97.5
±0.
210
2rT
E15
49.0
a16
AA
C72
882
93.5
a16
3R
3.M
149
±8
Thi
s st
udy
EE
I825
6487
±2
10
4R
3.R
D3
48±
10T
his
stud
yA
BG
8247
070
±4
10
5R
3.M
846
±4
Thi
s st
udy
CA
D63
310
68.0
±0.
810
6R
M.M
3944
±6
Thi
s st
udy
CvB
2MT
4061
.4a
16
7R
1.M
143
±2
Thi
s st
udy
AB
J637
5455
.5±
0.7
10
8A
EM
7252
140
±2
10A
EM
7252
252
±6
10
9R
3.M
740
±11
Thi
s st
udy
TE
Gm
258
50.4
a16
10R
4.R
D11
37.7
±0.
6T
his
stud
yR
3.M
450
±3
Thi
s st
udy
a Stan
dard
dev
iatio
n no
t pro
vide
d
b Dat
a ap
prox
imat
ed u
sing
imag
e pr
oces
sing
sof
twar
e
ACS Catal. Author manuscript; available in PMC 2018 January 25.
Top Related