


Languages
Pages
Legal


Comptroller’sInvestment ReportFiscal Year 2014

INVESTMENT OBJECTIVES
Safety
Liquidity
Yield

AGENDA
Highlights Benchmarks Portfolio & Fed Funds Rate Treasury Yield Curves Economic Conditions Strategy Sub-portfolios Composition by Sub-portfolio Return by Sub-portfolio Portfolio Composition Flight to Quality Since ‘07

HIGHLIGHTS
FY 2014 FY 2013
Earnings $9,429,390 $8,589,967
Effective Rate of Return
0.68% 0.62%
Average Daily Balance
$1,395,059,858 $1,390,495,017
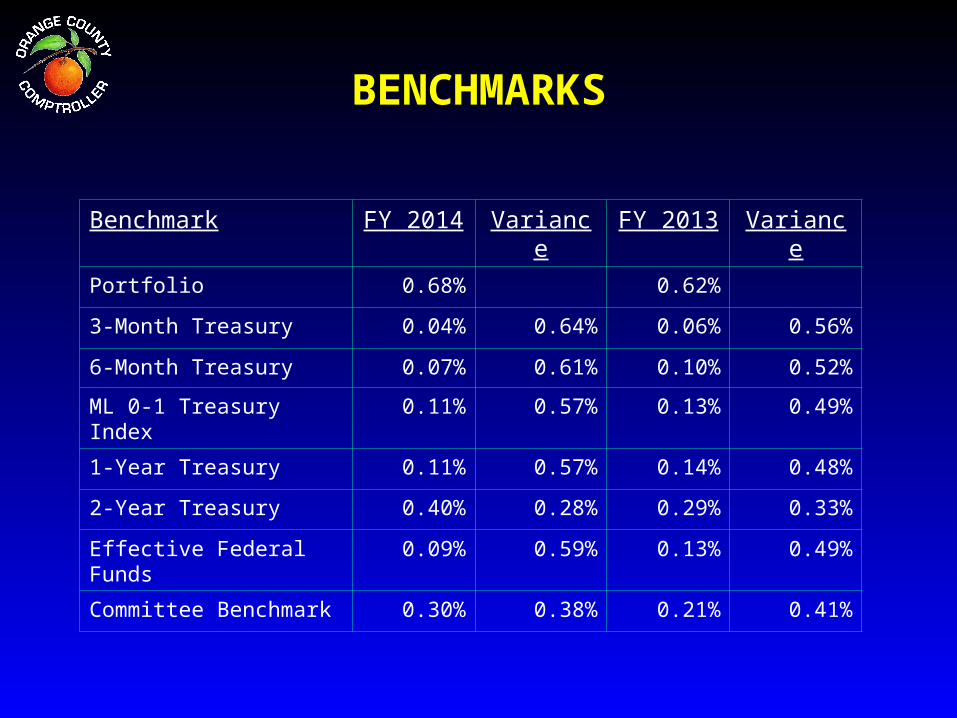
BENCHMARKS
Benchmark FY 2014 Variance FY 2013 Variance
Portfolio 0.68% 0.62%
3-Month Treasury 0.04% 0.64% 0.06% 0.56%
6-Month Treasury 0.07% 0.61% 0.10% 0.52%
ML 0-1 Treasury Index 0.11% 0.57% 0.13% 0.49%
1-Year Treasury 0.11% 0.57% 0.14% 0.48%
2-Year Treasury 0.40% 0.28% 0.29% 0.33%
Effective Federal Funds 0.09% 0.59% 0.13% 0.49%
Committee Benchmark 0.30% 0.38% 0.21% 0.41%
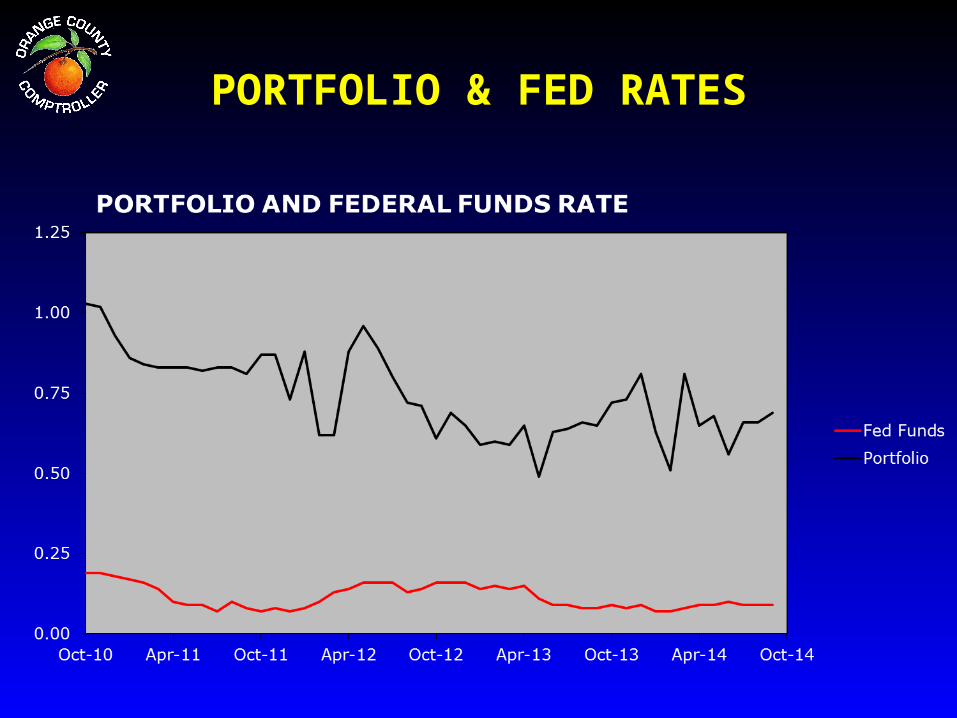
PORTFOLIO & FED RATES

TREASURY YIELD CURVES

ECONOMIC CONDITIONS
Improving labor market Moderate GDP growth Modest inflation Strong U.S. dollar Plunging oil prices US QE tapering complete QE in Japan and Europe Geopolitical risk

STRATEGY
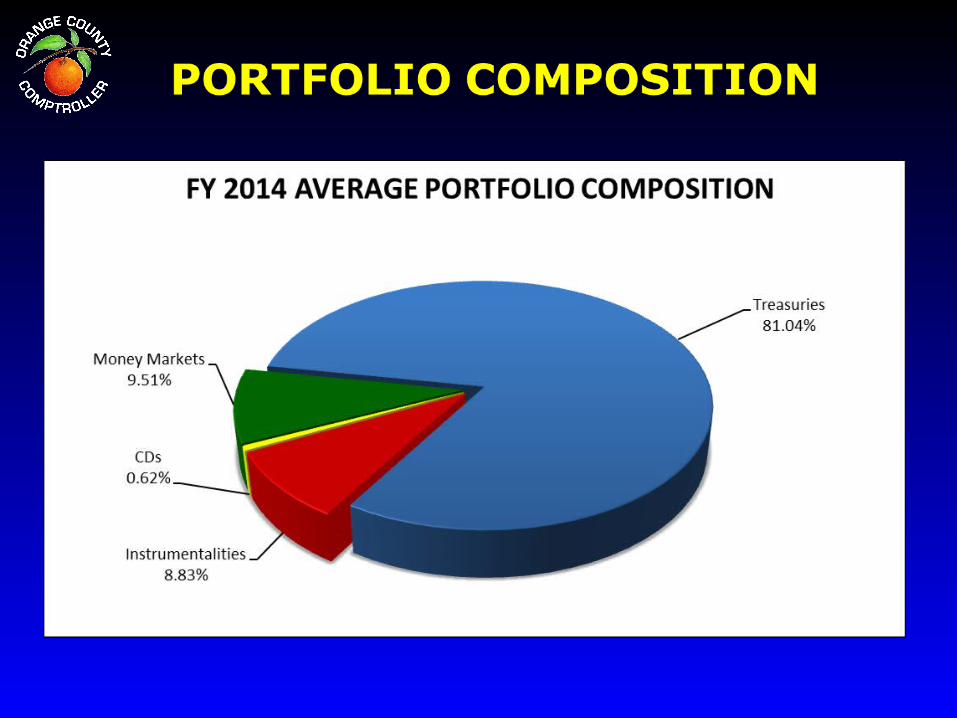
Approximately 90% of portfolio in Treasuries and money market mutual funds
Match maturities to cash flow
Maximize yield: Longer-term investments Roll down the yield curve Agencies and CDs

SUB-PORTFOLIOS
Current Operating Maximum maturity of 13 months All authorized investment types
Intermediate Operating 3-year monthly ladder - Treasuries
Noncurrent Operating 5-year monthly ladder - Treasuries
Debt Service Reserve Bond covenants Maturities less than one year Treasuries and money markets

COMPOSITION BY SUB-PORTFOLIO
The Noncurrent and Intermediate sub-portfolios represented 48% of
investments…but generated 91% of returns.

RETURN BY SUB-PORTFOLIO
FISCAL YEAR 2014
Sub-portfolioAverage Book
Value EarningsRate of Return
Current Operating $ 644,339,220 $ 722,181 0.11%
Intermediate Operating 195,418,421 1,210,914 0.62%
Noncurrent Operating 478,528,689 7,397,179 1.55%
Debt Service Reserve 76,773,528 99,159 0.13%
Total $1,395,059,858 $9,429,433 0.68%
Roll down the yield curve trades added $1.8 million in capital gains to earnings and 13 basis points to the rate of return.

FLIGHT TO QUALITY SINCE ‘07

FY 2014 ANNUAL INVESTMENT REPORT
The 2015 effective rate of return?
Interest Earned $9.4 million
Effective Rate of Return 0.68%

REPORT ONLINE
FY 2014 ANNUAL INVESTMENT REPORT
WWW.OCCOMPT.COM
Top Related