


Languages
Pages
Legal


5-i
Composite Frames under both Vertical and Horizontal Loading
Author: Guanghe YU
Supervisor: Prof. Jakub Dolejs
University: Czech Technical University
University: Czech Technical University Date: Jan.2014

I

European Erasmus Mundus Master Sustainable Constructions under natural hazards and catastrophic events 520121-1-2011-1-CZ-ERA MUNDUS-EMMC
II
Declaration
I confirm that this assignment is my own work, is not copied from any other person's work
(published or unpublished), and has not previously submitted for assessment either at Czech Technical
University in Prague or elsewhere. I confirm that I have understood the Department and University
regulations on plagiarism.
Prague, 14 Jan. 2014 Guanghe YU
European Erasmus Mundus Master Sustainable Constructions under natural hazards and catastrophic events 520121-1-2011-1-CZ-ERA MUNDUS-EMMC
III
INDEX
DECLARATION ........................................................................................................................ II
INDEX .......................................................................................................................................III
ABSTRACT .............................................................................................................................. V
FIGURES ................................................................................................................................. VI
TABLES .................................................................................................................................. VII
1. INTRODUCTION .............................................................................................................. 1
1.1. JOINTS CLASSIFICATION ................................................................................................ 1 1.2. SEMI-RIGID JOINTS IN COMPOSITE FRAMES .................................................................... 2 1.3. FRAMES AND JOINTS STUDIED ....................................................................................... 3
2. COMPOSTIE BEAMS UNDER VERTICAL LOADINGS .................................................. 4
2.1. QUASI-PLASTIC APPROACH ........................................................................................... 4 2.2. CRACKED REGION OF COMPOSITE BEAMS ....................................................................... 6 2.3. STIFFNESS REDUCTION OF CRACKED BEAMS .................................................................. 8
2.3.1. Effects of Shear deflection .................................................................................... 8 2.3.2. Stiffness of cracked beam ..................................................................................... 9
3. COMPOSITE FRAMES WITH RIGID JOINTS ................................................................. 9
3.1. CRACKED REGION OF COMPOSITE BEAMS ......................................................................10 3.1.1. Composite beam in frame under vertical loading .................................................10
3.1.2. Composite beam in a frame under horizontal loading ..........................................12 3.1.3. Composite beam in a frame under vertical and horizontal loading .......................13
3.2. EFFECTS OF CRACKED LENGTH RATIO OF BEAM .............................................................14
3.2.1. Stiffness of cracked beam ....................................................................................14 3.2.2. End moments of cracked beam ...........................................................................15
4. COMPOSITE FRAMES WITH SEMI-RIGID JOINTS ......................................................16
4.1. RESEARCH ON SEMI-RIGID FRAMES ..............................................................................16 4.2. BENDING STIFFNESS OF JOINTS ....................................................................................17
4.2.1. Components Method ............................................................................................18
4.2.2. Bending stiffness at unloading stage ...................................................................19 4.2.3. Composite joints studied ......................................................................................20
4.3. INTERNAL FORCES AND MOMENTS OF BEAMS IN SEMI-RIGID FRAMES ................................21
4.3.1. Moments of semi-rigid frames under vertical loading ...........................................22 4.3.2. Internal forces and moments of semi-frames under horizontal loading ................24
4.4. CRITICAL LOAD FACTOR ΑCR .........................................................................................26 4.4.1. Critical load analysis ............................................................................................26 4.4.2. Critical load factor of semi-rigid frames ................................................................27
4.4.3. Study on Critical load factor of semi-rigid steel frames ........................................30
5 PARAMETRIC STUDY ...................................................................................................32

European Erasmus Mundus Master Sustainable Constructions under natural hazards and catastrophic events 520121-1-2011-1-CZ-ERA MUNDUS-EMMC
IV
5.1 STEEL FRAMES ...........................................................................................................32 5.1.1 Critical load factors ...............................................................................................32
5.1.2 Moments at joints ..................................................................................................37 5.1.3 Stiffness of beam ..................................................................................................41 5.1.4 Rotation of joints ...................................................................................................41 5.1.5 Stiffness of frame ..................................................................................................43
5.2 COMPOSITE FRAMES ...................................................................................................44
5.2.1 Critical load factors ...............................................................................................47 5.2.2 Moments at joints ..................................................................................................48 5.2.3 Cracking length of beam .......................................................................................50 5.2.4 Stiffness of beam ..................................................................................................52 5.2.5 Rotation of joints ...................................................................................................53
5.3 COMPARISON OF STEEL AND COMPOSITE FRAMES ..........................................................57
6. COCLUSION ...................................................................................................................32
6.1. CONCRETE CRACKING .................................................................................................59
6.2. SEMI-RIGID JOINTS ......................................................................................................59
REFERENCES .........................................................................................................................61

V
ABSTRACT
Composite frames with semi-rigid joints are studied using numerical analysis methods, in order
that effects of semi-rigidity of connections are introduced into global analysis. Differing from plastic
approach and non-linear collapse analysis, characteristics of joints are employed into linear elastic
analysis, by introducing elastic element end releases.
Semi-rigidity of joints is possible to be employed for moment redistribution of composite
frames, leading to a suitable coherence between hogging and sagging bending capacity of composite
beams, while effects of concrete cracking is limited but unneglectable. Critical load factor, together with
moment redistribution and deflection are analysed within this paper. Suggestion on joint stiffness
selection and using of FEM programme are provided.
Keywords: Semi-rigid composite joints, composite frame, critical load factor, moment
redistribution, cracking analysis

European Erasmus Mundus Master Sustainable Constructions under natural hazards and catastrophic events 520121-1-2011-1-CZ-ERA MUNDUS-EMMC
VI
FIGURES
Figure 1.1: Classification of joints by stiffness (Figure 5.4 in EN1993-1-8) ............................... 2 Figure 2.1 Moments redistribution and quasi-plastic design (Nethercot & Stylianidis, 2008,
Fig2) ....................................................................................................................................................... 5 Figure 2.2 Quasi-plastic design methods (Nethercot & Stylianidis, 2008, Fig3) ........................ 6 Figure 2.3 Model of Beam with End Releases .......................................................................... 7 Figure 3.1 Frame under Vertical Loading .................................................................................11
Figure 3.2 Frame under Horizontal Loading (LC2) ...................................................................12 Figure 3.3 Frame under vertical and horizontal loading ...........................................................13 Figure 4.1 Most general form of moment-rotation characteristic (Nethercot D. , 1995) ............17 Figure 4.2 Example of a spring model for a composite end-plate connection (Demonceau,
2008) .....................................................................................................................................................19
Figure 4.3 Characteristic of joints when loading or unloading ..................................................20 Figure 4.4 Detailing of composite joints ...................................................................................21 Figure 4.5 Composite frame with semi-rigid connection ...........................................................22
Figure 4.6 Semi-rigid frames under horizontal loading .............................................................24 Figure 4.7 Schematic comparison of load-deflection behaviour ( (Ziemian, 2010) Figure 16.1)
..............................................................................................................................................................27 Figure 4.8 Load case for critical load factor calculation ............................................................28 Figure 5.1 Steel frames studied ...............................................................................................32
Figure 5.2 αcr Value according to different approaches ............................................................33 Figure 5.3 Critical Load factors vs. Span .................................................................................35 Figure 5.4 Critical load factors (Semi-rigid steel frames) ..........................................................35 Figure 5.5 Critical load factors (Semi-rigid steel frames) ..........................................................36 Figure 5.6 Critical load factor vs. Joints stiffness .....................................................................36
Figure 5.7 Critical load factor vs. column height .......................................................................36 Figure 5.8 Moment at joint and Joint rotation ...........................................................................38
Figure 5.9 Moment reduction with Semi-rigid joints ..................................................................38 Figure 5.10 Moment Redistribution with semi-rigid joints .........................................................39
Figure 5.11 Moment of joint in frames ......................................................................................39 Figure 5.12 Moment percentage comparing with rigid frames..................................................40 Figure 5.13 Deflection of beams (mm) .....................................................................................41 Figure 5.14 Rotation of joints (h=5m, unit: mrad) .....................................................................42
Figure 5.15 αcr and Rotation angle of Column .........................................................................43 Figure 5.16 Horizontal displacement of frame (h=5m unit: mm) ..............................................44
Figure 5.17 Horizontal displacement of frame (h=5m, unit: mm) ..............................................44 Figure 5.18 Composite frame studied ......................................................................................45 Figure 5.19 Load case: Horizontal and vertical Loading ..........................................................46 Figure 5.20 Critical Sections and reference displacements......................................................46 Figure 5.21 αcr-Sj curve 1 (Span =10m) ...................................................................................47 Figure 5.22 αcr-Sj curve 2 (h=5m) .............................................................................................47 Figure 5.23 αcr-hi curve ............................................................................................................48
Figure 5.24 Moment of beam ends under vertical loading (h=5m) ...........................................49 Figure 5.25 Moment redistribution as result of joints stiffness (h=5m) .....................................49 Figure 5.26 Moment redistribution (Span=10m) .......................................................................50 Figure 5.27 Cracking length of composite beam (h=5m) ..........................................................50 Figure 5.28 Cracking length vs. span .......................................................................................51 Figure 5.29 cracking ratio of composite beams ........................................................................51
European Erasmus Mundus Master Sustainable Constructions under natural hazards and catastrophic events 520121-1-2011-1-CZ-ERA MUNDUS-EMMC
VII
Figure 5.30 Cracking length of composite beam (span=10m) ..................................................52 Figure 5.31 displacement of beam at mid-span (h=5m) ...........................................................52
Figure 5.32 Displacement ratio vs. rotation stiffness of joint ....................................................53 Figure 5.33 Lose of beam rigidity with soft joint (h=5m, span=7m) ..........................................53 Figure 5.34 Rotation angle of joints (h=5m) .............................................................................55 Figure 5.35 Rotation angle of joints vs. span (h=5m) ...............................................................55 Figure 5.36 Rotation angle of joints (span=10m)......................................................................56
Figure 5.37 Joint moment and joint rotation (span=10m, h=5m, q=35kN/m) ............................57 Figure 5.38 Critical load factors of steel and composite frames ...............................................58
TABLES
Table 2-1 Plastic Moments of Beam Section............................................................................. 7 Table 2-2 Moments and Displacement of Elastic Beams .......................................................... 8 Table 2-3 Equivalent Stiffness of Cracked Composite Beam .................................................... 9 Table 3-1 Characteristic of Element Sections ..........................................................................10
Table 3-2 Moments of Composite Beam in Rigid Frame (Span L=10m) ..................................11 Table 3-3 Moments of beam due to horizontal loading ............................................................12 Table 3-4 Moments of beam due to vertical and horizontal loading .........................................13
Table 3-5 Effects of length of cracked regions (I2/I1=0.371) .....................................................14 Table 4-1 Components to be considered for end-plate connection under hogging moments
(Demonceau, 2008) ..............................................................................................................................18 Table 4-2 Characteristic of composite joints.............................................................................21
Table 4-3 Moments of beams in semi-rigid frames ..................................................................23 Table 4-4 Internal forces of semi-rigid frames (Sj) ....................................................................25 Table 4-5 Internal forces of semi-rigid frames (Sj,ini &Sj) ..........................................................25 Table 4-6 Critical load factors of semi-rigid frames (Sj) ............................................................28
Table 4-7 Critical load factor of steel frames (L=10m) ..............................................................31 Table 4-8 Critical load factor of steel frames (L=7m) ................................................................31 Table 5-1 Critical load factor of steel frames (variable span) ...................................................34 Table 5-2 Moment of joint in a 1-spam 1-storey frame .............................................................37 Table 5-3 End Moment and Percentage ..................................................................................40
Table 5-4 Joint Rotation Requirement under vertical loading ...................................................42 Table 5-5 Example of divergent iteration ..................................................................................45
Table 5-6 Required Joint rotation (mrad) .................................................................................54 Table 5-7 Moment and Rotation of joint in frame .....................................................................56
Table 5-8 Critical load factor of steel and composite frames ....................................................57
1
Composite Frames under both Vertical and Horizontal
Loading
1. INTRODUCTION
Moment connections are widely used in steel and composite frames. The semi-rigidity of steel
connections has been acknowledged since steel was used as structure materials, and research on its
effects on frames have been widely reported in the last decades. As for composite frames, full-rigid full-
strength connections seem to be impossible due to their complexity, or to be unnecessary due to their
high expense.
This paper, starting from simplified plastic analysis methods by Nethercot (Nethercot &
Stylianidis, 2008) and frame instability research by Demonceau (Demonceau, 2008), tries to introduce
semi-rigidity joints into global analysis of composite frames, based on numerical analysis using a
commercial software package. The study highlights the possibility of global analysis of semi-rigid
frames, by means of application of end elastic releases on beam ends. Limitations of finite element
analysis programmes are also introduced.
1.1. Joints classification
As recognised, steel and/or composite joints have some degree of rigidity or deformability,
which varies in accordance with the applied loading (Simões da Silva, 2008). Composite joints, as well
as steel joints, are classified, in Eurocode4 (EN1994-1-1, 2009) and in Eurocode3-1-8 (EN1993-1-8,
2005), into three categories either by rotational stiffness or by resistance to bending moments. The
categories are:
for stiffness: rigid, semi-rigid, and nominally pinned;
for strength: full-strength, partial-strength, and nominally pinned.
The three stiffness classes, which are relevant to elastic global analysis, are shown in Figure
1.1. Comparing with a „rigid‟ joint, the flexibility of a connection leads to probably significant
redistribution of elastic moments in a frame (Johnson, 2004), related with the stiffness of the joints.

European Erasmus Mundus Master Sustainable Constructions under natural hazards and catastrophic events 520121-1-2011-1-CZ-ERA MUNDUS-EMMC
2
Figure 1.1: Classification of joints by stiffness (Figure 5.4 in EN1993-1-8)
When the rotational behaviour is considered, the structural properties of a joint assumed in
design include bending resistance, rotational stiffness and rotation capacity, noted by Mj,Rd, Sj (or initial
stiffness Sj,ini) and ΦCd respectively.
1.2. Semi-rigid joints in Composite frames
Semi-rigid joints are almost unavoidable in composite frames due to the composite effects of
steel and concrete. Pinned joints might be recommended for braced frame, but the longitudinal
reinforcement in the slab, responsible for control of cracking, will lead to partly resistance for composite
beams connected to an internal column. As for rigid, full-strength connections, extended end plates
with stiffeners will probably needed, as for steel joints. Even through the joints and beam sections are
strengthened by additional haunches, the column web zone may yield some degree of flexibility, not
considering the expense caused by complexity.
Under this criterion, semi-rigid joints or semi-rigid frames are widely studied during the last
decades. Nethercot (Nethercot D. , 1995) (Nethercot & Stylianidis, 2008) recommended simplified
plastic design methods with necessary verification of required rotation capacity of beams and of joints.
This method provides an intermediate solution between the traditional “simple construction” and

European Erasmus Mundus Master Sustainable Constructions under natural hazards and catastrophic events 520121-1-2011-1-CZ-ERA MUNDUS-EMMC
3
“continuous construction”, resulting in semi-continuous construction or “partially restrained (PR)
construction”. Within this plastic method, the rotation capacity, instead of rotation stiffness of joints,
governs the design of frames.
This plastic analysis assumes a “plastic mechanism”, with the hinges firstly form at the joints.
In other words, the column should be strong to avoid failure from strength or instability. As steel or
even composite columns involved, local and/or global instability should be considered. Critical load or
critical load factor is mostly employed in this field.
For some load case or combination, critical load factor αcr is calculated with eigenvalue
methods, based on elastic theory. The materials, elements and all other components involved into the
structure are assumed to be idealized elastic. From strength side, a plastic load factor αpl is used to
foresee the ultimate load of structures. Since loading capacity of frames is related with their elastic and
strength characteristic, both factors, αcr and αpl, contribute to the ultimate loading capacity. The
“Merchant-Rankine approach” and a new “Eurocode” approach (Demonceau, 2008) employ the two
factor into an equation to foresee the static capacity of structures.
1.3. Frames and joints studied
This paper is intended to study property of composite frames, mostly of composite beams with
semi-rigid connections. Effects of cracking, and that of joint rigidity, are studied.
The study starts with a fixed beam, where the cracking property of composite beam is
recognized. This composite beam is then put into a rigid frame under load cases, in order that the
effects of stiffness ratio between column and beam are studied. In the following parts, rotational
springs are introduced, trying to approach suitable global analysis methods for semi-rigid frames.
The characteristics of joints studied in this paper are cited from technical report of a European
research project. The end plate composite joints are classified as semi-rigid in most frames.
The studied composite beams, which are directly end-supported or connected with columns in
frames, are assumed to be laterally restrained in span, as a result, lateral buckling is not possible to
appear.
A series of one-span one-storey steel and composite frames are employed, with parametric
factors, namely span, height, and joint stiffness, Critical load factor of frame, moment of critical section,

European Erasmus Mundus Master Sustainable Constructions under natural hazards and catastrophic events 520121-1-2011-1-CZ-ERA MUNDUS-EMMC
4
joint rotation and deflection are studied. The dominated analysis method is linear elastic analysis, while
rotation stiffness of joints is realised with linear elastic end releases. (Dlubal, 2013a)
2. COMPOSTIE BEAMS UNDER VERTICAL LOADINGS
A fixed composite beam is studied here, to highlight the effects of concrete cracking and/or of
joint rotation. As simple composite one is more useful for one-span beam, this case rarely happens in
practice, but forms principle of plastic design.
Self-weight of structure elements is deactivated for highlighting the effects of external loading.
2.1. Quasi-plastic approach
For an idealized fixed beam under vertical loading, such as self-weigh or imposed loading, the
hogging moments are larger than sagging moments in span, which gives us an assumption that the
moments at the supports, due to increasing loading, will reach the yielding stage, and results plastic
hinges there. This is proposed by Nethercot for plastic design of semi-continuous frames.
European Erasmus Mundus Master Sustainable Constructions under natural hazards and catastrophic events 520121-1-2011-1-CZ-ERA MUNDUS-EMMC
5
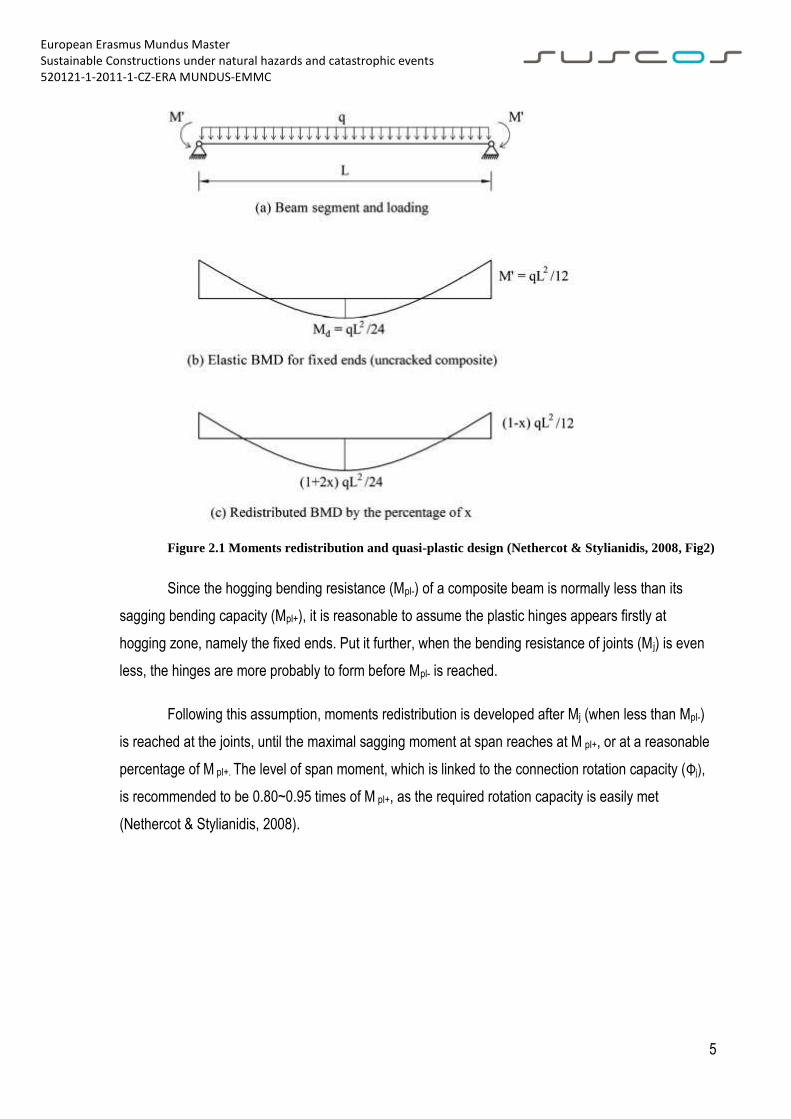
Figure 2.1 Moments redistribution and quasi-plastic design (Nethercot & Stylianidis, 2008, Fig2)
Since the hogging bending resistance (Mpl-) of a composite beam is normally less than its
sagging bending capacity (Mpl+), it is reasonable to assume the plastic hinges appears firstly at
hogging zone, namely the fixed ends. Put it further, when the bending resistance of joints (M j) is even
less, the hinges are more probably to form before Mpl- is reached.
Following this assumption, moments redistribution is developed after Mj (when less than Mpl-)
is reached at the joints, until the maximal sagging moment at span reaches at M pl+, or at a reasonable
percentage of M pl+. The level of span moment, which is linked to the connection rotation capacity (Φj),
is recommended to be 0.80~0.95 times of M pl+, as the required rotation capacity is easily met
(Nethercot & Stylianidis, 2008).
European Erasmus Mundus Master Sustainable Constructions under natural hazards and catastrophic events 520121-1-2011-1-CZ-ERA MUNDUS-EMMC
6
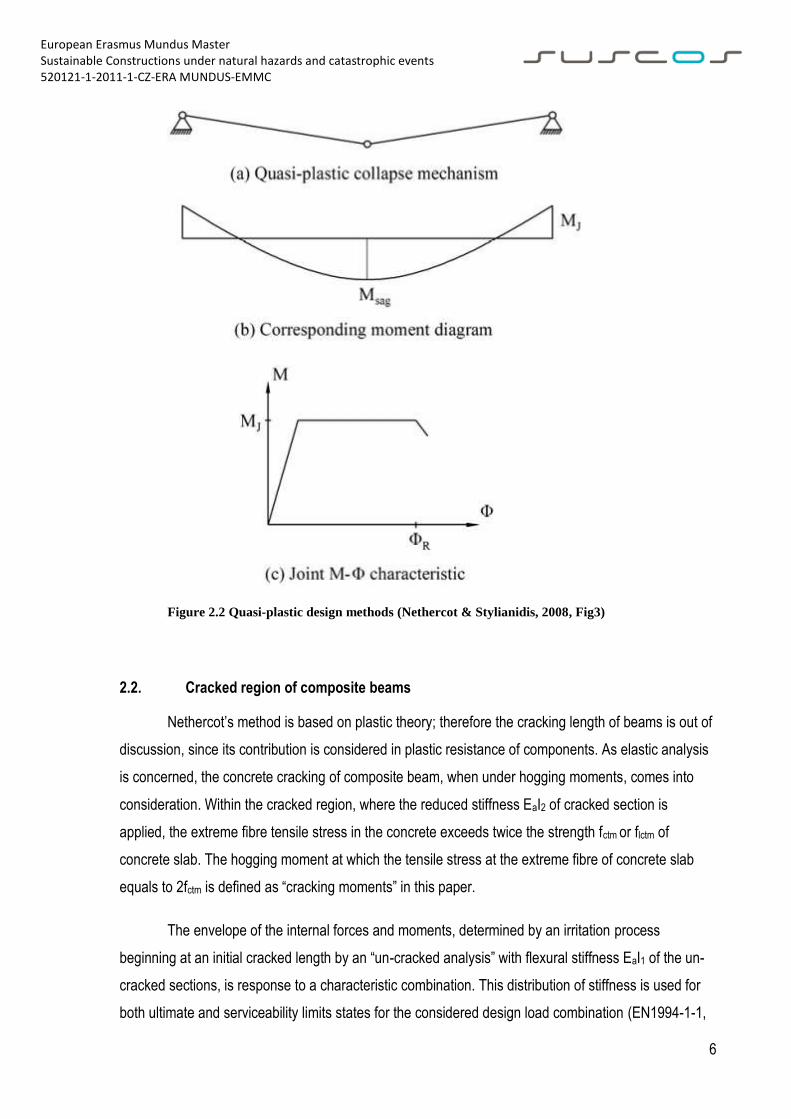
Figure 2.2 Quasi-plastic design methods (Nethercot & Stylianidis, 2008, Fig3)
2.2. Cracked region of composite beams
Nethercot‟s method is based on plastic theory; therefore the cracking length of beams is out of
discussion, since its contribution is considered in plastic resistance of components. As elastic analysis
is concerned, the concrete cracking of composite beam, when under hogging moments, comes into
consideration. Within the cracked region, where the reduced stiffness EaI2 of cracked section is
applied, the extreme fibre tensile stress in the concrete exceeds twice the strength fctm or flctm of
concrete slab. The hogging moment at which the tensile stress at the extreme fibre of concrete slab
equals to 2fctm is defined as “cracking moments” in this paper.
The envelope of the internal forces and moments, determined by an irritation process
beginning at an initial cracked length by an “un-cracked analysis” with flexural stiffness EaI1 of the un-
cracked sections, is response to a characteristic combination. This distribution of stiffness is used for
both ultimate and serviceability limits states for the considered design load combination (EN1994-1-1,

European Erasmus Mundus Master Sustainable Constructions under natural hazards and catastrophic events 520121-1-2011-1-CZ-ERA MUNDUS-EMMC
7
2009). As the amplitude of load case may be referred as either limit state in this study, the length of
cracked region should be corrected for real design analysis.
The studied composite beam is showed as in Figure 2.3. The beam is composited by IPE300
steel with 110mm concrete slab, spaced by 50mm sheeting. A steel beam with the same profile
IPE300 is calculated for comparison.
Figure 2.3 Model of Beam with End Releases
The sectional bending resistance of steel and composite beams is listed in Table 2-2 .
Table 2-1 Plastic Moments of Beam Section
Material Profile Mpl- (kNm) Mpl+ (kNm) [qED] plastic (kN/m) [qED] elastic (kN/m)
Steel IPE300 147.67 147.67 23.63 17.72
composite IPE300+110slab 198.78 332.33 42.49 29.86
After irritations, the cracked length of composite beam is set as 1.521m under the applied
loading level. Moments at the fixed ends (233.04kNm) is above the section bending resistance
(198.78kNm), and will lead to further moments redistribution assuming idealized fixed by supports.
If the length of the hogging moment zone (Com_2) is used instead, the moments at fixed ends
(233.00kNm) reduce slightly as a result of larger cracking length ratio. The errors seem to be
acceptable if the cracking moments of beams are unavailable at the concept design stage, due to
uncertainty of effective slab width and/or of reinforcement. The results (Span L=10m) are listed in
Table 2-2 .
35.000
Y
35.000 35.000
Z
10.000
X
Against Y-directionCO2: composite beam, calculation with stiffness factor

European Erasmus Mundus Master Sustainable Constructions under natural hazards and catastrophic events 520121-1-2011-1-CZ-ERA MUNDUS-EMMC
8
Table 2-2 Moments and Displacement of Elastic Beams
Beam I1 or I2 (cm4)
EI_com
/EI_a
Cracked length (X_Mcr ) (m)
Mom. at fixed end (kNm)
M_mid (kNm)
Dis. of mid-span (mm)
Dis. With 100GAz (mm)
Length of hogging Moments (x_M=0) (m)
Steel (Ia) 8356 1.000 n.a. 291.67 145.83 54.68 51.97 2.113
Uncr.Com.(I1) 30145.86 3.608 2.041 291.67 145.83 17.13 14.42 2.113
Cra.Com.(I1 and I2)
30145.86 11175.75
3.608 1.337
1.521 233.04 204.46 26.35 23.64 1.582
Com_2 1.582 233.00 204.50 26.36 23.65 1.582
Dis. Due to shear
2.71
As showed in Table 2-2 , the cracking length ratio is about 0.15, with a redistribution of end
moment at 20%. While the cracking length ratio here (15%) is comparable with that in simplified
method (15%) (EN1994-1-1, 2009) 5.4.2.3, the rotation capacity of frames is normally able to provide
further moments redistribution, as recommended in EN1994-1-1, Table 5.1, for both un-cracked and
cracked analysis.
2.3. Stiffness reduction of cracked beams
When used in frame, the stiffness of a cracked beam comes into consideration, related to
internal forces distribution and deformation, especially when simplified method is approached.
2.3.1. Effects of Shear deflection
To determine the bending stiffness of the cracked beams, the displacement of mid-span points
is used as the beam and loading are symmetry. Since the composite beam is calculated as an
assumed steel element with multiplier factor modifying the flexural stiffness, deflection of beams due to
shear forces will be the same as the bare steel beam, if no multiplier factor is applied to its shear
stiffness. This accuracy of deflection calculation of steel elements makes unfortunately the comparing
of the bending stiffness of beams uneasy. Since the shear deformation of composite beams, within
influence of the concrete slab, un-cracked or cracked, is assumed to reduce, and since the interaction
of shear and bending effects is out of our study, the deflection due to shear force is probably excluded.
The shear stiffness is multiplied by a factor of 100 in order to gain the displacement due to
bending only. The displacement without and with this configuration are listed in the above Table 2-2
and Table 2-3 .
European Erasmus Mundus Master Sustainable Constructions under natural hazards and catastrophic events 520121-1-2011-1-CZ-ERA MUNDUS-EMMC
9
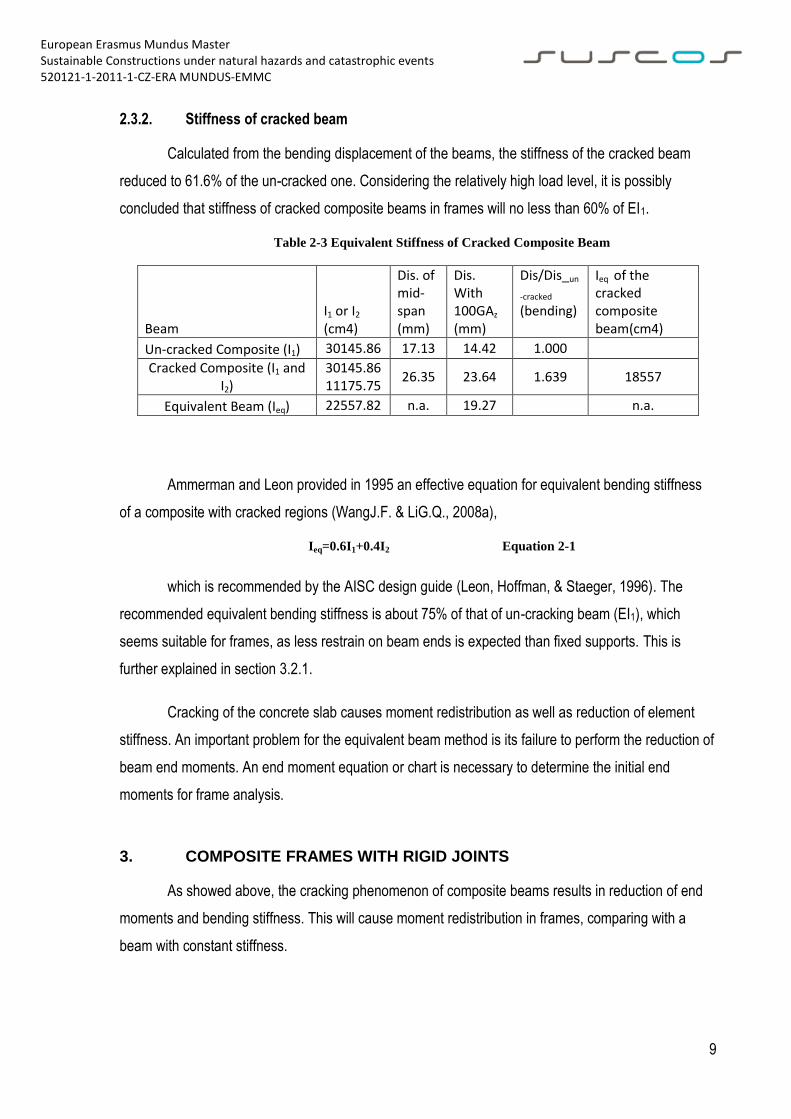
2.3.2. Stiffness of cracked beam
Calculated from the bending displacement of the beams, the stiffness of the cracked beam
reduced to 61.6% of the un-cracked one. Considering the relatively high load level, it is possibly
concluded that stiffness of cracked composite beams in frames will no less than 60% of EI1.
Table 2-3 Equivalent Stiffness of Cracked Composite Beam
Beam I1 or I2 (cm4)
Dis. of mid-span (mm)
Dis. With 100GAz (mm)
Dis/Dis_un
-cracked (bending)
Ieq of the cracked composite beam(cm4)
Un-cracked Composite (I1) 30145.86 17.13 14.42 1.000
Cracked Composite (I1 and I2)
30145.86 11175.75
26.35 23.64 1.639 18557
Equivalent Beam (Ieq) 22557.82 n.a. 19.27 n.a.
Ammerman and Leon provided in 1995 an effective equation for equivalent bending stiffness
of a composite with cracked regions (WangJ.F. & LiG.Q., 2008a),
Ieq=0.6I1+0.4I2 Equation 2-1
which is recommended by the AISC design guide (Leon, Hoffman, & Staeger, 1996). The
recommended equivalent bending stiffness is about 75% of that of un-cracking beam (EI1), which
seems suitable for frames, as less restrain on beam ends is expected than fixed supports. This is
further explained in section 3.2.1.
Cracking of the concrete slab causes moment redistribution as well as reduction of element
stiffness. An important problem for the equivalent beam method is its failure to perform the reduction of
beam end moments. An end moment equation or chart is necessary to determine the initial end
moments for frame analysis.
3. COMPOSITE FRAMES WITH RIGID JOINTS
As showed above, the cracking phenomenon of composite beams results in reduction of end
moments and bending stiffness. This will cause moment redistribution in frames, comparing with a
beam with constant stiffness.
European Erasmus Mundus Master Sustainable Constructions under natural hazards and catastrophic events 520121-1-2011-1-CZ-ERA MUNDUS-EMMC
10
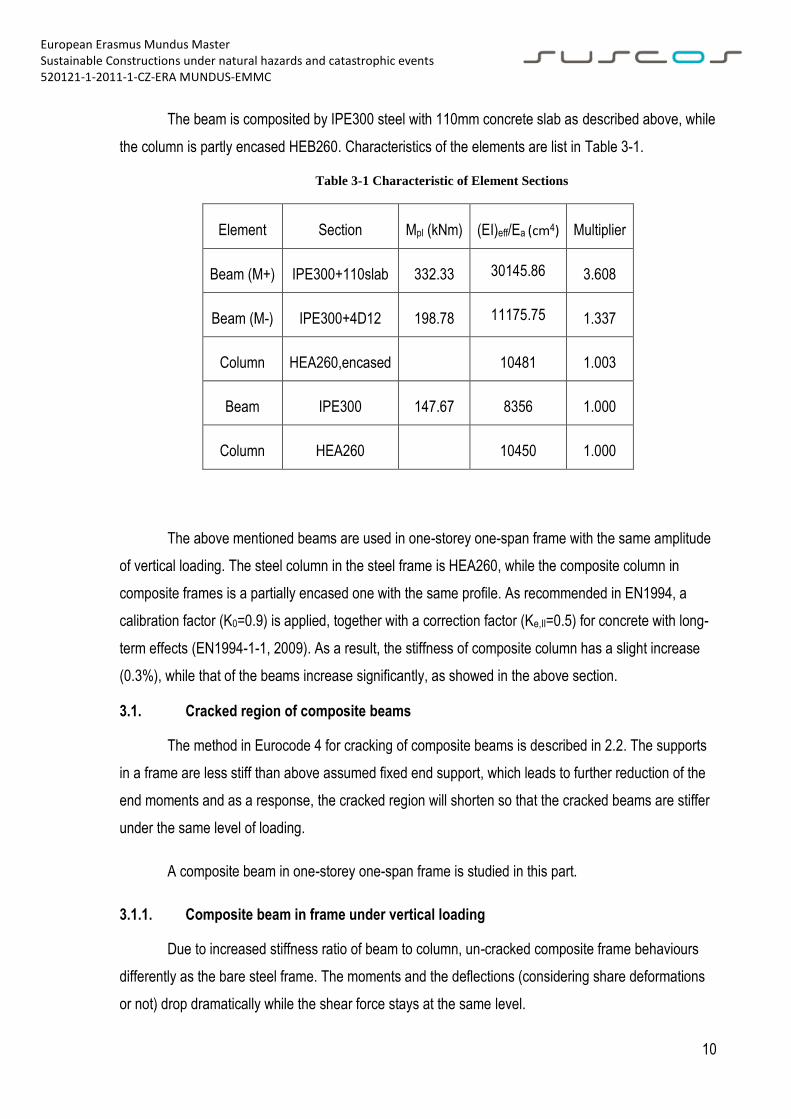
The beam is composited by IPE300 steel with 110mm concrete slab as described above, while
the column is partly encased HEB260. Characteristics of the elements are list in Table 3-1.
Table 3-1 Characteristic of Element Sections
Element Section Mpl (kNm) (EI)eff/Ea (cm4) Multiplier
Beam (M+) IPE300+110slab 332.33 30145.86 3.608
Beam (M-) IPE300+4D12 198.78 11175.75 1.337
Column HEA260,encased 10481 1.003
Beam IPE300 147.67 8356 1.000
Column HEA260 10450 1.000
The above mentioned beams are used in one-storey one-span frame with the same amplitude
of vertical loading. The steel column in the steel frame is HEA260, while the composite column in
composite frames is a partially encased one with the same profile. As recommended in EN1994, a
calibration factor (K0=0.9) is applied, together with a correction factor (Ke,II=0.5) for concrete with long-
term effects (EN1994-1-1, 2009). As a result, the stiffness of composite column has a slight increase
(0.3%), while that of the beams increase significantly, as showed in the above section.
3.1. Cracked region of composite beams
The method in Eurocode 4 for cracking of composite beams is described in 2.2. The supports
in a frame are less stiff than above assumed fixed end support, which leads to further reduction of the
end moments and as a response, the cracked region will shorten so that the cracked beams are stiffer
under the same level of loading.
A composite beam in one-storey one-span frame is studied in this part.
3.1.1. Composite beam in frame under vertical loading
Due to increased stiffness ratio of beam to column, un-cracked composite frame behaviours
differently as the bare steel frame. The moments and the deflections (considering share deformations
or not) drop dramatically while the shear force stays at the same level.

European Erasmus Mundus Master Sustainable Constructions under natural hazards and catastrophic events 520121-1-2011-1-CZ-ERA MUNDUS-EMMC
11
Figure 3.1 Frame under Vertical Loading
Table 3-2 Moments of Composite Beam in Rigid Frame (Span L=10m)
Frame type I1 or I2
(10-8m4) EI_com
/EI_a
Cracked length (X_Mcr ) (m)
Mom. at beam end (kNm)
M_mid (kNm)
Dis.of mid-span (mm)
Length of hogging Moments (x_M=0) (m)
Ib/Ic
Steel (Ia) 8356 1.000 n.a. 240.48 197.02 91.4 1.645 0.800
Uncr.Comp. (I1) 30145.86 3.608 1.002 165.17 272.33 42.5 1.055 2.876
Crack. Comp. (I1 & I2)
30145.86 11175.75
3.608 1.337
0.907 151.71 285.79 44.7 0.959 n.a.
Equ. Beam(Ieq) 22558 2.700 1.150 185.41 252.09 50.5 1.205 2.152
Mpl-=198.78kNm, Mpl
+=332.33kNm
Effects of concrete cracking included, the end moments of beam drop further at about 9% with
a reduced cracked stiffness at hogging moment region, and lead to a lager deflection.
Equivalent stiffness beam gives a safe estimate of deflection by 47.8mm (without shear
deflection), a difference of 13.8% from 44.7mm.
Within a frame, the moments of beam are not exceed plastic resistance, both negative and
positive, respectively. It should be mentioned that the sagging moments will firstly reach at bending
resistance (1.16<1.31), due to the long span of beam and relative stiffness of column.
Under vertical loading, the moments at ends of beams will reduce as well as the stiffness of
the beam reduces, leading to a reduced column end moments.
Z
5.0
00
10.000
35.000 35.000 35.000
XY
IPE300 /110Slab
HEA260HEA260
Against Y-directionLC1: vertical loading
European Erasmus Mundus Master Sustainable Constructions under natural hazards and catastrophic events 520121-1-2011-1-CZ-ERA MUNDUS-EMMC
12
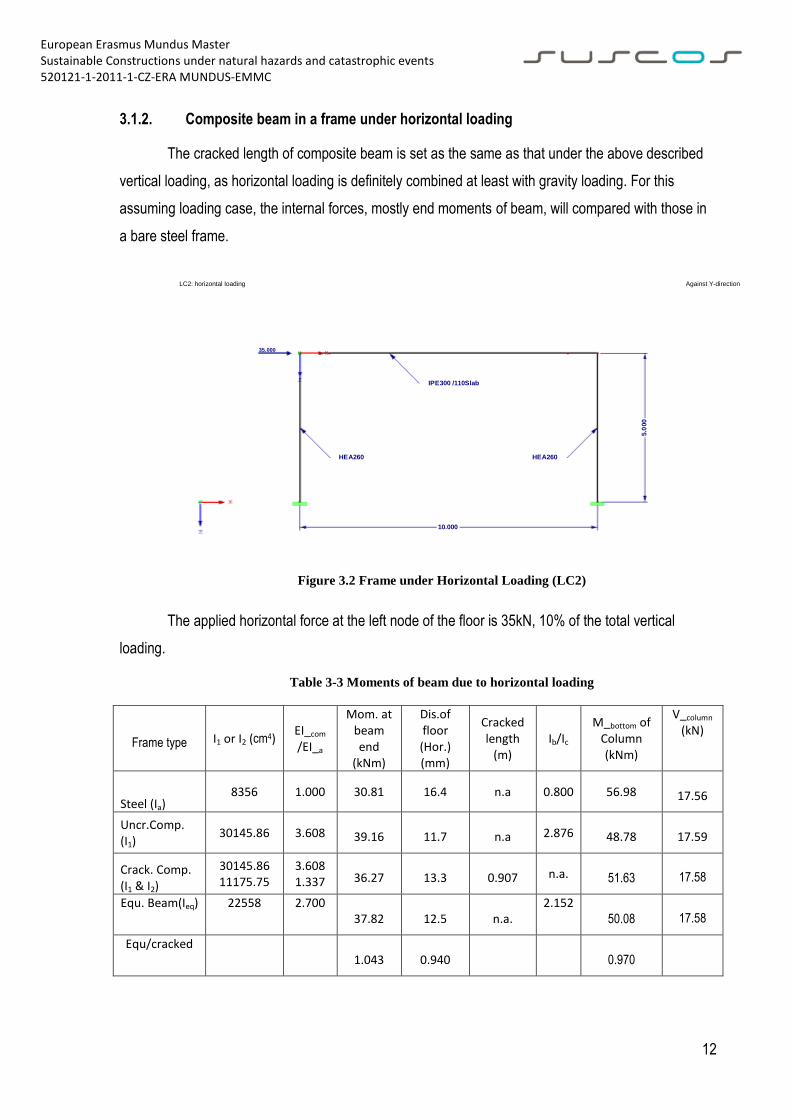
3.1.2. Composite beam in a frame under horizontal loading
The cracked length of composite beam is set as the same as that under the above described
vertical loading, as horizontal loading is definitely combined at least with gravity loading. For this
assuming loading case, the internal forces, mostly end moments of beam, will compared with those in
a bare steel frame.
Figure 3.2 Frame under Horizontal Loading (LC2)
The applied horizontal force at the left node of the floor is 35kN, 10% of the total vertical
loading.
Table 3-3 Moments of beam due to horizontal loading
Frame type I1 or I2 (cm4) EI_com
/EI_a
Mom. at beam end
(kNm)
Dis.of floor (Hor.) (mm)
Cracked length
(m) Ib/Ic
M_bottom of Column (kNm)
V_column (kN)
Steel (Ia) 8356 1.000 30.81 16.4 n.a 0.800 56.98 17.56
Uncr.Comp. (I1)
30145.86 3.608 39.16 11.7 n.a 2.876 48.78 17.59
Crack. Comp. (I1 & I2)
30145.86 11175.75
3.608 1.337 36.27 13.3 0.907 n.a. 51.63 17.58
Equ. Beam(Ieq) 22558 2.700 37.82 12.5 n.a.
2.152 50.08 17.58
Equ/cracked 1.043 0.940
0.970
Z
10.000
HEA260
35.000
5.0
00
XY
HEA260
IPE300 /110Slab
Against Y-directionLC2: horizontal loading

European Erasmus Mundus Master Sustainable Constructions under natural hazards and catastrophic events 520121-1-2011-1-CZ-ERA MUNDUS-EMMC
13
The end moments of beam reduce when the cracked stiffness of beam is applied, with an
increasing moments at the column bottom. With the equivalent beam, the results vary slightly from the
cracked beam method, with a difference less than 6%.
Under horizontal loading, the restrain of columns by beams is reduced with the introduction of
the rotational spring. The moments of the columns will increase. The moments of beams differ from the
rigid frame.
3.1.3. Composite beam in a frame under vertical and horizontal loading
The assumed horizontal loading is combined with the above disscused vertical laoding.
Frames are treated with linear elastic analysis.
Figure 3.3 Frame under vertical and horizontal loading
The main results are listed in Table 3-4 .
Table 3-4 Moments of beam due to vertical and horizontal loading
Frame type I1 or I2 (cm4)
EI_com
/EI_a
Cracked length
(m)
Mom. at left end
(kNm)
Mom. at
right end
(kNm)
Mom. at
span (max) (kNm)
Dis.of floor (Hor.) (mm)
Ver.Dis.of beam (mm)
V_column1 (kN)
V_column2 (kN)
Steel (Ia) 8356 1.000 n.a 209.66 271.16 197.09 2.6 91.7 53.02 88.02
Uncr.Comp. (I1)
30145.86 3.608 n.a 126.01 204.00 272.49 1.2 42.6 30.89 65.89
HEA260
5.0
00
10.000
35.000
35.000
Z
XY
HEA260
IPE300 110Slab
Against Y-directionCO3: 1H+1V

European Erasmus Mundus Master Sustainable Constructions under natural hazards and catastrophic events 520121-1-2011-1-CZ-ERA MUNDUS-EMMC
14
Crack. Comp. (I1 & I2)
30145.86 11175.75
3.608 1.337
0.692 1.104 115.05 187.12 287.16 0.6 44.7 26.80 61.80
Crack. 2 L_cr_Ver
30145.86 11175.75
3.608 1.337
0.907 115.44 187.71 285.93 0.6 44.7 26.95 61.95
Equ. Beam(Ieq)
22558 2.700 n.a. 147.58 222.96 252.23 1.6 50.5 36.84 71.84
Mpl-=198.78kNm, Mpl
+=332.33kNm
The equivalent beam methods seems to be unbelievable, mostly because its results for
vertical loading. If corrected initial end moments of cracked beams, which are mostly provided by
human “hand-calculation” and following input, are used, the redistribution of moments between beams
and columns would follow a “right” way. Until this correction is included in the some commercial
software, this method would stay in discussion for its unpractical usage.
The cracked lengths differ when considering the unequal bending moments at both ends
induced by horizontal loading. Fortunately this difference makes slight effects on stiffness and internal
forces of frame, if linear elastic analysis is permitted for frames in discussion. The “errors” are less than
1% in this example.
3.2. Effects of cracked length ratio of beam
It would be important for us to determine the cracked length considering the applied load
combinations on a resistance system. As these lengths differs for varied combination, it will be practical
to set the lengths of one load (combination) case as the most performed value for other combinations.
3.2.1. Stiffness of cracked beam
Based on the above consideration, the effects of cracked length ratio is studied, and the
results are showed as in Table 3-5. The resistance capacity of structures is excluded here, as an
increases loading (p=50kN/m) is introduced for comparison. The bending stiffness of steel elements is
multiplied by a modifier to simulate composite ones, while the section area and shear stiffness are left
as the initial value.
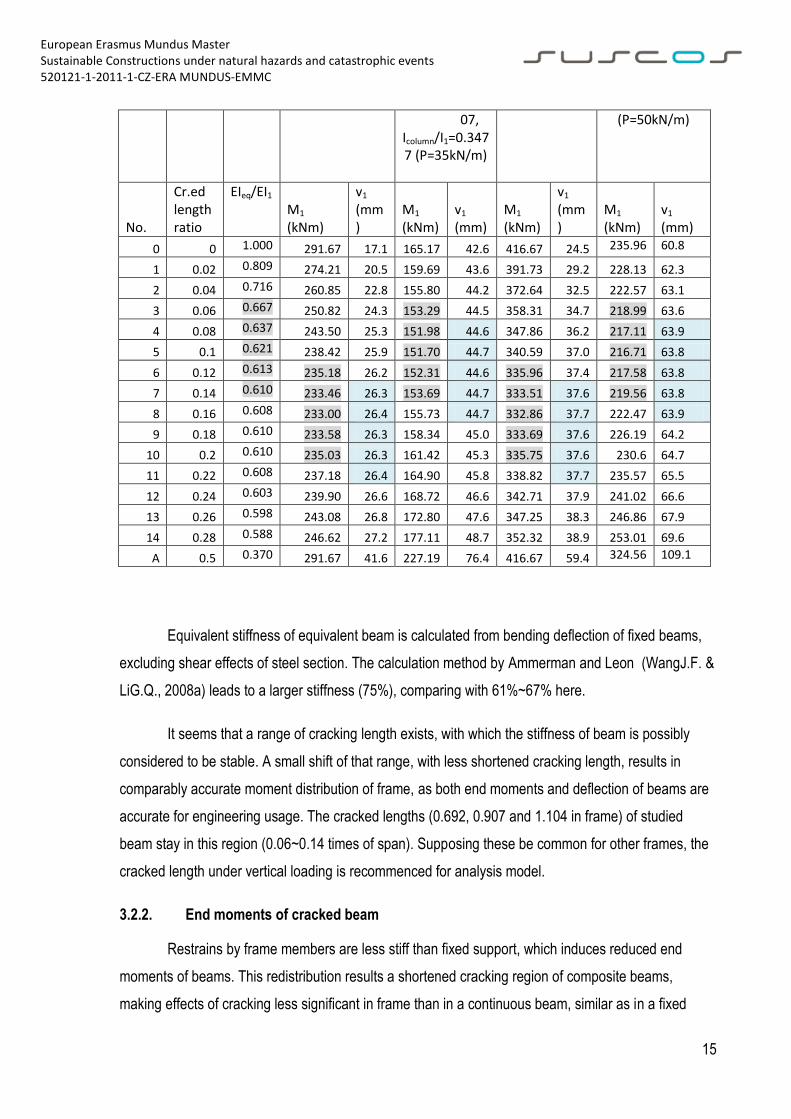
Table 3-5 Effects of length of cracked regions (I2/I1=0.371)
Beam ends fixed I2/I1=0.3707 (P=35kN/m)
Beam in Frame
I2/I1
=0.37
Beam ends fixed
I2/I1=0.3707 (P=50kN/m)
Beam in Frame I2/I1
=0.3707 Icolumn/I1=0.3477
European Erasmus Mundus Master Sustainable Constructions under natural hazards and catastrophic events 520121-1-2011-1-CZ-ERA MUNDUS-EMMC
15
07, Icolumn/I1=0.3477 (P=35kN/m)
(P=50kN/m)
No.
Cr.ed length ratio
EIeq/EI1 M1 (kNm)
v1 (mm)
M1 (kNm)
v1 (mm)
M1 (kNm)
v1 (mm)
M1 (kNm)
v1 (mm)
0 0 1.000 291.67 17.1 165.17 42.6 416.67 24.5 235.96 60.8
1 0.02 0.809 274.21 20.5 159.69 43.6 391.73 29.2 228.13 62.3
2 0.04 0.716 260.85 22.8 155.80 44.2 372.64 32.5 222.57 63.1
3 0.06 0.667 250.82 24.3 153.29 44.5 358.31 34.7 218.99 63.6
4 0.08 0.637 243.50 25.3 151.98 44.6 347.86 36.2 217.11 63.9
5 0.1 0.621 238.42 25.9 151.70 44.7 340.59 37.0 216.71 63.8
6 0.12 0.613 235.18 26.2 152.31 44.6 335.96 37.4 217.58 63.8
7 0.14 0.610 233.46 26.3 153.69 44.7 333.51 37.6 219.56 63.8
8 0.16 0.608 233.00 26.4 155.73 44.7 332.86 37.7 222.47 63.9
9 0.18 0.610 233.58 26.3 158.34 45.0 333.69 37.6 226.19 64.2
10 0.2 0.610 235.03 26.3 161.42 45.3 335.75 37.6 230.6 64.7
11 0.22 0.608 237.18 26.4 164.90 45.8 338.82 37.7 235.57 65.5
12 0.24 0.603 239.90 26.6 168.72 46.6 342.71 37.9 241.02 66.6
13 0.26 0.598 243.08 26.8 172.80 47.6 347.25 38.3 246.86 67.9
14 0.28 0.588 246.62 27.2 177.11 48.7 352.32 38.9 253.01 69.6
A 0.5 0.370 291.67 41.6 227.19 76.4 416.67 59.4 324.56 109.1
Equivalent stiffness of equivalent beam is calculated from bending deflection of fixed beams,
excluding shear effects of steel section. The calculation method by Ammerman and Leon (WangJ.F. &
LiG.Q., 2008a) leads to a larger stiffness (75%), comparing with 61%~67% here.
It seems that a range of cracking length exists, with which the stiffness of beam is possibly
considered to be stable. A small shift of that range, with less shortened cracking length, results in
comparably accurate moment distribution of frame, as both end moments and deflection of beams are
accurate for engineering usage. The cracked lengths (0.692, 0.907 and 1.104 in frame) of studied
beam stay in this region (0.06~0.14 times of span). Supposing these be common for other frames, the
cracked length under vertical loading is recommenced for analysis model.
3.2.2. End moments of cracked beam
Restrains by frame members are less stiff than fixed support, which induces reduced end
moments of beams. This redistribution results a shortened cracking region of composite beams,
making effects of cracking less significant in frame than in a continuous beam, similar as in a fixed

European Erasmus Mundus Master Sustainable Constructions under natural hazards and catastrophic events 520121-1-2011-1-CZ-ERA MUNDUS-EMMC
16
beam. The reduction of end moments of cracked beam is about 10% in study, while that of a fixed
beam is about 20%, as showed in section 2.2.
As horizontal loading is considered, the columns are required to resistance the induced shear
forces. Since the top moments reduce, balanced with the end moments of beams, the bottom moments
increase as a result of reduced stiffness, by introduction of cracked stiffness.
4. COMPOSITE FRAMES WITH SEMI-RIGID JOINTS
Before semi-rigid joints are widely studied, pinned connections are recommended in braced
frames for their easy fabrication and low expense. Their little flexural strength leads to a simple global
analysis and quick design, besides its full usage of the ultimate sagging bending capacity. Internal
forces and moments are statically determinate, which excludes the effects of cracking, creep or
shrinkage of concrete.
Similarly, rigid connections are preferred in practice thanks to its simplicity of global analysis.
As a result, full-strength rigid connections are needed, providing the connection part, by strength and
stiffness, is stronger enough than nearby elements connected. Eurocode classifies joints by stiffness
with varied criterion for braced and un-braced frames.
Between the regarded pinned and rigid classes there is a large gap which is filled by semi-rigid
connections, neglecting the reality that each connection has some degree of stiffness and bending
strength. EN1994 allows designer neglect effects of behaviour of joints, if its effects on distribution of
internal forces and moments, and on the overall deformations of the structure, are not significant. Even
through, rigid joints in composite frames are criticized for its complexity and high expense.
Recent research on joints is questioning the traditional analysis with idealized rigid or pinned
joints. The behaviour of the joints needs to be taken into account in those structures with semi-
continuous joints (EN1994-1-1, 2009). Development of finite elements analysis methods provides
possibility to account effects of flexibility of joints.
4.1. Research on semi-rigid frames
Semi-rigid connections are almost unavoidable in composite frames due to the composite
effects of steel and concrete. Pinned joints might be recommended for braced frame, but the
longitudinal reinforcement in the slab, responsible for control of cracking, will lead to partly resistance
for composite beams connected to an internal column. As for rigid, full-strength connections, extended

European Erasmus Mundus Master Sustainable Constructions under natural hazards and catastrophic events 520121-1-2011-1-CZ-ERA MUNDUS-EMMC
17
end plates with stiffeners will probably needed, as for steel joints. Even through the joints and beam
sections are strengthened by additional haunches, the column web zone may yield some degree of
flexibility, not considering the expense caused by complexity.
With this consideration, semi-rigid joints or semi-rigid frames are widely studied during the last
decades. Nethercot (Nethercot D. , 1995) (Nethercot & Stylianidis, 2008) recommended simplified
plastic design methods for braced frames, or non-sway frames under vertical loading. As for global
instability analysis, Demonceau proposed an approach, which is comparable with the column
verification method in Eurocode. In his approach, critical load factor αcr and plastic load factor αpl are
used in a formula to foresee a reduction factor χ. By multiplying χ with αpl, the ultimate load factor is
expected (Demonceau, 2008).
4.2. Bending stiffness of joints
Knowledge of the connection‟s moment-rotation (M-Φ) characteristic is vital for estimating the
effects of joint performance on the frame behaviour. A general form of curve by Zandonini (1989) is
given in Figure 4.1, (Nethercot D. , 1995) which highlights the non-linearity of joint‟s performance.
Figure 4.1 Most general form of moment-rotation characteristic (Nethercot D. , 1995)

European Erasmus Mundus Master Sustainable Constructions under natural hazards and catastrophic events 520121-1-2011-1-CZ-ERA MUNDUS-EMMC
18
As numerical analysis of frames concerned, equations for the complete M-θ curves have been
proposed, from databases based on tests. Beside the simplified bilinear elastic-plastic curve, power
function models and Richard-Abbott model have been processed, but are criticised for their uncertain
and unreliable variables. (Tamboli, 1999)
A detailed nonlinear finite element analysis of connection has been used to develop M-θ
curves. Component method approach is proposed by Eurocodes, where each deformation mechanism
of joint components involved is activated in analysis. While this study focuses on global analysis, the
CM approach is briefly introduced in following section.
4.2.1. Components Method
Components Method is recommended in EN1993-1-8, to determine the joints‟ properties in
frames. Basic components and their properties are identified, while a joint is modelled as an assembly
of these components. Applying resistance of components with cooperation conditions, the main
structural properties, namely moment resistance Mj,Rd, rotational stiffness Sj (or initial stiffness Sj,ini)and
rotation capacity ΦCd, are to determined.
By numerical analysis with finite element software package, the M-θ curve of joints is possibly
to be simulated, when properties of each component are activated (Eldemerdash, Abu-Lebdeh, & Al
Nasra, 2012). As for end-plate connection under hogging moments, components involved mostly are
listed in Table 4-1. (Demonceau, 2008)
Table 4-1 Components to be considered for end-plate connection under hogging moments
(Demonceau, 2008)
Zones Components
Compression zone
Column web in compression
Beam flange and web in compression
Tension zone
Column web in tension
Column flange in bending
Bolts in tension
End-plate in bending

European Erasmus Mundus Master Sustainable Constructions under natural hazards and catastrophic events 520121-1-2011-1-CZ-ERA MUNDUS-EMMC
19
Beam web in tension
Slab rebars in tension
Shear zone Column web panel in shear
Aside from commercial software package, spring model is widely used, where the components
are represented by spring, with their strength and stiffness either in tension or in compression or in
shear, and their interactions are defined in numerical analysis. By assembling the springs, relationship
of loading and response is analysed and M-θ curve of studied connections is possible obtained.
(Drozd, 2012)
Figure 4.2 Example of a spring model for a composite end-plate connection (Demonceau, 2008)
4.2.2. Bending stiffness at unloading stage
Another comment on joint‟s property is its different bending stiffness when loading and
unloading, which might influence response of frame under loading process. Chen declaimed impacts of
stiffness difference on frames under wind loading (Chen & Atsuta, 1997) (Chen, 1999).
As showed in Figure 4.3, if the bending the joints in the opposite direction, reduction of
moment of joint will be almost linearly, for example the joints at the side facing wind. The stiffness
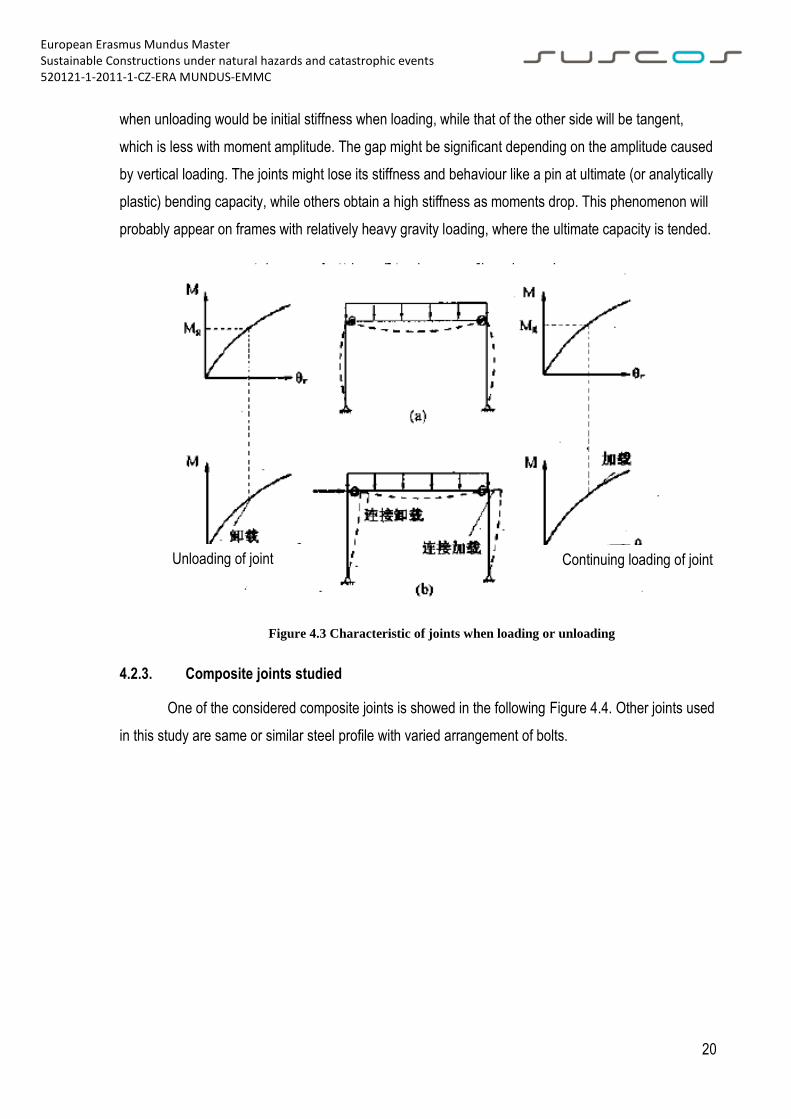
European Erasmus Mundus Master Sustainable Constructions under natural hazards and catastrophic events 520121-1-2011-1-CZ-ERA MUNDUS-EMMC
20
when unloading would be initial stiffness when loading, while that of the other side will be tangent,
which is less with moment amplitude. The gap might be significant depending on the amplitude caused
by vertical loading. The joints might lose its stiffness and behaviour like a pin at ultimate (or analytically
plastic) bending capacity, while others obtain a high stiffness as moments drop. This phenomenon will
probably appear on frames with relatively heavy gravity loading, where the ultimate capacity is tended.
Figure 4.3 Characteristic of joints when loading or unloading
4.2.3. Composite joints studied
One of the considered composite joints is showed in the following Figure 4.4. Other joints used
in this study are same or similar steel profile with varied arrangement of bolts.
Unloading of joint Continuing loading of joint
European Erasmus Mundus Master Sustainable Constructions under natural hazards and catastrophic events 520121-1-2011-1-CZ-ERA MUNDUS-EMMC
21
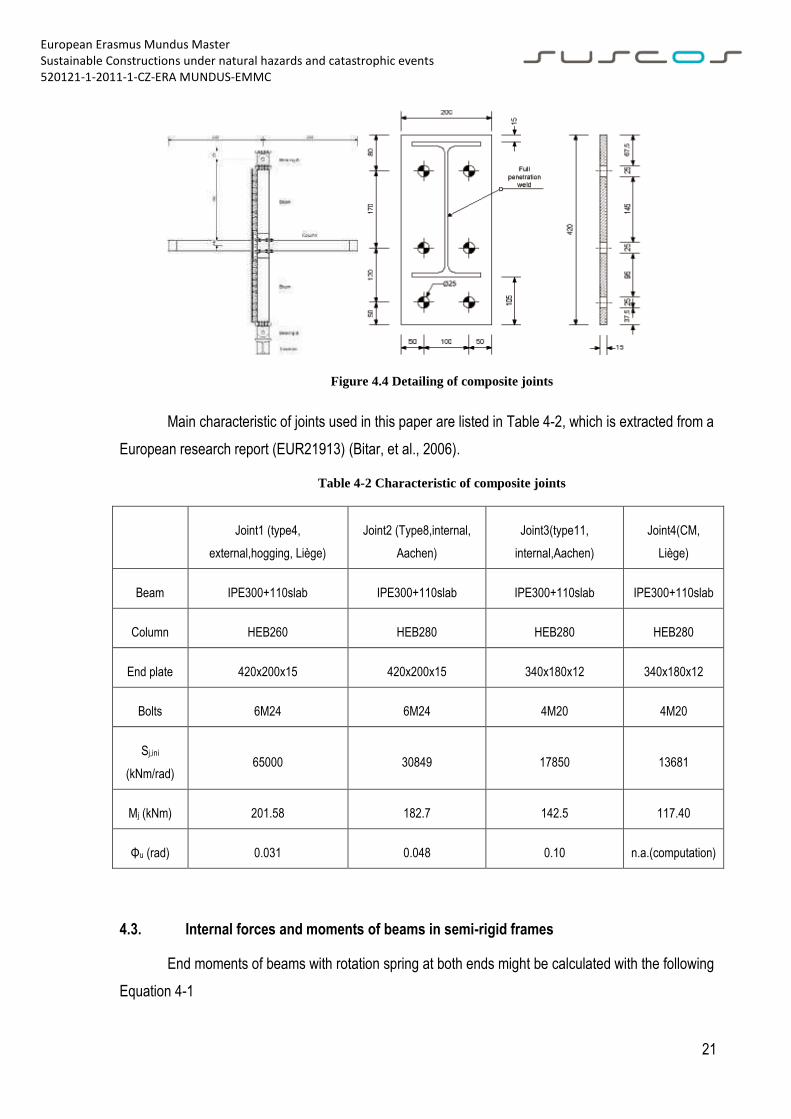
Figure 4.4 Detailing of composite joints
Main characteristic of joints used in this paper are listed in Table 4-2, which is extracted from a
European research report (EUR21913) (Bitar, et al., 2006).
Table 4-2 Characteristic of composite joints
Joint1 (type4,
external,hogging, Liège)
Joint2 (Type8,internal,
Aachen)
Joint3(type11,
internal,Aachen)
Joint4(CM,
Liège)
Beam IPE300+110slab IPE300+110slab IPE300+110slab IPE300+110slab
Column HEB260 HEB280 HEB280 HEB280
End plate 420x200x15 420x200x15 340x180x12 340x180x12
Bolts 6M24 6M24 4M20 4M20
Sj,ini
(kNm/rad) 65000 30849 17850 13681
Mj (kNm) 201.58 182.7 142.5 117.40
Φu (rad) 0.031 0.048 0.10 n.a.(computation)
4.3. Internal forces and moments of beams in semi-rigid frames
End moments of beams with rotation spring at both ends might be calculated with the following
Equation 4-1

European Erasmus Mundus Master Sustainable Constructions under natural hazards and catastrophic events 520121-1-2011-1-CZ-ERA MUNDUS-EMMC
22
, where MFA and MFB are end moments of beams with idealized fixed supports, while Sbeam, SkA
and SkB are stiffness of beam and of rotation springs respectively. (Wang, Li, & Li, 2003)
6
1 4
6
1 4
/
/
/
FA B FBA
A B A B
FB A FAB
A B A B
beam beam beam beam
A beam kA
B eam kB
M MM
M MM
S E I L
S S
S S
Equation 4-1
These equations might be used for steel frame, followed by global analysis using equivalent
beam stiffness methods. For composite beams the uncertainty of cracking length makes it less useful
as the beam stiffness is in question.
4.3.1. Moments of semi-rigid frames under vertical loading
A composite frame with rotation spring at beam to column connections is studied, under
vertical loading only. Element profile is the same as described above. Numerical analysis using
programme gives results as showed in Table 4-4.
Figure 4.5 Composite frame with semi-rigid connection
35.000 35.000 35.000
X
Z
Y
Against Y-directionCO2: composite beam, calculation with stiffness factor
European Erasmus Mundus Master Sustainable Constructions under natural hazards and catastrophic events 520121-1-2011-1-CZ-ERA MUNDUS-EMMC
23
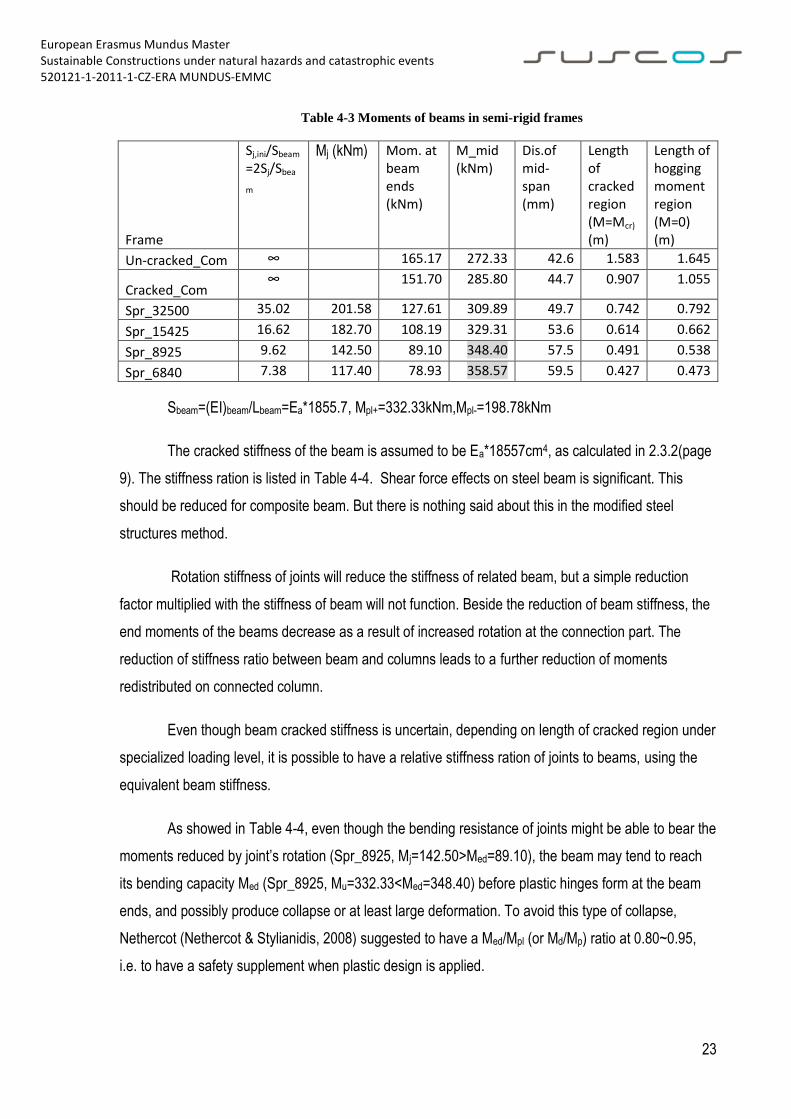
Table 4-3 Moments of beams in semi-rigid frames
Frame
Sj,ini/Sbeam =2Sj/Sbea
m
Mj (kNm) Mom. at beam ends (kNm)
M_mid (kNm)
Dis.of mid-span (mm)
Length of cracked region (M=Mcr) (m)
Length of hogging moment region (M=0) (m)
Un-cracked_Com ∞ 165.17 272.33 42.6 1.583 1.645
Cracked_Com ∞ 151.70 285.80 44.7 0.907 1.055
Spr_32500 35.02 201.58 127.61 309.89 49.7 0.742 0.792
Spr_15425 16.62 182.70 108.19 329.31 53.6 0.614 0.662
Spr_8925 9.62 142.50 89.10 348.40 57.5 0.491 0.538
Spr_6840 7.38 117.40 78.93 358.57 59.5 0.427 0.473
Sbeam=(EI)beam/Lbeam=Ea*1855.7, Mpl+=332.33kNm,Mpl-=198.78kNm
The cracked stiffness of the beam is assumed to be Ea*18557cm4, as calculated in 2.3.2(page
9). The stiffness ration is listed in Table 4-4. Shear force effects on steel beam is significant. This
should be reduced for composite beam. But there is nothing said about this in the modified steel
structures method.
Rotation stiffness of joints will reduce the stiffness of related beam, but a simple reduction
factor multiplied with the stiffness of beam will not function. Beside the reduction of beam stiffness, the
end moments of the beams decrease as a result of increased rotation at the connection part. The
reduction of stiffness ratio between beam and columns leads to a further reduction of moments
redistributed on connected column.
Even though beam cracked stiffness is uncertain, depending on length of cracked region under
specialized loading level, it is possible to have a relative stiffness ration of joints to beams, using the
equivalent beam stiffness.
As showed in Table 4-4, even though the bending resistance of joints might be able to bear the
moments reduced by joint‟s rotation (Spr_8925, Mj=142.50>Med=89.10), the beam may tend to reach
its bending capacity Med (Spr_8925, Mu=332.33<Med=348.40) before plastic hinges form at the beam
ends, and possibly produce collapse or at least large deformation. To avoid this type of collapse,
Nethercot (Nethercot & Stylianidis, 2008) suggested to have a Med/Mpl (or Md/Mp) ratio at 0.80~0.95,
i.e. to have a safety supplement when plastic design is applied.
European Erasmus Mundus Master Sustainable Constructions under natural hazards and catastrophic events 520121-1-2011-1-CZ-ERA MUNDUS-EMMC
24
Considering a plastic design for this case (Spr_8925), from Mj=142.50kN/m and
Mtotal=437.5kNm, the maximal sagging moment is expected to be Med (or Md) =295.0kNm, which is
0.88 times Mpl+ (or Mp). The simplified methods, based on the assumption that plastic hinges firstly
form at beam ends, might lead to an un-conservative result for joints with lower rotation stiffness. In
this case, the rotation capacity of the composite beam at span should be checked. It should be
mentioned that the discussed joints might be classed as rigid in a braced frame as Sj,ini/(EIb/Lb)=9.62,
which is larger than kb=8, if Eurocode is applied. (EN1994-1-1, 2009)
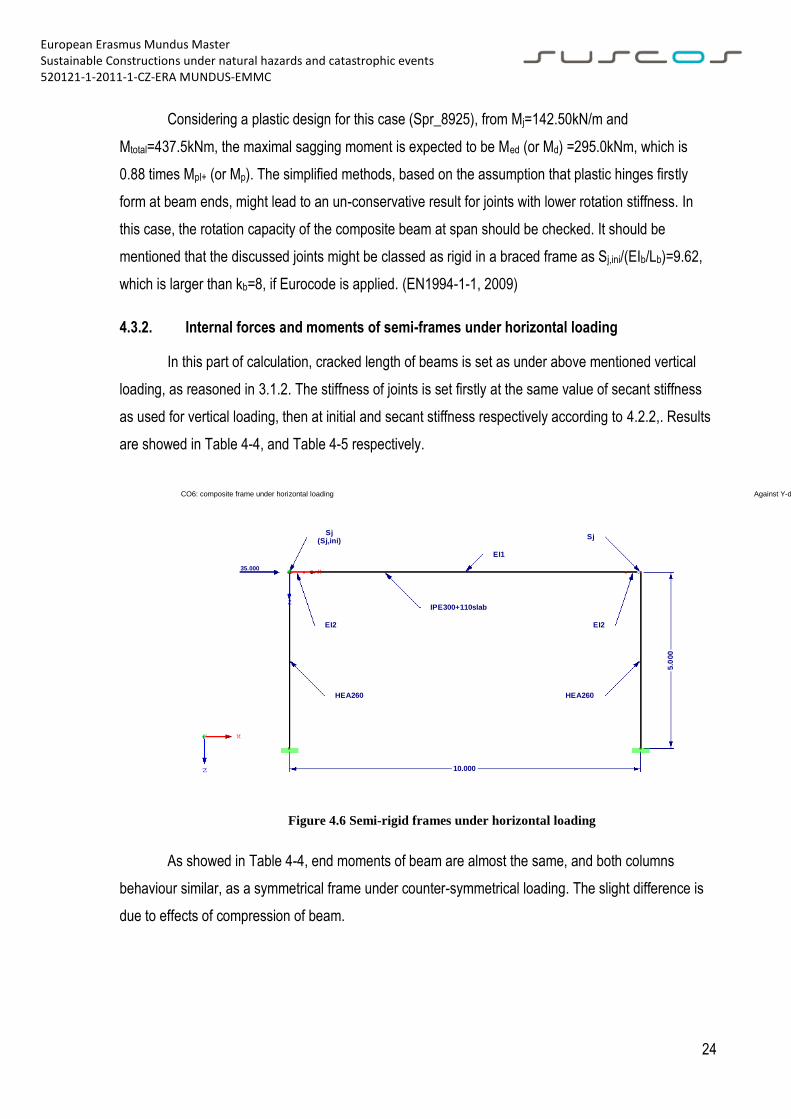
4.3.2. Internal forces and moments of semi-frames under horizontal loading
In this part of calculation, cracked length of beams is set as under above mentioned vertical
loading, as reasoned in 3.1.2. The stiffness of joints is set firstly at the same value of secant stiffness
as used for vertical loading, then at initial and secant stiffness respectively according to 4.2.2,. Results
are showed in Table 4-4, and Table 4-5 respectively.
Figure 4.6 Semi-rigid frames under horizontal loading
As showed in Table 4-4, end moments of beam are almost the same, and both columns
behaviour similar, as a symmetrical frame under counter-symmetrical loading. The slight difference is
due to effects of compression of beam.
Sj
5.0
00
EI2
EI1
35.000
EI2
10.000
X
IPE300+110slabZ
Y
HEA260 HEA260
Sj(Sj,ini)
Against Y-directionCO6: composite frame under horizontal loading
European Erasmus Mundus Master Sustainable Constructions under natural hazards and catastrophic events 520121-1-2011-1-CZ-ERA MUNDUS-EMMC
25
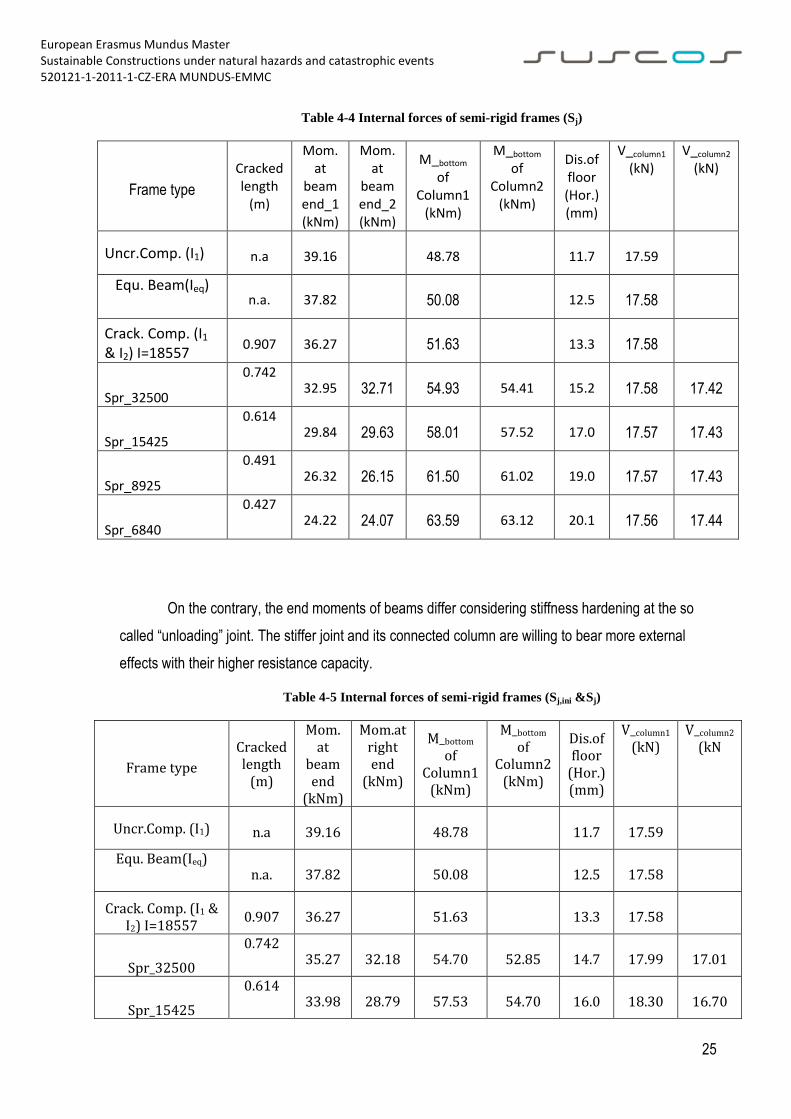
Table 4-4 Internal forces of semi-rigid frames (Sj)
Frame type
Cracked length
(m)
Mom. at
beam end_1 (kNm)
Mom. at
beam end_2 (kNm)
M_bottom of
Column1 (kNm)
M_bottom of
Column2 (kNm)
Dis.of floor (Hor.) (mm)
V_column1 (kN)
V_column2 (kN)
Uncr.Comp. (I1) n.a 39.16 48.78 11.7 17.59
Equ. Beam(Ieq) n.a. 37.82 50.08 12.5 17.58
Crack. Comp. (I1 & I2) I=18557
0.907 36.27 51.63 13.3 17.58
Spr_32500
0.742 32.95 32.71 54.93 54.41 15.2 17.58 17.42
Spr_15425
0.614 29.84 29.63 58.01 57.52 17.0 17.57 17.43
Spr_8925
0.491 26.32 26.15 61.50 61.02 19.0 17.57 17.43
Spr_6840
0.427 24.22 24.07 63.59 63.12 20.1 17.56 17.44
On the contrary, the end moments of beams differ considering stiffness hardening at the so
called “unloading” joint. The stiffer joint and its connected column are willing to bear more external
effects with their higher resistance capacity.
Table 4-5 Internal forces of semi-rigid frames (Sj,ini &Sj)
Frame type
Cracked length
(m)
Mom. at
beam end
(kNm)
Mom.at right end
(kNm)
M_bottom of
Column1 (kNm)
M_bottom of
Column2 (kNm)
Dis.of floor
(Hor.) (mm)
V_column1 (kN)
V_column2 (kN
Uncr.Comp. (I1) n.a 39.16 48.78 11.7 17.59
Equ. Beam(Ieq) n.a. 37.82 50.08 12.5 17.58
Crack. Comp. (I1 & I2) I=18557
0.907 36.27 51.63 13.3 17.58
Spr_32500
0.742 35.27 32.18 54.70 52.85 14.7 17.99 17.01
Spr_15425
0.614 33.98 28.79 57.53 54.70 16.0 18.30 16.70

European Erasmus Mundus Master Sustainable Constructions under natural hazards and catastrophic events 520121-1-2011-1-CZ-ERA MUNDUS-EMMC
26
Spr_8925
0.491 32.09 25.13 60.72 57.06 17.6 18.56 16.44
Spr_6840
0.427 30.74 23.02 62.63 58.62 18.6 18.67 16.33
It seems neglecting the stiffness hardening will lead to a conservative result, as the structure is
more slender. (Eldemerdash, Abu-Lebdeh, & Al Nasra, 2012)
4.4. Critical load factor αcr
Above results of linear elastic analysis, or first order analysis, neglected effects of deformation.
Under loading, deformation of elements and structures from their initial geometry, might lead to
redistribution of internal forces and thus to further deformation. These impacts should be included if the
structure, normally a slender or relative slender one, is sensitive to deformation. In other words, if the
increase of the relevant internal forces or moments or any other change of structural behaviour caused
by deformations cannot be neglected, and a so-called second order analysis should be employed.
For steel and/or composite structures, if the increase of relevant forces or moments caused by
the deformations given by first-order analysis is less than 10%, effects of loading induced deformation
might be neglected, thus results from a first order analysis are regarded accurate enough for
engineering usage. Structures extended that limitation should be treated with second order analysis.
(EN1993-1-1, 2005) (EN1994-1-1, 2009)
4.4.1. Critical load analysis
Critical load theory dated back to Euler for his famous column formula, and has been
expanded to include any member, component, or structural system with significant portions in
compression. First-order elastic critical analysis is traditionally an eigenvalue problem, with assumed
buckled mode shapes.
Even though elastic critical loads, as upper bound values, are for most buildings considerably
higher than the inelastic limit points, and have limited practical value for frame design, they have
proved useful in determining amplification factors to approximate second-order effects (Ziemian, 2010).
A critical load factor is also possible obtained with second order analysis, using modern analysis
European Erasmus Mundus Master Sustainable Constructions under natural hazards and catastrophic events 520121-1-2011-1-CZ-ERA MUNDUS-EMMC
27
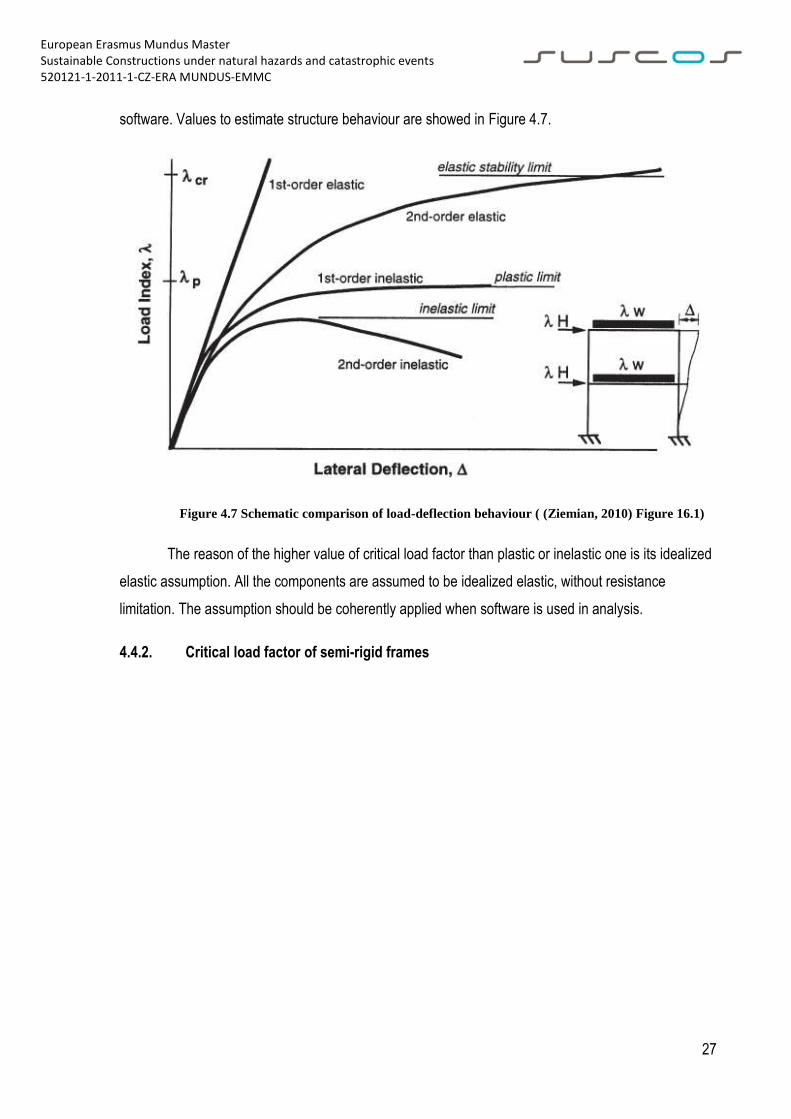
software. Values to estimate structure behaviour are showed in Figure 4.7.
Figure 4.7 Schematic comparison of load-deflection behaviour ( (Ziemian, 2010) Figure 16.1)
The reason of the higher value of critical load factor than plastic or inelastic one is its idealized
elastic assumption. All the components are assumed to be idealized elastic, without resistance
limitation. The assumption should be coherently applied when software is used in analysis.
4.4.2. Critical load factor of semi-rigid frames
European Erasmus Mundus Master Sustainable Constructions under natural hazards and catastrophic events 520121-1-2011-1-CZ-ERA MUNDUS-EMMC
28
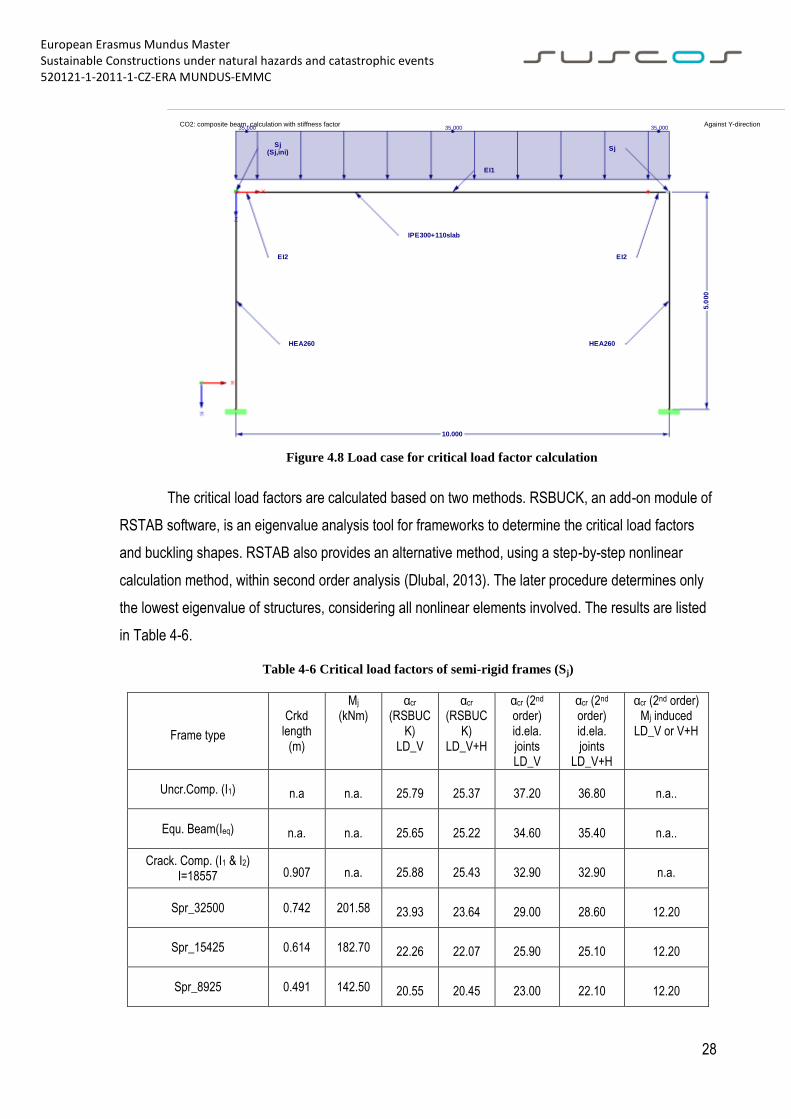
Figure 4.8 Load case for critical load factor calculation
The critical load factors are calculated based on two methods. RSBUCK, an add-on module of
RSTAB software, is an eigenvalue analysis tool for frameworks to determine the critical load factors
and buckling shapes. RSTAB also provides an alternative method, using a step-by-step nonlinear
calculation method, within second order analysis (Dlubal, 2013). The later procedure determines only
the lowest eigenvalue of structures, considering all nonlinear elements involved. The results are listed
in Table 4-6.
Table 4-6 Critical load factors of semi-rigid frames (Sj)
Frame type
Crkd length
(m)
Mj (kNm)
αcr (RSBUC
K) LD_V
αcr (RSBUC
K) LD_V+H
αcr (2nd order) id.ela. joints LD_V
αcr (2nd order) id.ela. joints
LD_V+H
αcr (2nd order) Mj induced
LD_V or V+H
Uncr.Comp. (I1) n.a n.a. 25.79 25.37 37.20 36.80 n.a..
Equ. Beam(Ieq) n.a. n.a. 25.65 25.22 34.60 35.40 n.a..
Crack. Comp. (I1 & I2) I=18557 0.907 n.a. 25.88 25.43 32.90 32.90 n.a.
Spr_32500 0.742 201.58 23.93 23.64 29.00 28.60 12.20
Spr_15425 0.614 182.70 22.26 22.07 25.90 25.10 12.20
Spr_8925 0.491 142.50 20.55 20.45 23.00 22.10 12.20
EI2
10.000
EI1
Sj
35.000 35.000
5.0
00
35.000
X
HEA260
Z
Y
HEA260
EI2
Sj(Sj,ini)
IPE300+110slab
Against Y-directionCO2: composite beam, calculation with stiffness factor
European Erasmus Mundus Master Sustainable Constructions under natural hazards and catastrophic events 520121-1-2011-1-CZ-ERA MUNDUS-EMMC
29
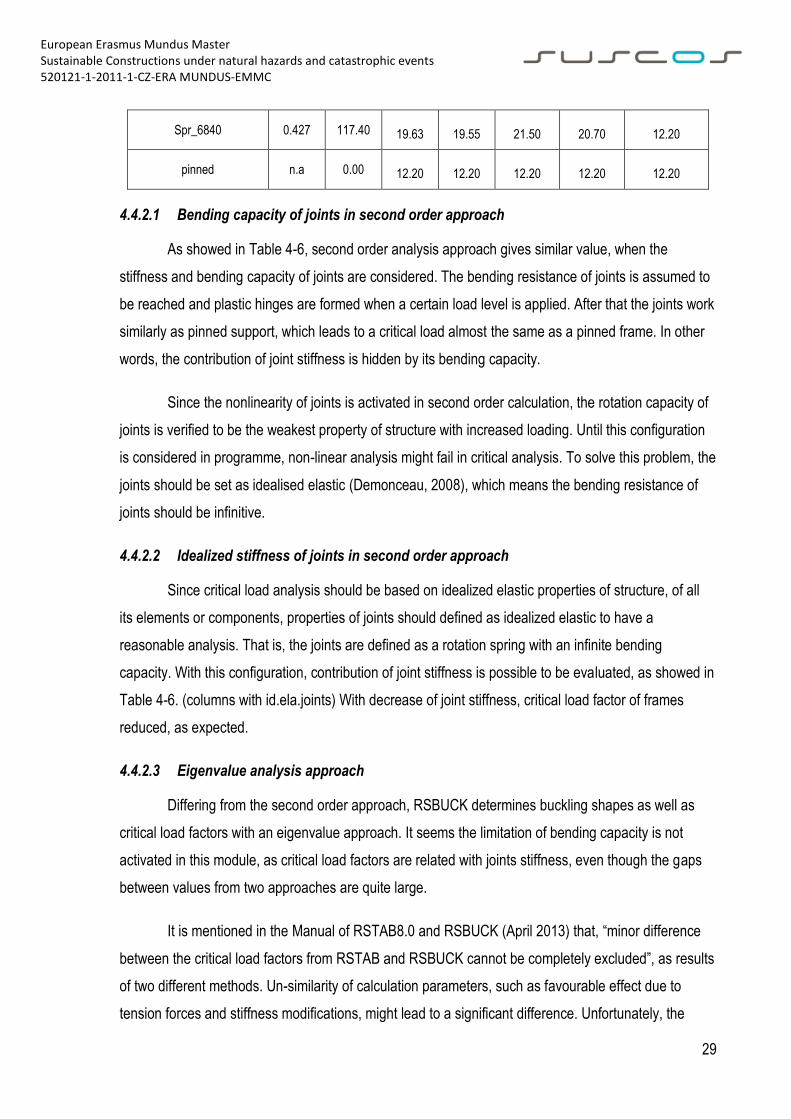
Spr_6840 0.427 117.40 19.63 19.55 21.50 20.70 12.20
pinned n.a 0.00 12.20 12.20 12.20 12.20 12.20
4.4.2.1 Bending capacity of joints in second order approach
As showed in Table 4-6, second order analysis approach gives similar value, when the
stiffness and bending capacity of joints are considered. The bending resistance of joints is assumed to
be reached and plastic hinges are formed when a certain load level is applied. After that the joints work
similarly as pinned support, which leads to a critical load almost the same as a pinned frame. In other
words, the contribution of joint stiffness is hidden by its bending capacity.
Since the nonlinearity of joints is activated in second order calculation, the rotation capacity of
joints is verified to be the weakest property of structure with increased loading. Until this configuration
is considered in programme, non-linear analysis might fail in critical analysis. To solve this problem, the
joints should be set as idealised elastic (Demonceau, 2008), which means the bending resistance of
joints should be infinitive.
4.4.2.2 Idealized stiffness of joints in second order approach
Since critical load analysis should be based on idealized elastic properties of structure, of all
its elements or components, properties of joints should defined as idealized elastic to have a
reasonable analysis. That is, the joints are defined as a rotation spring with an infinite bending
capacity. With this configuration, contribution of joint stiffness is possible to be evaluated, as showed in
Table 4-6. (columns with id.ela.joints) With decrease of joint stiffness, critical load factor of frames
reduced, as expected.
4.4.2.3 Eigenvalue analysis approach
Differing from the second order approach, RSBUCK determines buckling shapes as well as
critical load factors with an eigenvalue approach. It seems the limitation of bending capacity is not
activated in this module, as critical load factors are related with joints stiffness, even though the gaps
between values from two approaches are quite large.
It is mentioned in the Manual of RSTAB8.0 and RSBUCK (April 2013) that, “minor difference
between the critical load factors from RSTAB and RSBUCK cannot be completely excluded”, as results
of two different methods. Un-similarity of calculation parameters, such as favourable effect due to
tension forces and stiffness modifications, might lead to a significant difference. Unfortunately, the

European Erasmus Mundus Master Sustainable Constructions under natural hazards and catastrophic events 520121-1-2011-1-CZ-ERA MUNDUS-EMMC
30
difference might be significant for some frames, ranging from 0% for pinned frame to 29.4% for rigid
one, as showed in this example.
4.4.3. Study on Critical load factor of semi-rigid steel frames
To identify effects of semi-rigid joints, steel frames are used here. Steel frames with same
profile are calculated, without stiffness modifiers and introduction of crack region. The properties of
composite joints are used here. Results are listed in Table 4-7 and Table 4-8
Similar as the composite frames, critical load factors of semi-rigid frames with limited rotation
capacity of joints (Mj) are same as a pinned frame, using the second order analysis method. Differing
from the RSBUCK eigenvalue approach, RSTAB determines the critical load factor based on a
nonlinear calculation method while all nonlinear elements, including failing members or supports are
considered. The end release will work as a pin when its bending capacity is reached under a relatively
lower loading level, which leads to similar critical load as a pinned beam. Comparing with an infinite
rotation spring, the Mj seems to be too small to have any effect on critical load factor.
The second phenomenon is the results of both approaches for idealized rotation springs. The
results of second-order analysis increase with the joint stiffness, large as 55.2% for rigid frame. As
explained in software package, the RSBUCK eigenvalue analysis is based on the load case definition
in the main programme, which is defined and used for RSTAB analysis. The internal forces and
deflection of elements are introduced into RSBUCK as foundation of buckling shapes. There is
unfortunately no clue to identify the result difference of the two methods; even if the manuals declaim
“minor difference” is expected.
Variations are made in frame elements, trying to find the effects of both approaches. Steel
frames are used, to minimise influence of stiffness modifiers. The gaps reduce with a smaller span,
having same steel profile of beam and columns. Slender frames (such as long spans) are mostly
labelled with different values, while frames with two spans and/or two storeys have similar values,
considering both calculation methods.

European Erasmus Mundus Master Sustainable Constructions under natural hazards and catastrophic events 520121-1-2011-1-CZ-ERA MUNDUS-EMMC
31
Table 4-7 Critical load factor of steel frames (L=10m)
Frame type
Sj,ini/Sb
=2SjL/EIb
Mj (kNm)
αcr (2nd order) id.ela. joints LD_V
αcr (2nd order) id.ela. joints
LD_V+H
αcr (2nd order) id.ela. joints
LD_2V+H
αcr (RSBUCK
) LD_V
αcr (RSBUCK) LD_V+H
αcr (RSBUCK
) LD_2V+H
αcr (2nd order)
Mj induced LD_V
rigid ∞ n.a. 16.80 15.40 14.40 26.08 25.58 25.10 16.80
Spr_32500 37.04 201.58 16.00 14.50 13.50 24.24 23.93 23.63 12.30
Spr_15425 17.58 182.70 15.50 13.90 12.90 22.63 22.43 22.24 12.30
Spr_8925 10.17 142.50 15.30 13.70 12.50 20.95 20.83 20.72 12.30
Spr_6840 7.80 117.40 15.40 13.70 12.50 20.02 19.93 19.86 12.30
Spr_3420 3.90 58.70 16.50 17.50 17.20 17.56 17.54 17.53 12.30
pinned 0 0.00 12.30 12.30 12.30 12.38 12.40 12.43 12.30
Table 4-8 Critical load factor of steel frames (L=7m)
Frame type
Sj,ini/Sb
=2SjL/EIb
αcr (2nd order) id.ela. joints LD_V
αcr (2nd order) id.ela. joints
LD_V+H
αcr (2nd order) id.ela. joints
LD_2V+H
αcr (RSBUCK
) LD_V
αcr (RSBUCK) LD_V+H
αcr (RSBUCK
) LD_2V+H
rigid ∞ 43.50 45.70 47.80 44.14 43.59 43.05
Spr_32500 37.04 38.90 40.40 39.50 39.20 38.89 38.61
Spr_15425 17.58 35.20 35.50 34.10 35.42 35.24 35.09
Spr_8925 10.17 31.80 31.10 29.90 31.89 31.80 31.74
Spr_6840 7.80 30.00 29.10 28.00 30.09 30.04 30.01
Spr_3420 3.90 25.60 24.50 23.80 25.70 25.70 25.73
pinned 0 17.60 17.60 17.60 17.69 17.71 17.78

32
5 PARAMETRIC STUDY
Parametric study on critical load factor and moment redistribution, of steel and composite
frame, is performed in this part. The variables include rotation stiffness of joints, together with span and
height of frame. The calculation is carried out with FEM programme RSTAB 8.0, element end releases
are used to simulate function of rotation characteristics of joints. (Dlubal, 2013) (Dlubal, 2013a)
5.1 Steel frames
To eliminate effects of concrete cracking, results of a series of steel frames are presented in
this section. The principal frames are showed in the following figure.
Figure 5.1 Steel frames studied
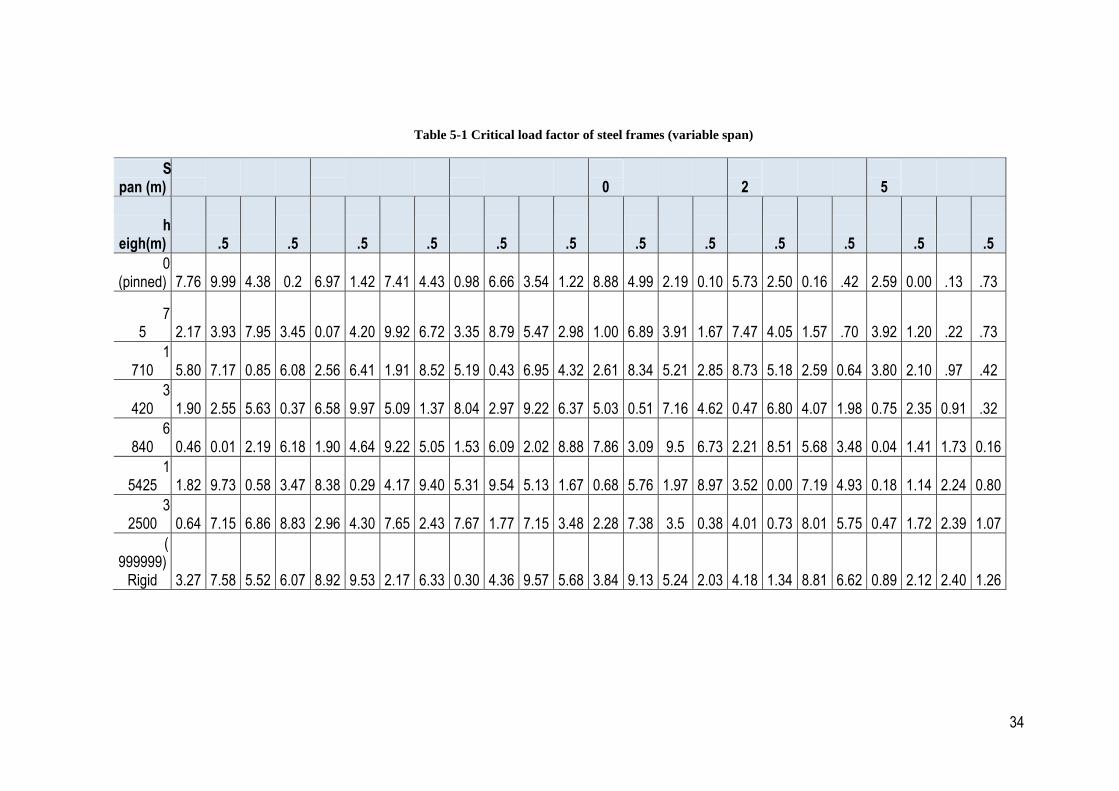
5.1.1 Critical load factors
A series of steel frames are studied, with varied span, height, and joint rotation stiffness.
Critical load factors are calculated with eigenvalue analysis approach in RSBUCK module. Results are
showed in Table 5-1.
It should be mentioned that there is difference from eigenvalue analysis and a second-order
stability approach. The reason might be out-plane element buckling or strength capacity of cross-
section, as any limited capacity with non-linearity of any part of the frame will lead to buckling
performance of the whole frame. Different values of critical load factors are curved in following figure.
7m,9m,10m,12m
10.000
X
Rigid
5.0
00
Rotation Spring (Sj)
Rigid
IPE300steelZ
Y
HEA260 HEA260
Rotation Spring (Sj)
Against Y-direction

European Erasmus Mundus Master Sustainable Constructions under natural hazards and catastrophic events 520121-1-2011-1-CZ-ERA MUNDUS-EMMC
33
Figure 5.2 αcr Value according to different approaches
As showed in the following figures, both rigid and semi-rigid frames lose part of its capacity for
critical load, as span increase. The main reason is the increased axial force of columns, while less
restrain is provided by large span beams.
34
Table 5-1 Critical load factor of steel frames (variable span)
Span (m) 5
7
9
10
12
15
heigh(m) 4
4.5 5
5.5 4
4.5 5
5.5 4
4.5 5
5.5 4
4.5 5
5.5 4
4.5 5
5.5 4
4.5 5
5.5
0 (pinned)
37.76
29.99
24.38
20.2
26.97
21.42
17.41
14.43
20.98
16.66
13.54
11.22
18.88
14.99
12.19
10.10
15.73
12.50
10.16
8.42
12.59
10.00
8.13
6.73
75
42.17
33.93
27.95
23.45
30.07
24.20
19.92
16.72
23.35
18.79
15.47
12.98
21.00
16.89
13.91
11.67
17.47
14.05
11.57
9.70
13.92
11.20
9.22
7.73
1710
45.80
37.17
30.85
26.08
32.56
26.41
21.91
18.52
25.19
20.43
16.95
14.32
22.61
18.34
15.21
12.85
18.73
15.18
12.59
10.64
13.80
12.10
9.97
8.42
3420
51.90
42.55
35.63
30.37
36.58
29.97
25.09
21.37
28.04
22.97
19.22
16.37
25.03
20.51
17.16
14.62
20.47
16.80
14.07
11.98
10.75
12.35
10.91
9.32
6840
60.46
50.01
42.19
36.18
41.90
34.64
29.22
25.05
31.53
26.09
22.02
18.88
27.86
23.09
19.5
16.73
22.21
18.51
15.68
13.48
10.04
11.41
11.73
10.16
15425
71.82
59.73
50.58
43.47
48.38
40.29
34.17
29.40
35.31
29.54
25.13
21.67
30.68
25.76
21.97
18.97
23.52
20.00
17.19
14.93
10.18
11.14
12.24
10.80
32500
80.64
67.15
56.86
48.83
52.96
44.30
37.65
32.43
37.67
31.77
27.15
23.48
32.28
27.38
23.5
20.38
24.01
20.73
18.01
15.75
10.47
11.72
12.39
11.07
(999999)
Rigid 9
3.27 7
7.58 6
5.52 5
6.07 5
8.92 4
9.53 4
2.17 3
6.33 4
0.30 3
4.36 2
9.57 2
5.68 3
3.84 2
9.13 2
5.24 2
2.03 2
4.18 2
1.34 1
8.81 1
6.62 1
0.89 1
2.12 1
2.40 1
1.26

35
Figure 5.3 Critical Load factors vs. Span
(Rigid for span=15m, Rotation stiffness Sj=15425kNm/rad)
Figure 5.4 Critical load factors (Semi-rigid steel frames)
(Rotation stiffness Sj=15425kNm/rad)
Span (m)
Span (m)
Span (m)

European Erasmus Mundus Master Sustainable Constructions under natural hazards and catastrophic events 520121-1-2011-1-CZ-ERA MUNDUS-EMMC
36
Figure 5.5 Critical load factors (Semi-rigid steel frames)
With reduction of the rotation stiffness, critical load of frames reduced. It is mentioned that αcr
might reduce 15%~25%, when Sj/Sbeam is equal to 25, which is considered as rigid joints to EN 1994
and EN1993.
Figure 5.6 Critical load factor vs. Joints stiffness
Figure 5.7 Critical load factor vs. column height
Sj (kNm/rad)

European Erasmus Mundus Master Sustainable Constructions under natural hazards and catastrophic events 520121-1-2011-1-CZ-ERA MUNDUS-EMMC
37
5.1.2 Moments at joints
5.1.2.1 Effects of Joint stiffness
The frames studied are the same as for critical load analysis. Vertical loading is employed. Some results are listed in Table 5-2.
Table 5-2 Moment of joint in a 1-spam 1-storey frame
Span (m)
Sj spring
(kNm/rad) joint
classification
Hight (m)
M2 M3 (kNm)
M5 (Load_V+H)
(kNm) a
lfa_ RSBUCK
Alfa_2order
Angle
φ_3-
φ_2
(mrad) 1
0 pi
nned pinn
ed 5 0 0 1
3.38 12.3 8
3.1
10
438
pinned 5
31.66
35.47
13.33 13.3
72.3
10
875
semi-rigid 5
55.96
62.74
14.16 14.1
64
10
1710
semi-rigid 5
89.64
100.60
15.52 15.4
52.5
10
3420
semi-rigid 5
130.94
147.10
17.56 16.5
38.3
10
6840
semi-rigid 5
170.13
191.33
20.02 15.4
24.8
10
15425
semi-rigid 5
204.13
229.78
22.63 15.5
13.2
10
32500 rigid 5
222.77
250.89
24.24 16
6.8
10
rigid rigid 5
242.79
273.59
26.08 16.8 0
The results are curved below, where M2 is end moment of beam under vertical loading, and
M5 is the maximum end moment of beam under vertical and horizontal loading. Rotation angle of joints
are computed from rotation deformation of column and beam at joint.
For a joint stiffness at 0.25Sbeam (where Sj,ini/Sbeam=0.5) , which could be considered as pinned,
the joint moment is 31.66kNm and 35.47kNm, about 8% of mid-span moment of pinned beams.
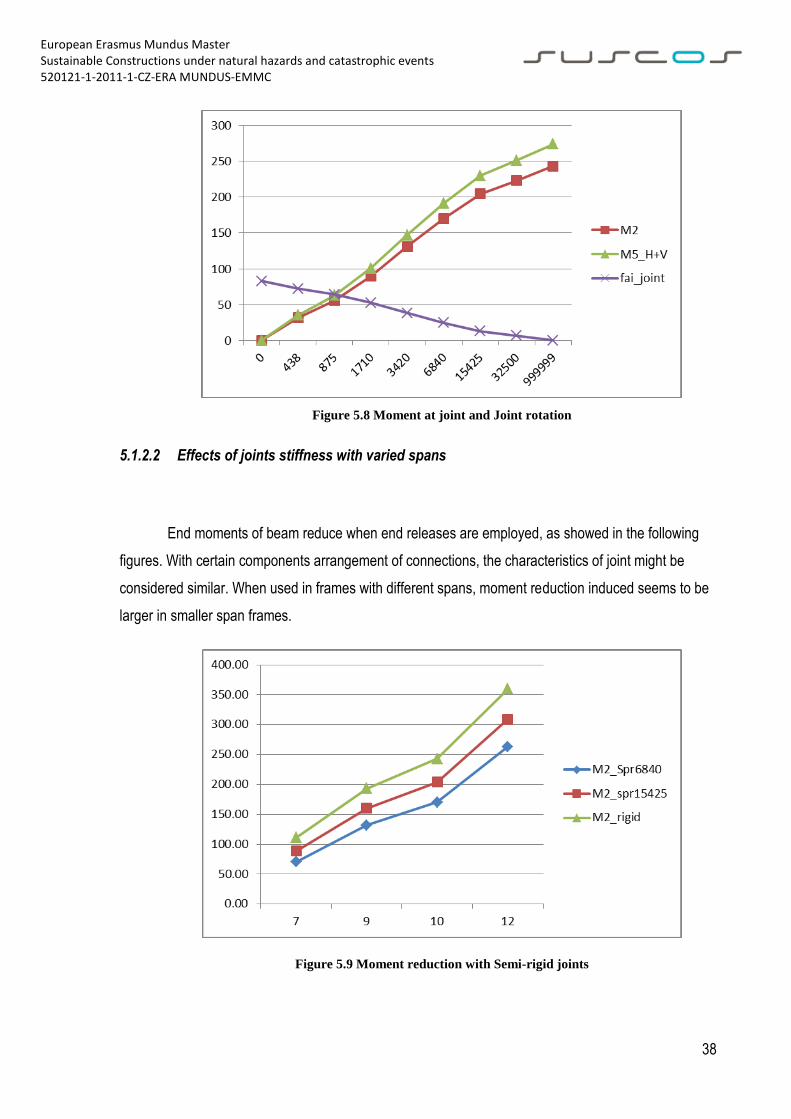
European Erasmus Mundus Master Sustainable Constructions under natural hazards and catastrophic events 520121-1-2011-1-CZ-ERA MUNDUS-EMMC
38
Figure 5.8 Moment at joint and Joint rotation
5.1.2.2 Effects of joints stiffness with varied spans
End moments of beam reduce when end releases are employed, as showed in the following
figures. With certain components arrangement of connections, the characteristics of joint might be
considered similar. When used in frames with different spans, moment reduction induced seems to be
larger in smaller span frames.
Figure 5.9 Moment reduction with Semi-rigid joints

European Erasmus Mundus Master Sustainable Constructions under natural hazards and catastrophic events 520121-1-2011-1-CZ-ERA MUNDUS-EMMC
39
Figure 5.10 Moment Redistribution with semi-rigid joints
Moment redistribution will be proportionally, if the stiffness ratio is constant, as showed for
0.25Sj/Sbeam in the below Figure 5.10 and Table 5-3.
Figure 5.11 Moment of joint in frames
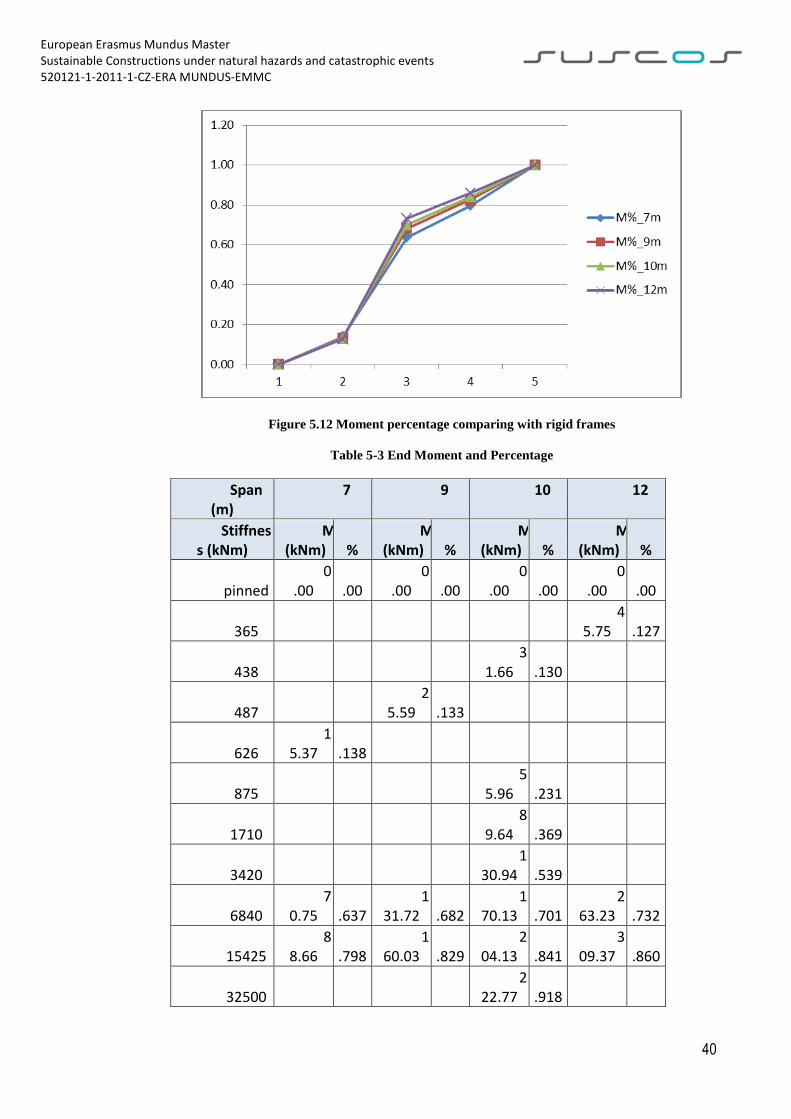
European Erasmus Mundus Master Sustainable Constructions under natural hazards and catastrophic events 520121-1-2011-1-CZ-ERA MUNDUS-EMMC
40
Figure 5.12 Moment percentage comparing with rigid frames
Table 5-3 End Moment and Percentage
Span (m)
7 9 10 12
Stiffness (kNm)
M (kNm)
M%
M (kNm)
M%
M (kNm)
M%
M (kNm)
M%
pinned 0
.00 0
.00 0
.00 0
.00 0
.00 0
.00 0
.00 0
.00
365
45.75
0.127
438
31.66
0.130
487
25.59
0.133
626 1
5.37 0
.138
875
55.96
0.231
1710
89.64
0.369
3420
130.94
0.539
6840 7
0.75 0
.637 1
31.72 0
.682 1
70.13 0
.701 2
63.23 0
.732
15425 8
8.66 0
.798 1
60.03 0
.829 2
04.13 0
.841 3
09.37 0
.860
32500
222.77
0.918
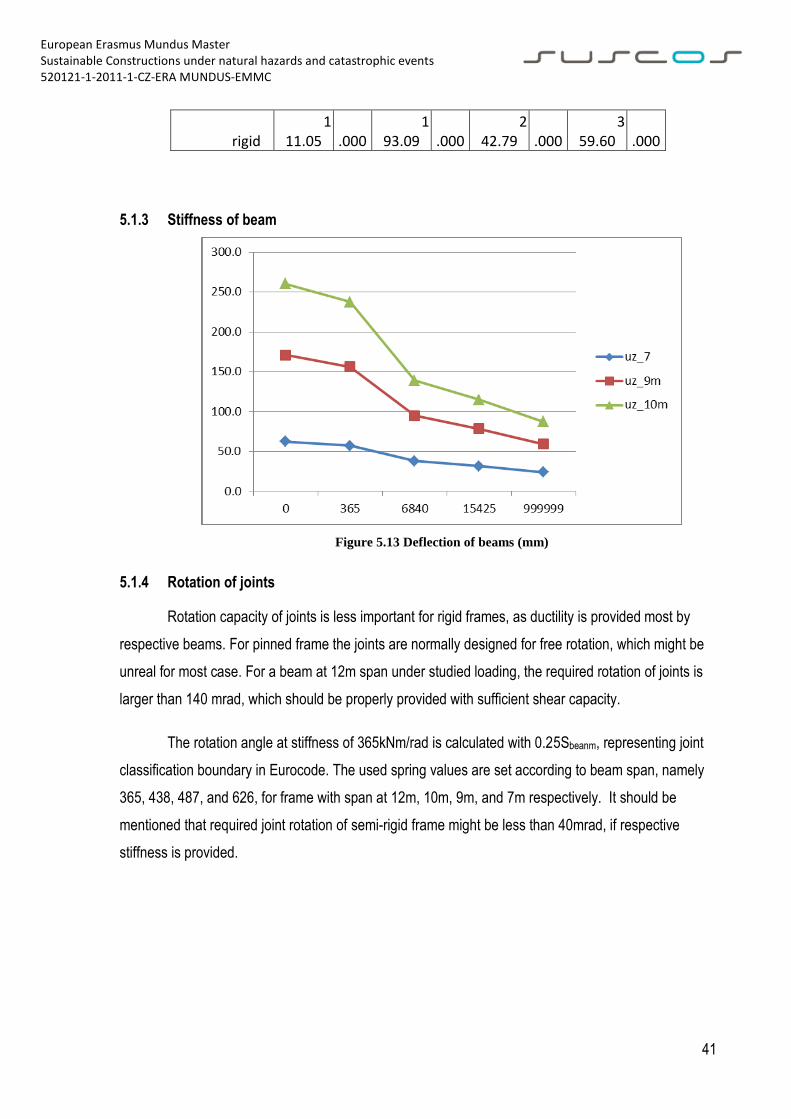
European Erasmus Mundus Master Sustainable Constructions under natural hazards and catastrophic events 520121-1-2011-1-CZ-ERA MUNDUS-EMMC
41
rigid 1
11.05 1
.000 1
93.09 1
.000 2
42.79 1
.000 3
59.60 1
.000
5.1.3 Stiffness of beam
Figure 5.13 Deflection of beams (mm)
5.1.4 Rotation of joints
Rotation capacity of joints is less important for rigid frames, as ductility is provided most by
respective beams. For pinned frame the joints are normally designed for free rotation, which might be
unreal for most case. For a beam at 12m span under studied loading, the required rotation of joints is
larger than 140 mrad, which should be properly provided with sufficient shear capacity.
The rotation angle at stiffness of 365kNm/rad is calculated with 0.25Sbeanm, representing joint
classification boundary in Eurocode. The used spring values are set according to beam span, namely
365, 438, 487, and 626, for frame with span at 12m, 10m, 9m, and 7m respectively. It should be
mentioned that required joint rotation of semi-rigid frame might be less than 40mrad, if respective
stiffness is provided.
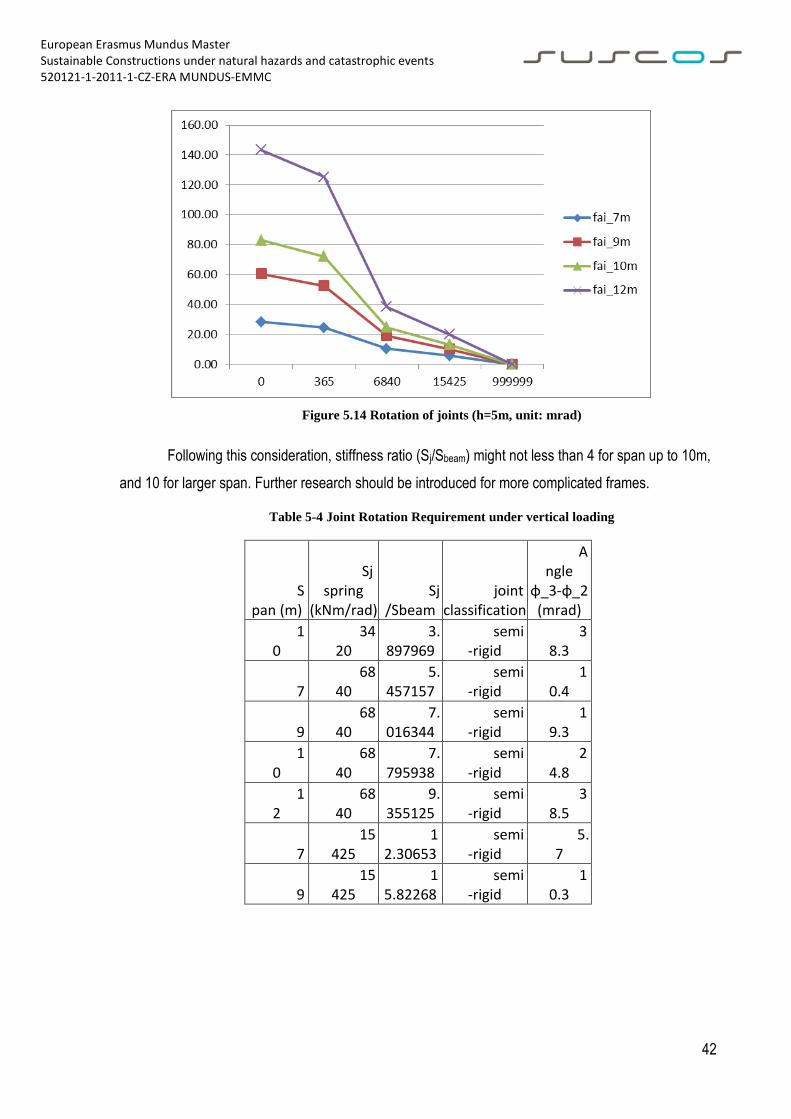
European Erasmus Mundus Master Sustainable Constructions under natural hazards and catastrophic events 520121-1-2011-1-CZ-ERA MUNDUS-EMMC
42
Figure 5.14 Rotation of joints (h=5m, unit: mrad)
Following this consideration, stiffness ratio (Sj/Sbeam) might not less than 4 for span up to 10m,
and 10 for larger span. Further research should be introduced for more complicated frames.
Table 5-4 Joint Rotation Requirement under vertical loading
Span (m)
Sj spring
(kNm/rad) Sj
/Sbeam joint
classification
Angle
φ_3-φ_2 (mrad)
10
3420
3.897969
semi-rigid
38.3
7 68
40 5.
457157 semi
-rigid 1
0.4
9 68
40 7.
016344 semi
-rigid 1
9.3
10
6840
7.795938
semi-rigid
24.8
12
6840
9.355125
semi-rigid
38.5
7 15
425 1
2.30653 semi
-rigid 5.
7
9 15
425 1
5.82268 semi
-rigid 1
0.3
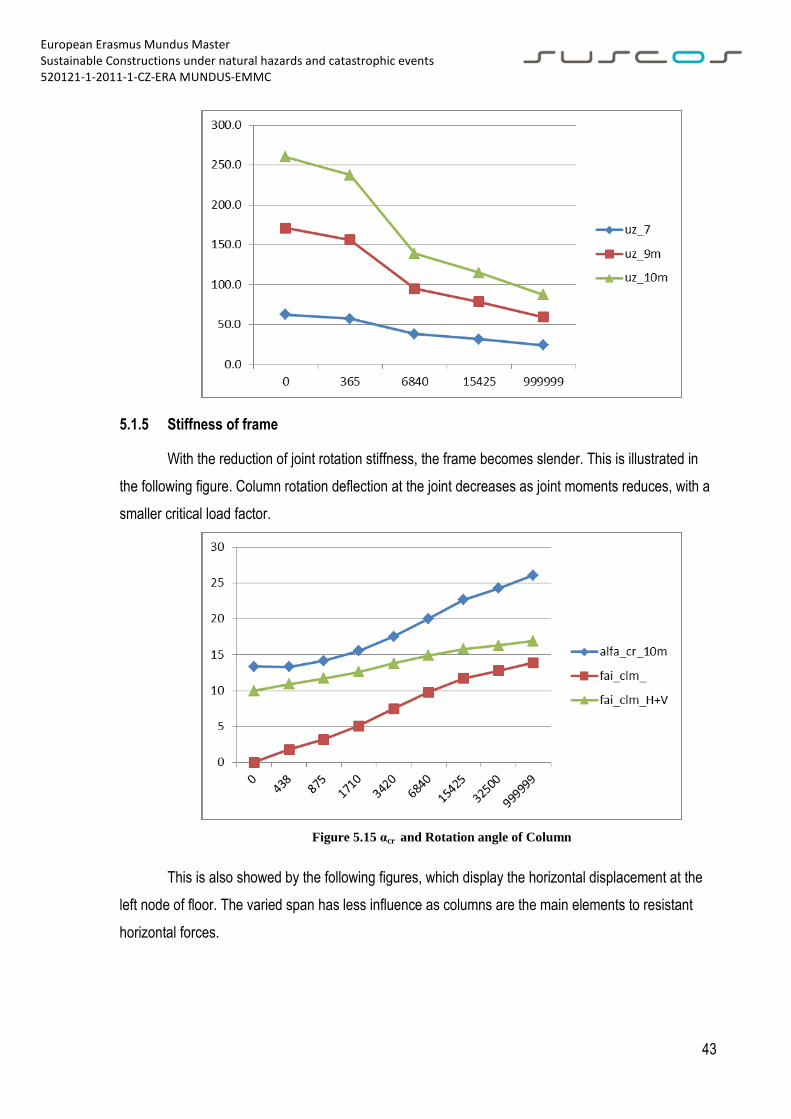
European Erasmus Mundus Master Sustainable Constructions under natural hazards and catastrophic events 520121-1-2011-1-CZ-ERA MUNDUS-EMMC
43
5.1.5 Stiffness of frame
With the reduction of joint rotation stiffness, the frame becomes slender. This is illustrated in
the following figure. Column rotation deflection at the joint decreases as joint moments reduces, with a
smaller critical load factor.
Figure 5.15 αcr and Rotation angle of Column
This is also showed by the following figures, which display the horizontal displacement at the
left node of floor. The varied span has less influence as columns are the main elements to resistant
horizontal forces.

European Erasmus Mundus Master Sustainable Constructions under natural hazards and catastrophic events 520121-1-2011-1-CZ-ERA MUNDUS-EMMC
44
Figure 5.16 Horizontal displacement of frame (h=5m unit: mm)
Figure 5.17 Horizontal displacement of frame (h=5m, unit: mm)
5.2 Composite frames
A series of one-span one-storey frames are studied, using RSTAB8.0 programme. The setting
of spans and heights is showed as in Figure 5.18 . A load case with only vertical loading is used, for
study of cracking length, moment distribution, beam stiffness, joint rotation, and critical load analysis.
Additional load case is set when horizontal node force is combined with the above vertical loading.
Cracking lengths of beams are set as result of vertical loading, as proposed in Part 2. The loading is
showed in Figure 5.19.

European Erasmus Mundus Master Sustainable Constructions under natural hazards and catastrophic events 520121-1-2011-1-CZ-ERA MUNDUS-EMMC
45
Figure 5.18 Composite frame studied
Cracking length of beams is calculated iteratively, while the moment and cracking length
coverage on perfect coherence for almost all case but one. The exception is a 7-meter span at 5-
meter height frame, with a joint stiffness of 1000kNm/rad. The respective Sj/Sbeam is 0.221, which is
considered as pinned according to EN1994-1-1. The cracking length used in study is the conservative
one with no cracking, which leads to some degree of incoherence, as showed in following explaination.
Table 5-5 Example of divergent iteration
irritation order
initial x_crk
End
Moment
x cracked length
@M=Mcrk=7.351
Frame data
1 0
.099 7
.08 -0.0022 L=7m
M_crk=7.35kNm
q=35kN/m R1=122.
5kN
2 0
.000 2
2.62 0.1269
3 0
.127 7
.08 -0.0022
4m,4.5m,5m,5.5m
IPE300+slabEI1
Rigid
Semi-rigid (Sj)
Pinned
7m,9m,10m,12m,15m
10.000
5.0
00
Rigid
Semi-rigid (Sj)
Pinned
IPE300+rebarEI2
X
Fixed
Z
Y
HEA260+ HEA260+
Fixed
IPE300+rebarEI2
Against Y-direction
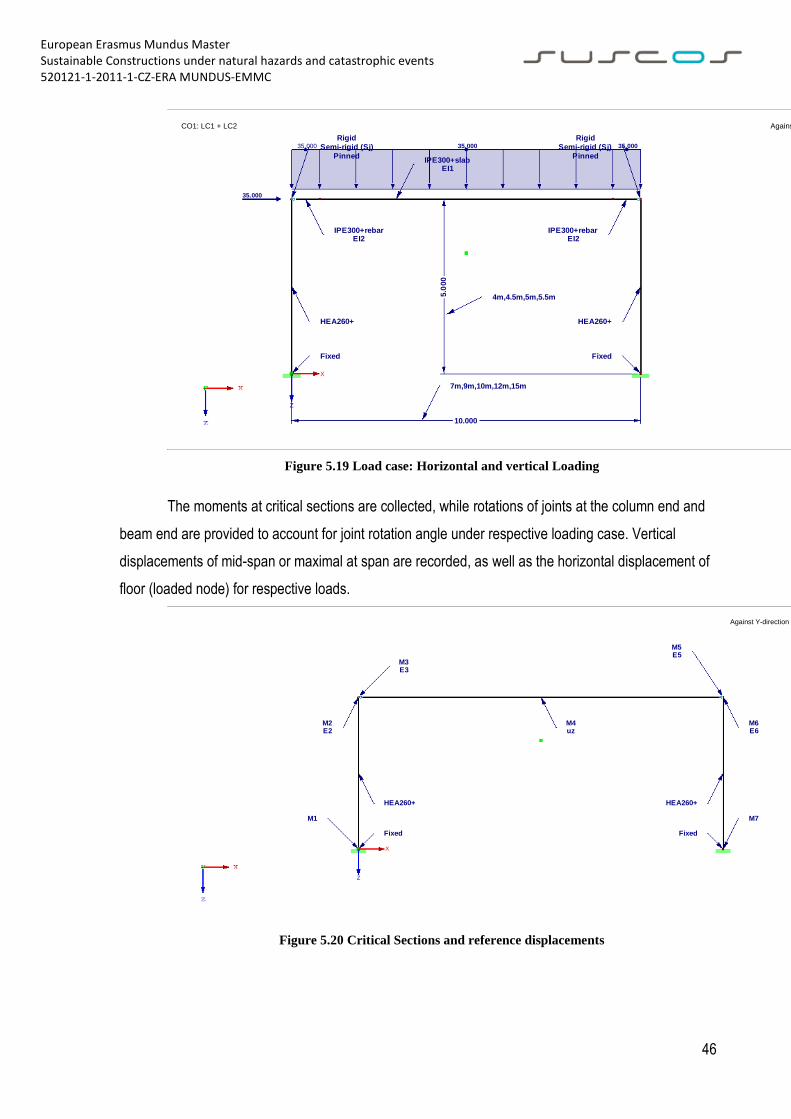
European Erasmus Mundus Master Sustainable Constructions under natural hazards and catastrophic events 520121-1-2011-1-CZ-ERA MUNDUS-EMMC
46
Figure 5.19 Load case: Horizontal and vertical Loading
The moments at critical sections are collected, while rotations of joints at the column end and
beam end are provided to account for joint rotation angle under respective loading case. Vertical
displacements of mid-span or maximal at span are recorded, as well as the horizontal displacement of
floor (loaded node) for respective loads.
Figure 5.20 Critical Sections and reference displacements
10.000
Rigid
Semi-rigid (Sj)
Pinned
IPE300+rebarEI2
4m,4.5m,5m,5.5m
IPE300+slabEI1
35.000
35.000 35.000
5.0
00
35.000
Fixed
X
Fixed
Z
Y
7m,9m,10m,12m,15m
HEA260+
Rigid
Semi-rigid (Sj)
Pinned
IPE300+rebarEI2
HEA260+
Against Y-directionCO1: LC1 + LC2
M6E6
M2E2
HEA260+
M1
M3E3
M7
M5E5
X
M4uz
Z
Y
HEA260+
Fixed Fixed
Against Y-direction

European Erasmus Mundus Master Sustainable Constructions under natural hazards and catastrophic events 520121-1-2011-1-CZ-ERA MUNDUS-EMMC
47
5.2.1 Critical load factors
As showed in following figures, the critical load factor will reduce toward that of a pinned frame
when the stiffness of joints decreases. Rotation stiffness at value of 999999 is the result of idealized
rigid frame, if not further explained in the following parts.
Figure 5.21 αcr-Sj curve 1 (Span =10m)
Figure 5.22 αcr-Sj curve 2 (h=5m)
The curves are not parallel at spans, especially whit a large span, where the beam stiffness is
more sensitive to the joint stiffness.
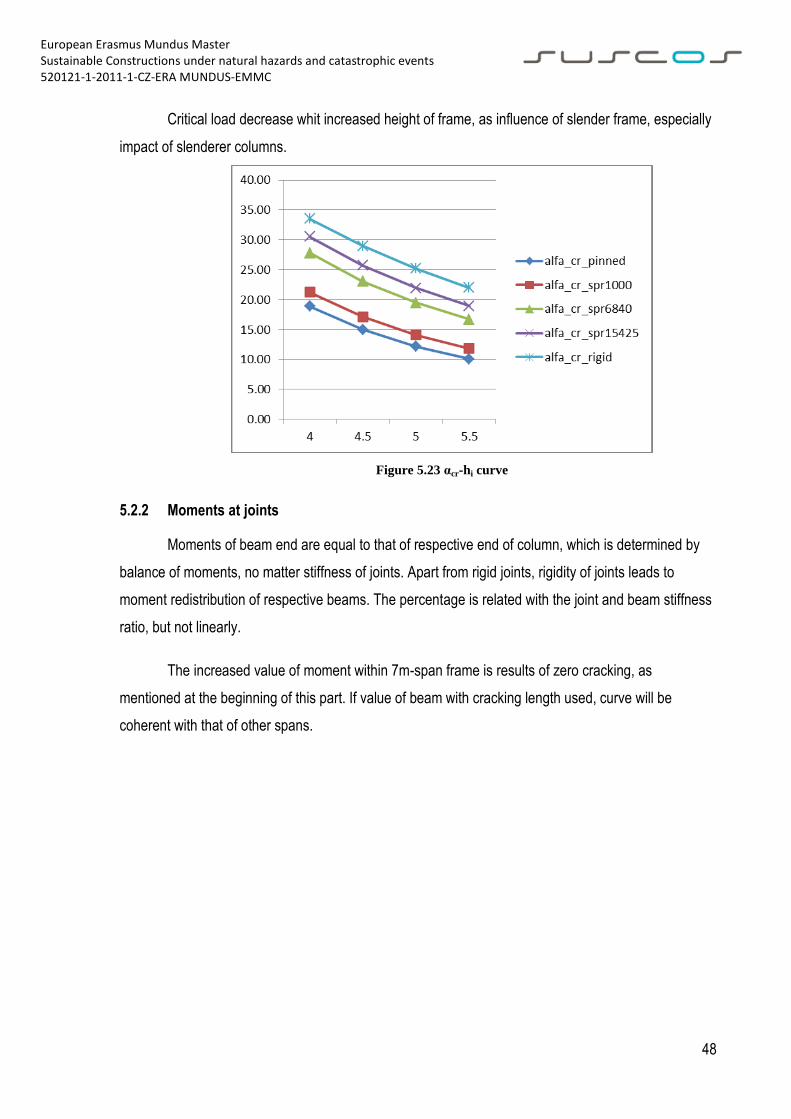
European Erasmus Mundus Master Sustainable Constructions under natural hazards and catastrophic events 520121-1-2011-1-CZ-ERA MUNDUS-EMMC
48
Critical load decrease whit increased height of frame, as influence of slender frame, especially
impact of slenderer columns.
Figure 5.23 αcr-hi curve
5.2.2 Moments at joints
Moments of beam end are equal to that of respective end of column, which is determined by
balance of moments, no matter stiffness of joints. Apart from rigid joints, rigidity of joints leads to
moment redistribution of respective beams. The percentage is related with the joint and beam stiffness
ratio, but not linearly.
The increased value of moment within 7m-span frame is results of zero cracking, as
mentioned at the beginning of this part. If value of beam with cracking length used, curve will be
coherent with that of other spans.
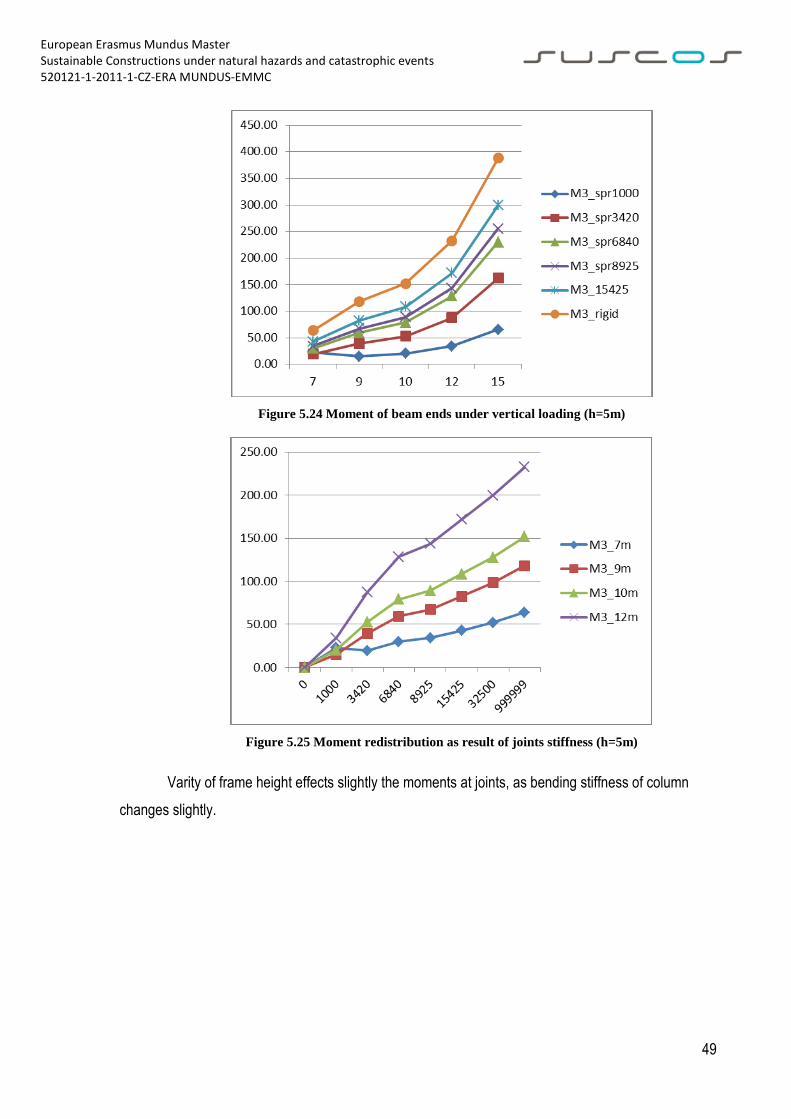
European Erasmus Mundus Master Sustainable Constructions under natural hazards and catastrophic events 520121-1-2011-1-CZ-ERA MUNDUS-EMMC
49
Figure 5.24 Moment of beam ends under vertical loading (h=5m)
Figure 5.25 Moment redistribution as result of joints stiffness (h=5m)
Varity of frame height effects slightly the moments at joints, as bending stiffness of column
changes slightly.
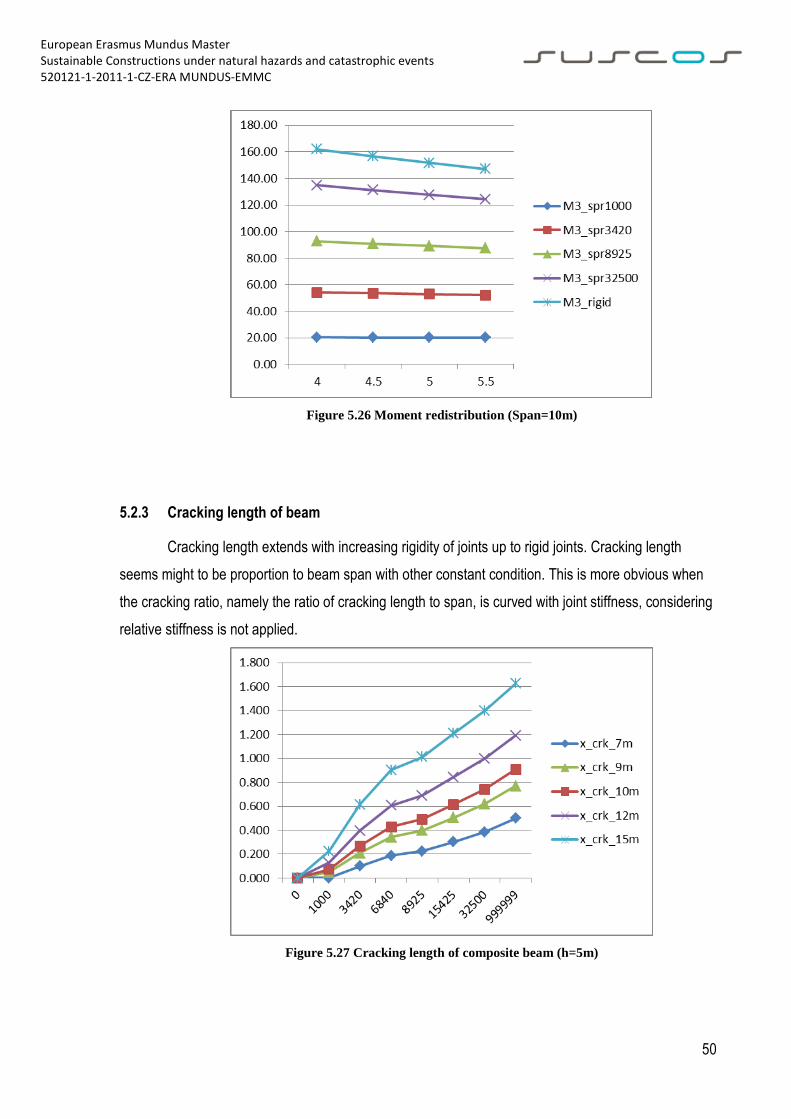
European Erasmus Mundus Master Sustainable Constructions under natural hazards and catastrophic events 520121-1-2011-1-CZ-ERA MUNDUS-EMMC
50
Figure 5.26 Moment redistribution (Span=10m)
5.2.3 Cracking length of beam
Cracking length extends with increasing rigidity of joints up to rigid joints. Cracking length
seems might to be proportion to beam span with other constant condition. This is more obvious when
the cracking ratio, namely the ratio of cracking length to span, is curved with joint stiffness, considering
relative stiffness is not applied.
Figure 5.27 Cracking length of composite beam (h=5m)
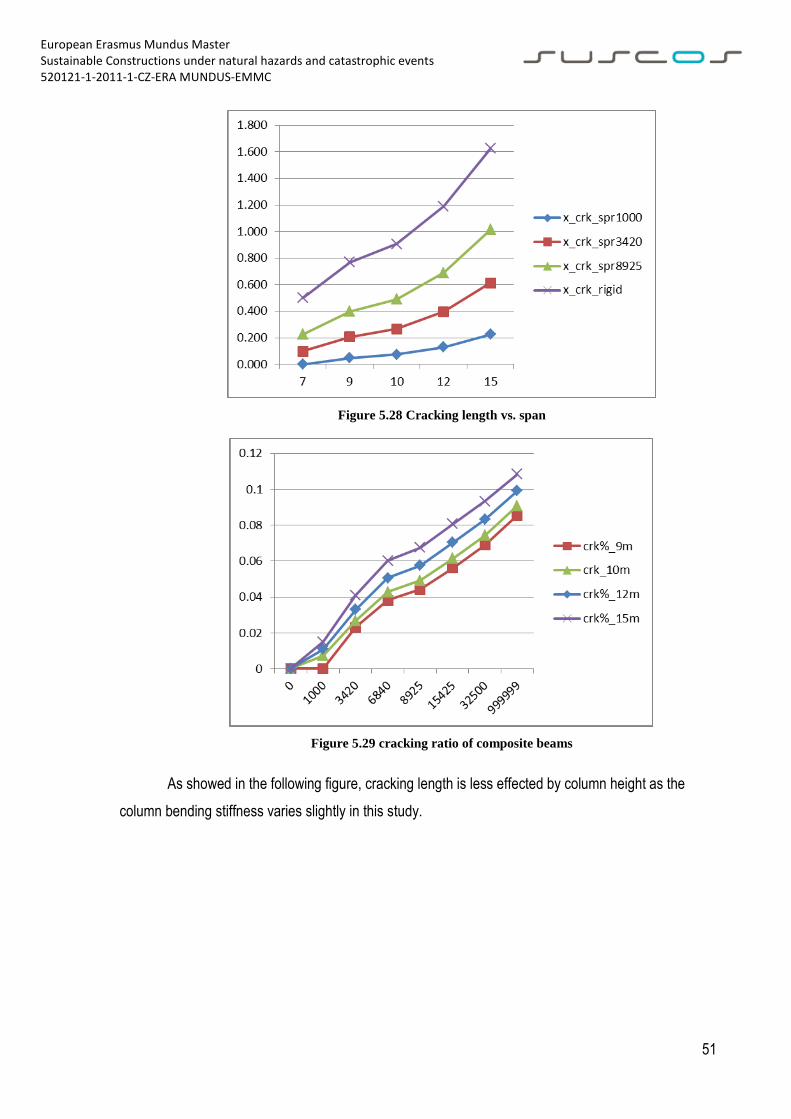
European Erasmus Mundus Master Sustainable Constructions under natural hazards and catastrophic events 520121-1-2011-1-CZ-ERA MUNDUS-EMMC
51
Figure 5.28 Cracking length vs. span
Figure 5.29 cracking ratio of composite beams
As showed in the following figure, cracking length is less effected by column height as the
column bending stiffness varies slightly in this study.

European Erasmus Mundus Master Sustainable Constructions under natural hazards and catastrophic events 520121-1-2011-1-CZ-ERA MUNDUS-EMMC
52
Figure 5.30 Cracking length of composite beam (span=10m)
5.2.4 Stiffness of beam
Stiffness of beam decreases when respective joints lose their rigidity. The displacement
increases largely within slender beams, as a result of large span. If relative displacement is applied,
that is, the ratio of displacement within semi-rigid beam to that of rigid beam, the curve seems to
converge. The relation seems to be controllable unless the joint is dominantly pinned, as indicated in a
7-span beam, or the beam is too slender to perform service limit situation, which is not presented here.
The beams with span of 12m and 15m have produced unfavourable displacements here, as a result of
overloading, comparing to real design.
Figure 5.31 displacement of beam at mid-span (h=5m)

European Erasmus Mundus Master Sustainable Constructions under natural hazards and catastrophic events 520121-1-2011-1-CZ-ERA MUNDUS-EMMC
53
Figure 5.32 Displacement ratio vs. rotation stiffness of joint
Figure 5.33 Lose of beam rigidity with soft joint (h=5m, span=7m)
5.2.5 Rotation of joints
To perform moment redistribution as discussed above, available joint rotation should not be
less than value from elastic analysis. As showed in above parts, most joints are possible to have a
rotation capacity of 31mrad, which extends to 100mrad when the joint stiffness reduced to
8425kNm/rad (initial stiffness of joint will be 17850kNm/rad) (Bitar, et al., 2006).

European Erasmus Mundus Master Sustainable Constructions under natural hazards and catastrophic events 520121-1-2011-1-CZ-ERA MUNDUS-EMMC
54
Table 5-6 Required Joint rotation (mrad)
Span (m)
EI/L (kNm)
Sj spring
(kNm/rad) Sj
/Sbeam joint
classification
Angle
φ_3-
φ_2
(mrad) 1
0 6
331.174 34
20 1.
08 semi
-rigid 1
5.8
12
5275.978
6840
2.593
semi-rigid
18.7
15
4220.783
15425
7.309
semi-rigid
19.4
10
6331.174
1000
0.316
pinned
20.4
7 9
044.534 10
00 0.
221 pinn
ed 2
2.6
12
5275.978
3420
1.296
semi-rigid
25.7
15
4220.783
8925
4.229
semi-rigid
28.5
15
4220.783
6840
3.241
semi-rigid
33.6
12
5275.978
1000
0.379
pinned
34.4
15
4220.783
3420
1.621
semi-rigid
47.4
15
4220.783
1000
0.474
pinned
65.7
For span up to 12m, the required joint rotation will be less than 35mrad, with a secant stiffness
of 1000kNm/rad, which is considered as pinned as stiffness ratio (0.38) is less than 0.5. Larger span
requires an increased rotation capacity of joints. A 15m-span frame demands joint rotation at
65.7mrad, which is not presented in the following figure. The required bending moment in span is
beyond section bending capacity, which involves a larger height of section, normally a larger steel
profile. Fortunately such a span is not common for multi-storey buildings.
The incoherence of 7m-span frame is caused by divergence of cracking length, as discussed
above. Pinned frames require a relatively large rotation capacity, as effect of cracking is not valid for
moment redistribution. The un-cracked stiffness of composite beams is applied in such case.

European Erasmus Mundus Master Sustainable Constructions under natural hazards and catastrophic events 520121-1-2011-1-CZ-ERA MUNDUS-EMMC
55
Figure 5.34 Rotation angle of joints (h=5m)
Frames with stiff joints perform a small joint rotation, which is coherent with the rigidity of joint
and its less ductility. The required rotation ability increases with an extended span, on which attention
should be drawn, especially when a soft joint is applied.
Figure 5.35 Rotation angle of joints vs. span (h=5m)
Frame height plays little role here, as stiffness of column has limited variation with a column
height range from 4m to 5.5m.
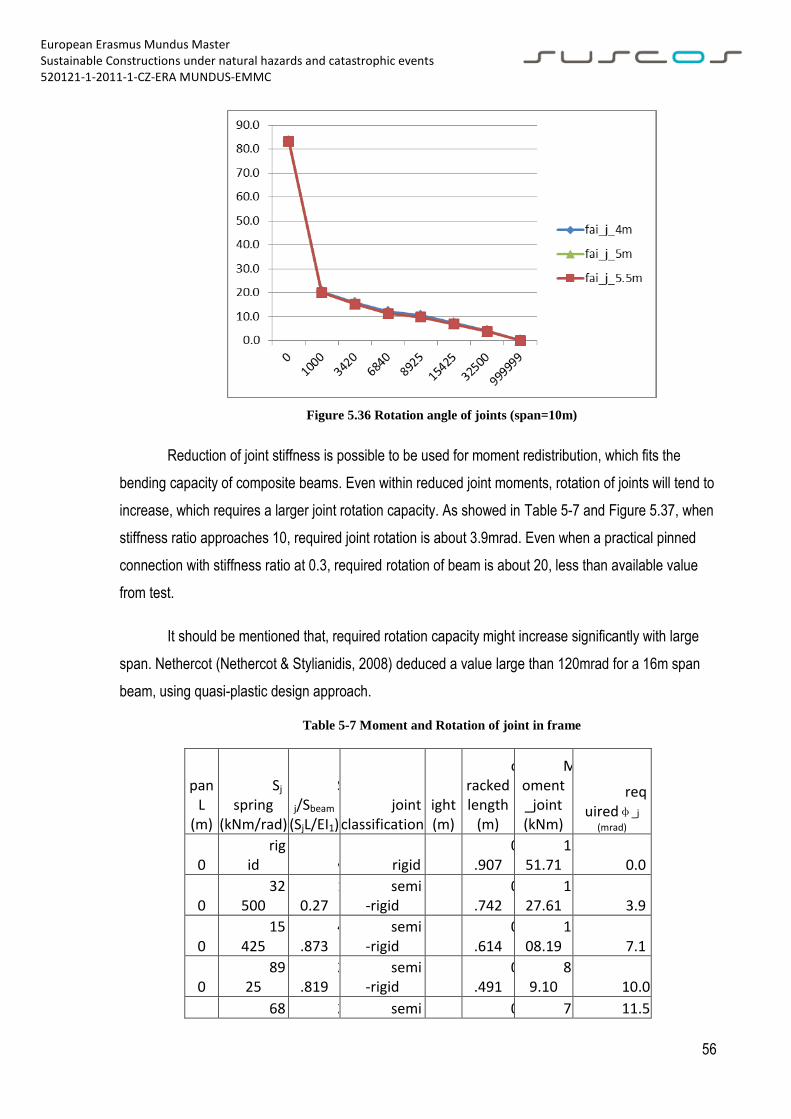
European Erasmus Mundus Master Sustainable Constructions under natural hazards and catastrophic events 520121-1-2011-1-CZ-ERA MUNDUS-EMMC
56
Figure 5.36 Rotation angle of joints (span=10m)
Reduction of joint stiffness is possible to be used for moment redistribution, which fits the
bending capacity of composite beams. Even within reduced joint moments, rotation of joints will tend to
increase, which requires a larger joint rotation capacity. As showed in Table 5-7 and Figure 5.37, when
stiffness ratio approaches 10, required joint rotation is about 3.9mrad. Even when a practical pinned
connection with stiffness ratio at 0.3, required rotation of beam is about 20, less than available value
from test.
It should be mentioned that, required rotation capacity might increase significantly with large
span. Nethercot (Nethercot & Stylianidis, 2008) deduced a value large than 120mrad for a 16m span
beam, using quasi-plastic design approach.
Table 5-7 Moment and Rotation of joint in frame
Span
L (m)
Sj spring
(kNm/rad)
S
j/Sbeam (SjL/EI1)
joint classification
Hight (m)
cracked length
(m)
Moment _joint (kNm)
requiredφ_j
(mrad) 1
0 rig
id ∞ rigid 5 0
.907 1
51.71 0.0
10
32500
10.27
semi-rigid 5
0.742
127.61 3.9
10
15425
4.873
semi-rigid 5
0.614
108.19 7.1
10
8925
2.819
semi-rigid 5
0.491
89.10 10.0
1 68 2 semi 5 0 7 11.5

European Erasmus Mundus Master Sustainable Constructions under natural hazards and catastrophic events 520121-1-2011-1-CZ-ERA MUNDUS-EMMC
57
0 40 .161 -rigid .427 8.93
10
3420
1.08
semi-rigid 5
0.267
52.84 15.4
10
1000
0.316
pinned 5
0.074
20.19 20.2
10
pinned 0
pinned 5
0.000
0.00 83.1
Figure 5.37 Joint moment and joint rotation (span=10m, h=5m, q=35kN/m)
5.3 Comparison of steel and composite frames
Critical load factors are employed here, to obtain ideas about global stability of composite
structures. The specimen studied here are some of before discussed frames, with varied span and 5m
height. Results are listed in Table 5-8.
Table 5-8 Critical load factor of steel and composite frames
Type
Sj \span 7 9
10
12
steel
pinned
17.69
13.76
13.38
10.32
steel
0.25S_beam
19.60
14.92
14.92
10.98
steel 6840
30.09
22.63
20.02
16.06
steel
15425
35.42
25.94
22.63
17.64
ste rigid 4 3 2 1
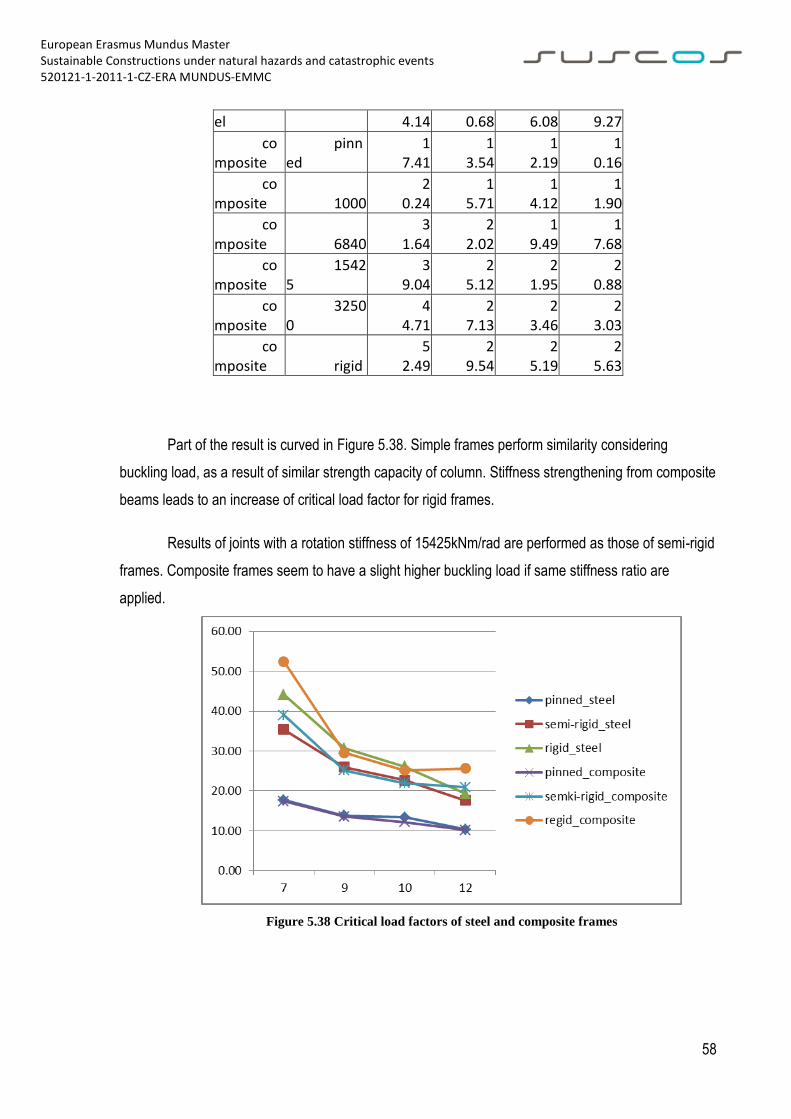
European Erasmus Mundus Master Sustainable Constructions under natural hazards and catastrophic events 520121-1-2011-1-CZ-ERA MUNDUS-EMMC
58
el 4.14 0.68 6.08 9.27
composite
pinned
17.41
13.54
12.19
10.16
composite 1000
20.24
15.71
14.12
11.90
composite 6840
31.64
22.02
19.49
17.68
composite
15425
39.04
25.12
21.95
20.88
composite
32500
44.71
27.13
23.46
23.03
composite rigid
52.49
29.54
25.19
25.63
Part of the result is curved in Figure 5.38. Simple frames perform similarity considering
buckling load, as a result of similar strength capacity of column. Stiffness strengthening from composite
beams leads to an increase of critical load factor for rigid frames.
Results of joints with a rotation stiffness of 15425kNm/rad are performed as those of semi-rigid
frames. Composite frames seem to have a slight higher buckling load if same stiffness ratio are
applied.
Figure 5.38 Critical load factors of steel and composite frames
European Erasmus Mundus Master Sustainable Constructions under natural hazards and catastrophic events 520121-1-2011-1-CZ-ERA MUNDUS-EMMC
59
6. COCLUSION
When semi-rigid joints are introduced into frames, the principle consideration might be how to
set an appropriate degree of rotation stiffness and bending capacity of joints. As discussed above,
effects of joints on frames may be significant, which should be included within global analysis.
6.1. Concrete cracking
Effects of cracking region should be considered in global analysis by iterative method, where
convergence is reached in most case. Divergence is encountered during this study, which happens
with a tiny stiffness of joint and a large one of beam. Cracking length is recommended to count for its
effects, differing from un-cracking stiffness used for pinned beam, even when the joints are almost
similar as a simple one.
Exactness of cracking length makes slight difference of moment distribution in frame, as the
stiffness of beam varies slightly. It is recommended that the cracked length under characteristic
combination of vertical loading be used for modelling; as a result, a determined structure is set for
further analysis. With this simplification, modification factors and analysis methods are possible to be
defined for each load case, and results combination is available considering load history.
Considering effects of concrete cracking, end moments of beams is expected to reduce about
10% in rigid frames. This moment redistribution is limited within semi-rigid frame, without consiferation
of plastic characteristics of composite beams.
6.2. Semi-rigid joints
By introducing end releases at beam ends, effects of rotation stiffness of joints are possible to
be simulated. Suitable moment redistribution, which will benefit usage of composite beams, is possible
to be obtained by employing certain rigidity of joints, while the critical load of frame is expected to
reduce.
Stiffness ratio of joints and beams is used for joint classification, but stiffness of composite
beam in frame is hard to determined, as cracking length is related with level and distribution of loading.
Un-cracked stiffness of composite beams is used in this study, as calculation, based on value of joint
rigidity, is not influenced by stiffness ratio. With introducing of joint elements into modelling,

European Erasmus Mundus Master Sustainable Constructions under natural hazards and catastrophic events 520121-1-2011-1-CZ-ERA MUNDUS-EMMC
60
classification of joints is less important, comparing traditional extreme setting as either rigid or simple
joints.
Critical load analysis is possibly processed using either eigenvalue analysis or step-by-step
nonlinear second-order approach. Eigenvalue analysis method is recommended as buckling shapes
are provided to further determine buckling length for element verification. Second order approach might
be used when nonlinearity of components should be activated for consideration. Programme used in
this study might provide a lower value, especially within long span frames, when the later method is
employed. Furthermore, results from that show discontinuity with varied parameters. In this situation,
eigenvalue analysis is recommended in practice.
End moments of beams slide from results of rigid frame to those of simple one, when reduction
of rigidity of joints performs. This desirable moment redistribution might benefit composite structures if
coherence of rigidity and strength capacity of joints is proofed to be provided. Complicity of analysis
process hinders practical application of semi-rigid semi-strength connection in building industry, thus it
is expected that combination of software package of joint design and global analysis will bring semi-
rigid frame into practice. A high degree of joint rigidity is recommended in sway frame, considering
global stability and required joint rotation.

European Erasmus Mundus Master Sustainable Constructions under natural hazards and catastrophic events 520121-1-2011-1-CZ-ERA MUNDUS-EMMC
61
REFERENCES
Bitar, D., Ryan, Y., Caramelli, S., Salvatore, W., Taucer, F., Jaspart, J., et al. (2006). Applicability of composite structures to sway frames. Final report, Report EUR21913 en, Science Research Development,European Communities.
Chen, W. (1999). Stability design of steel frame (tr.in Chinese). (N. Zhou, Trad.) China: Shanghai World Book Publishing Company.
Chen, W., & Atsuta, T. (1997). Theory of beam-columns I: In-plane behavior and design (tr.in Chenise). (N. Zhou, Q. Lu, D. Han, & H. Wu, Trads.) China Communication Press.
Demonceau, J.-F. (2008). Steel and composite building frames: sway response under conventional loading and development of membrane effects in beams further to an exceptional action. Liège University: PhD. dessertation.
Dlubal. (2013). RSBUCK: Program sescription. Dlubal Engineering Software. Dlubal. (2013a). RSTAB 8: Structural analysis of general frameworks, program description (a ed.).
Dlubal Engineering Software. Drozd, M. (2012). Composite steel-concrete frame structures. Eldemerdash, M., Abu-Lebdeh, T., & Al Nasra, M. (2012). Finite element analysis of large capacity
endplate steel connections. Journal of computer science, 8(4), pp. 482-493. EN1993-1-1. (2005). Eurocode 3:Design of steel structures, Part 1-1: General rules and rules for
buildings. CEN, Brussels: European Standard. EN1993-1-8. (2005). Eurocode 3: design of steel structures, Part 1-8: design of joints. CEN, Brussels:
European Standard. EN1994-1-1. (2009). Eurocode 4:Design of composite steel and concrete structures, Part 1-1: General
rules and rules for buildings. CEN, Brussels: European Standard. Gardne,r L and Nethercot, D. A. (2005). Designers´guide to EN1993-1-1 Eurocode 3: Design of steel
structures. Thomas Telford Ltd. Johnson, R. (2004). Composite structures of steel and concrete (3rd Ed). Blackwell Publishing. Johnson, R.P. and Anderson,D. (2004). Designers’ Guide to EN 1994-1-1, Eurocode 4: design of
composite steel and concrete structures, Part 1.1: General Rules and Rules for Buildings. Thomas Telford.
Leon, R., Hoffman, J., & Staeger, T. (1996). Partially Restrained Composite Connections. American Institute of Steel Construction.
Nethercot, D. (1995). Semi-rigid joint action and the design of non-sway composite frames. Engineering Structures 17, 554-567.
Nethercot, D., & Stylianidis, P. (2008). The basis for semi-continuous composite construction. Steel Construction, 24-33.
Simões da Silva, L. (2008). Towards a constent design approach for steel joints under generalized loading. Journal of constructional steel research, 64(9), 1059-1075.
Simões da Silva, L., Simões, R., and Gervásio, H. (2010). Design of steel structures. ECCS and Ernst & Sohn.
Tamboli, A. (Ed.). (1999). Handbook of structural steel connection design ad details. McGraw-Hill. Wang, J.F and Li, G.Q. (2008). A practical design method for semi-rigid composite frames under
vertical loads. Journal of constructional steel research, 176-189. Wang, Y., Li, H., & Li, J. (2003). Initial stiffness of semi-rigid beam-to-column connections and
structural internal force analysis (in Chinese), Vol20 No.6. Engineering Mechanics. WangJ.F., & LiG.Q. (2008a). Simplified beam design for semi-rigid composite frames at the
serviceability limit state. Tsinghua Science and Technology(13), 681-688. Ziemian, R. (Ed.). (2010). Guide to stability design criteria for metal structures (6 ed.). John Wiley &
Sons Inc.
Top Related