


Languages
Pages
Legal

Report on Lifestyle studyCompared between Thailand,
Indonesia, and Vietnam in 2015
Date: June, 2016
©2016 W&S GROUP
Table of content
A. Summary (P. 3)
B. Research Design (P. 5)
C. Respondents Profile (P. 6)
D. Information Coverage (P. 7)
E. Detail Findings (P. 8)
F. Conclusions (P. 55)
2
©2016 W&S GROUP3
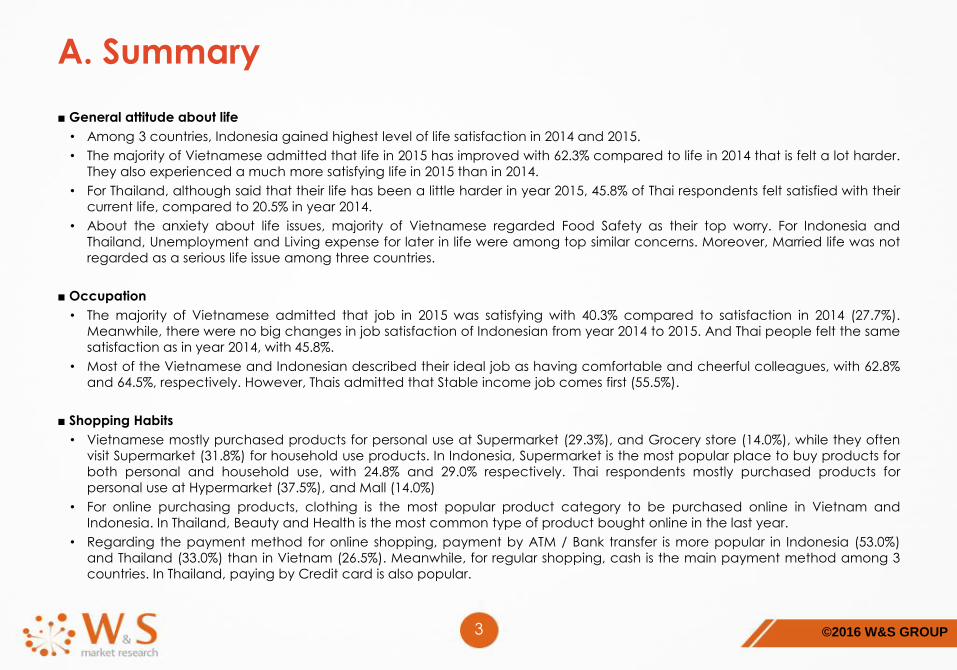
A. Summary
■ General attitude about life
• Among 3 countries, Indonesia gained highest level of life satisfaction in 2014 and 2015.
• The majority of Vietnamese admitted that life in 2015 has improved with 62.3% compared to life in 2014 that is felt a lot harder.
They also experienced a much more satisfying life in 2015 than in 2014.
• For Thailand, although said that their life has been a little harder in year 2015, 45.8% of Thai respondents felt satisfied with their
current life, compared to 20.5% in year 2014.
• About the anxiety about life issues, majority of Vietnamese regarded Food Safety as their top worry. For Indonesia and
Thailand, Unemployment and Living expense for later in life were among top similar concerns. Moreover, Married life was not
regarded as a serious life issue among three countries.
■ Occupation
• The majority of Vietnamese admitted that job in 2015 was satisfying with 40.3% compared to satisfaction in 2014 (27.7%).
Meanwhile, there were no big changes in job satisfaction of Indonesian from year 2014 to 2015. And Thai people felt the same
satisfaction as in year 2014, with 45.8%.
• Most of the Vietnamese and Indonesian described their ideal job as having comfortable and cheerful colleagues, with 62.8%
and 64.5%, respectively. However, Thais admitted that Stable income job comes first (55.5%).
■ Shopping Habits
• Vietnamese mostly purchased products for personal use at Supermarket (29.3%), and Grocery store (14.0%), while they often
visit Supermarket (31.8%) for household use products. In Indonesia, Supermarket is the most popular place to buy products for
both personal and household use, with 24.8% and 29.0% respectively. Thai respondents mostly purchased products for
personal use at Hypermarket (37.5%), and Mall (14.0%)
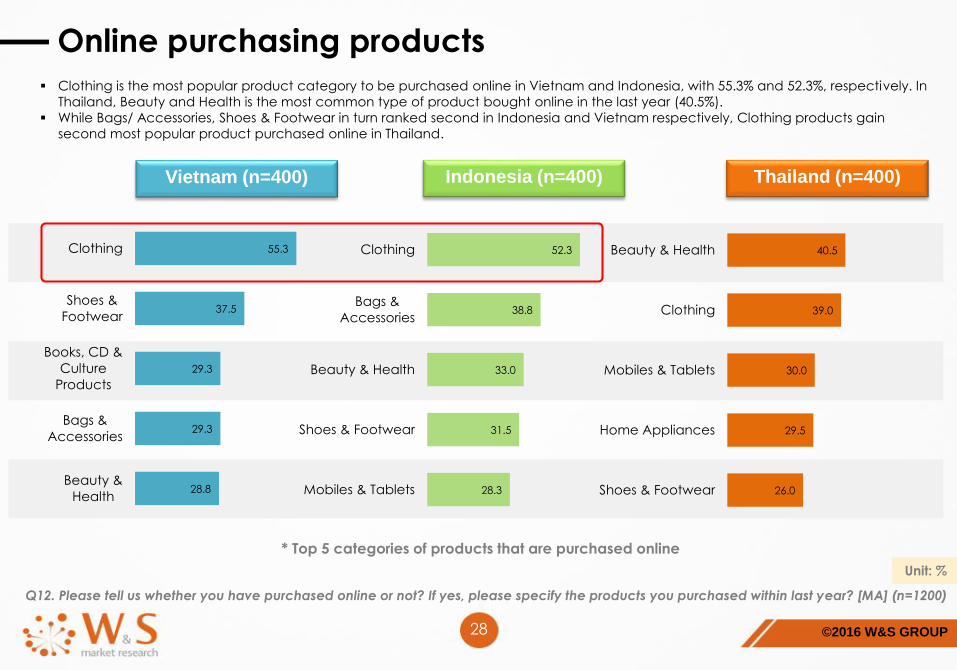
• For online purchasing products, clothing is the most popular product category to be purchased online in Vietnam and
Indonesia. In Thailand, Beauty and Health is the most common type of product bought online in the last year.
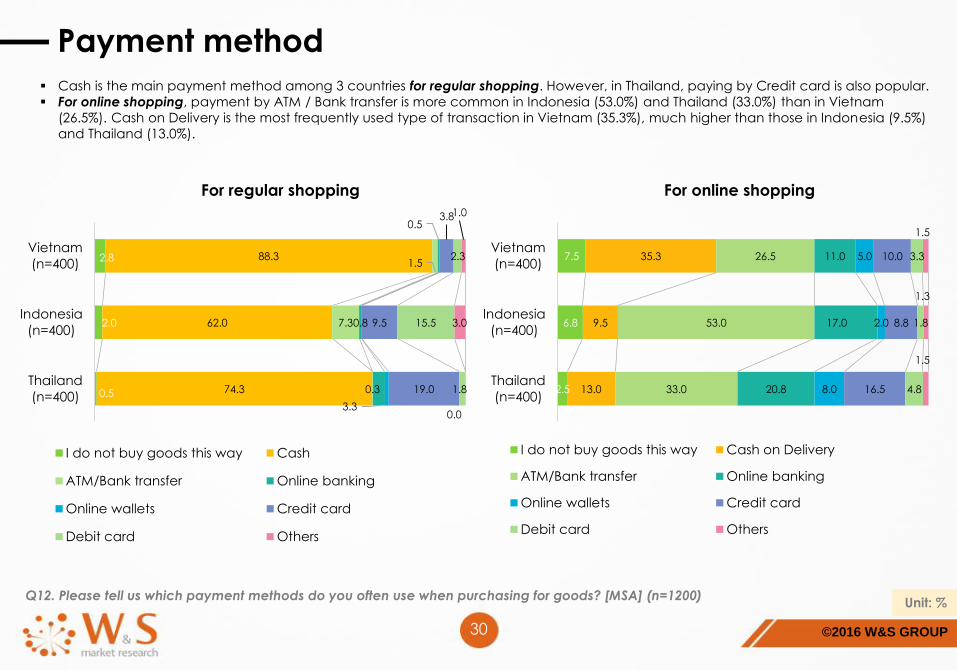
• Regarding the payment method for online shopping, payment by ATM / Bank transfer is more popular in Indonesia (53.0%)
and Thailand (33.0%) than in Vietnam (26.5%). Meanwhile, for regular shopping, cash is the main payment method among 3
countries. In Thailand, paying by Credit card is also popular.
©2016 W&S GROUP4
A. Summary (Cont.)
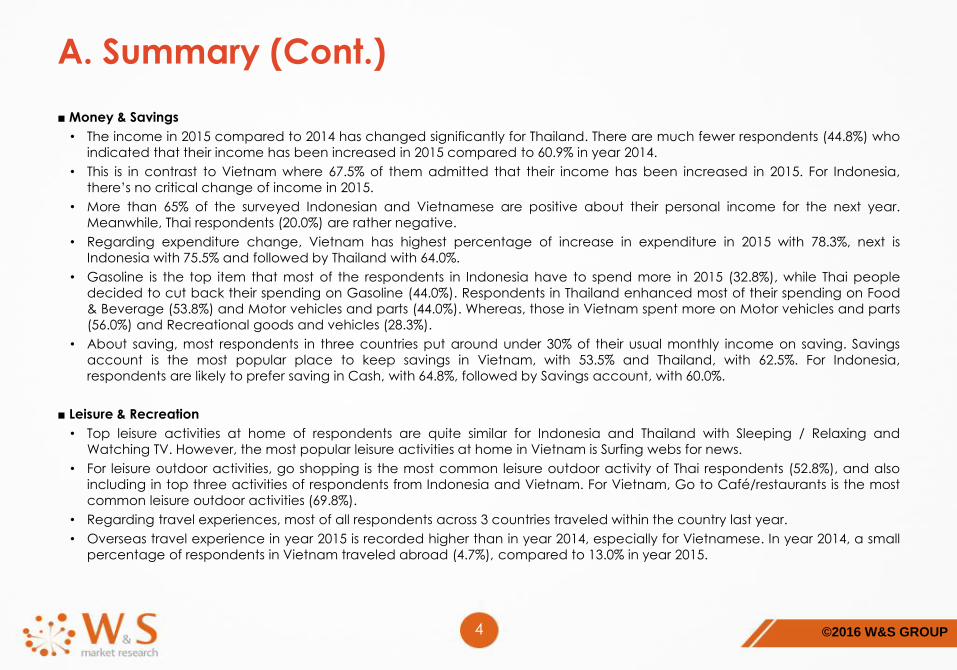
■ Money & Savings
• The income in 2015 compared to 2014 has changed significantly for Thailand. There are much fewer respondents (44.8%) who
indicated that their income has been increased in 2015 compared to 60.9% in year 2014.
• This is in contrast to Vietnam where 67.5% of them admitted that their income has been increased in 2015. For Indonesia,
there’s no critical change of income in 2015.
• More than 65% of the surveyed Indonesian and Vietnamese are positive about their personal income for the next year.
Meanwhile, Thai respondents (20.0%) are rather negative.
• Regarding expenditure change, Vietnam has highest percentage of increase in expenditure in 2015 with 78.3%, next is
Indonesia with 75.5% and followed by Thailand with 64.0%.
• Gasoline is the top item that most of the respondents in Indonesia have to spend more in 2015 (32.8%), while Thai people
decided to cut back their spending on Gasoline (44.0%). Respondents in Thailand enhanced most of their spending on Food
& Beverage (53.8%) and Motor vehicles and parts (44.0%). Whereas, those in Vietnam spent more on Motor vehicles and parts
(56.0%) and Recreational goods and vehicles (28.3%).
• About saving, most respondents in three countries put around under 30% of their usual monthly income on saving. Savings
account is the most popular place to keep savings in Vietnam, with 53.5% and Thailand, with 62.5%. For Indonesia,
respondents are likely to prefer saving in Cash, with 64.8%, followed by Savings account, with 60.0%.
■ Leisure & Recreation
• Top leisure activities at home of respondents are quite similar for Indonesia and Thailand with Sleeping / Relaxing and
Watching TV. However, the most popular leisure activities at home in Vietnam is Surfing webs for news.
• For leisure outdoor activities, go shopping is the most common leisure outdoor activity of Thai respondents (52.8%), and also
including in top three activities of respondents from Indonesia and Vietnam. For Vietnam, Go to Café/restaurants is the most
common leisure outdoor activities (69.8%).
• Regarding travel experiences, most of all respondents across 3 countries traveled within the country last year.
• Overseas travel experience in year 2015 is recorded higher than in year 2014, especially for Vietnamese. In year 2014, a small
percentage of respondents in Vietnam traveled abroad (4.7%), compared to 13.0% in year 2015.
©2016 W&S GROUP
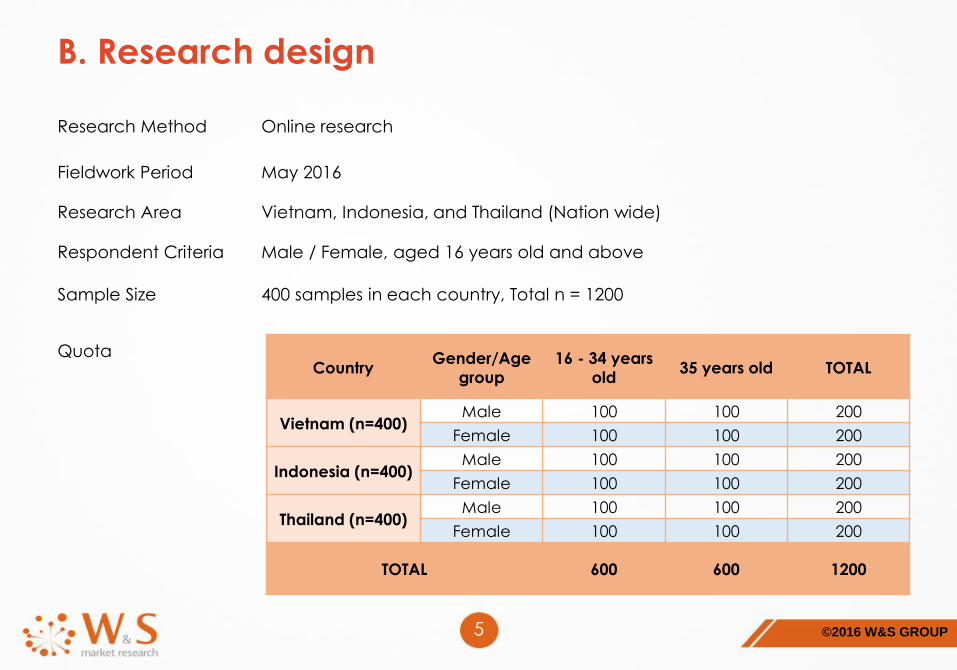
B. Research design
5
Research Method Online research
Fieldwork Period May 2016
Research Area Vietnam, Indonesia, and Thailand (Nation wide)
Respondent Criteria Male / Female, aged 16 years old and above
Sample Size 400 samples in each country, Total n = 1200
QuotaCountry
Gender/Age
group
16 - 34 years
old35 years old TOTAL
Vietnam (n=400)Male 100 100 200
Female 100 100 200
Indonesia (n=400)Male 100 100 200
Female 100 100 200
Thailand (n=400)Male 100 100 200
Female 100 100 200
TOTAL 600 600 1200
©2016 W&S GROUP
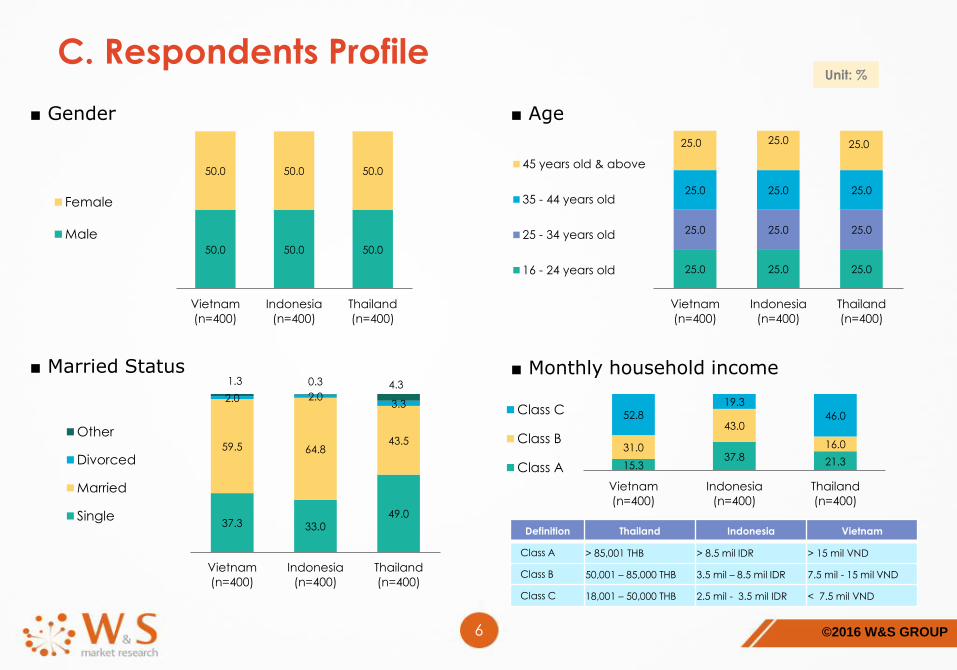
C. Respondents Profile
6
Unit: %
■ Gender
■ Married Status
■ Age
■ Monthly household income
50.0 50.0 50.0
50.0 50.0 50.0
Vietnam
(n=400)
Indonesia
(n=400)
Thailand
(n=400)
Female
Male
25.0 25.0 25.0
25.0 25.0 25.0
25.0 25.0 25.0
25.0 25.0 25.0
Vietnam
(n=400)
Indonesia
(n=400)
Thailand
(n=400)
45 years old & above
35 - 44 years old
25 - 34 years old
16 - 24 years old
37.3 33.049.0
59.5 64.843.5
2.0 2.03.3
1.3 0.3 4.3
Vietnam
(n=400)
Indonesia
(n=400)
Thailand
(n=400)
Other
Divorced
Married
Single
15.337.8 21.3
31.0
43.0
16.0
52.8
19.3
46.0
Vietnam
(n=400)
Indonesia
(n=400)
Thailand
(n=400)
Class C
Class B
Class A
Definition Thailand Indonesia Vietnam
Class A > 85,001 THB > 8.5 mil IDR > 15 mil VND
Class B 50,001 – 85,000 THB 3.5 mil – 8.5 mil IDR 7.5 mil - 15 mil VND
Class C 18,001 – 50,000 THB 2.5 mil - 3.5 mil IDR < 7.5 mil VND
©2016 W&S GROUP
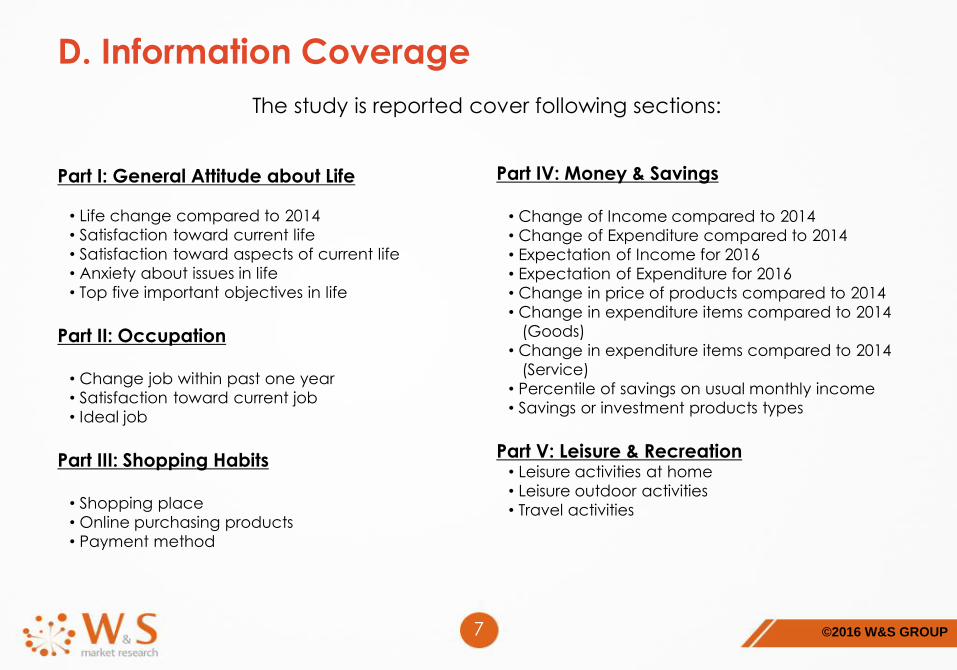
D. Information Coverage
7
The study is reported cover following sections:
Part I: General Attitude about Life
• Life change compared to 2014
• Satisfaction toward current life
• Satisfaction toward aspects of current life
• Anxiety about issues in life
• Top five important objectives in life
Part II: Occupation
• Change job within past one year
• Satisfaction toward current job
• Ideal job
Part III: Shopping Habits
• Shopping place
• Online purchasing products
• Payment method
Part IV: Money & Savings
• Change of Income compared to 2014
• Change of Expenditure compared to 2014
• Expectation of Income for 2016
• Expectation of Expenditure for 2016
• Change in price of products compared to 2014
• Change in expenditure items compared to 2014
(Goods)
• Change in expenditure items compared to 2014
(Service)
• Percentile of savings on usual monthly income
• Savings or investment products types
Part V: Leisure & Recreation• Leisure activities at home
• Leisure outdoor activities
• Travel activities

©2016 W&S GROUP8
E. Detail findings
1. General attitude about life
2. Occupation
3. Shopping Habits
4. Money & Savings
5. Leisure & Recreation

©2016 W&S GROUP9
Life change compared to 2014
Q1. In year 2015, how is your life change compared to 2014? [SA] (n=1200) Unit: %
The graph shows changes in the life of people in the three countries in year 2015 compared to 2014.
There is a quite significant change on the life of Vietnamese. The majority of them admitted that life in 2015 has improved with 62.3%
compared to life in 2014 that is felt a lot harder. Meanwhile, there were no big changes in life of Indonesian from year 2014 to 2015.
However Thai people experienced harder life in 2015.
12.0
4.5
36.7
25.0
6.0
8.3
42.0
54.3
3.3
8.0
Life in 2014
Life in 2015
Much harder Somewhat harder Nothing changes Somewhat improved Much improvedHarder Improved
29.5 62.3
48.7 45.3
5.2
7.8
20.6
17.3
12.4
10.5
46.0
47.3
15.8
17.3
Life in 2014
Life in 2015
9.4
6.0
21.1
25.8
12.4
14.5
46.1
45.0
11.1
8.8
Life in 2014
Life in 2015
25.0 64.5
25.8 61.8
31.8 53.8
30.5 57.2
VIETNAM (n=400)
INDONESIA (n=400)
THAILAND (n=400)

©2016 W&S GROUP10
Life change compared to 2014 – By Gender
Q1. In year 2015, how is your life change compared to 2014? [SA] (n=1200) Unit: %
4.5 25.0 8.3 54.3 8.0Life in
2015
Much harder Somewhat harder Nothing changes
Somewhat improved Much improved
7.8 17.3 10.5 47.3 17.3Life in
2015
6.0 25.8 14.5 45.0 8.8Life in
2015
Harder (T2B)
Male Female
32.5 26.5
22.0 28.0
36.5 27.0
Harder (T2B)
29.5
25.0
31.8
VIETNAM (n=400)
INDONESIA (n=400)
THAILAND (n=400)
©2016 W&S GROUP11
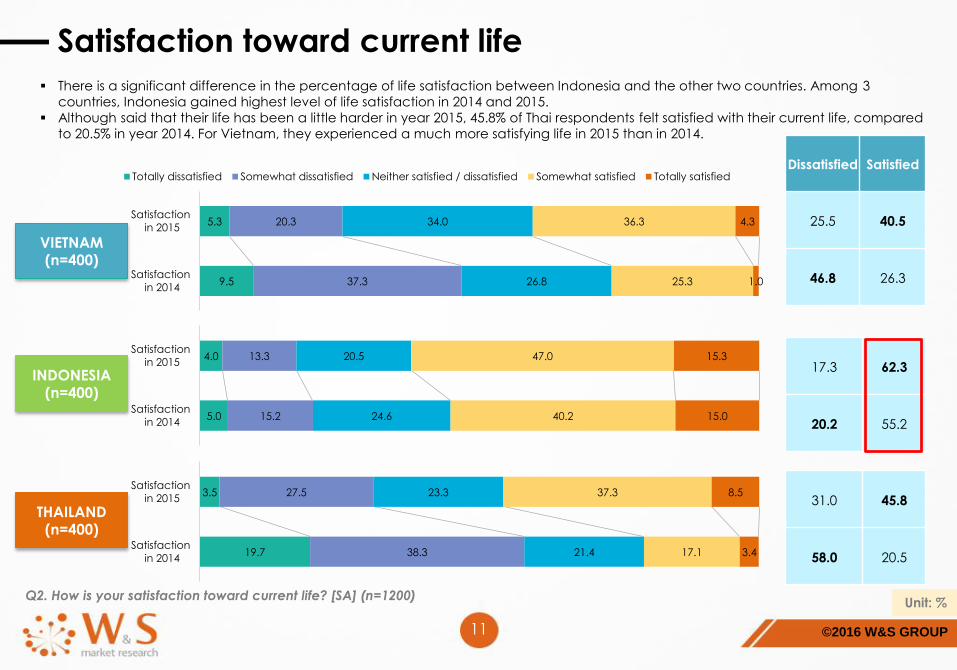
Q2. How is your satisfaction toward current life? [SA] (n=1200) Unit: %
Satisfaction toward current life
There is a significant difference in the percentage of life satisfaction between Indonesia and the other two countries. Among 3
countries, Indonesia gained highest level of life satisfaction in 2014 and 2015.
Although said that their life has been a little harder in year 2015, 45.8% of Thai respondents felt satisfied with their current life, compared
to 20.5% in year 2014. For Vietnam, they experienced a much more satisfying life in 2015 than in 2014.
9.5
5.3
37.3
20.3
26.8
34.0
25.3
36.3
1.0
4.3
Satisfaction
in 2014
Satisfaction
in 2015
Totally dissatisfied Somewhat dissatisfied Neither satisfied / dissatisfied Somewhat satisfied Totally satisfiedDissatisfied Satisfied
25.5 40.5
46.8 26.3
5.0
4.0
15.2
13.3
24.6
20.5
40.2
47.0
15.0
15.3
Satisfaction
in 2014
Satisfaction
in 2015
19.7
3.5
38.3
27.5
21.4
23.3
17.1
37.3
3.4
8.5
Satisfaction
in 2014
Satisfaction
in 2015
17.3 62.3
20.2 55.2
31.0 45.8
58.0 20.5
VIETNAM (n=400)
INDONESIA (n=400)
THAILAND (n=400)
©2016 W&S GROUP12
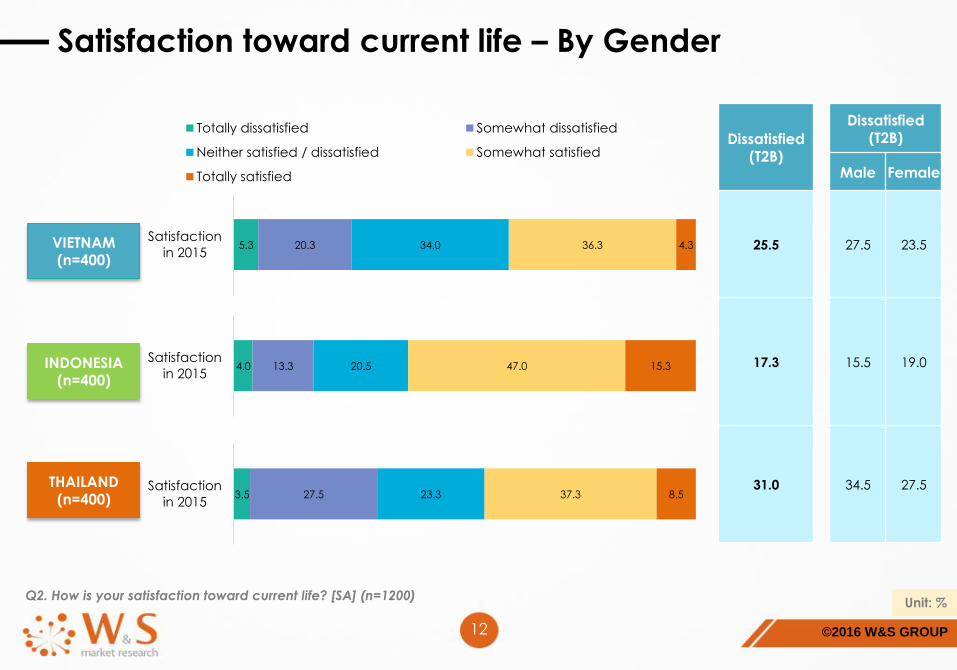
Satisfaction toward current life – By Gender
Q2. How is your satisfaction toward current life? [SA] (n=1200) Unit: %
5.3 20.3 34.0 36.3 4.3Satisfaction
in 2015
Totally dissatisfied Somewhat dissatisfied
Neither satisfied / dissatisfied Somewhat satisfied
Totally satisfied
4.0 13.3 20.5 47.0 15.3Satisfaction
in 2015
3.5 27.5 23.3 37.3 8.5Satisfaction
in 2015
Dissatisfied (T2B)
Male Female
27.5 23.5
15.5 19.0
34.5 27.5
Dissatisfied (T2B)
25.5
17.3
31.0
VIETNAM (n=400)
INDONESIA (n=400)
THAILAND (n=400)
©2016 W&S GROUP13
Religious life
Family life
Health
Education
Social life
Neighborhood safety
Standard of living
Household goods
Current job / study
Income
Family life
Education
Neighborhood safety
Social life
Health
Standard of living
Current job / study
Religious life
Household goods
Income
Religious life
Neighborhood safety
Family life
Education
Household goods
Health
Social life
Current job / study
Income
Standard of living
Indonesia (n=400)Vietnam (n=400) Thailand (n=400)
Totally dissatisfied Somewhat dissatisfied Neither satisfied nor dissatisfied Somewhat satisfied Totally satisfied
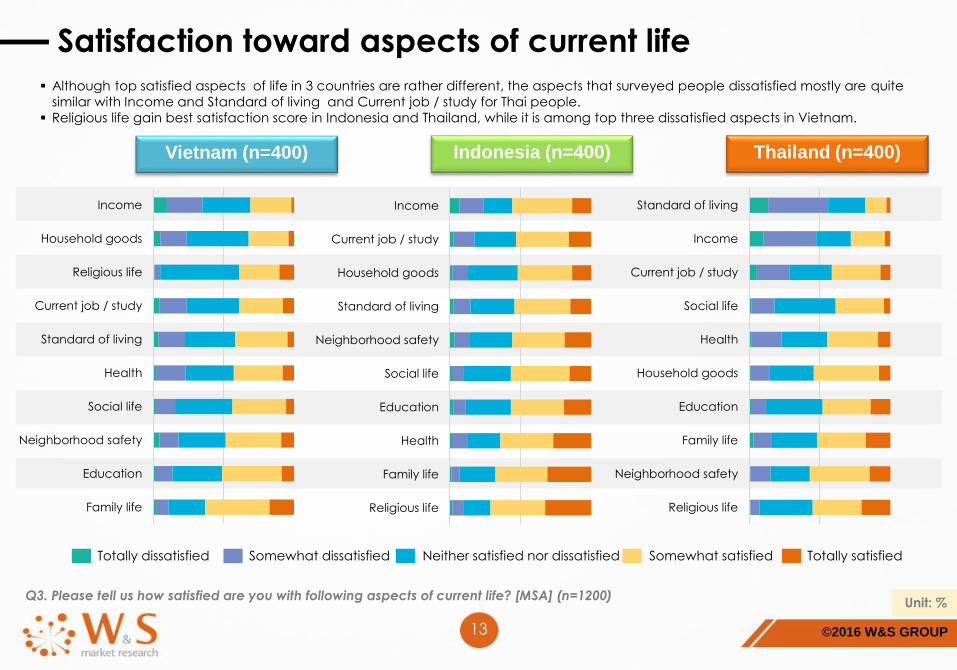
Satisfaction toward aspects of current life
Although top satisfied aspects of life in 3 countries are rather different, the aspects that surveyed people dissatisfied mostly are quite
similar with Income and Standard of living and Current job / study for Thai people.
Religious life gain best satisfaction score in Indonesia and Thailand, while it is among top three dissatisfied aspects in Vietnam.
Q3. Please tell us how satisfied are you with following aspects of current life? [MSA] (n=1200) Unit: %
©2016 W&S GROUP14
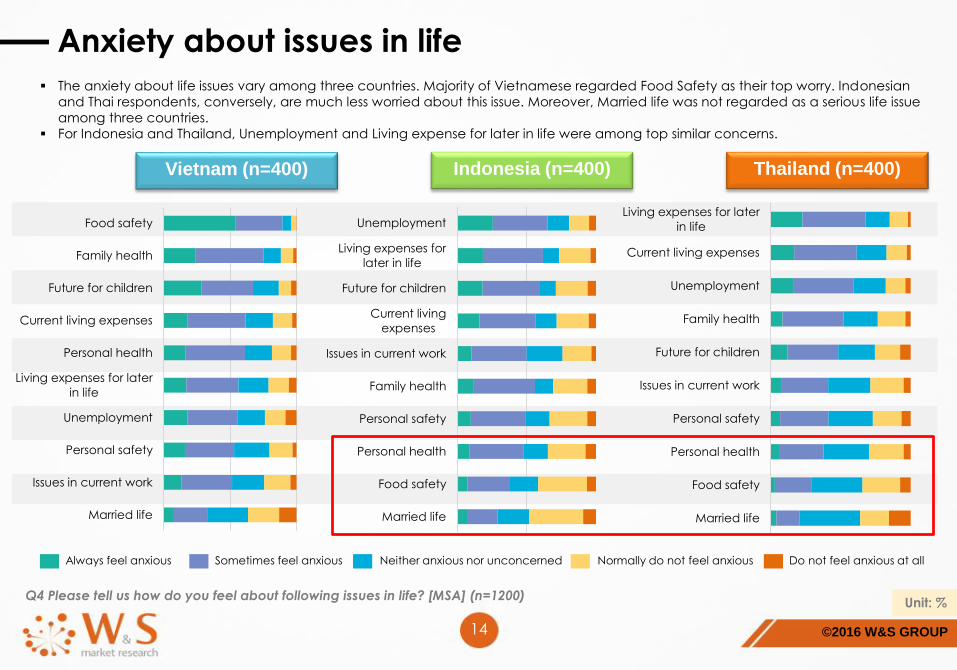
Anxiety about issues in life
The anxiety about life issues vary among three countries. Majority of Vietnamese regarded Food Safety as their top worry. Indonesian
and Thai respondents, conversely, are much less worried about this issue. Moreover, Married life was not regarded as a serious life issue
among three countries.
For Indonesia and Thailand, Unemployment and Living expense for later in life were among top similar concerns.
Q4 Please tell us how do you feel about following issues in life? [MSA] (n=1200)
Married life
Food safety
Personal health
Personal safety
Family health
Issues in current work
Current living
expenses
Future for children
Living expenses for
later in life
UnemploymentFood safety
Family health
Future for children
Current living expenses
Personal health
Living expenses for later
in life
Unemployment
Personal safety
Issues in current work
Married life Married life
Food safety
Personal health
Personal safety
Issues in current work
Future for children
Family health
Unemployment
Current living expenses
Living expenses for later
in life
Always feel anxious Sometimes feel anxious Neither anxious nor unconcerned Normally do not feel anxious Do not feel anxious at all
Indonesia (n=400)Vietnam (n=400) Thailand (n=400)
Unit: %
©2016 W&S GROUP15
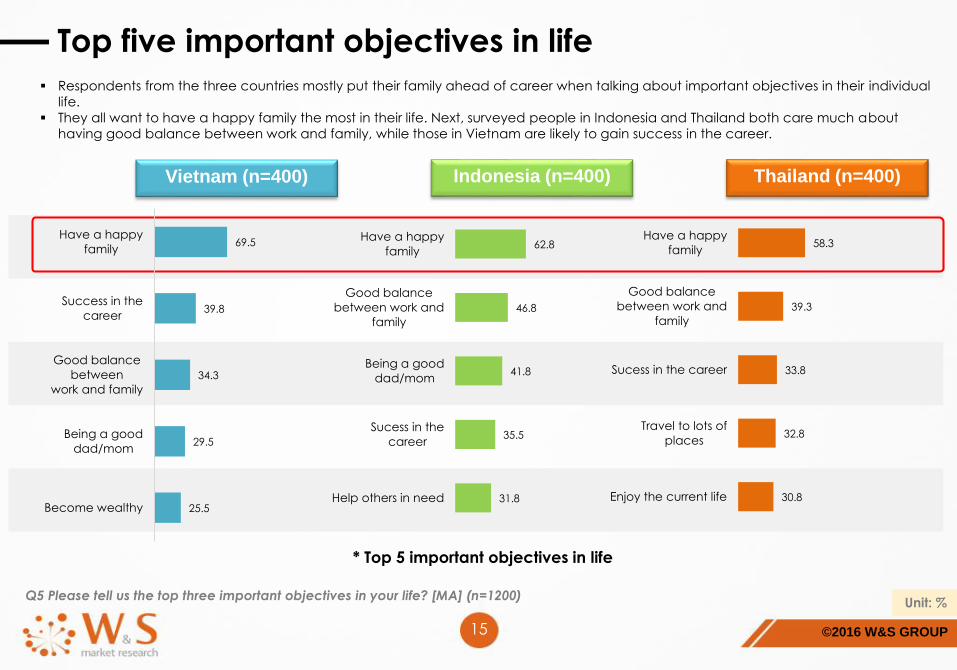
Top five important objectives in life
Respondents from the three countries mostly put their family ahead of career when talking about important objectives in their individual
life.
They all want to have a happy family the most in their life. Next, surveyed people in Indonesia and Thailand both care much about
having good balance between work and family, while those in Vietnam are likely to gain success in the career.
Q5 Please tell us the top three important objectives in your life? [MA] (n=1200)
58.3
39.3
33.8
32.8
30.8
Have a happy
family
Good balance
between work and
family
Sucess in the career
Travel to lots of
places
Enjoy the current life
* Top 5 important objectives in life
62.8
46.8
41.8
35.5
31.8
Have a happy
family
Good balance
between work and
family
Being a good
dad/mom
Sucess in the
career
Help others in need
69.5
39.8
34.3
29.5
25.5
Have a happy
family
Success in the
career
Good balance
between
work and family
Being a good
dad/mom
Become wealthy
Indonesia (n=400)Vietnam (n=400) Thailand (n=400)
Unit: %

©2016 W&S GROUP16
Top five important objectives in life – By Gender
Q5 Please tell us the top three important objectives in your life? [MA] (n=1200)
58.5
38.5
35.0
26.0
29.5
58.0
40.0
32.5
39.5
32.0
Have a happy family
Good balance between
work and family
Sucess in the career
Travel to lots of places
Enjoy the current life
67.0
42.0
35.5
30.0
29.5
72.0
37.5
33.0
29.0
21.5
Have a happy family
Sucess in the career
Good balance between
work and family
Being a good dad/mom
Become wealthy
65.0
52.5
38.0
38.5
31.5
60.5
41.0
45.5
32.5
32.0
Have a happy family
Good balance between
work and family
Being a good dad/mom
Sucess in the career
Help others in need
Male Female
Indonesia (n=400)Vietnam (n=400) Thailand (n=400)
* Top 5 important objectives in life
Unit: %

©2016 W&S GROUP17
F. Detail findings
1. General attitude about life
2. Occupation
3. Shopping Habits
4. Money & Savings
5. Leisure & Recreation

©2016 W&S GROUP18
Change job within past one year
Among job hoppers last year, the percentage of changing once is rather high in Vietnam (19.3%) and Indonesia (16.8%); whereas, in
Thailand, they changed job once (13.8%) or two times (6.3%) within 1 year.
Q7. Please tell us how many times did you change job within past one year? [SA] (n=1200)
75.5
13.8
6.3
3.0
1.5
78.0
19.3
2.5
0.3
0.0
73.0
16.8
8.3
2.0
0.0
I did not change the job
Once
Twice
Three times
More than three times
Indonesia (n=400)Vietnam (n=400) Thailand (n=400)
Unit: %

©2016 W&S GROUP19
Change job within past one year – By Gender
Q7. Please tell us how many times did you change job within past one year? [SA] (n=1200)
I did not change the job
Once
Twice
Three times
More than three times
72.5
14.5
8.0
3.5
1.5
78.5
13.0
4.5
2.5
1.5
79.0
19.5
1.0
0.5
0.0
77.0
19.0
4.0
0.0
0.0
73.5
13.5
10.5
2.5
0.0
72.5
20.0
6.0
1.5
0.0
Indonesia (n=400)Vietnam (n=400) Thailand (n=400)
Male Female
Unit: %
©2016 W&S GROUP20
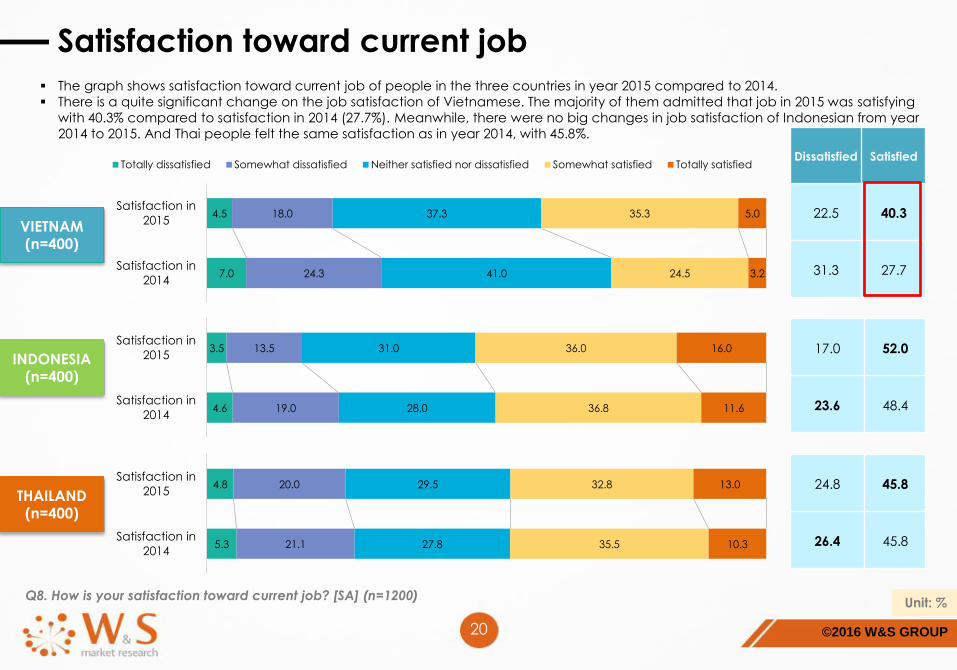
Satisfaction toward current job
The graph shows satisfaction toward current job of people in the three countries in year 2015 compared to 2014.
There is a quite significant change on the job satisfaction of Vietnamese. The majority of them admitted that job in 2015 was satisfying
with 40.3% compared to satisfaction in 2014 (27.7%). Meanwhile, there were no big changes in job satisfaction of Indonesian from year
2014 to 2015. And Thai people felt the same satisfaction as in year 2014, with 45.8%.
Q8. How is your satisfaction toward current job? [SA] (n=1200)
7.0
4.5
24.3
18.0
41.0
37.3
24.5
35.3
3.2
5.0
Satisfaction in
2014
Satisfaction in
2015
Totally dissatisfied Somewhat dissatisfied Neither satisfied nor dissatisfied Somewhat satisfied Totally satisfied
4.6
3.5
19.0
13.5
28.0
31.0
36.8
36.0
11.6
16.0
Satisfaction in
2014
Satisfaction in
2015
5.3
4.8
21.1
20.0
27.8
29.5
35.5
32.8
10.3
13.0
Satisfaction in
2014
Satisfaction in
2015
Dissatisfied Satisfied
22.5 40.3
31.3 27.7
17.0 52.0
23.6 48.4
24.8 45.8
26.4 45.8
VIETNAM (n=400)
INDONESIA (n=400)
THAILAND (n=400)
Unit: %

©2016 W&S GROUP21
Satisfaction toward current job – By Gender
Q8. How is your satisfaction toward current job? [SA] (n=1200)
4.5 18.0 37.3 35.3 5.0Satisfaction in
2015
Totally dissatisfied Somewhat dissatisfied
Neither satisfied nor dissatisfied Somewhat satisfied
Totally satisfied
3.5 13.5 31.0 36.0 16.0Satisfaction in
2015
4.8 20.0 29.5 32.8 13.0Satisfaction in
2015
Dissatisfied (T2B)
Male Female
24.0 21.0
15.0 19.0
29.0 20.5
Dissatisfied(T2B)
22.5
17.0
24.8
VIETNAM (n=400)
INDONESIA (n=400)
THAILAND (n=400)
Unit: %
©2016 W&S GROUP22
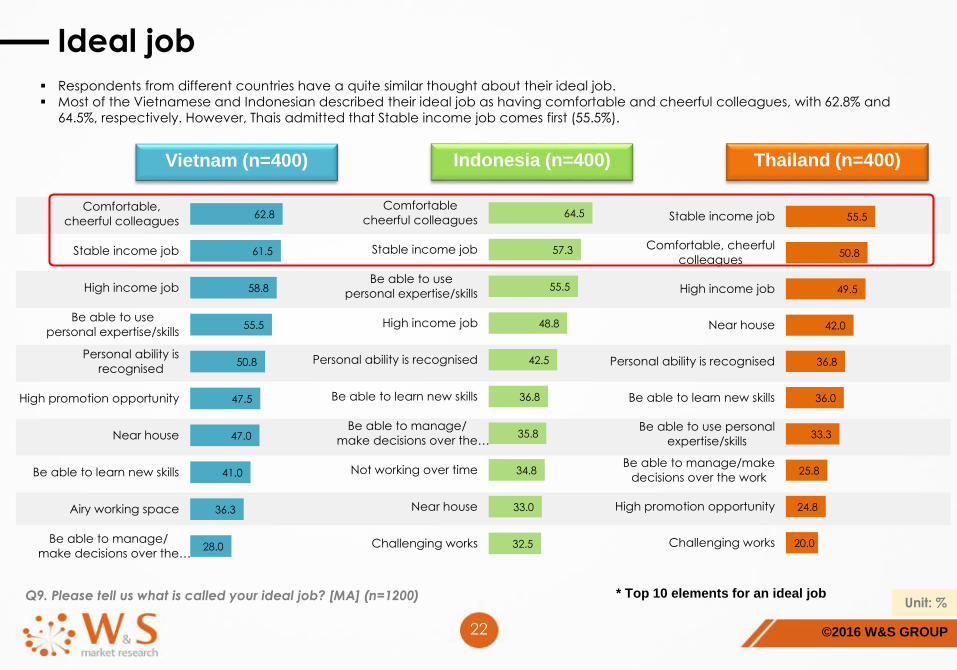
Ideal job
Respondents from different countries have a quite similar thought about their ideal job.
Most of the Vietnamese and Indonesian described their ideal job as having comfortable and cheerful colleagues, with 62.8% and
64.5%, respectively. However, Thais admitted that Stable income job comes first (55.5%).
Q9. Please tell us what is called your ideal job? [MA] (n=1200)
55.5
50.8
49.5
42.0
36.8
36.0
33.3
25.8
24.8
20.0
Stable income job
Comfortable, cheerful
colleagues
High income job
Near house
Personal ability is recognised
Be able to learn new skills
Be able to use personal
expertise/skills
Be able to manage/make
decisions over the work
High promotion opportunity
Challenging works
62.8
61.5
58.8
55.5
50.8
47.5
47.0
41.0
36.3
28.0
Comfortable,
cheerful colleagues
Stable income job
High income job
Be able to use
personal expertise/skills
Personal ability is
recognised
High promotion opportunity
Near house
Be able to learn new skills
Airy working space
Be able to manage/
make decisions over the…
64.5
57.3
55.5
48.8
42.5
36.8
35.8
34.8
33.0
32.5
Comfortable
cheerful colleagues
Stable income job
Be able to use
personal expertise/skills
High income job
Personal ability is recognised
Be able to learn new skills
Be able to manage/
make decisions over the…
Not working over time
Near house
Challenging works
* Top 10 elements for an ideal job
Indonesia (n=400)Vietnam (n=400) Thailand (n=400)
Unit: %
©2016 W&S GROUP23
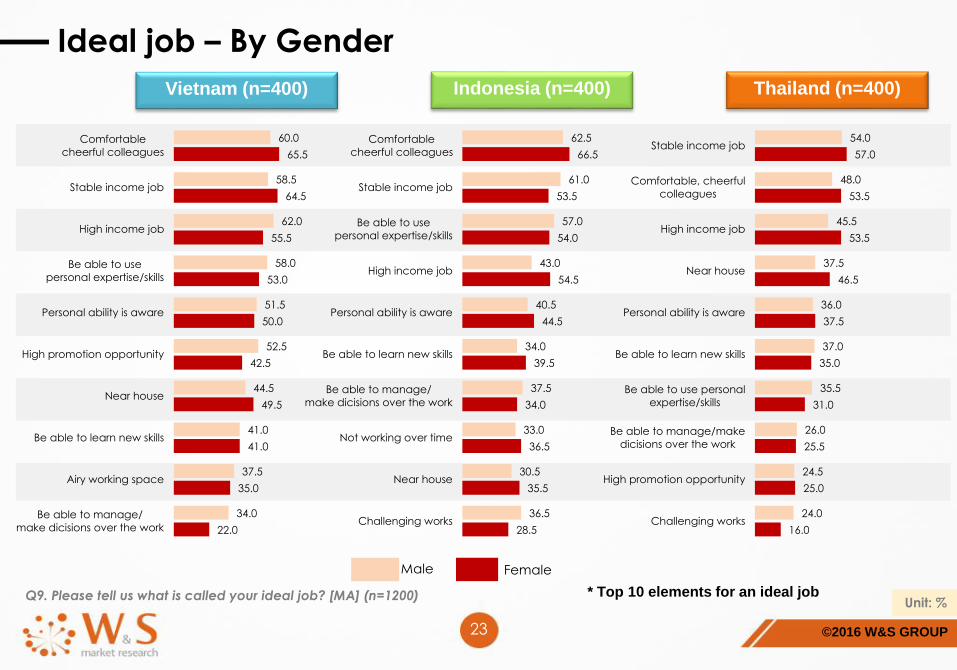
Ideal job – By Gender
Q9. Please tell us what is called your ideal job? [MA] (n=1200)
54.0
48.0
45.5
37.5
36.0
37.0
35.5
26.0
24.5
24.0
57.0
53.5
53.5
46.5
37.5
35.0
31.0
25.5
25.0
16.0
Stable income job
Comfortable, cheerful
colleagues
High income job
Near house
Personal ability is aware
Be able to learn new skills
Be able to use personal
expertise/skills
Be able to manage/make
dicisions over the work
High promotion opportunity
Challenging works
60.0
58.5
62.0
58.0
51.5
52.5
44.5
41.0
37.5
34.0
65.5
64.5
55.5
53.0
50.0
42.5
49.5
41.0
35.0
22.0
Comfortable
cheerful colleagues
Stable income job
High income job
Be able to use
personal expertise/skills
Personal ability is aware
High promotion opportunity
Near house
Be able to learn new skills
Airy working space
Be able to manage/
make dicisions over the work
62.5
61.0
57.0
43.0
40.5
34.0
37.5
33.0
30.5
36.5
66.5
53.5
54.0
54.5
44.5
39.5
34.0
36.5
35.5
28.5
Comfortable
cheerful colleagues
Stable income job
Be able to use
personal expertise/skills
High income job
Personal ability is aware
Be able to learn new skills
Be able to manage/
make dicisions over the work
Not working over time
Near house
Challenging works
* Top 10 elements for an ideal job
Indonesia (n=400)Vietnam (n=400) Thailand (n=400)
Unit: %
Male Female
©2016 W&S GROUP24
F. Detail findings
1. General attitude about life
2. Occupation
3. Shopping Habits
4. Money & Savings
5. Leisure & Recreation
©2016 W&S GROUP25
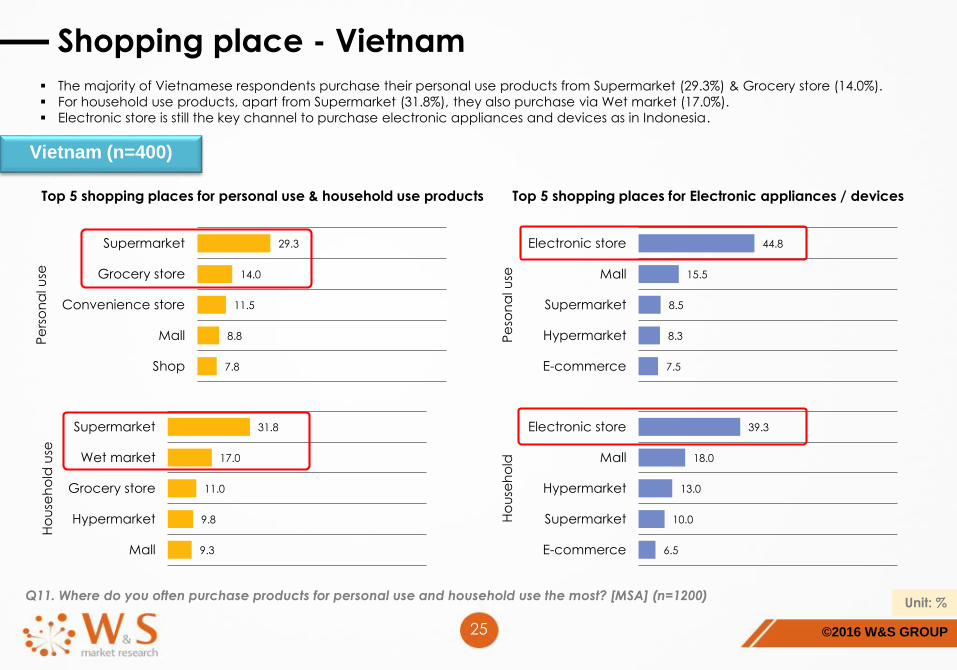
Shopping place - Vietnam
The majority of Vietnamese respondents purchase their personal use products from Supermarket (29.3%) & Grocery store (14.0%).
For household use products, apart from Supermarket (31.8%), they also purchase via Wet market (17.0%).
Electronic store is still the key channel to purchase electronic appliances and devices as in Indonesia.
Q11. Where do you often purchase products for personal use and household use the most? [MSA] (n=1200)
Top 5 shopping places for personal use & household use products Top 5 shopping places for Electronic appliances / devices
29.3
14.0
11.5
8.8
7.8
Supermarket
Grocery store
Convenience store
Mall
Shop
Pe
rso
na
l u
se
44.8
15.5
8.5
8.3
7.5
Electronic store
Mall
Supermarket
Hypermarket
E-commerce
Pe
son
al u
se
31.8
17.0
11.0
9.8
9.3
Supermarket
Wet market
Grocery store
Hypermarket
Mall
Ho
use
ho
ld u
se
39.3
18.0
13.0
10.0
6.5
Electronic store
Mall
Hypermarket
Supermarket
E-commerce
Ho
use
ho
ld
Vietnam (n=400)
Unit: %
©2016 W&S GROUP26
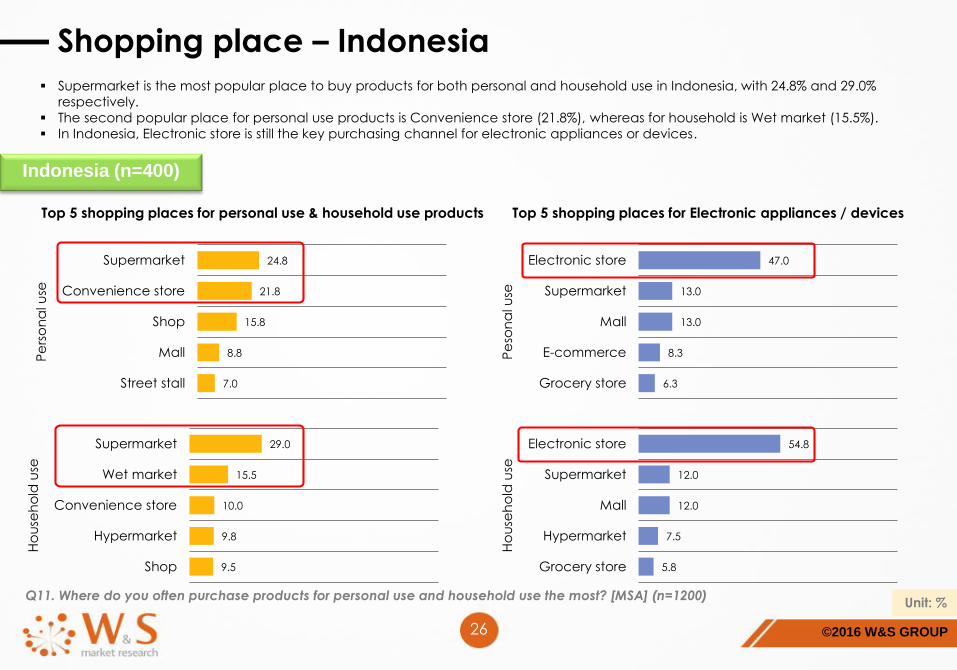
Shopping place – Indonesia
Supermarket is the most popular place to buy products for both personal and household use in Indonesia, with 24.8% and 29.0%
respectively.
The second popular place for personal use products is Convenience store (21.8%), whereas for household is Wet market (15.5%).
In Indonesia, Electronic store is still the key purchasing channel for electronic appliances or devices.
Q11. Where do you often purchase products for personal use and household use the most? [MSA] (n=1200)
24.8
21.8
15.8
8.8
7.0
Supermarket
Convenience store
Shop
Mall
Street stall
Pe
rso
na
l u
se
47.0
13.0
13.0
8.3
6.3
Electronic store
Supermarket
Mall
E-commerce
Grocery store
Pe
son
al u
se
29.0
15.5
10.0
9.8
9.5
Supermarket
Wet market
Convenience store
Hypermarket
Shop
Ho
use
ho
ld u
se
54.8
12.0
12.0
7.5
5.8
Electronic store
Supermarket
Mall
Hypermarket
Grocery store
Ho
use
ho
ld u
se
Top 5 shopping places for personal use & household use products Top 5 shopping places for Electronic appliances / devices
Indonesia (n=400)
Unit: %
©2016 W&S GROUP27
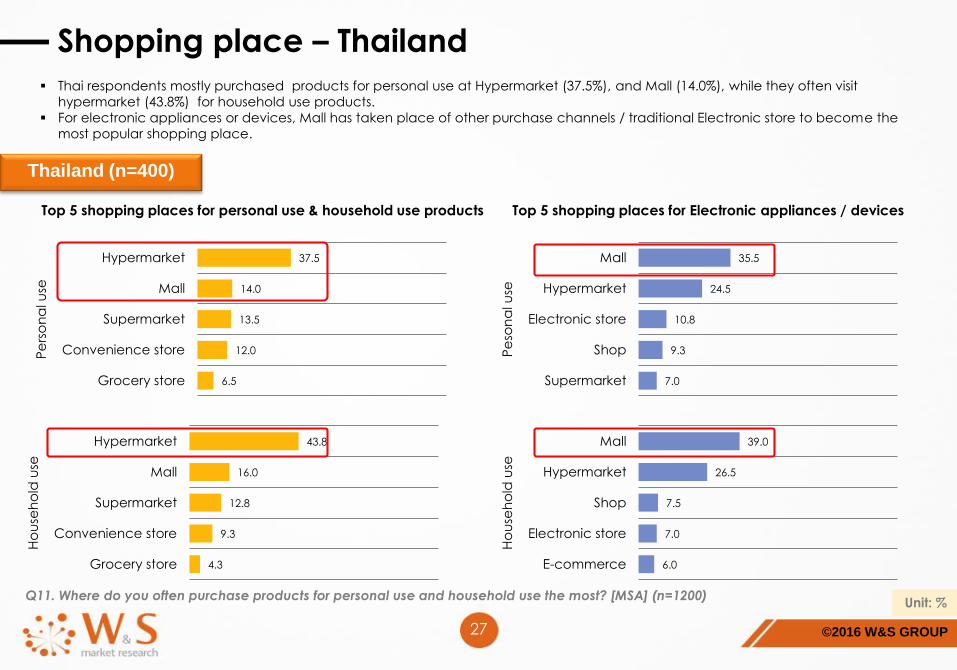
Shopping place – Thailand
Thai respondents mostly purchased products for personal use at Hypermarket (37.5%), and Mall (14.0%), while they often visit
hypermarket (43.8%) for household use products.
For electronic appliances or devices, Mall has taken place of other purchase channels / traditional Electronic store to become the
most popular shopping place.
Q11. Where do you often purchase products for personal use and household use the most? [MSA] (n=1200)
37.5
14.0
13.5
12.0
6.5
Hypermarket
Mall
Supermarket
Convenience store
Grocery store
Pe
rso
na
l u
se
35.5
24.5
10.8
9.3
7.0
Mall
Hypermarket
Electronic store
Shop
Supermarket
Pe
son
al u
se
43.8
16.0
12.8
9.3
4.3
Hypermarket
Mall
Supermarket
Convenience store
Grocery store
Ho
use
ho
ld u
se
39.0
26.5
7.5
7.0
6.0
Mall
Hypermarket
Shop
Electronic store
E-commerce
Ho
use
ho
ld u
se
Top 5 shopping places for personal use & household use products Top 5 shopping places for Electronic appliances / devices
Thailand (n=400)
Unit: %
©2016 W&S GROUP28
Online purchasing products
Clothing is the most popular product category to be purchased online in Vietnam and Indonesia, with 55.3% and 52.3%, respectively. In
Thailand, Beauty and Health is the most common type of product bought online in the last year (40.5%).
While Bags/ Accessories, Shoes & Footwear in turn ranked second in Indonesia and Vietnam respectively, Clothing products gain
second most popular product purchased online in Thailand.
Q12. Please tell us whether you have purchased online or not? If yes, please specify the products you purchased within last year? [MA] (n=1200)
55.3
37.5
29.3
29.3
28.8
Clothing
Shoes &
Footwear
Books, CD &
Culture
Products
Bags &
Accessories
Beauty &
Health
52.3
38.8
33.0
31.5
28.3
Clothing
Bags &
Accessories
Beauty & Health
Shoes & Footwear
Mobiles & Tablets
* Top 5 categories of products that are purchased online
40.5
39.0
30.0
29.5
26.0
Beauty & Health
Clothing
Mobiles & Tablets
Home Appliances
Shoes & Footwear
Indonesia (n=400)Vietnam (n=400) Thailand (n=400)
Unit: %
©2016 W&S GROUP29
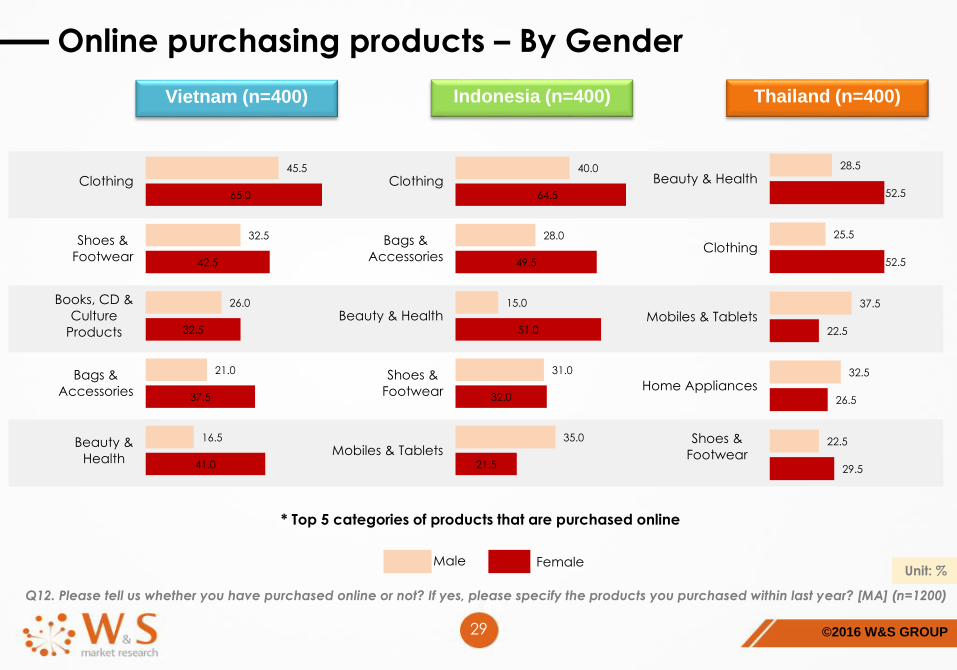
Online purchasing products – By Gender
Q12. Please tell us whether you have purchased online or not? If yes, please specify the products you purchased within last year? [MA] (n=1200)
45.5
32.5
26.0
21.0
16.5
65.0
42.5
32.5
37.5
41.0
Clothing
Shoes &
Footwear
Books, CD &
Culture
Products
Bags &
Accessories
Beauty &
Health
40.0
28.0
15.0
31.0
35.0
64.5
49.5
51.0
32.0
21.5
Clothing
Bags &
Accessories
Beauty & Health
Shoes &
Footwear
Mobiles & Tablets
28.5
25.5
37.5
32.5
22.5
52.5
52.5
22.5
26.5
29.5
Beauty & Health
Clothing
Mobiles & Tablets
Home Appliances
Shoes &
Footwear
Indonesia (n=400)Vietnam (n=400) Thailand (n=400)
* Top 5 categories of products that are purchased online
Unit: %Male Female
©2016 W&S GROUP30
Payment method
Cash is the main payment method among 3 countries for regular shopping. However, in Thailand, paying by Credit card is also popular.
For online shopping, payment by ATM / Bank transfer is more common in Indonesia (53.0%) and Thailand (33.0%) than in Vietnam
(26.5%). Cash on Delivery is the most frequently used type of transaction in Vietnam (35.3%), much higher than those in Indonesia (9.5%)
and Thailand (13.0%).
Q12. Please tell us which payment methods do you often use when purchasing for goods? [MSA] (n=1200)
2.5
6.8
7.5
13.0
9.5
35.3
33.0
53.0
26.5
20.8
17.0
11.0
8.0
2.0
5.0
16.5
8.8
10.0
4.8
1.8
3.3
1.5
1.3
1.5
Thailand
(n=400)
Indonesia
(n=400)
Vietnam
(n=400)
I do not buy goods this way Cash on Delivery
ATM/Bank transfer Online banking
Online wallets Credit card
Debit card Others
0.5
2.0
2.8
74.3
62.0
88.3
0.3
7.3
1.5
3.3
0.8
0.5
19.0
9.5
3.8
1.8
15.5
2.3
0.0
3.0
1.0
Thailand
(n=400)
Indonesia
(n=400)
Vietnam
(n=400)
I do not buy goods this way Cash
ATM/Bank transfer Online banking
Online wallets Credit card
Debit card Others
For regular shopping For online shopping
Unit: %
©2016 W&S GROUP31
F. Detail findings
1. General attitude about life
2. Occupation
3. Shopping Habits
4. Money & Savings
5. Leisure & Recreation

©2016 W&S GROUP32
Change of Income compared to 2014
The graph shows changes in income of people in the three countries in year 2015 compared to 2014.
The income in 2015 compared to 2014 has changed significantly for Thailand. There are much fewer people (44.8%) who indicated that
their income has been increased in 2015 compared to 60.9% in year 2014. This is in contrast to Vietnam where 67.5% of them admitted
that their income has been increased in 2015. For Indonesia, there’s no critical change of income in 2015.
Q14. Please tell us how does your income in 2015 change compared to 2014? [MSA] (n=1200)
8.8
3.5
18.8
12.5
17.2
16.0
45.2
53.8
9.3
13.8
Income in
2014
Income in
2015
Significantly decrease Slightly decrease No change Slightly increase Significantly increase I don't know
4.6
5.5
13.2
13.0
14.0
14.5
55.6
53.5
11.4
13.0
Income in
2014
Income in
2015
7.3
9.5
13.3
16.0
16.7
28.5
34.4
39.3
26.5
5.5
Income in
2014
Income in
2015
Decrease Increase
16.0 67.5
27.6 54.5
18.5 66.5
17.8 67.0
25.5 44.8
20.7 60.9
VIETNAM (n=400)
INDONESIA (n=400)
THAILAND (n=400)
Unit: %

©2016 W&S GROUP33
Change of Income compared to 2014 – By Gender
Q14. Please tell us how does your income in 2015 change compared to 2014? [MSA] (n=1200)
3.5 12.5 16.0 53.8 13.8Income
in 2015
Significantly decrease Slightly decrease No change
Slightly increase Significantly increase I don't know
5.5 13.0 14.5 53.5 13.0Income
in 2015
9.5 16.0 28.5 39.3 5.5Income
in 2015
Decrease
(T2B)
Male Female
16.0 16.0
16.5 20.5
29.5 21.5
Decrease (T2B)
16.0
18.5
25.5
VIETNAM (n=400)
INDONESIA (n=400)
THAILAND (n=400)
Unit: %
©2016 W&S GROUP34
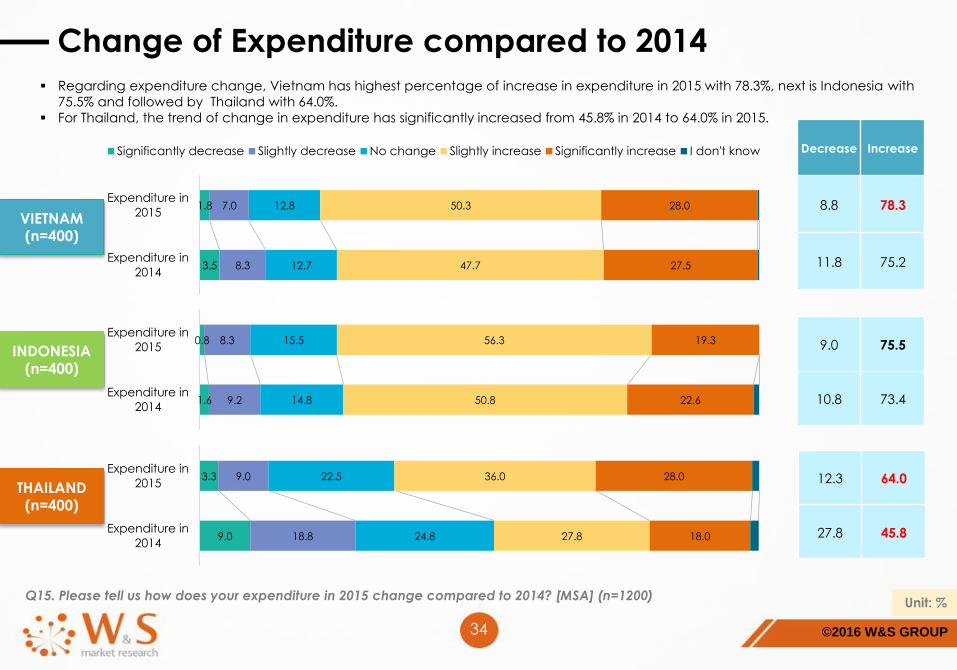
Change of Expenditure compared to 2014
Regarding expenditure change, Vietnam has highest percentage of increase in expenditure in 2015 with 78.3%, next is Indonesia with
75.5% and followed by Thailand with 64.0%.
For Thailand, the trend of change in expenditure has significantly increased from 45.8% in 2014 to 64.0% in 2015.
Q15. Please tell us how does your expenditure in 2015 change compared to 2014? [MSA] (n=1200)
3.5
1.8
8.3
7.0
12.7
12.8
47.7
50.3
27.5
28.0
Expenditure in
2014
Expenditure in
2015
Significantly decrease Slightly decrease No change Slightly increase Significantly increase I don't know
1.6
0.8
9.2
8.3
14.8
15.5
50.8
56.3
22.6
19.3
Expenditure in
2014
Expenditure in
2015
9.0
3.3
18.8
9.0
24.8
22.5
27.8
36.0
18.0
28.0
Expenditure in
2014
Expenditure in
2015
Decrease Increase
8.8 78.3
11.8 75.2
9.0 75.5
10.8 73.4
12.3 64.0
27.8 45.8
VIETNAM (n=400)
INDONESIA (n=400)
THAILAND (n=400)
Unit: %
©2016 W&S GROUP35
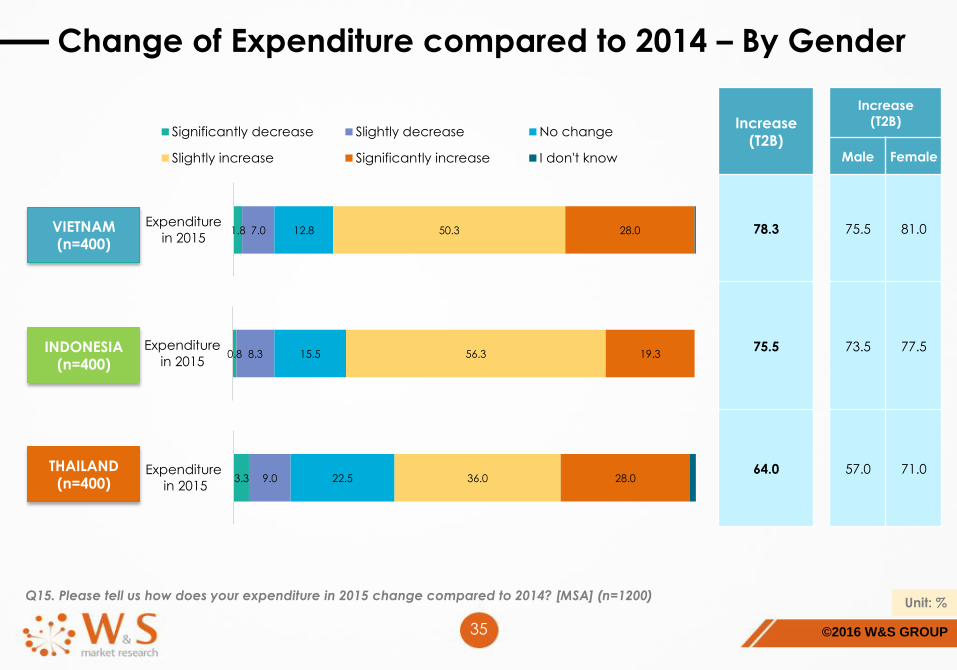
Change of Expenditure compared to 2014 – By Gender
Q15. Please tell us how does your expenditure in 2015 change compared to 2014? [MSA] (n=1200)
1.8 7.0 12.8 50.3 28.0Expenditure
in 2015
Significantly decrease Slightly decrease No change
Slightly increase Significantly increase I don't know
0.8 8.3 15.5 56.3 19.3Expenditure
in 2015
3.3 9.0 22.5 36.0 28.0Expenditure
in 2015
Increase
(T2B)
Male Female
75.5 81.0
73.5 77.5
57.0 71.0
Increase(T2B)
78.3
75.5
64.0
VIETNAM (n=400)
INDONESIA (n=400)
THAILAND (n=400)
Unit: %
©2016 W&S GROUP36
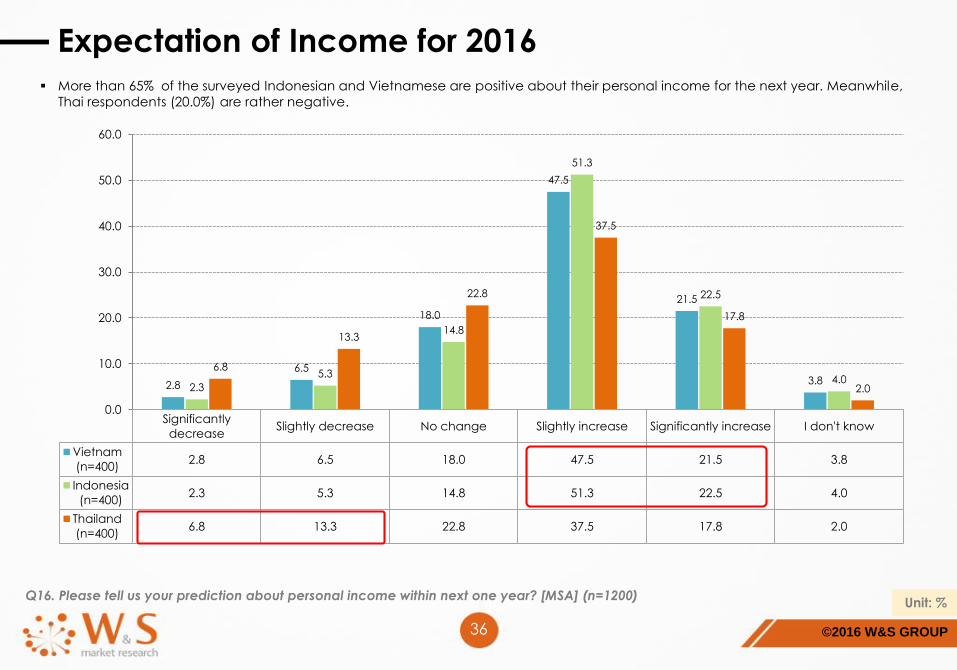
Expectation of Income for 2016
More than 65% of the surveyed Indonesian and Vietnamese are positive about their personal income for the next year. Meanwhile,
Thai respondents (20.0%) are rather negative.
Q16. Please tell us your prediction about personal income within next one year? [MSA] (n=1200)
Significantly
decreaseSlightly decrease No change Slightly increase Significantly increase I don't know
Vietnam
(n=400)2.8 6.5 18.0 47.5 21.5 3.8
Indonesia
(n=400)2.3 5.3 14.8 51.3 22.5 4.0
Thailand
(n=400)6.8 13.3 22.8 37.5 17.8 2.0
2.8
6.5
18.0
47.5
21.5
3.82.3
5.3
14.8
51.3
22.5
4.06.8
13.3
22.8
37.5
17.8
2.0
0.0
10.0
20.0
30.0
40.0
50.0
60.0
Unit: %
©2016 W&S GROUP37
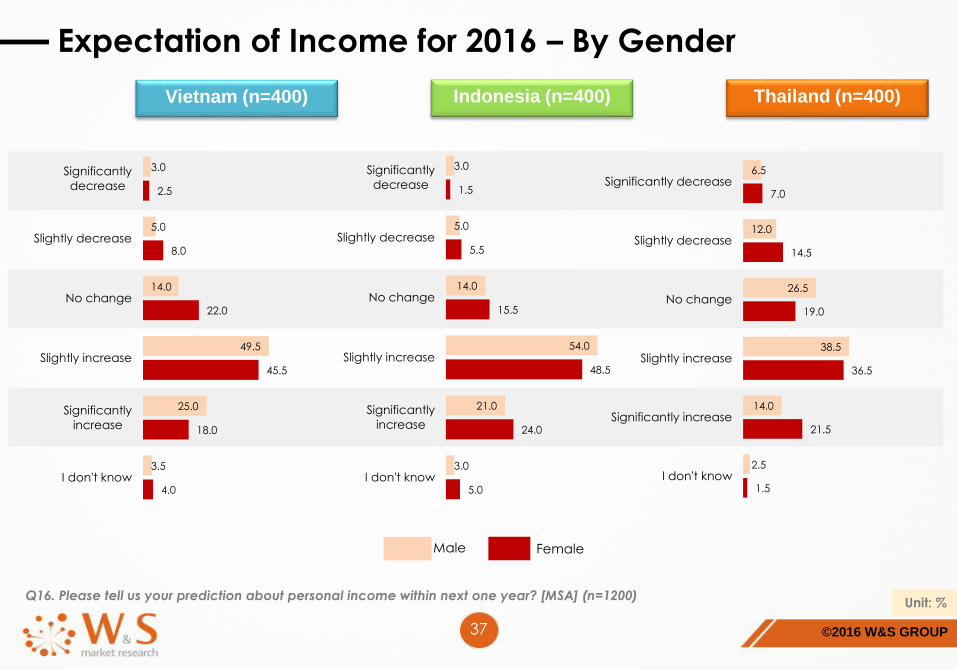
Expectation of Income for 2016 – By Gender
Q16. Please tell us your prediction about personal income within next one year? [MSA] (n=1200)
3.0
5.0
14.0
49.5
25.0
3.5
2.5
8.0
22.0
45.5
18.0
4.0
Significantly
decrease
Slightly decrease
No change
Slightly increase
Significantly
increase
I don't know
3.0
5.0
14.0
54.0
21.0
3.0
1.5
5.5
15.5
48.5
24.0
5.0
Significantly
decrease
Slightly decrease
No change
Slightly increase
Significantly
increase
I don't know
6.5
12.0
26.5
38.5
14.0
2.5
7.0
14.5
19.0
36.5
21.5
1.5
Significantly decrease
Slightly decrease
No change
Slightly increase
Significantly increase
I don't know
Indonesia (n=400)Vietnam (n=400) Thailand (n=400)
Unit: %
Male Female
©2016 W&S GROUP38
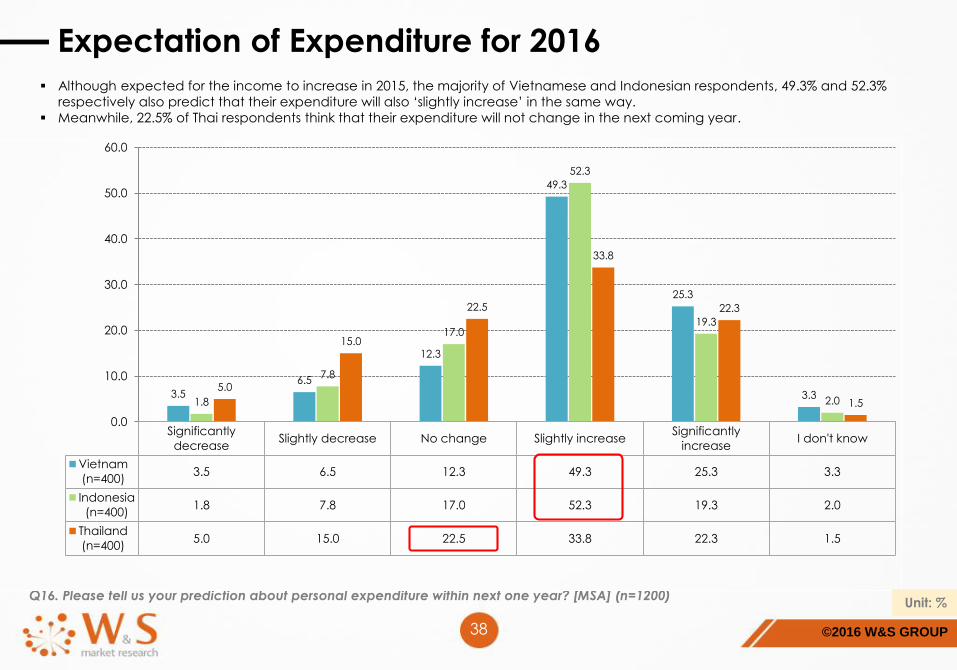
Expectation of Expenditure for 2016
Although expected for the income to increase in 2015, the majority of Vietnamese and Indonesian respondents, 49.3% and 52.3%
respectively also predict that their expenditure will also ‘slightly increase’ in the same way.
Meanwhile, 22.5% of Thai respondents think that their expenditure will not change in the next coming year.
Q16. Please tell us your prediction about personal expenditure within next one year? [MSA] (n=1200)
Significantly
decreaseSlightly decrease No change Slightly increase
Significantly
increaseI don't know
Vietnam
(n=400)3.5 6.5 12.3 49.3 25.3 3.3
Indonesia
(n=400)1.8 7.8 17.0 52.3 19.3 2.0
Thailand
(n=400)5.0 15.0 22.5 33.8 22.3 1.5
3.5
6.5
12.3
49.3
25.3
3.31.8
7.8
17.0
52.3
19.3
2.0
5.0
15.0
22.5
33.8
22.3
1.5
0.0
10.0
20.0
30.0
40.0
50.0
60.0
Unit: %
©2016 W&S GROUP39
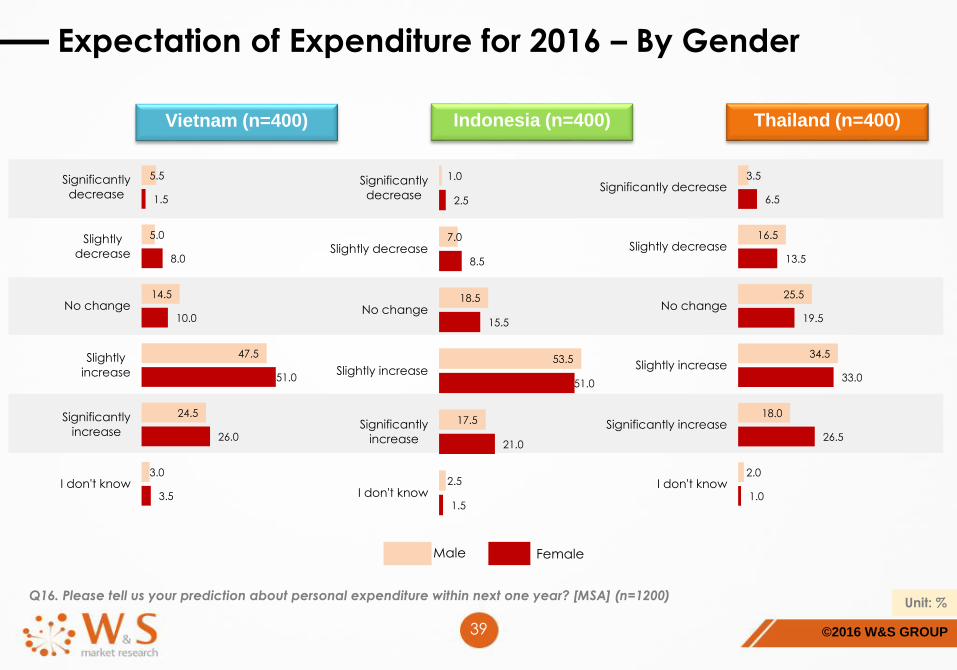
Expectation of Expenditure for 2016 – By Gender
Q16. Please tell us your prediction about personal expenditure within next one year? [MSA] (n=1200)
5.5
5.0
14.5
47.5
24.5
3.0
1.5
8.0
10.0
51.0
26.0
3.5
Significantly
decrease
Slightly
decrease
No change
Slightly
increase
Significantly
increase
I don't know
1.0
7.0
18.5
53.5
17.5
2.5
2.5
8.5
15.5
51.0
21.0
1.5
Significantly
decrease
Slightly decrease
No change
Slightly increase
Significantly
increase
I don't know
3.5
16.5
25.5
34.5
18.0
2.0
6.5
13.5
19.5
33.0
26.5
1.0
Significantly decrease
Slightly decrease
No change
Slightly increase
Significantly increase
I don't know
Indonesia (n=400)Vietnam (n=400) Thailand (n=400)
Unit: %
Male Female

©2016 W&S GROUP40
Change in price of products compared to 2014
The majority of respondents among 3 countries said that price of products has “slightly increased” in 2015.
For Indonesia and Thailand, 27.3% and 17.3% of the respondents respectively also stated that the price has “Significantly increased”.
Q17. Please tell us the change in price of products you have bought in the IV quarter of 2015 compared to 2014? [SA] (n=1200)
Significantly
decreaseSlightly decrease
No change / No
ideaSlightly increase
Significantly
increaseI don't know
Vietnam
(n=400)3.8 14.0 17.3 50.3 14.0 0.8
Indonesia
(n=400)1.5 4.5 7.3 58.3 27.3 1.3
Thailand
(n=400)4.3 14.3 16.5 45.3 17.3 2.5
3.8
14.0
17.3
50.3
14.0
0.81.5
4.57.3
58.3
27.3
1.3
4.3
14.316.5
45.3
17.3
2.5
0.0
10.0
20.0
30.0
40.0
50.0
60.0
Unit: %
©2016 W&S GROUP41
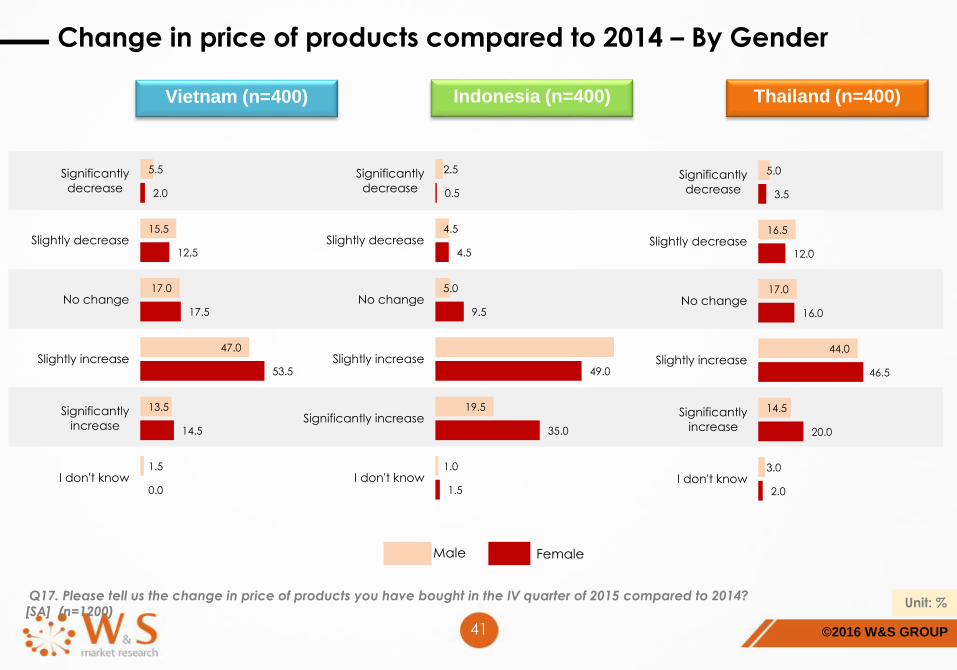
Change in price of products compared to 2014 – By Gender
Q17. Please tell us the change in price of products you have bought in the IV quarter of 2015 compared to 2014? [SA] (n=1200)
5.5
15.5
17.0
47.0
13.5
1.5
2.0
12.5
17.5
53.5
14.5
0.0
Significantly
decrease
Slightly decrease
No change
Slightly increase
Significantly
increase
I don't know
2.5
4.5
5.0
19.5
1.0
0.5
4.5
9.5
49.0
35.0
1.5
Significantly
decrease
Slightly decrease
No change
Slightly increase
Significantly increase
I don't know
5.0
16.5
17.0
44.0
14.5
3.0
3.5
12.0
16.0
46.5
20.0
2.0
Significantly
decrease
Slightly decrease
No change
Slightly increase
Significantly
increase
I don't know
Indonesia (n=400)Vietnam (n=400) Thailand (n=400)
Unit: %
Male Female

©2016 W&S GROUP42
Change in expenditure items compared to 2014 – Goods
While Gasoline is the top item that most of the respondents in Indonesia have to spend more in 2015 (32.8%), Thai people decided to
cut back their spending on Gasoline (44.0%). Respondents in Thailand enhanced most of their spending on Food & Beverage (53.8%)
and Motor vehicles and parts (44.0%).
Whereas, those in Vietnam spent more on Motor vehicles and parts (56.0%) and Recreational goods and vehicles (28.3%).
Q18. Please tell us the change in following expenditure items in 2015 compared to 2014? [MSA] (n=1200)
32.8
31.8
27.5
25.5
25.3
18.5
16.8
51.8
52.5
53.8
59.5
52.3
46.3
60.3
15.5
15.8
18.8
15.0
22.5
35.3
23.0
Gasoline
Food and beverages
Motor vehicles and
parts
Other energy goods
Clothing and footwear
Recreational goods
and vehicles
Furnishings and durable
household equipment
53.8
44.0
39.8
37.3
36.5
19.8
19.5
34.5
44.5
41.8
49.3
43.3
52.8
36.5
11.8
11.5
18.5
13.5
20.3
27.5
44.0
Food and beverages
purchased for off-
premises consumption
Motor vehicles and
parts
Recreational goods
and vehicles
Furnishings and durable
household equipment
Clothing and footwear
Other energy goods
Gasoline
56.0
28.3
28.0
26.5
23.8
23.0
20.0
36.5
27.8
38.0
45.5
53.8
55.8
38.5
7.5
44.0
34.0
28.0
22.5
21.3
41.5
Motor vehicles and parts
Recreational goods and
vehicles
Furnishings and durable
household equipment
Other energy goods
Gasoline
Clothing and footwear
Food and beverages
purchased for off-
premises consumption
Enhance spending Keep spending constant Cut back spending
Indonesia (n=400)Vietnam (n=400) Thailand (n=400)
Unit: %

©2016 W&S GROUP43
Change in expenditure items compared to 2014 – Service
While respondents in Indonesia and Thailand enhanced spending particularly on Food services and accommodations, with 35.0% and
47.8% respectively, respondents in Vietnam enhance more spending on Recreation services with 49.3%, followed by Food services and
accommodation with 36.8%.
In Indonesia, expenditure on services are reduced, specially Recreation services with 34.8% and Tourism & Hospitality with 42.3%. In
Vietnam, expenditure on some services remained the same such as Financial service and Insurance (52.3%) and Tourism and Hospitality
(56.8%).
Q19. Please tell us the change in following expenditure items in 2015 compared to 2014? [MSA] (n=1200)
35.0
30.3
26.5
25.3
22.3
48.3
57.0
38.8
32.5
54.5
16.8
12.8
34.8
42.3
23.3
Food services and
accommodations
Health care
Recreation services
Tourism and hospitality
Financial services and
insurance
47.8
39.3
37.8
31.3
30.0
40.3
44.3
38.3
58.0
58.5
12.0
16.5
24.0
10.8
11.5
Food services and
accommodations
Recreation services
Tourism and hospitality
Health care
Financial services and
insurance
49.3
36.8
27.8
26.5
21.3
37.8
38.5
46.8
52.3
56.8
13.0
24.8
25.5
21.3
22.0
Recreation services
Food services and
accommodations
Health care
Financial services and
insurance
Tourism and hospitality
Indonesia (n=400)Vietnam (n=400) Thailand (n=400)
Unit: %
Enhance spending Keep spending constant Cut back spending
©2016 W&S GROUP44
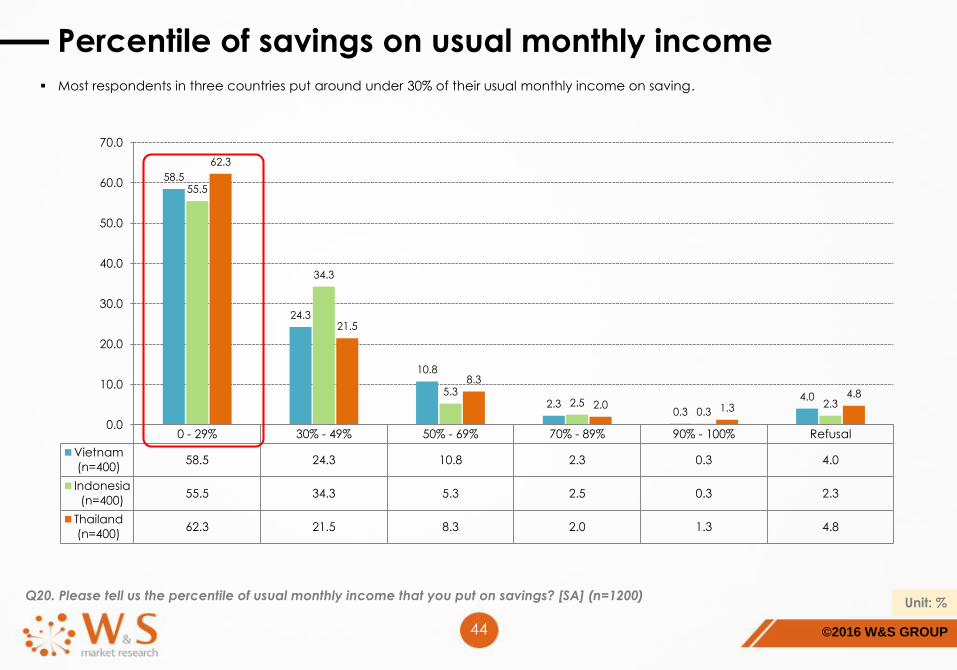
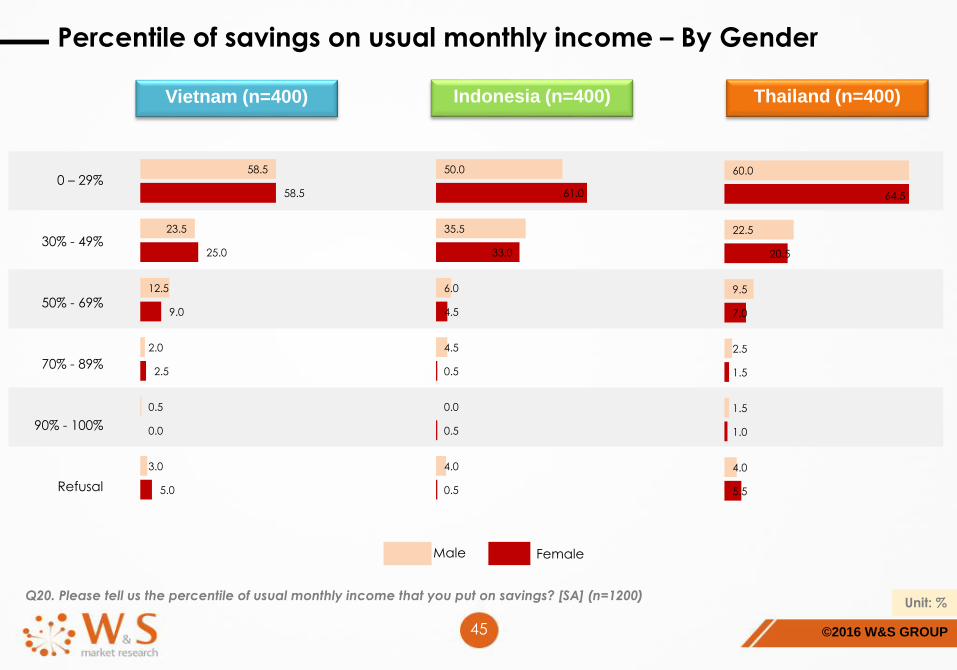
Percentile of savings on usual monthly income
Most respondents in three countries put around under 30% of their usual monthly income on saving.
Q20. Please tell us the percentile of usual monthly income that you put on savings? [SA] (n=1200)
0 - 29% 30% - 49% 50% - 69% 70% - 89% 90% - 100% Refusal
Vietnam
(n=400)58.5 24.3 10.8 2.3 0.3 4.0
Indonesia
(n=400)55.5 34.3 5.3 2.5 0.3 2.3
Thailand
(n=400)62.3 21.5 8.3 2.0 1.3 4.8
58.5
24.3
10.8
2.30.3
4.0
55.5
34.3
5.32.5
0.32.3
62.3
21.5
8.3
2.0 1.3
4.8
0.0
10.0
20.0
30.0
40.0
50.0
60.0
70.0
Unit: %
©2016 W&S GROUP45
Percentile of savings on usual monthly income – By Gender
Q20. Please tell us the percentile of usual monthly income that you put on savings? [SA] (n=1200)
Indonesia (n=400)Vietnam (n=400) Thailand (n=400)
Unit: %
Male Female
0 – 29%
30% - 49%
50% - 69%
70% - 89%
90% - 100%
Refusal
58.5
23.5
12.5
2.0
0.5
3.0
58.5
25.0
9.0
2.5
0.0
5.0
50.0
35.5
6.0
4.5
0.0
4.0
61.0
33.0
4.5
0.5
0.5
0.5
60.0
22.5
9.5
2.5
1.5
4.0
64.5
20.5
7.0
1.5
1.0
5.5
©2016 W&S GROUP46
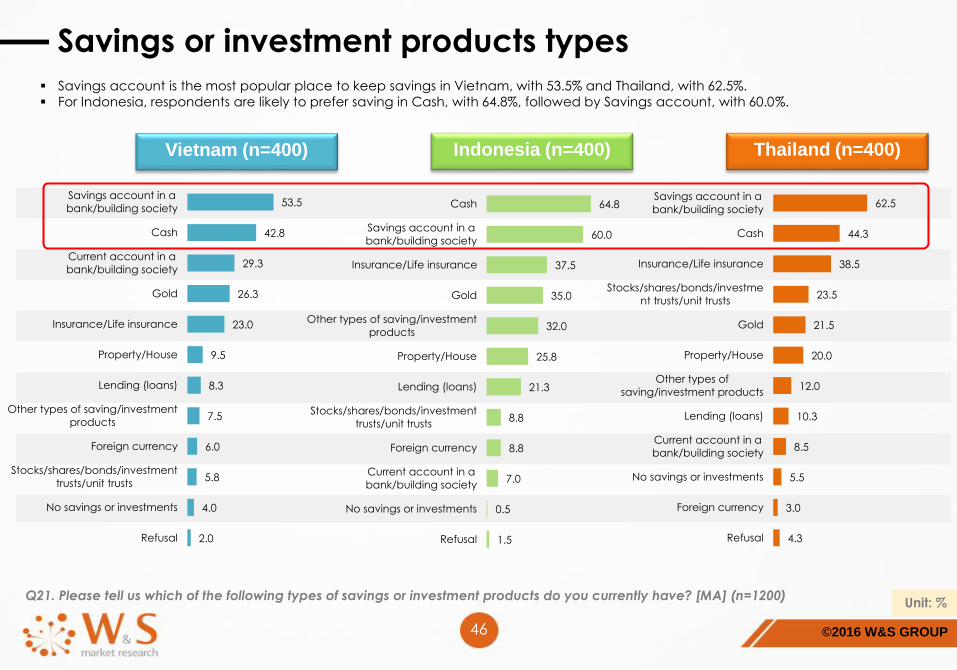
Savings or investment products types
Savings account is the most popular place to keep savings in Vietnam, with 53.5% and Thailand, with 62.5%.
For Indonesia, respondents are likely to prefer saving in Cash, with 64.8%, followed by Savings account, with 60.0%.
Q21. Please tell us which of the following types of savings or investment products do you currently have? [MA] (n=1200)
53.5
42.8
29.3
26.3
23.0
9.5
8.3
7.5
6.0
5.8
4.0
2.0
Savings account in a
bank/building society
Cash
Current account in a
bank/building society
Gold
Insurance/Life insurance
Property/House
Lending (loans)
Other types of saving/investment
products
Foreign currency
Stocks/shares/bonds/investment
trusts/unit trusts
No savings or investments
Refusal
64.8
60.0
37.5
35.0
32.0
25.8
21.3
8.8
8.8
7.0
0.5
1.5
Cash
Savings account in a
bank/building society
Insurance/Life insurance
Gold
Other types of saving/investment
products
Property/House
Lending (loans)
Stocks/shares/bonds/investment
trusts/unit trusts
Foreign currency
Current account in a
bank/building society
No savings or investments
Refusal
62.5
44.3
38.5
23.5
21.5
20.0
12.0
10.3
8.5
5.5
3.0
4.3
Savings account in a
bank/building society
Cash
Insurance/Life insurance
Stocks/shares/bonds/investme
nt trusts/unit trusts
Gold
Property/House
Other types of
saving/investment products
Lending (loans)
Current account in a
bank/building society
No savings or investments
Foreign currency
Refusal
Indonesia (n=400)Vietnam (n=400) Thailand (n=400)
Unit: %
©2016 W&S GROUP47
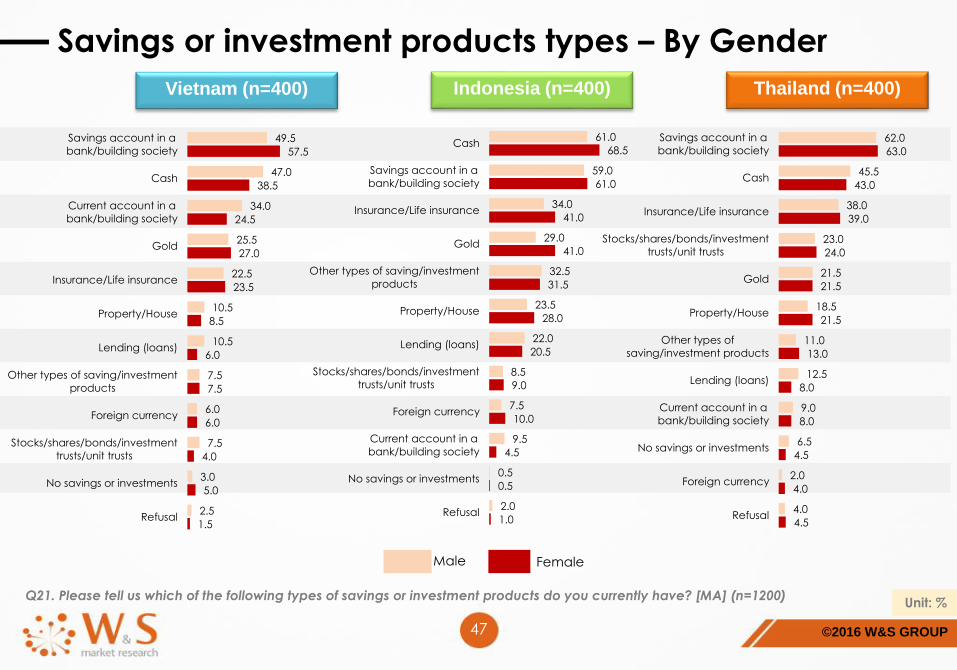
Savings or investment products types – By Gender
Q21. Please tell us which of the following types of savings or investment products do you currently have? [MA] (n=1200)
49.5
47.0
34.0
25.5
22.5
10.5
10.5
7.5
6.0
7.5
3.0
2.5
57.5
38.5
24.5
27.0
23.5
8.5
6.0
7.5
6.0
4.0
5.0
1.5
Savings account in a
bank/building society
Cash
Current account in a
bank/building society
Gold
Insurance/Life insurance
Property/House
Lending (loans)
Other types of saving/investment
products
Foreign currency
Stocks/shares/bonds/investment
trusts/unit trusts
No savings or investments
Refusal
61.0
59.0
34.0
29.0
32.5
23.5
22.0
8.5
7.5
9.5
0.5
2.0
68.5
61.0
41.0
41.0
31.5
28.0
20.5
9.0
10.0
4.5
0.5
1.0
Cash
Savings account in a
bank/building society
Insurance/Life insurance
Gold
Other types of saving/investment
products
Property/House
Lending (loans)
Stocks/shares/bonds/investment
trusts/unit trusts
Foreign currency
Current account in a
bank/building society
No savings or investments
Refusal
62.0
45.5
38.0
23.0
21.5
18.5
11.0
12.5
9.0
6.5
2.0
4.0
63.0
43.0
39.0
24.0
21.5
21.5
13.0
8.0
8.0
4.5
4.0
4.5
Savings account in a
bank/building society
Cash
Insurance/Life insurance
Stocks/shares/bonds/investment
trusts/unit trusts
Gold
Property/House
Other types of
saving/investment products
Lending (loans)
Current account in a
bank/building society
No savings or investments
Foreign currency
Refusal
Indonesia (n=400)Vietnam (n=400) Thailand (n=400)
Unit: %
Male Female
©2016 W&S GROUP48
F. Detail findings
1. General attitude about life
2. Occupation
3. Shopping Habits
4. Money & Savings
5. Leisure & Recreation

©2016 W&S GROUP49
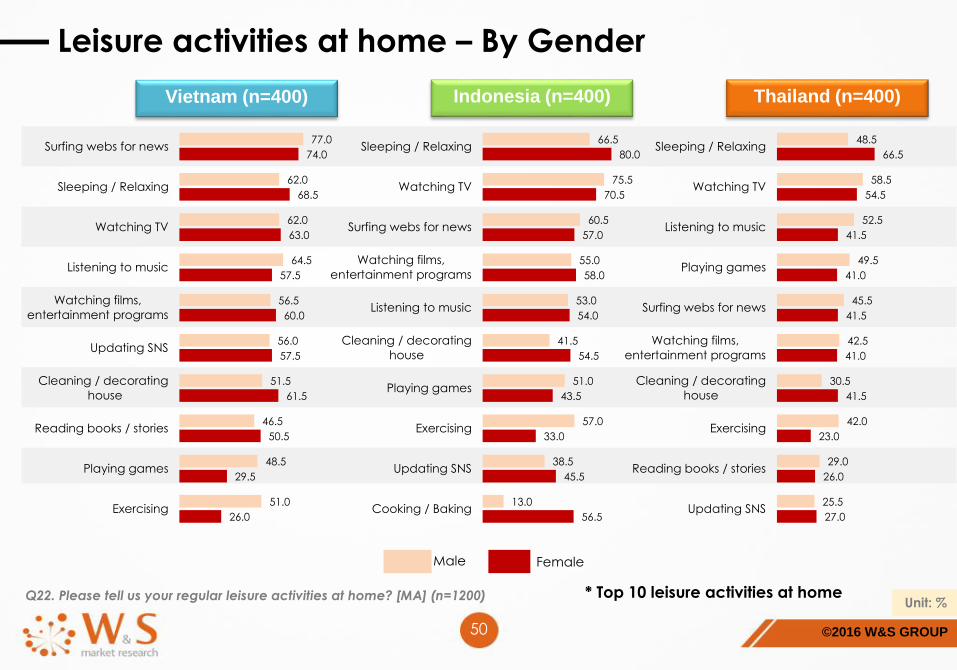
Leisure activities at home
Top leisure activities at home of respondents are quite similar for Indonesia and Thailand with Sleeping / Relaxing and Watching TV.
However, the most popular leisure activities at home in Vietnam is Surfing webs for news.
Q22. Please tell us your regular leisure activities at home? [MA] (n=1200)
57.5
56.5
47.0
45.3
43.5
41.8
36.0
32.5
27.5
26.3
Sleeping / Relaxing
Watching TV
Listening to music
Playing games
Surfing webs for news
Watching films,
entertainment programs
Cleaning / decorating
house
Exercising
Reading books / stories
Updating SNS
75.5
65.3
62.5
61.0
58.3
56.8
56.5
48.5
39.0
38.5
Surfing webs for news
Sleeping / Relaxing
Watching TV
Listening to music
Watching films,
entertainment programs
Updating SNS
Cleaning / decorating
house
Reading books / stories
Playing games
Exercising
73.3
73.0
58.8
56.5
53.5
48.0
47.3
45.0
42.0
34.8
Sleeping / Relaxing
Watching TV
Surfing webs for news
Watching films,
entertainment programs
Listening to music
Cleaning / decorating
house
Playing games
Exercising
Updating SNS
Cooking / Baking
* Top 10 leisure activities at home
Indonesia (n=400)Vietnam (n=400) Thailand (n=400)
Unit: %
©2016 W&S GROUP50
Leisure activities at home – By Gender
Q22. Please tell us your regular leisure activities at home? [MA] (n=1200)
48.5
58.5
52.5
49.5
45.5
42.5
30.5
42.0
29.0
25.5
66.5
54.5
41.5
41.0
41.5
41.0
41.5
23.0
26.0
27.0
Sleeping / Relaxing
Watching TV
Listening to music
Playing games
Surfing webs for news
Watching films,
entertainment programs
Cleaning / decorating
house
Exercising
Reading books / stories
Updating SNS
77.0
62.0
62.0
64.5
56.5
56.0
51.5
46.5
48.5
51.0
74.0
68.5
63.0
57.5
60.0
57.5
61.5
50.5
29.5
26.0
Surfing webs for news
Sleeping / Relaxing
Watching TV
Listening to music
Watching films,
entertainment programs
Updating SNS
Cleaning / decorating
house
Reading books / stories
Playing games
Exercising
66.5
75.5
60.5
55.0
53.0
41.5
51.0
57.0
38.5
13.0
80.0
70.5
57.0
58.0
54.0
54.5
43.5
33.0
45.5
56.5
Sleeping / Relaxing
Watching TV
Surfing webs for news
Watching films,
entertainment programs
Listening to music
Cleaning / decorating
house
Playing games
Exercising
Updating SNS
Cooking / Baking
* Top 10 leisure activities at home
Indonesia (n=400)Vietnam (n=400) Thailand (n=400)
Unit: %
Male Female

©2016 W&S GROUP51
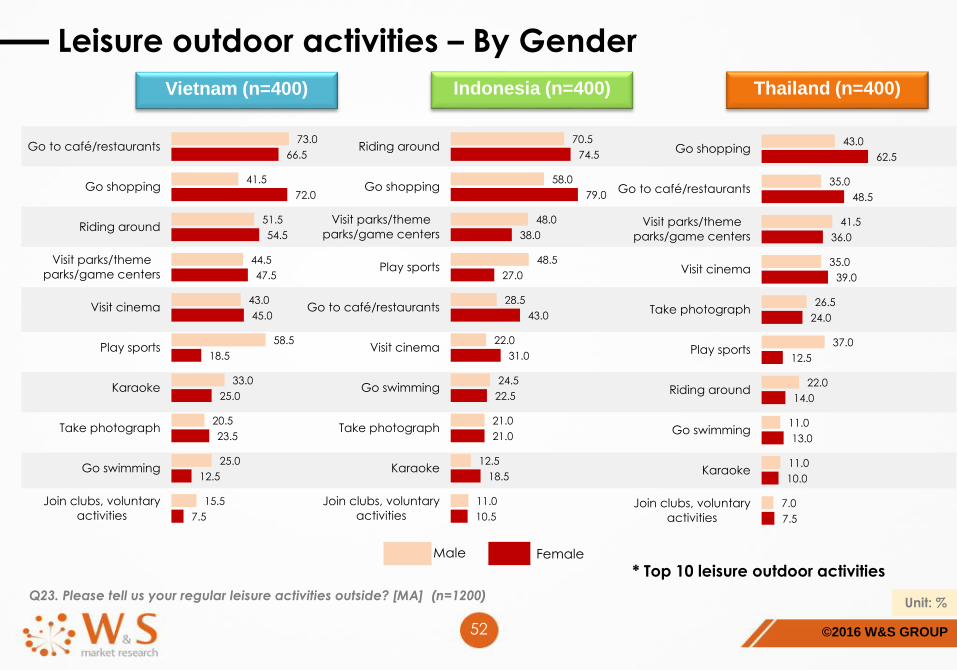
Leisure outdoor activities
Go shopping is the most common leisure outdoor activity of Thai respondents (52.8%), and also including in top three activities of
respondents from Indonesia and Vietnam. For Vietnam, Go to Café/restaurants is the most common leisure outdoor activities (69.8%).
Besides, respondents in Indonesia enjoy Riding around the city (72.5%) more than Go shopping (68.5%).
Q23. Please tell us your regular leisure activities outside? [MA] (n=1200)
69.8
56.8
53.0
46.0
44.0
38.5
29.0
22.0
18.8
11.5
Go to café/restaurants
Go shopping
Riding around
Visit parks/theme
parks/game centers
Visit cinema
Play sports
Karaoke
Take photograph
Go swimming
Join clubs, voluntary
activities
72.5
68.5
43.0
37.8
35.8
26.5
23.5
21.0
15.5
10.8
Riding around
Go shopping
Visit parks/theme
parks/game centers
Play sports
Go to café/restaurants
Visit cinema
Go swimming
Take photograph
Karaoke
Join clubs, voluntary
activities
52.8
41.8
38.8
37.0
25.3
24.8
18.0
12.0
10.5
7.3
Go shopping
Go to café/restaurants
Visit parks/theme
parks/game centers
Visit cinema
Take photograph
Play sports
Riding around
Go swimming
Karaoke
Join clubs, voluntary
activities
Indonesia (n=400)Vietnam (n=400) Thailand (n=400)
* Top 10 leisure outdoor activitiesUnit: %
©2016 W&S GROUP52
Leisure outdoor activities – By Gender
Q23. Please tell us your regular leisure activities outside? [MA] (n=1200)
73.0
41.5
51.5
44.5
43.0
58.5
33.0
20.5
25.0
15.5
66.5
72.0
54.5
47.5
45.0
18.5
25.0
23.5
12.5
7.5
Go to café/restaurants
Go shopping
Riding around
Visit parks/theme
parks/game centers
Visit cinema
Play sports
Karaoke
Take photograph
Go swimming
Join clubs, voluntary
activities
70.5
58.0
48.0
48.5
28.5
22.0
24.5
21.0
12.5
11.0
74.5
79.0
38.0
27.0
43.0
31.0
22.5
21.0
18.5
10.5
Riding around
Go shopping
Visit parks/theme
parks/game centers
Play sports
Go to café/restaurants
Visit cinema
Go swimming
Take photograph
Karaoke
Join clubs, voluntary
activities
43.0
35.0
41.5
35.0
26.5
37.0
22.0
11.0
11.0
7.0
62.5
48.5
36.0
39.0
24.0
12.5
14.0
13.0
10.0
7.5
Go shopping
Go to café/restaurants
Visit parks/theme
parks/game centers
Visit cinema
Take photograph
Play sports
Riding around
Go swimming
Karaoke
Join clubs, voluntary
activities
Indonesia (n=400)Vietnam (n=400) Thailand (n=400)
* Top 10 leisure outdoor activities
Unit: %
Male Female
©2016 W&S GROUP53
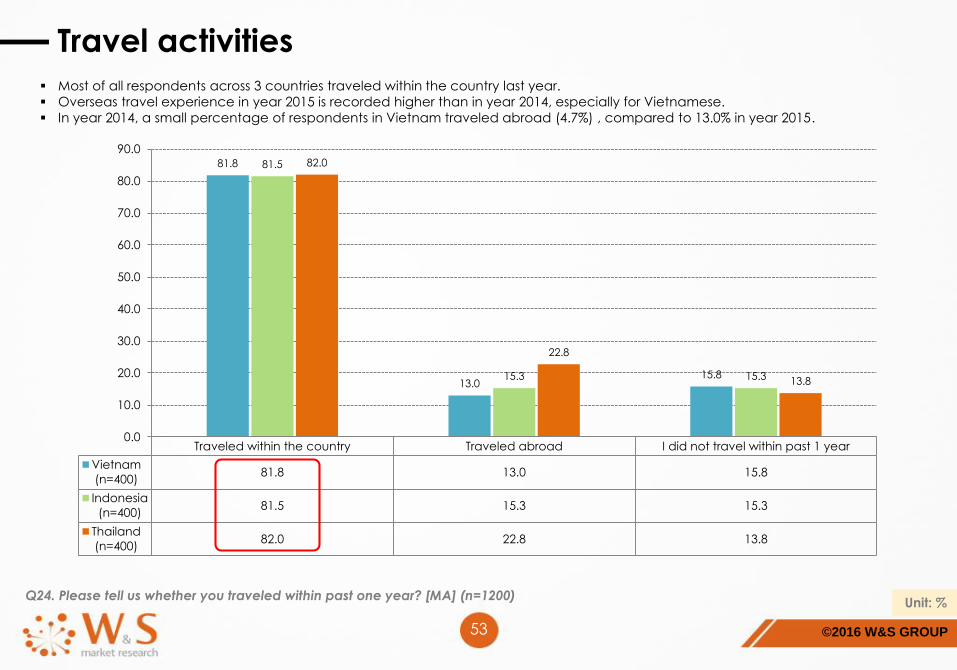
Travel activities
Most of all respondents across 3 countries traveled within the country last year.
Overseas travel experience in year 2015 is recorded higher than in year 2014, especially for Vietnamese.
In year 2014, a small percentage of respondents in Vietnam traveled abroad (4.7%) , compared to 13.0% in year 2015.
Q24. Please tell us whether you traveled within past one year? [MA] (n=1200)
Traveled within the country Traveled abroad I did not travel within past 1 year
Vietnam
(n=400)81.8 13.0 15.8
Indonesia
(n=400)81.5 15.3 15.3
Thailand
(n=400)82.0 22.8 13.8
81.8
13.015.8
81.5
15.3 15.3
82.0
22.8
13.8
0.0
10.0
20.0
30.0
40.0
50.0
60.0
70.0
80.0
90.0
Unit: %
©2016 W&S GROUP54
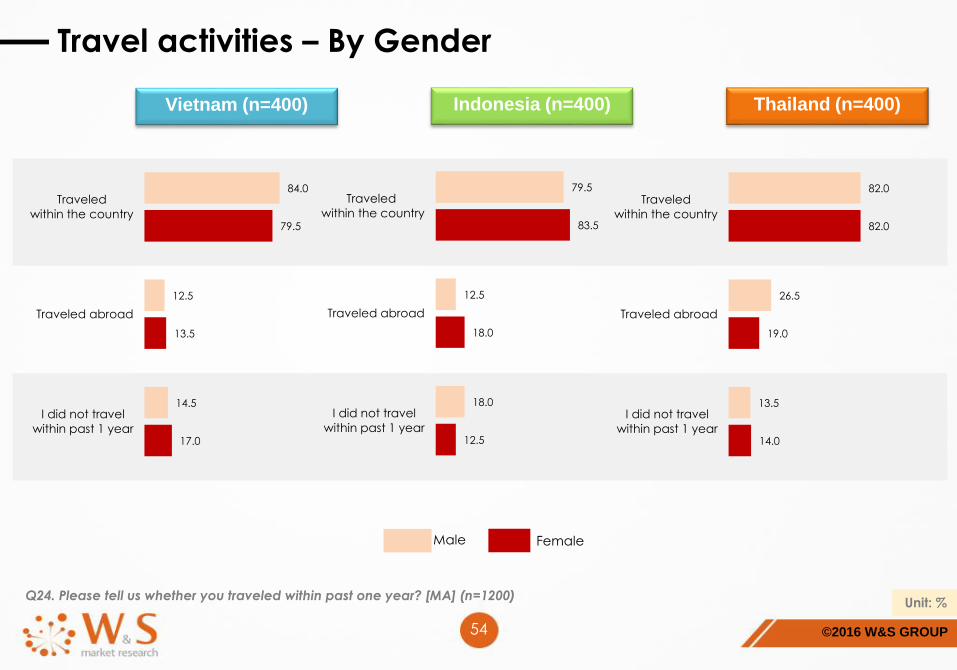
Travel activities – By Gender
Q24. Please tell us whether you traveled within past one year? [MA] (n=1200)
84.0
12.5
14.5
79.5
13.5
17.0
Traveled
within the country
Traveled abroad
I did not travel
within past 1 year
79.5
12.5
18.0
83.5
18.0
12.5
Traveled
within the country
Traveled abroad
I did not travel
within past 1 year
82.0
26.5
13.5
82.0
19.0
14.0
Traveled
within the country
Traveled abroad
I did not travel
within past 1 year
Indonesia (n=400)Vietnam (n=400) Thailand (n=400)
Unit: %
Male Female

©2016 W&S GROUP55
E. Conclusions (1)
Part I: General Attitude about Life
Attributes Vietnam Indonesia Thailand
Life change compared to 2014 Harder (29.5%)
Improved (62.3%)
Harder (25.0%)
Improved (64.5%)
Harder (31.8%)
Improved (53.8%)
Satisfaction toward current life Dissatisfied (25.5%)
Satisfied (40.5%)
Dissatisfied (17.3%)
Satisfied (62.3%)
Dissatisfied (31.0%)
Satisfied (45.8%)
Satisfaction toward
aspects of current life –
B2B (Somewhat satisfied
and Totally satisfied)
Standard of living (42.0%) (54.3%) (17.8%)
Current job / study (39.0%) (53.3%) (41.5%)
Family life (63.3%) (67.8%) (52.0%)
Social life (44.0%) (56.8%) (38.8%)
Health (43.0%) (64.3%) (44.8%)
Neighborhood safety (48.8%) (55.8%) (57.0%)
Religious life (39.0%) (71.3%) (55.0%)
Education (51.3%) (56.8%) (48.0%)
Household goods (32.5%) (52.0%) (54.3%)
Income (31.3%) (55.8%) (28.0%)
©2016 W&S GROUP56
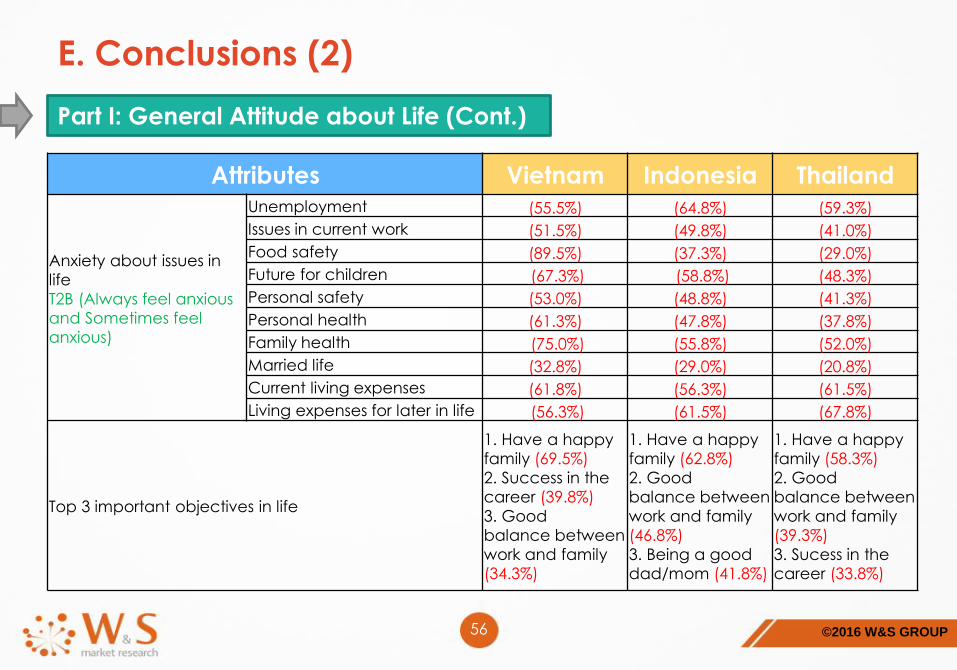
E. Conclusions (2)
Part I: General Attitude about Life (Cont.)
Attributes Vietnam Indonesia Thailand
Anxiety about issues in
life
T2B (Always feel anxious
and Sometimes feel
anxious)
Unemployment (55.5%) (64.8%) (59.3%)
Issues in current work (51.5%) (49.8%) (41.0%)
Food safety (89.5%) (37.3%) (29.0%)
Future for children (67.3%) (58.8%) (48.3%)
Personal safety (53.0%) (48.8%) (41.3%)
Personal health (61.3%) (47.8%) (37.8%)
Family health (75.0%) (55.8%) (52.0%)
Married life (32.8%) (29.0%) (20.8%)
Current living expenses (61.8%) (56.3%) (61.5%)
Living expenses for later in life (56.3%) (61.5%) (67.8%)
Top 3 important objectives in life
1. Have a happy
family (69.5%)
2. Success in the
career (39.8%)
3. Good
balance between
work and family
(34.3%)
1. Have a happy
family (62.8%)
2. Good
balance between
work and family
(46.8%)
3. Being a good
dad/mom (41.8%)
1. Have a happy
family (58.3%)
2. Good
balance between
work and family
(39.3%)
3. Sucess in the
career (33.8%)

©2016 W&S GROUP57
E. Conclusions (3)
Part II: Occupation
Attributes Vietnam Indonesia Thailand
Change job within past one
yearI did not change the job
(78.0%)
I did not change the job
(73.0%)
I did not change the job
(75.5%)
Satisfaction toward current job Dissatisfied (22.5%)
Satisfied (40.3%)
Dissatisfied (17.0%)
Satisfied (52.0%)
Dissatisfied (24.8%)
Satisfied (45.8%)
Top 3 Ideal job
1. Comfortable,
cheerful colleagues
(62.8%)
2. Stable income job
(61.5%)
3. High income job
(58.8%)
1. Comfortable,
cheerful colleagues
(64.5%)
2. Stable income job
(57.3%)
3. Be able to use
personal expertise/skills
(55.5%)
1. Stable income job
(55.5%)
2. Comfortable, cheerful
colleagues (50.8%)
3. High income job
(49.5%)
©2016 W&S GROUP58
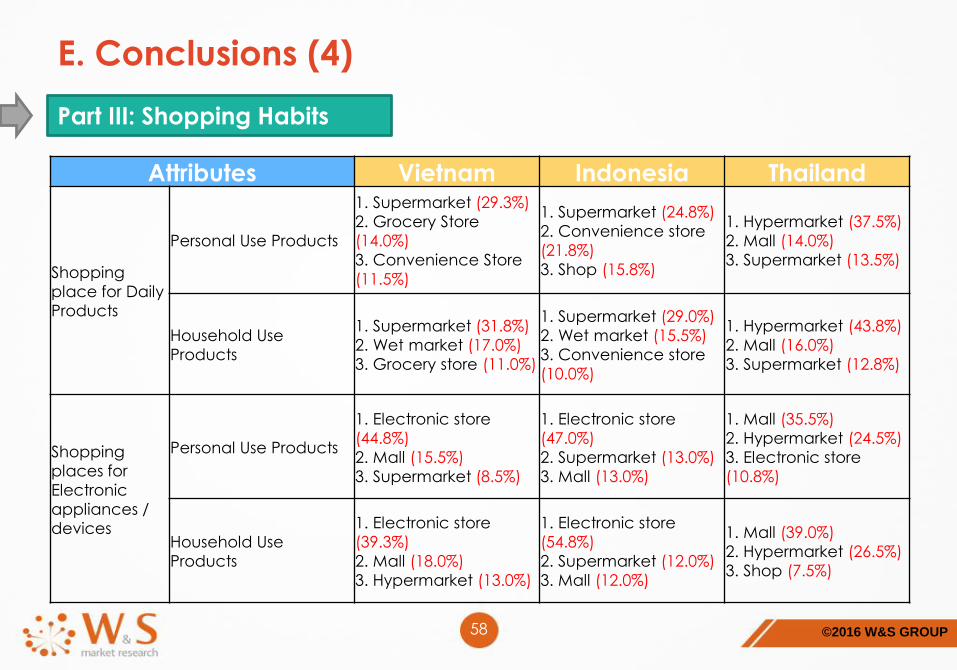
E. Conclusions (4)
Part III: Shopping Habits
Attributes Vietnam Indonesia Thailand
Shopping
place for Daily
Products
Personal Use Products
1. Supermarket (29.3%)
2. Grocery Store
(14.0%)
3. Convenience Store
(11.5%)
1. Supermarket (24.8%)
2. Convenience store
(21.8%)
3. Shop (15.8%)
1. Hypermarket (37.5%)
2. Mall (14.0%)
3. Supermarket (13.5%)
Household Use
Products
1. Supermarket (31.8%)
2. Wet market (17.0%)
3. Grocery store (11.0%)
1. Supermarket (29.0%)
2. Wet market (15.5%)
3. Convenience store
(10.0%)
1. Hypermarket (43.8%)
2. Mall (16.0%)
3. Supermarket (12.8%)
Shopping
places for
Electronic
appliances /
devices
Personal Use Products
1. Electronic store
(44.8%)
2. Mall (15.5%)
3. Supermarket (8.5%)
1. Electronic store
(47.0%)
2. Supermarket (13.0%)
3. Mall (13.0%)
1. Mall (35.5%)
2. Hypermarket (24.5%)
3. Electronic store
(10.8%)
Household Use
Products
1. Electronic store
(39.3%)
2. Mall (18.0%)
3. Hypermarket (13.0%)
1. Electronic store
(54.8%)
2. Supermarket (12.0%)
3. Mall (12.0%)
1. Mall (39.0%)
2. Hypermarket (26.5%)
3. Shop (7.5%)

©2016 W&S GROUP59
E. Conclusions (5)
Part III: Shopping Habits (Cont.)
Attributes Vietnam Indonesia Thailand
Online purchasing products
1. Clothing (55.3%)
2. Shoes & Footwear
(37.5%)
3. Books, CD & Culture
Products (29.3%)
1. Clothing (52.3%)
2. Bags & Accessories
(38.8%)
3. Beauty & Health
(33.0%)
1. Beauty & Health
(40.5%)
2. Clothing (39.0%)
3. Mobiles & Tablets
(30.0%)
Payment
method
For Regular Shopping1. Cash (88.3%)
2. Credit card (3.8)
3. Debit card (2.3)
1. Cash (62.0%)
2. Debit card (15.5%)
3. Credit card (9.5%)
1. Cash (74.3%)
2. Credit card (19.0%)
3. Online banking
(3.3%)
For Online Shopping
1. Cash on Delivery
(35.3%)
2. ATM/Bank transfer
(26.5%)
3. Online banking
(11.0%)
1. ATM/Bank transfer
(53.0%)
2. Online banking
(17.0%)
3. Cash on Delivery
(9.5%)
1. ATM/Bank transfer
(33.0%)
2. Online banking
(20.8%)
3. Credit card (16.5%)
©2016 W&S GROUP60
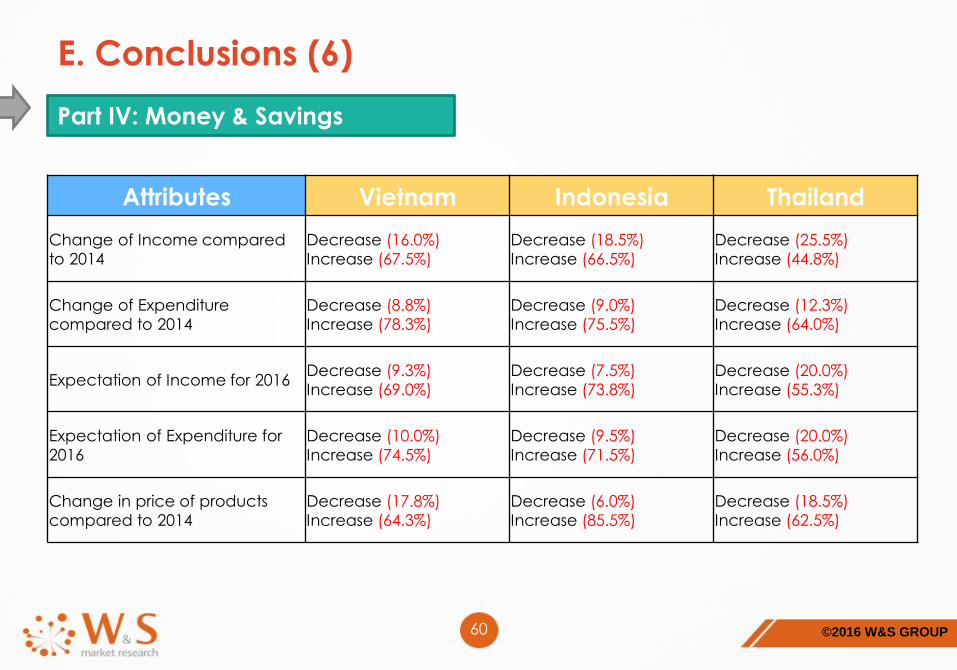
E. Conclusions (6)
Part IV: Money & Savings
Attributes Vietnam Indonesia Thailand
Change of Income compared
to 2014
Decrease (16.0%)
Increase (67.5%)
Decrease (18.5%)
Increase (66.5%)
Decrease (25.5%)
Increase (44.8%)
Change of Expenditure
compared to 2014
Decrease (8.8%)
Increase (78.3%)
Decrease (9.0%)
Increase (75.5%)
Decrease (12.3%)
Increase (64.0%)
Expectation of Income for 2016Decrease (9.3%)
Increase (69.0%)
Decrease (7.5%)
Increase (73.8%)
Decrease (20.0%)
Increase (55.3%)
Expectation of Expenditure for
2016
Decrease (10.0%)
Increase (74.5%)
Decrease (9.5%)
Increase (71.5%)
Decrease (20.0%)
Increase (56.0%)
Change in price of products
compared to 2014
Decrease (17.8%)
Increase (64.3%)
Decrease (6.0%)
Increase (85.5%)
Decrease (18.5%)
Increase (62.5%)

©2016 W&S GROUP61
E. Conclusions (7)
Part IV: Money & Savings (Cont.)
Attributes Vietnam Indonesia Thailand
Change in
expenditure
items
compared to
2014 (Goods)
Motor vehicles and
parts
Enhance spending
(56.0%)
Keep spending
constant (53.8%)
Keep spending
constant (44.5%)
Furnishings and durable
household equipment
Keep spending
constant (38.0%)
Keep spending
constant (60.3%)
Keep spending
constant (49.3%)
Recreational goods
and vehicles
Cut back spending
(44.0%)
Keep spending
constant (46.3%)
Keep spending
constant (41.8%)
Food and beverages
purchased for off-
premises consumption
Cut back spending
(41.5%)
Keep spending
constant (52.5%)
Enhance spending
(53.8%)
Clothing and footwearKeep spending
constant (55.8%)
Keep spending
constant (52.3%)
Keep spending
constant (43.3%)
GasolineKeep spending
constant (53.8%)
Keep spending
constant (51.8%)
Cut back spending
(44.0%)
Other energy goodsKeep spending
constant (45.5%)
Keep spending
constant (59.5%)
Keep spending
constant (52.8%)
©2016 W&S GROUP62
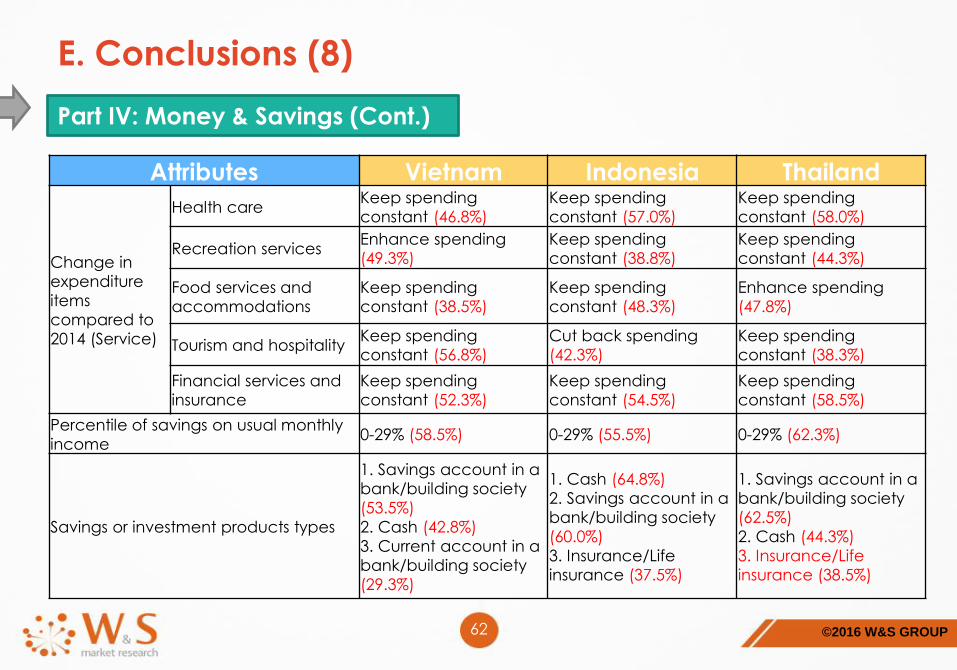
E. Conclusions (8)
Part IV: Money & Savings (Cont.)
Attributes Vietnam Indonesia Thailand
Change in
expenditure
items
compared to
2014 (Service)
Health careKeep spending
constant (46.8%)
Keep spending
constant (57.0%)
Keep spending
constant (58.0%)
Recreation servicesEnhance spending
(49.3%)
Keep spending
constant (38.8%)
Keep spending
constant (44.3%)
Food services and
accommodations
Keep spending
constant (38.5%)
Keep spending
constant (48.3%)
Enhance spending
(47.8%)
Tourism and hospitalityKeep spending
constant (56.8%)
Cut back spending
(42.3%)
Keep spending
constant (38.3%)
Financial services and
insurance
Keep spending
constant (52.3%)
Keep spending
constant (54.5%)
Keep spending
constant (58.5%)
Percentile of savings on usual monthly
income0-29% (58.5%) 0-29% (55.5%) 0-29% (62.3%)
Savings or investment products types
1. Savings account in a
bank/building society
(53.5%)
2. Cash (42.8%)
3. Current account in a
bank/building society
(29.3%)
1. Cash (64.8%)
2. Savings account in a
bank/building society
(60.0%)
3. Insurance/Life
insurance (37.5%)
1. Savings account in a
bank/building society
(62.5%)
2. Cash (44.3%)
3. Insurance/Life
insurance (38.5%)

©2016 W&S GROUP63
E. Conclusions (9)
Part V: Leisure & Recreation
Attributes Vietnam Indonesia Thailand
Leisure activities at home
1. Surfing webs for news
(75.5%)
2. Sleeping / Relaxing
(65.3%)
3. Watching TV (62.5%)
1. Sleeping / Relaxing
(73.3%)
2. Watching TV (73.0%)
3. Surfing webs for news
(58.8%)
1. Sleeping / Relaxing
(57.5%)
2. Watching TV (56.5%)
3. Listening to music
(47.0%)
Leisure outdoor activities1. Go to café/restaurants
(69.8%)
2. Go shopping (56.8%)
3. Riding around (53.0%)
1. Riding around (72.5%)
2. Go shopping (68.5%)
3. Visit parks/theme
parks/game centers
(43.0%)
1. Go shopping (52.8%)
2. Go to café/restaurants
(41.8%)
3. Visit parks/theme
parks/game centers
(38.8%)
Travel activitiesTraveled within the
country (81.8%)
Traveled within the
country (81.5%)
Traveled within the
country (82.0%)
FOR FURTHER INQUIRIES, PLEASE CONTACT:
5F Honey Gotanda Dai2-bdg Gotanda 1-4-1 Higashi-Gotanda Shinagawa-ku
Tokyo city, Japan
Tel: +81 (0) 3-5421-7925
URL : http://wsgroup-asia.com/
Email : [email protected]
The copyright of this report belongs to World Wide System Corporation
*** Our report is officially free for those who are interested, and open for using this report as references.
For any usages regarding to our results, please refer W&S as your sources of information.
Top Related