


Languages
Pages
Legal


55 S. Lake Havasu Ave. Lake Havasu City, Arizona 86403
Retail space for lease
50 S. Lake Havasu Ave. For More Information
Call 208-841-3045 or visit http://property.loopnet.com/15622152
Available Space: Unit K: Approx. 1228 s.f. Sunset Plaza Pricing @ $1.25 /s.f./month
Demographics: Daytime Population 57,698 (5mi) Avg. HH Income $57,710 (5mi)
Key Tenants: Starbucks, AT&T, H&R Block, Credit Union, Sprint, UPS, Verizon, Crown Jewels, PurTone, Chipotle
1/20/14 This information was obtained from sources believed reliable, but cannot be guaranteed.
55 S. Lake
Havasu
London Brid
ge Rd.

55 S. Lake Havasu Ave.
Lake Havasu City, Arizona 86403
Retail space for lease
55 S. Lake Havasu Ave.
For More Information
Call 208-841-3045
or visit http://property.loopnet.com/15622152
Property Information:
Available Space: 1228 SF
Lease Terms:
Lease Type: NNN
Location:
Lake Havasu Ave / I95 / Swanson
Near London Bridge, Safeway,
Walgreens, Autozone & Big Five
1/20/14 This information was obtained from sources believed reliable, but cannot be guaranteed.
Phenomenal Location!

55 S. Lake Havasu Ave.
Lake Havasu City, Arizona
Retail space for lease
For More InformationFor More InformationFor More InformationFor More Information
Call 208Call 208Call 208Call 208----841841841841----3045304530453045
or visitor visitor visitor visit http://property.loopnet.com/15622152
1/20/14 This information was obtained from sources believed reliable, but cannot be guaranteed.
Lake Havasu Ave.Lake Havasu Ave.Lake Havasu Ave.Lake Havasu Ave.
Swanson Ave.
AVAIL-
AVAIL-
AVAIL-
AVAIL-
Bldg. A
Bld
g. B
H & R Block
UPS
Credit Union
Pure Tone
I95
Sprint
SUNSET PLAZASUNSET PLAZASUNSET PLAZASUNSET PLAZA
Building A Size: 14,931 s.f.
Building B Size: 7759 s.f.
Unit K Approx. 1228 s.f.
Approx. 1228 s.f. available for lease
AT&T
Starbucks
AVAILABLEAVAILABLEAVAILABLEAVAILABLE KKKK
Chipotle
Leased
Verizon

55 S. Lake Havasu Ave.
Lake Havasu City, Arizona
Retail space for lease
For More InformationFor More InformationFor More InformationFor More Information
Call 208Call 208Call 208Call 208----841841841841----3045304530453045
or visitor visitor visitor visit http://property.loopnet.com/15622152
1/20/14 This information was obtained from sources believed reliable, but cannot be guaranteed.
Lake Havasu Ave.Lake Havasu Ave.Lake Havasu Ave.Lake Havasu Ave.
Swanson Ave.
AVAIL-
AVAIL-
AVAIL-
AVAIL-
Bldg. A
Bld
g. B
H & R Block
Credit Union
PurTone
I95
AT&T
Starbucks
AVAILABLEAVAILABLEAVAILABLEAVAILABLE
UNIT K - APPROX. 1228 s.f.
$1.25 / s.f. Chipotle
Verizon
Leased
UPS
Sprint

This information is deemed reliable but not guaranteed.
EQUAL HOUSING OPPORTUNITY
FOR LEASE FANTASTIC RETAIL OPPORTUNITY!
High Traffic & Visibility 55 S. Lake Havasu Ave. Lake Havasu City, Arizona 86403
Lake Havasu Ave. / Swanson / I95
2.1 Acres Site Zoning C-1
Call 208-841-3045 For More Information
Pricing at $1.25 /s.f./month Unit K Available
55 S.
Lake
Havasu

Traffic Counts & R/UDAT Map 55 S. Lake Havasu Ave. - Retail Opportunity
For More Information Call 208-841-3045 This information is deemed reliable but not guaranteed. EQUAL HOUSING OPPORTUNITY
Information Provided By the Arizona Department of Transportation http://azdot.gov Accessed 4/20/08
SECTID NAME BMP START EMP END AADT04 AADT05 AADT06
1301 SR95 182.26 SWANSON 182.48 MESQUITE 20700 23700 26100
Information Provided By Lake Havasu City, Arizona http://lhcaz.gov Accessed 4/20/08
55 S. Lake
Havasu Ave.
55 S. Lake Havasu Ave.
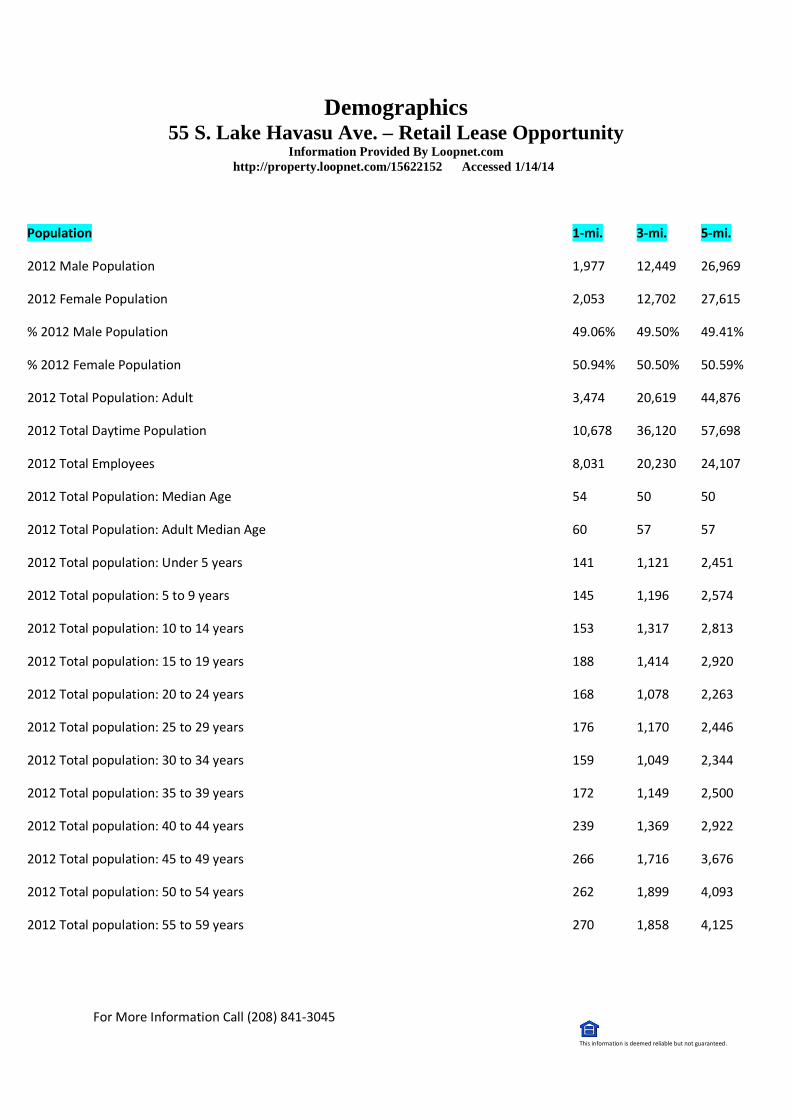
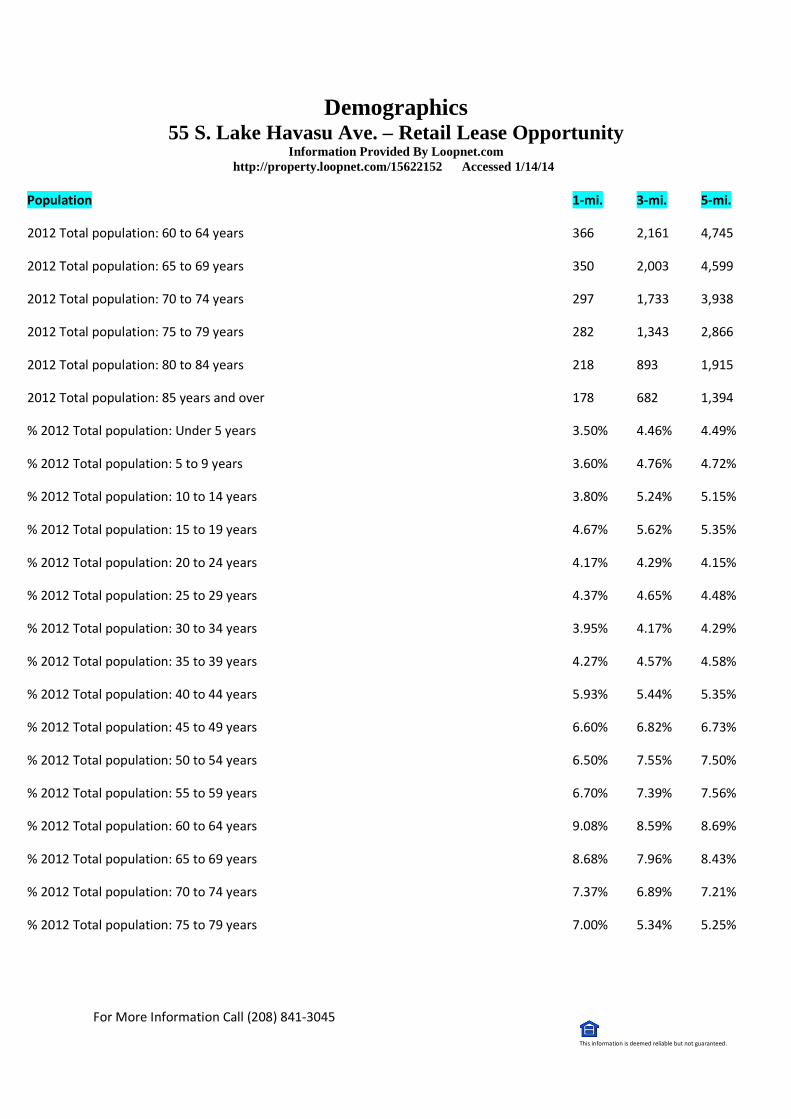
Demographics 55 S. Lake Havasu Ave. – Retail Lease Opportunity
Information Provided By Loopnet.com http://property.loopnet.com/15622152 Accessed 1/14/14
For More Information Call (208) 841-3045
This information is deemed reliable but not guaranteed.
Population 1-mi. 3-mi. 5-mi.
2012 Male Population 1,977 12,449 26,969
2012 Female Population 2,053 12,702 27,615
% 2012 Male Population 49.06% 49.50% 49.41%
% 2012 Female Population 50.94% 50.50% 50.59%
2012 Total Population: Adult 3,474 20,619 44,876
2012 Total Daytime Population 10,678 36,120 57,698
2012 Total Employees 8,031 20,230 24,107
2012 Total Population: Median Age 54 50 50
2012 Total Population: Adult Median Age 60 57 57
2012 Total population: Under 5 years 141 1,121 2,451
2012 Total population: 5 to 9 years 145 1,196 2,574
2012 Total population: 10 to 14 years 153 1,317 2,813
2012 Total population: 15 to 19 years 188 1,414 2,920
2012 Total population: 20 to 24 years 168 1,078 2,263
2012 Total population: 25 to 29 years 176 1,170 2,446
2012 Total population: 30 to 34 years 159 1,049 2,344
2012 Total population: 35 to 39 years 172 1,149 2,500
2012 Total population: 40 to 44 years 239 1,369 2,922
2012 Total population: 45 to 49 years 266 1,716 3,676
2012 Total population: 50 to 54 years 262 1,899 4,093
2012 Total population: 55 to 59 years 270 1,858 4,125
Demographics 55 S. Lake Havasu Ave. – Retail Lease Opportunity
Information Provided By Loopnet.com http://property.loopnet.com/15622152 Accessed 1/14/14
For More Information Call (208) 841-3045
This information is deemed reliable but not guaranteed.
Population 1-mi. 3-mi. 5-mi.
2012 Total population: 60 to 64 years 366 2,161 4,745
2012 Total population: 65 to 69 years 350 2,003 4,599
2012 Total population: 70 to 74 years 297 1,733 3,938
2012 Total population: 75 to 79 years 282 1,343 2,866
2012 Total population: 80 to 84 years 218 893 1,915
2012 Total population: 85 years and over 178 682 1,394
% 2012 Total population: Under 5 years 3.50% 4.46% 4.49%
% 2012 Total population: 5 to 9 years 3.60% 4.76% 4.72%
% 2012 Total population: 10 to 14 years 3.80% 5.24% 5.15%
% 2012 Total population: 15 to 19 years 4.67% 5.62% 5.35%
% 2012 Total population: 20 to 24 years 4.17% 4.29% 4.15%
% 2012 Total population: 25 to 29 years 4.37% 4.65% 4.48%
% 2012 Total population: 30 to 34 years 3.95% 4.17% 4.29%
% 2012 Total population: 35 to 39 years 4.27% 4.57% 4.58%
% 2012 Total population: 40 to 44 years 5.93% 5.44% 5.35%
% 2012 Total population: 45 to 49 years 6.60% 6.82% 6.73%
% 2012 Total population: 50 to 54 years 6.50% 7.55% 7.50%
% 2012 Total population: 55 to 59 years 6.70% 7.39% 7.56%
% 2012 Total population: 60 to 64 years 9.08% 8.59% 8.69%
% 2012 Total population: 65 to 69 years 8.68% 7.96% 8.43%
% 2012 Total population: 70 to 74 years 7.37% 6.89% 7.21%
% 2012 Total population: 75 to 79 years 7.00% 5.34% 5.25%

Demographics 55 S. Lake Havasu Ave. – Retail Lease Opportunity
Information Provided By Loopnet.com http://property.loopnet.com/15622152 Accessed 1/14/14
For More Information Call (208) 841-3045
This information is deemed reliable but not guaranteed.
Population 1-mi. 3-mi. 5-mi.
% 2012 Total population: 80 to 84 years 5.41% 3.55% 3.51%
% 2012 Total population: 85 years and over 4.42% 2.71% 2.55%
2012 White alone 3,638 22,371 49,215
2012 Black or African American alone 24 161 369
2012 American Indian and Alaska Native alone 47 254 559
2012 Asian alone 52 252 521
2012 Native Hawaiian and OPI alone 5 36 69
2012 Some Other Race alone 178 1,455 2,582
2012 Two or More Races alone 86 622 1,269
2012 Hispanic 509 3,431 6,592
2012 Not Hispanic 3,521 21,720 47,992
% 2012 White alone 90.27% 88.95% 90.16%
% 2012 Black or African American alone 0.60% 0.64% 0.68%
% 2012 American Indian and Alaska Native alone 1.17% 1.01% 1.02%
% 2012 Asian alone 1.29% 1.00% 0.95%
% 2012 Native Hawaiian and OPI alone 0.12% 0.14% 0.13%
% 2012 Some Other Race alone 4.42% 5.79% 4.73%
% 2012 Two or More Races alone 2.13% 2.47% 2.32%
% 2012 Hispanic 12.63% 13.64% 12.08%
% 2012 Not Hispanic 87.37% 86.36% 87.92%
2000 Not Hispanic: White alone 3,217 18,912 39,023
2000 Not Hispanic: Black or African American alone 14 68 134
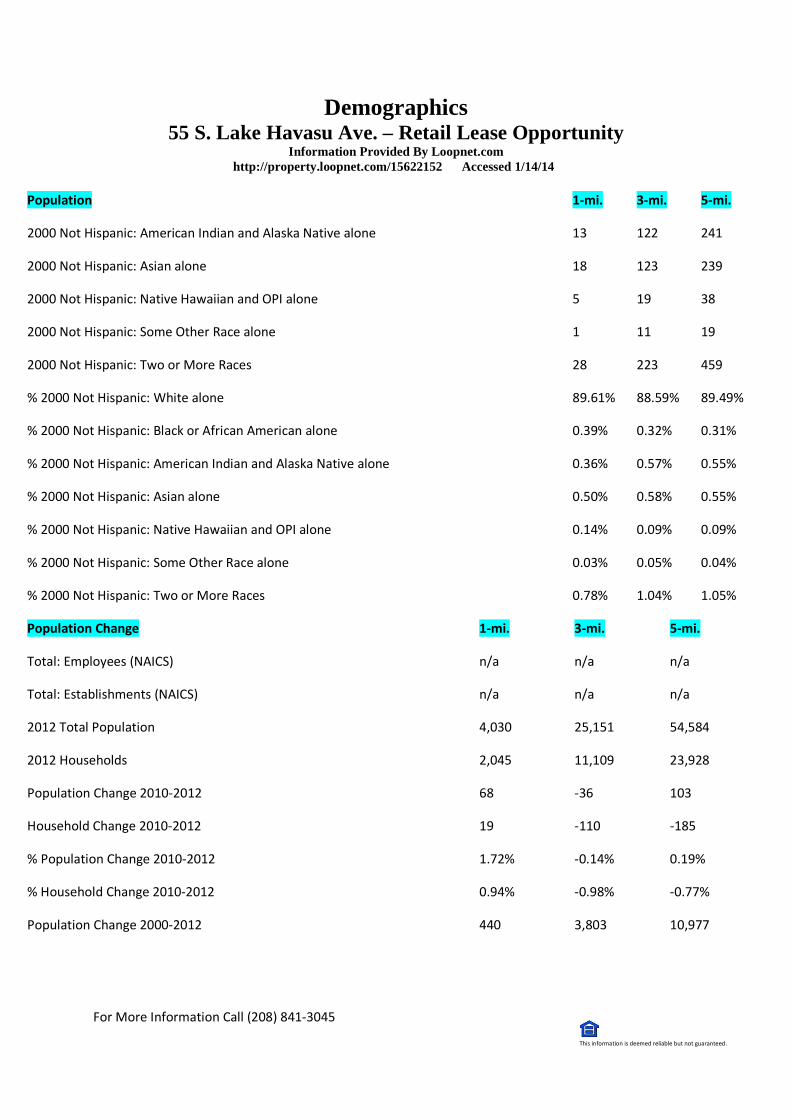
Demographics 55 S. Lake Havasu Ave. – Retail Lease Opportunity
Information Provided By Loopnet.com http://property.loopnet.com/15622152 Accessed 1/14/14
For More Information Call (208) 841-3045
This information is deemed reliable but not guaranteed.
Population 1-mi. 3-mi. 5-mi.
2000 Not Hispanic: American Indian and Alaska Native alone 13 122 241
2000 Not Hispanic: Asian alone 18 123 239
2000 Not Hispanic: Native Hawaiian and OPI alone 5 19 38
2000 Not Hispanic: Some Other Race alone 1 11 19
2000 Not Hispanic: Two or More Races 28 223 459
% 2000 Not Hispanic: White alone 89.61% 88.59% 89.49%
% 2000 Not Hispanic: Black or African American alone 0.39% 0.32% 0.31%
% 2000 Not Hispanic: American Indian and Alaska Native alone 0.36% 0.57% 0.55%
% 2000 Not Hispanic: Asian alone 0.50% 0.58% 0.55%
% 2000 Not Hispanic: Native Hawaiian and OPI alone 0.14% 0.09% 0.09%
% 2000 Not Hispanic: Some Other Race alone 0.03% 0.05% 0.04%
% 2000 Not Hispanic: Two or More Races 0.78% 1.04% 1.05%
Population Change 1-mi. 3-mi. 5-mi.
Total: Employees (NAICS) n/a n/a n/a
Total: Establishments (NAICS) n/a n/a n/a
2012 Total Population 4,030 25,151 54,584
2012 Households 2,045 11,109 23,928
Population Change 2010-2012 68 -36 103
Household Change 2010-2012 19 -110 -185
% Population Change 2010-2012 1.72% -0.14% 0.19%
% Household Change 2010-2012 0.94% -0.98% -0.77%
Population Change 2000-2012 440 3,803 10,977

Demographics 55 S. Lake Havasu Ave. – Retail Lease Opportunity
Information Provided By Loopnet.com http://property.loopnet.com/15622152 Accessed 1/14/14
For More Information Call (208) 841-3045
This information is deemed reliable but not guaranteed.
Population Change 1-mi. 3-mi. 5-mi.
Household Change 2000-2012 241 1,834 5,235
% Population Change 2000 to 2012 12.26% 17.81% 25.17%
% Household Change 2000 to 2012 13.36% 19.77% 28.01%
Housing 1-mi. 3-mi. 5-mi.
2000 Housing Units 2,697 12,447 24,123
2000 Occupied Housing Units 1,804 9,275 18,693
2000 Owner Occupied Housing Units 1,087 6,860 14,534
2000 Renter Occupied Housing Units 717 2,415 4,159
2000 Vacant Housings Units 893 3,172 5,430
% 2000 Occupied Housing Units 66.89% 74.52% 77.49%
% 2000 Owner occupied housing units 60.25% 73.96% 77.75%
% 2000 Renter occupied housing units 39.75% 26.04% 22.25%
% 2000 Vacant housing units 33.11% 25.48% 22.51%
Income 1-mi. 3-mi. 5-mi.
2012 Household Income: Median $34,533 $39,930 $42,869
2012 Household Income: Average $44,235 $53,102 $57,710
2012 Per Capita Income $22,598 $23,502 $25,400
2012 Household income: Less than $10,000 169 769 1,199
2012 Household income: $10,000 to $14,999 175 813 1,586
2012 Household income: $15,000 to $19,999 126 767 1,460
2012 Household income: $20,000 to $24,999 166 632 1,349
2012 Household income: $25,000 to $29,999 265 906 2,053

Demographics 55 S. Lake Havasu Ave. – Retail Lease Opportunity
Information Provided By Loopnet.com http://property.loopnet.com/15622152 Accessed 1/14/14
For More Information Call (208) 841-3045
This information is deemed reliable but not guaranteed.
Income 1-mi. 3-mi. 5-mi.
2012 Household income: $30,000 to $34,999 134 777 1,559
2012 Household income: $35,000 to $39,999 128 903 1,827
2012 Household income: $40,000 to $44,999 122 619 1,622
2012 Household income: $45,000 to $49,999 73 525 1,162
2012 Household income: $50,000 to $59,999 150 1,089 2,248
2012 Household income: $60,000 to $74,999 236 1,032 2,632
2012 Household income: $75,000 to $99,999 175 1,170 2,359
2012 Household income: $100,000 to $124,999 77 474 1,250
2012 Household income: $125,000 to $149,999 9 304 630
2012 Household income: $150,000 to $199,999 40 167 473
2012 Household income: $200,000 or more n/a 162 519
% 2012 Household income: Less than $10,000 8.26% 6.92% 5.01%
% 2012 Household income: $10,000 to $14,999 8.56% 7.32% 6.63%
% 2012 Household income: $15,000 to $19,999 6.16% 6.90% 6.10%
% 2012 Household income: $20,000 to $24,999 8.12% 5.69% 5.64%
% 2012 Household income: $25,000 to $29,999 12.96% 8.16% 8.58%
% 2012 Household income: $30,000 to $34,999 6.55% 6.99% 6.52%
% 2012 Household income: $35,000 to $39,999 6.26% 8.13% 7.64%
% 2012 Household income: $40,000 to $44,999 5.97% 5.57% 6.78%
% 2012 Household income: $45,000 to $49,999 3.57% 4.73% 4.86%
% 2012 Household income: $50,000 to $59,999 7.33% 9.80% 9.39%
% 2012 Household income: $60,000 to $74,999 11.54% 9.29% 11.00%

Demographics 55 S. Lake Havasu Ave. – Retail Lease Opportunity
Information Provided By Loopnet.com http://property.loopnet.com/15622152 Accessed 1/14/14
For More Information Call (208) 841-3045
This information is deemed reliable but not guaranteed.
Income 1-mi. 3-mi. 5-mi.
% 2012 Household income: $75,000 to $99,999 8.56% 10.53% 9.86%
% 2012 Household income: $100,000 to $124,999 3.77% 4.27% 5.22%
% 2012 Household income: $125,000 to $149,999 0.44% 2.74% 2.63%
% 2012 Household income: $150,000 to $199,999 1.96% 1.50% 1.98%
% 2012 Household income: $200,000 or more 0.00% 1.46% 2.17%
Retail Sales Volume 1-mi. 3-mi. 5-mi.
2012 Childrens/Infants clothing stores $557,593 $3,296,211 $6,972,893
2012 Jewelry stores $344,252 $1,578,629 $3,363,389
2012 Mens clothing stores $454,317 $2,759,739 $5,713,786
2012 Shoe stores $528,149 $3,389,738 $7,463,123
2012 Womens clothing stores $1,371,071 $6,745,520 $13,988,052
2012 Automobile dealers $7,358,131 $39,861,625 $84,240,289
2012 Automotive parts and accessories stores $1,565,690 $8,601,051 $18,690,438
2012 Other motor vehicle dealers $315,085 $2,831,249 $5,524,874
2012 Tire dealers $721,803 $3,867,027 $8,350,931
2012 Hardware stores $15,248 $69,008 $140,456
2012 Home centers $113,979 $769,651 $1,802,228
2012 Nursery and garden centers $148,464 $845,399 $2,046,254
2012 Outdoor power equipment stores $123,854 $617,222 $1,313,986
2012 Paint and wallpaper stores $13,544 $56,962 $125,071
2012 Appliance, television, and other electronics stores $954,130 $5,888,566 $12,636,246
2012 Camera and photographic supplies stores $108,958 $539,706 $1,370,890

Demographics 55 S. Lake Havasu Ave. – Retail Lease Opportunity
Information Provided By Loopnet.com http://property.loopnet.com/15622152 Accessed 1/14/14
For More Information Call (208) 841-3045
This information is deemed reliable but not guaranteed.
Retail Sales Volume 1-mi. 3-mi. 5-mi.
2012 Computer and software stores $2,544,316 $14,616,625 $31,540,681
2012 Beer, wine, and liquor stores $471,120 $2,415,085 $5,207,474
2012 Convenience stores $2,003,618 $10,829,807 $23,043,497
2012 Restaurant Expenditures $2,121,635 $11,014,184 $23,936,843
2012 Supermarkets and other grocery (except convenience) stores $7,440,774 $41,086,719 $87,822,499
2012 Furniture stores $662,794 $3,635,519 $7,746,553
2012 Home furnishings stores $1,594,712 $9,908,196 $21,160,107
2012 General merchandise stores $11,677,230 $64,613,591 $138,308,679
2012 Gasoline stations with convenience stores $6,213,825 $34,096,351 $72,973,845
2012 Other gasoline stations $4,433,079 $24,518,026 $52,608,661
2012 Department stores (excl leased depts) $9,402,611 $52,165,261 $111,116,355
2012 General merchandise stores $11,677,230 $64,613,591 $138,308,679
2012 Other health and personal care stores $671,894 $3,826,552 $8,186,589
2012 Pharmacies and drug stores $2,187,805 $11,687,169 $24,872,039
2012 Pet and pet supplies stores $646,875 $3,174,032 $6,720,213
2012 Book, periodical, and music stores $151,002 $932,134 $1,979,803
2012 Hobby, toy, and game stores $169,566 $1,027,541 $2,026,564
2012 Musical instrument and supplies stores $80,242 $291,571 $551,910
2012 Sewing, needlework, and piece goods stores $60,781 $382,511 $893,794
2012 Sporting goods stores $212,458 $1,262,813 $2,900,922
1/14/14
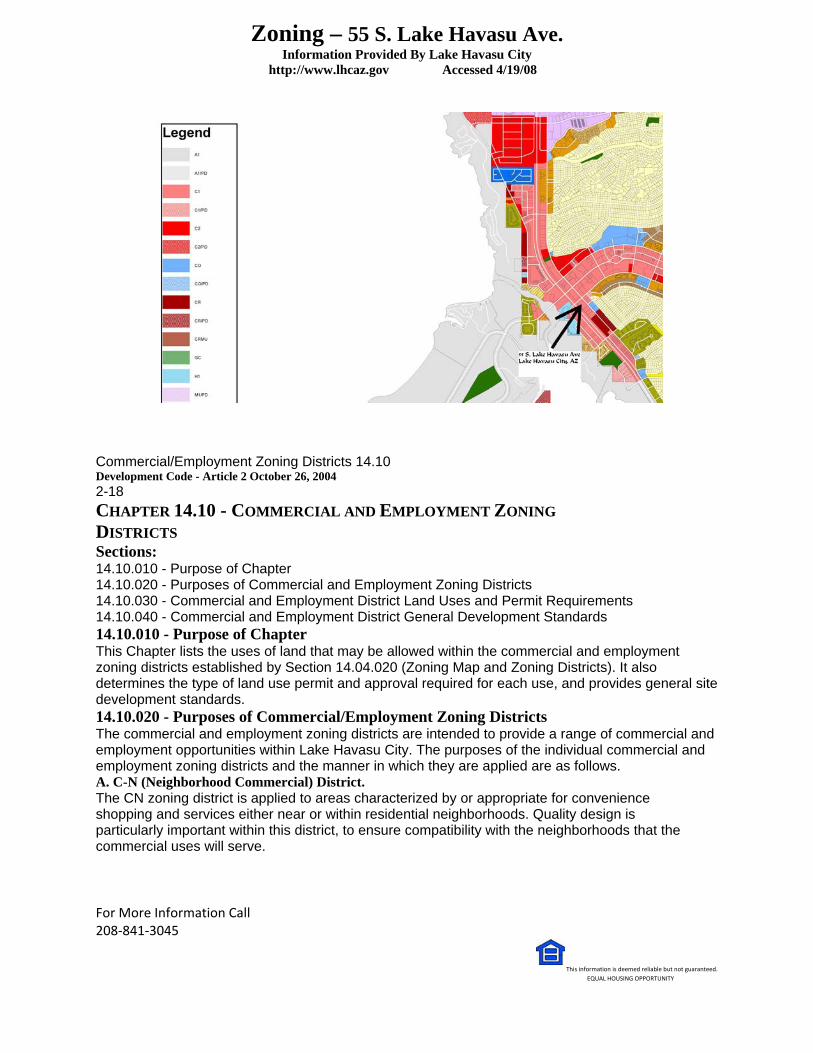
Zoning – 55 S. Lake Havasu Ave. Information Provided By Lake Havasu City
http://www.lhcaz.gov Accessed 4/19/08
For More Information Call 208‐841‐3045
This information is deemed reliable but not guaranteed. EQUAL HOUSING OPPORTUNITY
Commercial/Employment Zoning Districts 14.10 Development Code - Article 2 October 26, 2004 2-18 CHAPTER 14.10 - COMMERCIAL AND EMPLOYMENT ZONING DISTRICTS Sections: 14.10.010 - Purpose of Chapter 14.10.020 - Purposes of Commercial and Employment Zoning Districts 14.10.030 - Commercial and Employment District Land Uses and Permit Requirements 14.10.040 - Commercial and Employment District General Development Standards 14.10.010 - Purpose of Chapter This Chapter lists the uses of land that may be allowed within the commercial and employment zoning districts established by Section 14.04.020 (Zoning Map and Zoning Districts). It also determines the type of land use permit and approval required for each use, and provides general site development standards. 14.10.020 - Purposes of Commercial/Employment Zoning Districts The commercial and employment zoning districts are intended to provide a range of commercial and employment opportunities within Lake Havasu City. The purposes of the individual commercial and employment zoning districts and the manner in which they are applied are as follows. A. C-N (Neighborhood Commercial) District. The CN zoning district is applied to areas characterized by or appropriate for convenience shopping and services either near or within residential neighborhoods. Quality design is particularly important within this district, to ensure compatibility with the neighborhoods that the commercial uses will serve.

Zoning – 55 S. Lake Havasu Ave. Information Provided By Lake Havasu City
http://www.lhcaz.gov Accessed 4/19/08
For More Information Call 208‐841‐3045
This information is deemed reliable but not guaranteed. EQUAL HOUSING OPPORTUNITY
B. C-1 (Limited Commercial) District. The C-1 zoning district is applied to areas characterized by or appropriate for a limited range of commercial with adequate but controlled access to arterial streets. C. C-2 (General Commercial) District. The C-2 zoning district is applied to areas characterized by or appropriate for a wide range of commercial with adequate but controlled access to arterial streets. Table 2-4 Allowed Uses and Permit Requirements For Commercial/Employment Zoning Districts
P Permitted Use CUP Conditional Use Permit Required Use Not Allowed
Permit Required By Zone
Land Use (1) C-N C-1 C-2 C-O C-R M-I-P M-2 Specific Use Regulations
Recreation, Education, & Public Assembly Uses Adult entertainment business - - - - - CUP CUP 14.40.040 Clubs, lodges, & private meeting halls CUP P P - - - - Health/fitness facilities P P P - P P - Indoor amusement facilities P P P - P - - Libraries, museums & galleries P P P - P - - Marinas - - - - CUP - - Night clubs & bars CUP P P - P - - Outdoor recreation facilities - - - - CUP - - Recreational vehicle parks - - - - CUP CUP - 14.40.090 Schools – Specialized education & training - - P - - - - Shooting galleries - - CUP - - P P Studios – Art, dance, martial arts, music, etc. P P P - - - - Theaters & auditoriums - P P - - - - Retail Trade Accessory retail uses P P P P P - - Alcoholic beverage sales, off-site P P P - - - - Alcoholic beverage sales, on-site P P P - P - - Art, antique, collectible, and gift stores P P P P P - - Artisan shops - P P P - P - Auto parts sales - P P - - P - Auto sales and rental - - P - - P - Bakeries, retail only P P P - P - - Building material stores - - P - - CUP - Construction/heavy equipment sales & rental - - CUP - - CUP CUP Convenience stores (without motor fuel sales) P P P - P - - Convenience stores (with motor fuel sales) CUP P P - CUP - - Drive-in and drive-through sales CUP CUP CUP CUP - - - Equipment rental - - - - - CUP P Furniture, furnishings, & appliance stores P P P - - P - General retail P P P P P - - Grocery stores P P P - P - - Hardware stores P - P - - CUP - Marine Products (e.g., boats) rentals, sales & storage
- - P - - P -
Mobile home & RV sales & storage - - CUP - - CUP - Outdoor retail sales & activities - - P - - P - Personal storage facilities (both indoor & outdoor)
- - P - - P P
Plant nurseries & garden supply stores - - P - - P -

Zoning – 55 S. Lake Havasu Ave. Information Provided By Lake Havasu City
http://www.lhcaz.gov Accessed 4/19/08
For More Information Call 208‐841‐3045
This information is deemed reliable but not guaranteed. EQUAL HOUSING OPPORTUNITY
Permit Required By Zone Land Use (1) C-N C-1 C-2 C-O C-R M-I-P M-2
Specific Use Regulations
Retail Trade cont. Restaurants P P P P P P - Warehouse retail (e.g., “big box facilities) - - P - - - - Services Auto repair & maintenance - - P - - P - Automated teller machines (ATMs) P P P P P P - Banks & financial services P P P P P P P Business support services - P P P P P - Car wash - - P - - P - Child/adult day care centers CUP - - - - - - Contractor storage yards - - CUP - - P P Gas (motor fuel) stations CUP P P - P P - Hotels & motels - - - - P - - Marine products (e.g., boats) rental service & storage
- - P - CUP P P
Medical –clinics, offices & laboratories - P P - - P - Medical – extended care - - P - - - - Medical – hospitals - P P P - - - Mortuary, mausoleum - - CUP - - - - Offices P P P P P - - Personal services P P P P P P P Public utility facilities - - P - - P P Research & development (R&D) - - CUP - - P P R&D – Biotechnology, chemical, pharmaceutical
- - - - - P P
Storage – Indoor - - P - - P P Storage – Outdoor - - CUP - - P P Storage – Outdoor, accessory - - CUP - - P P Upholstering shops - - P - - P - Veterinary clinics, animal hospitals (no boarding)
P P P - - P P
Veterinary clinic, animal hospital - - CUP - - P P Transportation & Communication Uses Broadcasting studios - - P - - P P Parking facilities/vehicle storage - - P - - P - Telecommunications facilities CUP - CUP - - CUP CUP 14.40.110 Truck & freight terminals - - - - - P P
Top Related