


Languages
Pages
Legal


19591959 20042004
Commercial Airplanes
StatisticalSummary of
Commercial JetAirplane Accidents
Worldwide Operations1959 - 2004

Introduction 2Definitions 3Terms and Exclusions 5Airplane Accidents, Year 2004 List 6Departures, Flight Hours, and Jet Airplanes in Service 7Accident Summary by Type of Operation 8Accident Summary by Damage and Injury 9Accident Rates and Fatalities by Year 10Accident Rates by Years Following Introduction 11U.S.A. and Canadian Operators Accident Rates (1959 – 2004) 12U.S.A. and Canadian Operators Accident Rates (1985 – 2004) 13Accident Rates by Type of Operation 14Accident Rates by Airplane Type 15Accidents and Onboard Fatalities by Phase of Flight 16Accidents by Primary Cause 17Fatalities by CAST/ICAO Taxonomy Accident Category 18CAST/ICAO Taxonomy - Definitions 19Excluded Events/Hostile Action Events 20Hostile Actions 21Non-Hostile Events 22Notes 23-24Published by: Aviation Safety
Boeing Commercial Airplanes P.O. Box 3707 M/S 67-TCSeattle, Washington 98124-2207, U.S.A.(425) 237-1692E-mail: [email protected]/news/techissuesMay 2005
Contents
12004 STATISTICAL SUMMARY, MAY 2005

Introduction
The accident statistics presented in this document apply to worldwide commercial jet airplanes that are heavier than 60,000 pounds maximum gross weight. These statistics are presented in two distinct sections called; Statistical Accidents, which outlines hull loss, substantial damage, fatal injury and serious injury accidents; and Excluded Events, outlining hostile actions, and non-hostile events.
Not covered in this document are airplanes manufactured in the Commonwealth of Independent States (CIS) (former Soviet Union), which are excluded because of the lack of operational data. Statistics on commercial airplanes operated in military service are not covered in this document; however, when a military-owned commercial jet transport type is used for civilian commercial service, those data are contained within this document.
The following airplane types are included:
717 DC-8 A300 BAe 146 F-28 Concorde L-1011 BAC 1-11 Comet 4707, 720 DC-9 A300-600 RJ-70/-85/-100 F-70 Trident 727 DC-10 A310 CRJ-700/-900 F-100 Caravelle737 MD-11 A320/319/321 Mercure747 MD-80/-90 A330 CV-880/-990757 A340 VC-10767 777
Airplane flight time and departures are primarily obtained from airplane and engine manufacturer compilations. Flight operations data for non-Boeing-manufactured airplanes is augmented by the AirCraft Analytical System (ACAS) electronic database that is published by AvSoft, Limited, of Rugby, England.
Accident data are obtained, when available, from government accident reports. Otherwise, information is solicited from operators, manufacturers, various government and private information services, and press accounts. Definitions related to development of statistics in this book are primarily based on corresponding International Civil Aviation Organization (ICAO) terms as explained in the next section. Some variations to the ICAO definitions are applied to facilitate the purposes of this document.
22004 STATISTICAL SUMMARY, MAY 2005

Definitions
Events in this publication are classified according to the following definitions. These definitions are consistent with those of the National Transportation Safety Board (NTSB) and the International Civil Aviation Organization (ICAO).
Airplane accident: An occurrence associated with the operation of an airplane that takes place between the time any person boards the airplane with the intention of flight and such time as all such persons have disembarked, in which:
• Airplane sustains substantial damage.• Death or serious injury results from:
– Being in or upon the airplane.– Direct contact with the airplane or anything attached thereto.– Direct exposure to jet blast.
Hull loss: Airplane damage that is substantial and is beyond economic repair. Hull loss also includes events in which:• Airplane is missing.• Search for the wreckage has been terminated without it being located.• Airplane is substantially damaged and inaccessible.
Substantial damage: Damage or structural failure that adversely affects the structural strength, performance, or flight characteristics of the airplane and would normally require major repair or replacement of the affected component. Substantial damage is not considered to be:
• Engine failure or damage limited to an engine if only one engine fails or is damaged.• Bent aerodynamic fairings.• Dents in the skin.• Damage to landing gear.• Damage to wheels.• Damage to tires.• Damage to flaps.
Fatal accident: An accident that results in fatal injury.
Fatal injury: An injury that results in death within 30 days as a result of the accident.
32004 STATISTICAL SUMMARY, MAY 2005
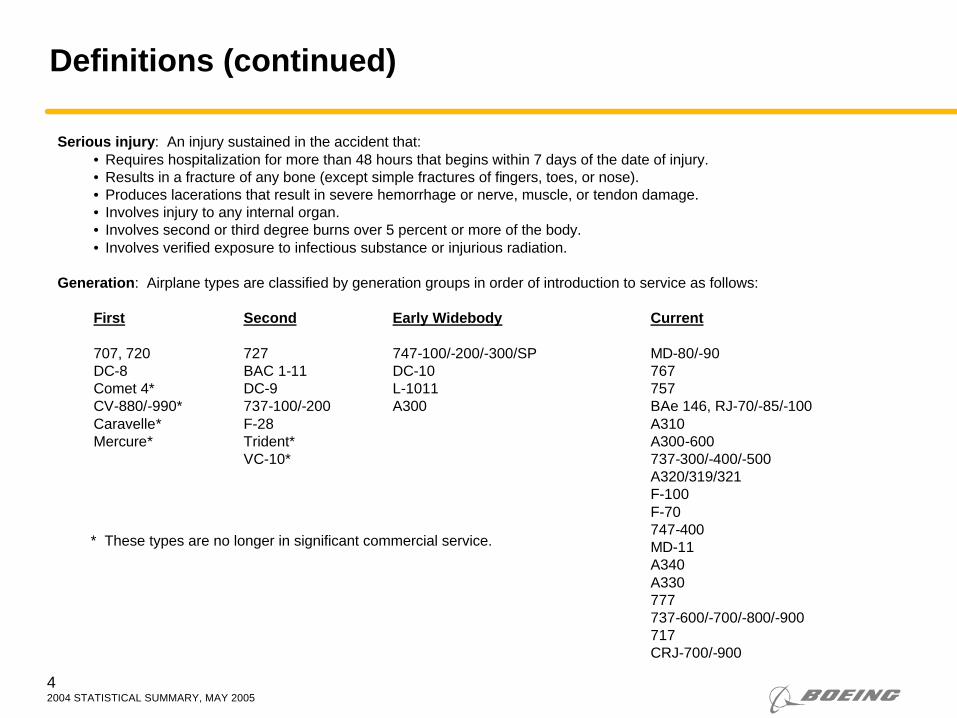
Definitions (continued)
Serious injury: An injury sustained in the accident that:• Requires hospitalization for more than 48 hours that begins within 7 days of the date of injury.• Results in a fracture of any bone (except simple fractures of fingers, toes, or nose).• Produces lacerations that result in severe hemorrhage or nerve, muscle, or tendon damage.• Involves injury to any internal organ.• Involves second or third degree burns over 5 percent or more of the body.• Involves verified exposure to infectious substance or injurious radiation.
Generation: Airplane types are classified by generation groups in order of introduction to service as follows:
First Second Early Widebody Current
707, 720 727 747-100/-200/-300/SP MD-80/-90DC-8 BAC 1-11 DC-10 767Comet 4* DC-9 L-1011 757CV-880/-990* 737-100/-200 A300 BAe 146, RJ-70/-85/-100Caravelle* F-28 A310Mercure* Trident* A300-600
VC-10* 737-300/-400/-500A320/319/321F-100F-70747-400MD-11A340A330777737-600/-700/-800/-900717CRJ-700/-900
* These types are no longer in significant commercial service.
42004 STATISTICAL SUMMARY, MAY 2005

Terms and Exclusions
Excluded events:
• Fatal and nonfatal injuries from natural causes.
• Fatal and nonfatal self-inflicted injuries.
• Fatal and nonfatal injuries of stowaways hiding outside the areas normally available to the passengers and crew.
• Experimental test flight accidents. (Maintenance test flights, ferry, positioning, training and demonstration flights are included).
• Nonfatal injuries resulting from atmospheric turbulence, maneuvering, loose objects, boarding, disembarking, evacuation, and maintenance and servicing.
• Nonfatal injuries to persons not onboard the airplane.
Regional identification: Events are identified by the operator’s national domicile and not by event location.
Airplane collisions: Events involving two or more airplanes are counted as separate events, one for each airplane. For example, destruction of two airplanes in a collision is considered two separate hull loss accidents.
Accident rates: In general, this expression is a measure of accidents per million departures. Departures (or flight cycles) are used as the basis for computing rates, since there is a stronger statistical correlation between accidents and departures than there is between accidents and flight hours, or between accidents and the number of airplanes in service, or between accidents and passenger miles. Airplane departures data are continually updated and revised as new information and estimating processes become available. These form the baseline for the measure of accident rates and, as a consequence, rates may appear to vary between editions of this publication.
52004 STATISTICAL SUMMARY, MAY 2005

XX
XX
X
X
XXXXXX
XX
14
Airplane AccidentsWorldwide Commercial Jet Fleet – 2004
62004 STATISTICAL SUMMARY, MAY 2005
01-Jan-0403-Jan-0405-Jan-0415-Jan-0419-Jan-0420-Feb-0425-Feb-0401-Mar-0402-Apr-0409-Apr-0420-Apr-0427-Apr-0428-Apr-0429-Apr-0413-Jun-0417-Jun-0406-Jul-0421-Jul-0425-Jul-0403-Aug-0409-Aug-0411-Aug-0428-Aug-0408-Oct-0414-Oct-0423-Oct-0407-Nov-0407-Nov-0428-Nov-0430-Nov-0409-Dec-0429-Dec-04
32
Japan Air SystemFlash AirlinesAustrian AirlinesIran AirAir MaltaAustral - Cielos del SurFirst AirPakistan Int'l AirlinesAir MemphisEmiratesAlitaliaAerosvitCenturion Air CargoTurkish Airlines Turkish Airlines EgyptairIberia AirlinesAero CaliforniaInter AirlinesVolare AirlinesSwissairAir GuineeTransair CargoBiman Bangladesh AirlinesMK AirlinesBETAAir Atlanta IcelandicAirAsiaKLM - Royal Dutch AirlinesLion AirASTARChanchangi Airlinestotal
MD-81737- 300F-70747- SPA320- 210MD-81737- 200CA300- B4707- 300A340- 313XMD-82 737- 500DC-10- 30F737- 800A321- 210A300- B4-200FA319- 110DC-9- 14F-100 A320- 210RJ100 737- 200Caravelle- 11RF-28747- 200707- 300747- 200F737- 300737- 400MD-82727- 200727- 200
Tokunoshima, Japan Sharm El-Sheikh, Egypt Munich, Germany Beijing, China Malta, Malta Buenos Aires, Argentina Edmonton, Canada Jeddah, Saudi Arabia Cairo, Egypt Johannesburg, South Africa Trieste, Italy Moscow, Russia Bogota, Colombia Gaziantep, Turkey Istanbul, Turkey Khartoum, Sudan San Pedro Sula, Honduras Mexico City, Mexico Istanbul, Turkey Valencia, Spain Frankfurt, Germany Free Town, Sierra Leone Gisenya, Rwanda Sylhet, Bangladesh Halifax, Canada Manaus, Brazil Sharjah, United Arab Emirates Kota Kinabalu, Malaysia Barcelona, Spain Solo City, Indonesia Atlanta, USA Lagos, Nigeria
0148
000000000000000000000070000
2500
180
LandingClimbLandingLandingTaxiTakeoffLandingTakeoffTakeoffTakeoffTaxiTakeoffLandingLandingLandingLandingLandingTakeoffLandingInitial ClimbCruiseTakeoffLandingLandingTakeoffTaxiTakeoffLandingLandingLandingTaxiLanding
MLG collapsedAirplane crashed after takeoffEmergency landing in fieldNose gear collapsedCollision with light poleMLG wheels departed, divertedOffside landingNLG tire failureRMLG collapsedTakeoff overrun/go-aroundCollision with dump truckRunway excursion - NLG collapsedLanding overrunRunway excursionHard landing - tail strikeHard landing runway overrunVeered off runwaySettled after takeoffMLG collapseSevere hail damage during climbDual engine damageRTO – runway overrunLanding overrun - post crash fireLanding overrunCrashed after takeoffRMLG collapsedRTO - runway overrunRunway excursionRunway excursionCrashed during landingMLG collapsed after landingNose gear up landing
Date Airline Airplane Type Accident Location Hull Fatalities Phase DescriptionLoss
70 72 74 76 78 80 82 84 86 88 90 92 94 96 98 00 02 2004
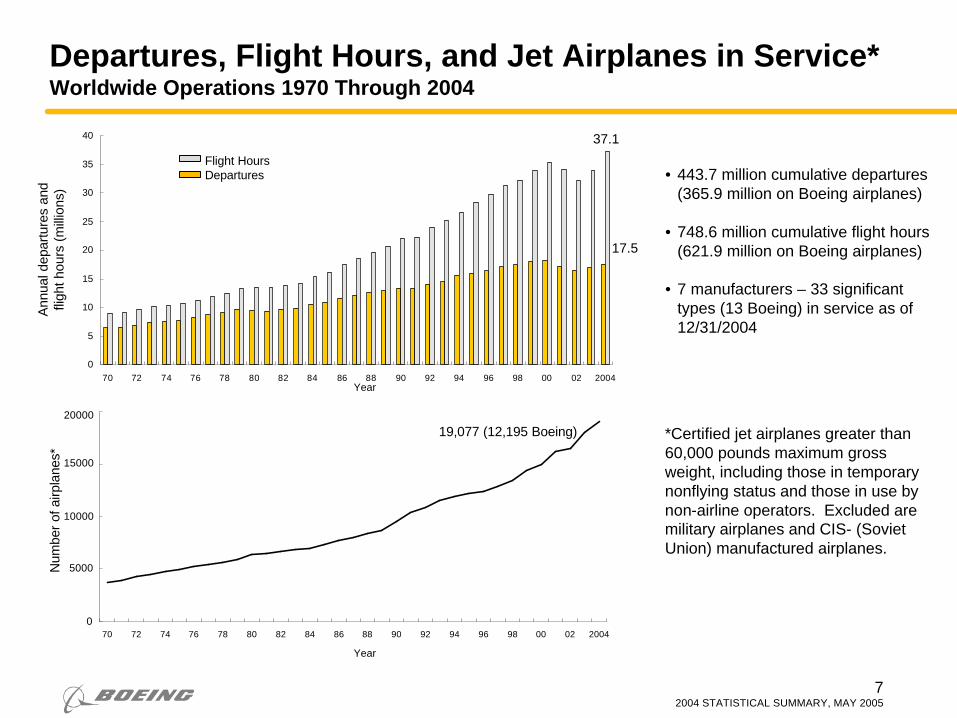
• 443.7 million cumulative departures (365.9 million on Boeing airplanes)
• 748.6 million cumulative flight hours (621.9 million on Boeing airplanes)
• 7 manufacturers – 33 significant types (13 Boeing) in service as of 12/31/2004
*Certified jet airplanes greater than 60,000 pounds maximum gross weight, including those in temporary nonflying status and those in use by non-airline operators. Excluded are military airplanes and CIS- (Soviet Union) manufactured airplanes.
Departures, Flight Hours, and Jet Airplanes in Service*Worldwide Operations 1970 Through 2004
Num
ber
of a
irpla
nes*
Ann
ual d
epar
ture
s an
dfli
ght h
ours
(m
illio
ns)
0
5
10
15
20
25
30
35
40
70 72 74 76 78 80 82 84 86 88 90 92 94 96 98 00 02 2004
19,077 (12,195 Boeing)
17.5
37.1
72004 STATISTICAL SUMMARY, MAY 2005
20000
0
Year
Year
Flight HoursDepartures
15000
10000
5000
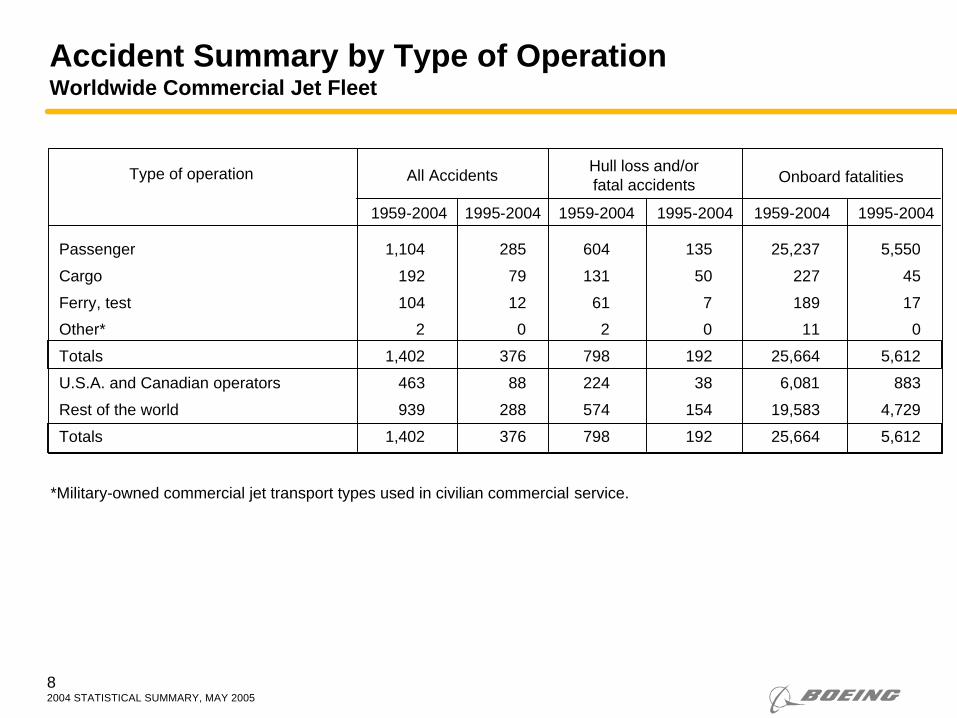
Passenger 1,104 285 604 135 25,237 5,550
Cargo 192 79 131 50 227 45
Ferry, test 104 12 61 7 189 17
Other* 2 0 2 0 11 0
Totals 1,402 376 798 192 25,664 5,612
U.S.A. and Canadian operators 463 88 224 38 6,081 883
Rest of the world 939 288 574 154 19,583 4,729
Totals 1,402 376 798 192 25,664 5,612
1959-2004 1995-2004 1959-2004 1995-2004 1959-2004 1995-2004
Accident Summary by Type of OperationWorldwide Commercial Jet Fleet
Type of operation All Accidents Hull loss and/orfatal accidents Onboard fatalities
82004 STATISTICAL SUMMARY, MAY 2005
*Military-owned commercial jet transport types used in civilian commercial service.

100 injury accidents with less than substantial damage
719 hull loss accidents583 substantial damage accidents
Excludes:• Fatal injuries from natural causes or suicide• Experimental test flights• Military airplanes• Sabotage, hijacking, terrorism, or military action• Non-fatal injuries involving:
• Atmospheric turbulence, maneuvering, or loose objects• Boarding, disembarking, or evacuation• Maintenance or servicing• Persons not onboard the airplane
Accident Summary by Damage and InjuryAll Accidents – Worldwide Commercial Jet Fleet –1959 through 2004
1,402 accidents worldwide
100(60fatal)
719(438 fatalaccidents)
583(19 fatal
accidents)
92004 STATISTICAL SUMMARY, MAY 2005

0
10
20
30
40
50
1959 62 64 66 68 70 72 74 76 78 80 82 84 86 88 90 92 94 96 98 00 02 04
Year
0
200
400
600
800
1000
1200
1400
Hull loss and/orfatal accidents
All accidents
Onboard Fatalities
Accident Rates and Fatalities by YearWorldwide Commercial Jet Fleet – 1959 through 2004
Fatalities
Accidentrate
(accidents per
milliondepartures)
102004 STATISTICAL SUMMARY, MAY 2005

0
10
20
30
40
50
60
0 2 4 6 8 10 12 14 16 18 20 22 24 26 28 30 32 34 36 38 40 42 44 46
Years since introduction
First generation
Second generation
Early Widebody
Current Generation
Accident Rates by Years Following IntroductionHull Loss and/or Fatal Accidents – Worldwide Commercial Jet Fleet – 1959 through 2004
Accidentrate
(accidents per
milliondepartures)
112004 STATISTICAL SUMMARY, MAY 2005

0
5
10
15
20
25
30
35
40
45
50
1959 62 64 66 68 70 72 74 76 78 80 82 84 86 88 90 92 94 96 98 00 02 2004
Year
U.S.A. & Canadian operators
Rest of the World
U.S.A. and Canadian Operators Accident RatesHull Loss and/or Fatal accidents – Worldwide Commercial Jet Fleet – 1959 through 2004
Accidentrate
(accidents per
milliondepartures)
122004 STATISTICAL SUMMARY, MAY 2005

0.0
0.5
1.0
1.5
2.0
2.5
3.0
3.5
4.0
1985 86 88 90 92 94 96 98 00 02 2004
Rest of the World
U.S.A. & Canadian operators
U.S.A and Canadian Operators Accident RatesHull Loss and/or Fatal accidents – Worldwide Commercial Jet Fleet – 1985 through 2004
Accident rate
(accidentsper
million departures)
Year
132004 STATISTICAL SUMMARY, MAY 2005

Accident Rates by Type of OperationHull Loss and/or Fatal accidents – Worldwide Commercial Jet Fleet – 1994 through 2004
*Unscheduled passenger and charter, cargo, ferry, test, training, and demonstration.
10-yearaccident
rate (accidents per million
departures)
Scheduled passenger operations144.5 million departures
All other operations*25.5 million departures
2.55
0.88
0.0
0.5
1.0
2.0
2.5
3.0
1.5
142004 STATISTICAL SUMMARY, MAY 2005

**Not flying707/720
DC-8727
737-100/-200DC-9
BAC 1-11F-28
747-100/-200/-300/SPDC-10A300
L-1011MD-80/-90
767757
BAe146, RJ-70/85/100A310
A300-600737-300/-400/-500
A320/319/321F-100
747-400MD-11
CRJ-700/-900A340A330
777737-600/-700/-800/-900
717F-70
Accident Rates by Airplane TypeHull Loss Accidents – Worldwide Commercial Jet Fleet – 1959 through 2004
Hull loss accident Rate per million departures12 15963
851267382728123352623104
1345764
1895350000000
719Total Hull Losses
** The Comet, CV880/990, Caravelle, Concorde, Mercure, Trident and VC-10 are no longer in commercial service, and are combined in the “Not flying” bar.
* These types have accumulated fewer than 1 million departures.
14.46
1.62
0
0.0*0.00.00.00.0*
3.450.750.75
0.420.36
1.061.60
0.910.340.340.39
0.771.68
2.712.12
5.802.71
1.361.31
1.106.08
7.38
0.0*
0.0*
Hull Losses
152004 STATISTICAL SUMMARY, MAY 2005

Accidents and Onboard Fatalities by Phase of FlightHull Loss and/or Fatal Accidents – Worldwide Commercial Jet Fleet – 1995 through 2004
Hull loss and/or fatal accidents Onboard fatalities
Taxi, load,parked
Takeoff Initialclimb
Climb
Fatalities
Cruise Descent Initialapproach
Finalapproach
Landing
123
27
Hulllossand/orfatalaccidents
539
1117
1,550
543
104
13 11
Initialapproach
7%
14%
12%
Descent
2%
7%
11%
Finalapproach
6%
14%
3%
Percentage of accidents/fatalities
Takeoff
14%
10%
1%
Initialclimb
6%
15%
1%
Landing
45%
2%
1%
Taxi,load,
parked
6%
0%
Climb(flaps up)
9%
28%
14%
Cruise
5%
10%
57%
20% 51%
25% 16%
Accidents
Fatalities
Initialapproach
fix
Exposure = percentage of flight timebased on flight duration of 1.5 hours
Distribution of accidents and fatalities
0
20
40
60
80
100
0
500
1000
1500
2000
865
406
87
102
Fatalities
807
Finalapproach
fix
162004 STATISTICAL SUMMARY, MAY 2005
797

Accidents by Primary Cause*Hull Loss Accidents – Worldwide Commercial Jet Fleet – 1995 through 2004-
56%
17%
13%
6%
4%
0% 10% 20% 30% 40% 50% 60% 70% 80%
Flight Crew
Airplane
Weather
Misc./Other
Maintenance
Airport/Air Traffic Control
Total with known causes
Unknown or awaiting reports
Total
75
23
17
8
5
5
133
44
177*As determined by the investigating authority,percent of accidents with known causes.
4%
172004 STATISTICAL SUMMARY, MAY 2005

Fatalities by CAST/ICAO Taxonomy Accident Category*Fatal Accidents – Worldwide Commercial Jet Fleet – 1987 Through 2004
182004 STATISTICAL SUMMARY, MAY 2005
* See page 19 for the CAST/ICAO category definitions
Number of on board fatalities
Number of fatal accidents 226 total
36 12 10 15 63 2 39 856 33219 10 1 1
3631
2524
862
618489
204 181 165 159 152 144 129 124 11048 1 0
0
500
1000
1500
2000
2500
3000
3500
4000
CFIT LOC-I SCF-NP Fire-NI SCF-PP RE OTHER ICE M IDAIR USOS ARC UNK FUEL RI WSTRW ADRM LOC-G

CAST/ICAO Taxonomy Accident Categories - Definitions
192004 STATISTICAL SUMMARY, MAY 2005
The International Civil Aviation Organization (ICAO) and the Commercial Aviation Safety Team (CAST), which includes Government officials and aviation industry leaders, have jointly chartered the CAST/ICAO Common Taxonomy Team (CICTT). CICTT includes experts from several air carriers, aircraft manufacturers, engine manufacturers, pilot associations, regulatory authorities, transportation safety boards, ICAO, and members from Canada, the European Union, France, Italy, Netherlands, United Kingdom, and the United States. CICTT is co-chaired by a representative from ICAO and CAST.
The team is charged with developing common taxonomies and definitions for aviation accident and incident reportings. Common taxonomies and definitions establish a standard industry language thereby improving the quality of information and communications. With this common language the aviation community's capacity to focus on common safety issues is greatly enhanced.
The CICTT taxonomy is designed to permit the assignment of multiple categories as necessary to fully describe the event. The intent of the chart on page 18 is to introduce the CICTT taxonomies. Accordingly, each accident was assigned to the single classification that was deemed to be the principle, or most descriptive category. It is intended that future editions of this document will contain the more detailed multiple category analysis and information.
The following are a complete set of the categories with a brief description:
ARC Abnormal Runway ContactAMAN Abrupt ManeuverADRM AerodromeATM ATM/CNSCABIN Cabin Safety EventsCFIT Controlled Flight into or Toward TerrainEVAC EvacuationF-NI Fire/Smoke (Non-Impact)F-POST Fire/Smoke (Post-Impact)FUEL Fuel RelatedGCOL Ground CollisionRAMP Ground HandlingICE IcingLOC-G Loss of Control – GroundLOC-I Loss of Control – In flight
LALT Low Altitude OperationsMAC Midair/Near Midair CollisionOTHR OtherRE Runway ExcursionRI-A Runway Incursion – AnimalRI-VAP Runway Incursion – Vehicle, Aircraft or PersonSEC Security RelatedSCF-NP System/Comp. Failure or Malfunction (Non-Power plant)SCF-PP System/Component Failure or Malfunction (Power plant)TURB Turbulence EncounterUSOS Undershoot/OvershootUNK Unknown or UndeterminedWSTRW Wind shear or Thunderstorm
For a more complete description go to: http://www.intlaviationstandards.org/
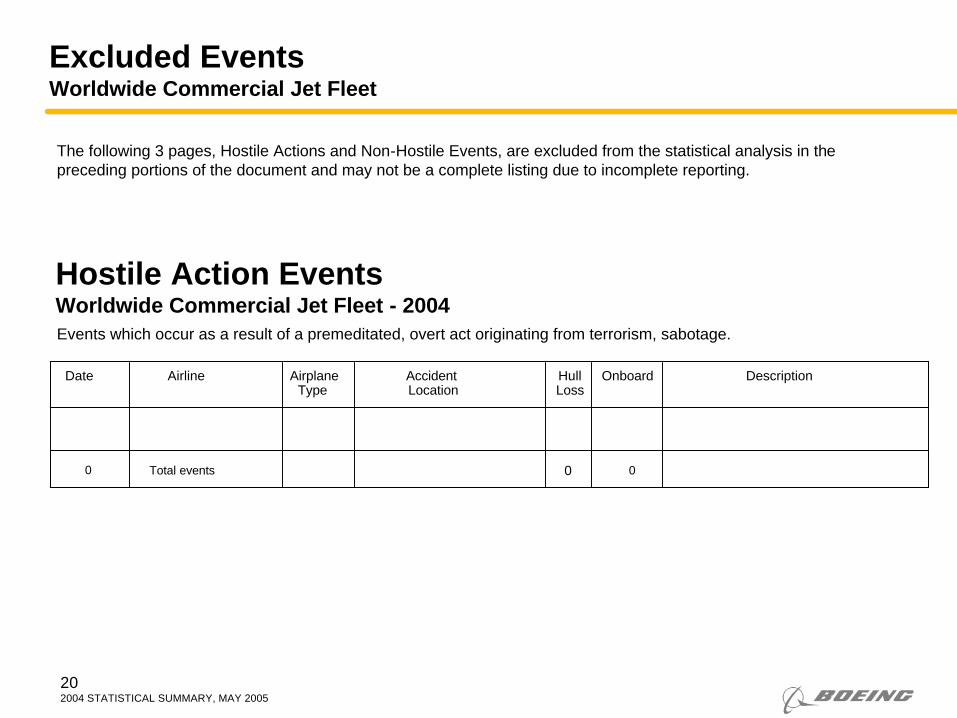
The following 3 pages, Hostile Actions and Non-Hostile Events, are excluded from the statistical analysis in the preceding portions of the document and may not be a complete listing due to incomplete reporting.
Hostile Action EventsWorldwide Commercial Jet Fleet - 2004Events which occur as a result of a premeditated, overt act originating from terrorism, sabotage.
Total events 0 0
Date Airline Airplane Accident Hull Onboard DescriptionType Location Loss
0
Excluded EventsWorldwide Commercial Jet Fleet
202004 STATISTICAL SUMMARY, MAY 2005
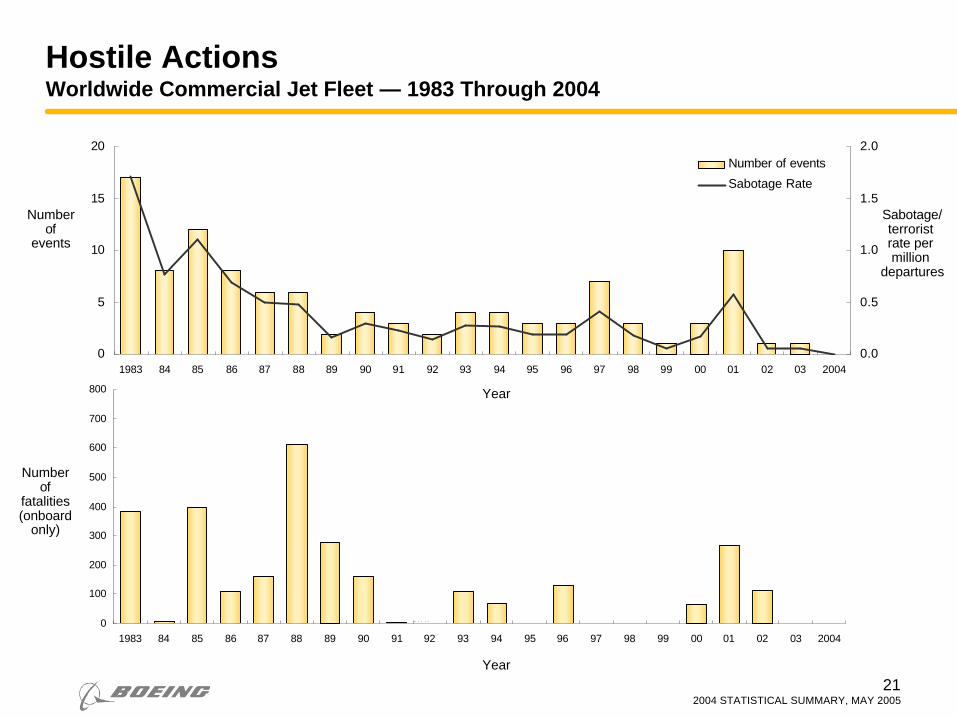
Hostile ActionsWorldwide Commercial Jet Fleet — 1983 Through 2004
212004 STATISTICAL SUMMARY, MAY 2005
0
100
200
300
400
500
600
700
800
1983 84 85 86 87 88 89 90 91 92 93 94 95 96 97 98 99 00 01 02 03 2004
0
5
10
15
20
1983 84 85 86 87 88 89 90 91 92 93 94 95 96 97 98 99 00 01 02 03 20040.0
0.5
1.0
1.5
2.0Number of events
Sabotage Rate
Sabotage/terrorist rate per million
departures
Numberof
events
Numberof
fatalities(onboard
only)
Year
Year

0 10 20 30 40 50 60 70 80 90
Severe turbulence:• No injury – 8 events• Flight attendant injury – 7 events• Passenger injury – 4 events• Passenger and flight attendant injury – 8 events
Emergency evacuation:• Minor injury – 3 events
Non-Hostile Events
Turbulence
Pushback
Servicing injury
Aircraft struck by vehicle
Emergency evacuation
Ground operations: • Airplane damaged while taxiing - inadvertently hit other
airplane, tug, jetway – 5 events• Airplane damaged from foreign object debris – 4 events• Engine ingestion fatality – 1 event• Crew/maintenance fell – 3 events
Events Occurring From 1995 Through 2004
Events Occurring In 2004
222004 STATISTICAL SUMMARY, MAY 2005
Number of events
Worldwide Commercial Jet Fleet
9
25
43
46
79
Notes
232004 STATISTICAL SUMMARY, MAY 2005

Notes
242004 STATISTICAL SUMMARY, MAY 2005
Top Related