


Languages
Pages
Legal

Combining chemical permeation enhancers to obtain synergistic effects
T du Toit 21649987
Dissertation submitted in fulfilment of the requirements for the degree Magister Scientiae in Pharmaceutics at the
Potchefstroom Campus of the North-West University
Supervisor: Prof JH Hamman Co-Supervisor: Dr MM Malan November 2014

This dissertation is dedicated to my parents, Dennis and Linda du Toit, who have always
loved me unconditionally and whose good examples have taught me to work hard for the
things that I aspire to achieve.

i
ABSTRACT __________________________________________________________________________________
The oral route of administration remains the preferred route of administrating drugs due to
patient acceptance and compliance. Therapeutic proteins are currently mainly administered
by means of the parenteral route because of its low intestinal epithelial permeation
capability. The major challenges for oral delivery of proteins and peptides are pre-systemic
enzymatic degradation and poor penetration of the intestinal mucosa. The latter can be
overcome by including safe and effective absorption enhancers in dosage forms. Aloe vera,
Aloe ferox and Aloe marlothii gel materials as well as N-trimethyl chitosan chloride (TMC)
were shown to be capable of increasing peptide drug transport across in vitro models such
as Caco-2 cell monolayers.
The purpose of this study is to investigate binary combinations of chemical drug absorption
enhancers and to determine if synergistic drug absorption enhancement effects exist. A.
vera, A. ferox and A. marlothii leaf gel materials as well as with N-trimethyl chitosan chloride
(TMC) were combined in different ratios and their effects on the transepithelial electrical
resistance (TEER) as well as the transport of FITC-dextran across Caco-2 cell monolayers
were measured. The isobole method was applied to determine the type of interaction that
exists between the absorption enhancers combinations.
The TEER results showed synergism existed for the combinations between A. vera and A.
marlothii, A. marlothii and A. ferox as well as A. vera and TMC. Antagonism interactions
also occurred and can probably be explained by chemical reactions between the chemical
permeation enhancers such as complex formation. In terms of FITC-dextran transport,
synergism was found for combinations between A. vera and A. marlothii, A. marlothii and A.
ferox, A. vera and TMC, A. ferox and TMC and A. marlothii and TMC, whereas antagonism
was observed for A. vera and A. ferox. The combinations where synergism was obtained
have the potential to be used as effective drug absorption enhancers at lower concentrations
compared to single components.
Key words: absorption enhancer, Aloe vera, Aloe ferox, Aloe marlothii, synergism, isobole

ii
UITTREKSEL __________________________________________________________________________________
Die orale roete bly die voorkeur roete van geneesmiddeltoediening as gevolg van pasiënt-
aanvaarding en samewerking. Terapeutiese proteïene word tans hoofsaaklik toegedien
deur middel van die parenterale roete as gevolg van hulle lae dermepiteel
deurlaatbaarheidsvermoë. Die grootste uitdagings vir orale aflewering van proteïene en
peptiede is pre-sistemiese ensiematiese afbraak en swak penetrasie deur die intestinale
mukosa. Laasgenoemde kan oorkom word deur die insluiting van veilige en doeltreffende
absorpsiebevorderaars in doseervorme. Daar is voorheen bewys dat Aloe vera, Aloe ferox
en Aloe marlothii gel materiale sowel as N-trimetiel kitosaan chloried (TMC) die vermoë besit
om die in vitro transport van peptiedgeneesmiddels deur Caco-2 selmonolae te verhoog.
Die doel van hierdie studie is om binêre kombinasies van chemiese
geneesmiddelabsorpsiebevorderaars te ondersoek en om te bepaal of daar sinergistiese
geneesmiddelabsorpsie effekte bestaan. A. vera, A. ferox en A. marlothii gel materiale
sowel as TMC is gekombineer in verskillende verhoudings om die effek daarvan op die
transepitele elektriese weerstand (TEER) asook die transport van FITC-dekstraan oor die
Caco-2 selmonolae te meet. Die isoboolmetode is toegepas om die tipe interaksies te
bepaal wat tussen die kombinasies bestaan van die verskillende absorpsiebevorderraars.
Die TEER resultate het getoon dat ‘n sinergistiese interaksie tussen die volgende
kombinasies bestaan: A. vera en A. marlothii, A. marlothii en A. ferox asook A. vera en TMC.
Antagonistiese interaksies is ook gevind en kan waarskynlik verklaar word as gevolg van
chemiese interaksies soos byvoorbeeld kompleksvorming tussen die chemiese absorpsie-
bevorderaars. In terme van FITC-dekstaan transport is sinergisme tussen die volgende
kombinasies gevind: A. vera en A. marlothii, A. marlothii en A. ferox, A. vera en TMC, A.
ferox en TMC en A. marlothii en TMC, terwyl antagonisme tussen A. vera en A. ferox
waargeneem is. Die kombinasies waar sinergistiese effekte verkry is, besit die potensiaal
om gebruik te word as doeltreffende geneesmiddelabsorpsiebevorderraars by laer
konsentrasies in vergelyking met enige van die enkel komponente.
Sleutelwoorde: absorpsiebevorderaar, Aloe vera, Aloe ferox, Aloe marlothii, sinergisme,
isobool

iii
CONFERENCE PROCEEDINGS AND ARTICLES
__________________________________________________________________________________
Conference Proceedings
Trizel du Toit, Maides M Malan, Hendrik JR Lemmer, Josias H Hamman. Combining
chemical permeation enhancers for improved drug delivery. Poster presentation
presented at the 17th World Congress of Basic and Clinical Pharmacology (WCP 2014),
13 - 18 July 2014, Cape Town, South Africa (See Addendum C).
Trizel du Toit, Maides Malan, Righard Lemmer, Wilma Breytenbach, Sias Hamman.
Combining chemical permeation enhancers for synergistic effects. Oral podium pre-
sentation at the 35th Conference of the Academy of Pharmaceutical Sciences, 12 - 14
September 2014, Port Elizabeth, South Africa (See Addendum C).
Articles
Wallis, L., Kleynhans, E., Du Toit, T., Gouws, C., Steyn, D., Steenekamp, J., Viljoen, J. &
Hamman, J. (2014). Novel Non-Invasive Protein and Peptide Drug Delivery Approaches.
Protein and Peptide Letters, 21(11), 1087-1101 (See Addendum C).
Du Toit, T., Malan, M.M., Lemmer, J.H.R., Gouws, C., Aucamp, M.E., Breytenbach, W.J.
& Hamman, J.H. (2014). Combining chemical permeation enhancers for synergistic
effects. Ready for submission (See Addendum C).

iv
ACKNOWLEDGEMENTS __________________________________________________________________________________
There have been many individuals who have supported me during this study. It is an honour
for me to thank each and every person who has encouraged and assisted me in completing
this journey and in particular I would like to thank the following individuals:
Prof. Sias Hamman - My study leader, who undertook to act as my supervisor
despite many other academic and professional commitments. Thank you Professor
for your immense knowledge, enthusiasm and commitment to my study. You did not
only create an ideal research environment for me to learn in, but also gave me the
opportunities to expand my knowledge by attending several conferences. It was a
privilege to work with and learn from you.
Dr. Maides Malan - My co-study leader. I want to express my deepest gratitude for
the guidance, caring, patience and hard work you have put into my study. It was an
honour to work with you.
My parents, Dennis and Linda du Toit and my brother, Len du Toit – Thank you for
your unconditional support with my studies. I am honoured to have you as my family.
Thank you for giving me a chance to prove and improve myself through all my walks
of life.
My friend, Georg Bensusan – Thank you for your unwavering support and
understanding during my studies, especially the past two years. Without your love,
help and encouragement I could never have accomplished such a task.
My fellow students and friends - Madel Kotzé, Johann Combrinck, Carlemi Calitz,
Ruan Joubert and Wynand du Preez, thank you for all the help, love and support.
Thank you for giving me beautiful memories that I am going to cherish for a lifetime.
Mrs. Mariëtte Fourie – Thank you for always being there and supporting me through
the hard times and laughing with me through the good times of this study.
Dr. Chrisna Gouws - You guided and assisted me with so much passion, love and
serenity. You were always willing to help me and it was an absolute honour and
delight to work with and learn from you.
Dr. Marique Aucamp – Thank you for assisting me with the microcalorimetry work.
You put so much time and effort in this study and I appreciate it.
Dr. Righard Lemmer – Thank you for your knowledge, help and valuable inputs in
this study. I am truly grateful for your assistance.

v
Prof. Jan Du Preez and Mr. Francois Viljoen at the Analytical Technology
Laboratory – Thank you for never once hesitating to assist me and walking the extra
miles to make the HPLC analysis possible.
Mrs. Wilma Breytenbach - Thank you for the statistical analysis of the data and
helping me with this section.
North West University, National Research Foundation and Pharmaceutical Society of
South Africa - Thank you for the financial support which made this study possible.
Finally, I thank God for providing me this opportunity and granting me the ability to
proceed successfully.

vi
TABLE OF CONTENTS __________________________________________________________________________________
ABSTRACT .................................................................................................................. i
UITTREKSEL .............................................................................................................. ii
CONFERENCE PROCEEDINGS AND ARTICLES ........................................................ iii
ACKNOWLEDGEMENTS ............................................................................................ iv
TABLE OF CONTENTS…………………………………………………………………………….vi
LIST OF FIGURES ..................................................................................................... xv
LIST OF TABLES ................................................................................................... xxiii
CHAPTER 1: INTRODUCTION
1.1 BACKGROUND AND MOTIVATION ...................................................................... 1
1.1.1 Oral drug delivery ............................................................................................ 1
1.1.2 Pathways of drug transport across the intestinal epithelial barrier .................... 1
1.1.3 Delivery of peptide and protein drugs ............................................................... 2
1.1.4 Drug absorption enhancement ......................................................................... 2
1.1.5 Synergism ........................................................................................................ 3
1.1.5.1 Isobole method to determine synergism.................................................... 3
1.1.6 Research problem ........................................................................................... 4
1.1.7 Hypothesis ....................................................................................................... 4
1.1.8 Aim .................................................................................................................. 4
1.2 DESIGN OF THE STUDY ....................................................................................... 5
1.3 STRUCTURE OF DISSERTATION ........................................................................ 6
CHAPTER 2: INTESTINAL DRUG ABSORPTION ENHANCERS
2.1 INTRODUCTION .................................................................................................... 7
2.2 DRUG ABSORPTION FROM THE GASTROINTESTINAL TRACT ....................... 8

vii
2.2.1 Pathways ......................................................................................................... 8
2.2.2 Mechanisms of drug absorption ....................................................................... 9
2.2.2.1 Transcellular passive diffusion .................................................................. 9
2.2.2.2 Carrier-mediated transport ........................................................................ 9
2.2.2.2.1 Active transport ...................................................................................... 9
2.2.2.2.2 Facilitated diffusion or transport ........................................................... 10
2.2.2.3 Endocytosis ............................................................................................ 10
2.2.2.3.1 Pinocytosis .......................................................................................... 10
2.2.2.3.2 Receptor-mediated endocytosis........................................................... 11
2.2.2.3.3 Phagocytosis ....................................................................................... 11
2.2.2.3.4 Transcytosis ........................................................................................ 11
2.2.2.4 Paracellular pathway............................................................................... 11
2.3 BARRIERS TO INTESTINAL ABSORPTION ....................................................... 12
2.3.1 Physical barriers ............................................................................................ 13
2.3.1.1 Unstirred water layer ............................................................................... 13
2.3.1.2 Membranes of the intestinal epithelial cells ............................................. 13
2.3.1.3 Tight junctions......................................................................................... 14
2.3.2 Biochemical barriers ...................................................................................... 15
2.3.2.1 Efflux of drugs from the intestine ............................................................. 15
2.3.2.2 Enzymatic degradation in the lumen ....................................................... 15
2.4 DRUG ABSORPTION ENHANCERS ................................................................... 16
2.4.1 Chemical permeation enhancers.................................................................... 16
2.4.2 Aloe materials as absorption enhancers ........................................................ 18
2.4.2.1 Botany of the aloe species ...................................................................... 18
2.4.2.2 Aloe species indigenous to South Africa selected for this study .............. 18
2.4.2.2.1 Aloe vera ............................................................................................. 18
2.4.2.2.2 Aloe ferox ............................................................................................ 19
2.4.2.2.3 Aloe marlothii ....................................................................................... 20

viii
2.4.2.3 Composition of aloe leaves ..................................................................... 20
2.4.2.4 Biological activities .................................................................................. 21
2.4.3 Chitosan and derivatives ................................................................................ 22
2.4.4 Other methods to enhance bioavailability ....................................................... 22
2.4.4.1 Enzyme inhibitors ................................................................................... 22
2.4.4.2 Bio-adhesive systems ............................................................................. 23
2.4.4.3 Particulate carrier systems ...................................................................... 23
2.4.4.4 Site-specific delivery ............................................................................... 24
2.5 MODELS TO STUDY DRUG ABSORPTION AND PHARMACOKINETIC INTER- ACTIONS………………………………………………………………………………….24
2.5.1 In vivo models to study intestinal absorption .................................................. 25
2.5.2 In situ models to study intestinal absorption ................................................... 26
2.5.3 In vitro models to study intestinal drug absorption .......................................... 26
2.5.3.1 Cell-based in vitro models ....................................................................... 27
2.5.3.1.1 Caco-2 cells ......................................................................................... 28
CHAPTER 3: SYNERGISM, ANTAGONISM AND ADDITIVE EFFECTS
3.1 INTRODUCTION .................................................................................................. 31
3.2 DEFINITION OF SYNERGISM, ANTAGONISM AND ADDITIVE EFFECTS ........ 32
3.3 MECHANISMS OF SYNERGISTIC EFFECTS ..................................................... 33
3.3.1 Multi-target effects ......................................................................................... 33
3.3.2 Enhanced solubility, absorption rate and improved bioavailability .................. 34
3.3.3 Supression of resistance mechanisms of bacteria ......................................... 35
3.3.4 The elimination of side effects by components contained in the extract ......... 35
3.4 METHODS TO MEASURE SYNERGISM, ANTAGONISM AND ADDITIVE EFFECTS ............................................................................................................. 35
3.4.1 Summation of effects ..................................................................................... 35
3.4.2 Comparison of a fixed dose of one component on the dose-response curve of
another component ....................................................................................... 36

ix
3.4.3 Comparing the results of a combination of components with that of a single
component .................................................................................................... 36
3.4.4 Median effect analysis ................................................................................... 36
3.4.5 Response surface analysis ............................................................................ 37
3.4.6 The sum of the fractional inhibitory concentration index (ΣFIC) ...................... 38
3.4.7 Isobole method .............................................................................................. 38
3.5 CONCLUSION ...................................................................................................... 41
CHAPTER 4: EXPERIMENTAL PROCEDURES
4.1 INTRODUCTION .................................................................................................. 43
4.2 MATERIALS ......................................................................................................... 44
4.2.1 Plant materials ............................................................................................... 44
4.2.2 Materials used in N,N,N-trimethyl chitosan chloride (TMC) synthesis ............ 44
4.2.3 Materials used in the transepithelial electrical resistance and transport
studies............................................................................................................ 45
4.2.4 Materials used in high performance liquid chromatography HPLC analysis
method ........................................................................................................... 46
4.2.5 Materials used in proton nuclear magnetic resonance (1H-NMR) spectro-
scopy ............................................................................................................. 46
4.3 PROCESSING OF ALOE MARLOTHII LEAVES.................................................. 47
4.3.1 Harvesting of leaves ...................................................................................... 47
4.3.2 Filleting .......................................................................................................... 47
4.3.3 Lyophilisation (freeze drying) ......................................................................... 48
4.3.4 Particle size reduction .................................................................................... 49
4.4 CHEMICAL FINGERPRINTING OF ALOE GEL MATERIALS ............................. 49
4.5 SYNTHESIS OF N,N,N-TRIMETHYL CHITOSAN CHLORIDE (TMC) .................. 49
4.5.1 Reaction conditions of each step in the synthesis of TMC.............................. 49
4.5.1.1 Reaction step 1 ....................................................................................... 50
4.5.1.2 Reaction step 2 ....................................................................................... 50
4.5.1.3 Additional reaction step ........................................................................... 50

x
4.5.1.4 Ion-exchange step .................................................................................. 50
4.5.2 Determination of the degree of quaternisation................................................ 50
4.6 VALIDATION OF THE CHROMATOGRAPHIC ANALYTICAL METHOD ............ 51
4.6.1 Introduction .................................................................................................... 51
4.6.2 Chromatographic conditions .......................................................................... 52
4.6.3 Standard solution preparation ........................................................................ 52
4.6.4 Samples from in vitro transport studies .......................................................... 53
4.6.5 Validation parameters .................................................................................... 53
4.6.5.1 Linearity .................................................................................................. 53
4.6.5.2 Accuracy and precision ........................................................................... 54
4.6.5.2.1 Accuracy .............................................................................................. 54
4.6.5.2.2 Inter-day precision ............................................................................... 54
4.6.5.3 Ruggedness ........................................................................................... 54
4.6.5.4 System repeatability................................................................................ 54
4.6.5.5 Specificity ............................................................................................... 55
4.6.6 Analysis of samples from the in vitro transport studies ................................... 55
4.7 TRANSEPITHELIAL ELECTRICAL RESISTANCE AND TRANSPORT STUDIES .............................................................................................................. 55
4.7.1 Reviving frozen cell stocks ............................................................................. 55
4.7.2 Culturing of caco-2 cells ................................................................................. 56
4.7.2.1 Changing the growth medium ................................................................. 56
4.7.2.2 Sub-culturing the Caco-2 cells ................................................................ 56
4.7.3 Seeding of Caco-2 cells onto Transwell® membrane plates ........................... 56
4.7.4 TEER study ................................................................................................... 58
4.7.4.1 Preparation of test solutions.................................................................... 58
4.7.4.2 Measurement of TEER ........................................................................... 58
4.7.5 In vitro transport studies of FITC-dextran ....................................................... 59
4.7.5.1 Preparation of test solutions.................................................................... 59

xi
4.7.5.2 Transport measurements of FITC-dextran across Caco-2 cell mono-
layers ..................................................................................................... 59
4.8 ISOTHERMAL MICROCALORIMETRY ............................................................... 60
4.9 DATA ANALYSIS AND STATISTICS ................................................................... 60
4.9.1 TEER studies ................................................................................................. 60
4.9.1.1 Reduction in TEER ................................................................................. 61
4.9.1.2 Percentage TEER reduction ................................................................... 61
4.9.2 In vitro transport ............................................................................................. 61
4.9.2.1 Isobole method ....................................................................................... 61
4.9.3 Statistical analysis of results .......................................................................... 64
CHAPTER 5: RESULTS AND DISCUSSION
5.1 INTRODUCTION .................................................................................................. 65
5.2 1H-NMR CHARACTERISATION OF MATERIALS ............................................... 65
5.2.1 1H-NMR characterization of aloe plant materials ............................................ 65
5.2.2 1H-NMR characterisation of N-trimethyl chitosan chloride (TMC) ................... 68
Degree of quaternisation of N-trimethyl chitosan chloride (TMC) ............ 69
5.3 VALIDATION OF THE CHROMATOGRAPHIC ANALYTICAL METHOD ............ 70
5.3.1 Validation parameters .................................................................................... 70
Linearity .................................................................................................. 70
5.3.2 Accuracy and precision .................................................................................. 71
Accuracy ................................................................................................. 71
Inter-day precision .................................................................................. 72
5.3.3 Ruggedness .................................................................................................. 73
5.3.4 System repeatability ....................................................................................... 74
5.3.5 Specificity ...................................................................................................... 74
5.3.6 Conclusion ..................................................................................................... 77
xii
5.4 EFFECT OF ABSORPTION ENHANCER COMBINATIONS ON TRANS- EPITHELIAL ELECTRICAL RESISTANCE (TEER) AND DRUG TRANSPORT ACROSS CACO-2 CELL MONOLAYERS ........................................................... 78
5.4.1 Combination 1: Aloe vera and Aloe marlothii................................................. 78
Transepithelial electrical resistance (TEER) reduction at concentration
0.1% w/v ................................................................................................. 78
Transepithelial electrical resistance (TEER) reduction at concentration
0.5% w/v ................................................................................................. 80
FITC-dextran transport ............................................................................ 82
Isobologram for combination 1: Aloe vera and Aloe marlothii ................. 83
Conclusion .............................................................................................. 84
5.4.2 Combination 2: Aloe vera and Aloe ferox ...................................................... 85
Transepithelial electrical resistance (TEER) reduction at concentration
0.1% w/v ................................................................................................ 85
Transepithelial electrical resistance (TEER) reduction at concentration
0.5% w/v ................................................................................................. 87
FITC-dextran transport ............................................................................ 89
Isobologram for combination 2: Aloe vera and Aloe ferox ...................... 90
Conclusion .............................................................................................. 91
5.4.3 Combination 3: Aloe marlothii and Aloe ferox................................................ 92
Transepithelial electrical resistance (TEER) reduction at concentration
0.1% w/v ................................................................................................. 92
Transepithelial electrical resistance (TEER) reduction at concentration
0.5% w/v ................................................................................................. 94
FITC-dextran transport ............................................................................ 96
Isobologram for combination 3: Aloe marlothii and Aloe ferox ................ 97
Conclusion .............................................................................................. 98
5.4.4 Combination 4: Aloe vera and TMC .............................................................. 99
Transepithelial electrical resistance (TEER) reduction at concentration
0.1% w/v ................................................................................................. 99

xiii
Transepithelial electrical resistance (TEER) reduction at concentration
0.5% w/v .............................................................................................. 101
FITC-dextran transport .......................................................................... 103
Isobologram for combination 4: Aloe vera and TMC ............................ 104
Conclusion ............................................................................................ 105
5.4.5 Combination 5: Aloe ferox and TMC ........................................................... 106
Transepithelial electrical resistance (TEER) reduction at concentration
0.1% w/v ............................................................................................... 106
Transepithelial electrical resistance (TEER) reduction at concentration
0.5% w/v ............................................................................................... 108
FITC-dextran transport .......................................................................... 110
Isobologram for combination 5: Aloe ferox and TMC............................ 112
Conclusion ............................................................................................ 112
5.4.6 Combination 6: Aloe marlothii and TMC ...................................................... 113
Transepithelial electrical resistance (TEER) reduction at concentration
0.1% w/v ............................................................................................... 113
Transepithelial electrical resistance (TEER) reduction at concentration
0.5% w/v ............................................................................................... 115
FITC-dextran transport .......................................................................... 117
Isobologram for combination 6: Aloe marlothii and TMC ...................... 118
Conclusion ............................................................................................ 119
CHAPTER 6: SUMMARY OF RESULTS, FINAL CONCLUSIONS AND FUTURE RECOMMENDATIONS
6.1 SUMMARY OF THE RESULTS OF THE TRANSEPITHELIAL ELECTRICAL RESISTANCE (TEER) STUDIES ....................................................................... 120
6.2 SUMMARY OF THE RESULTS OF THE IN VITRO TRANSPORT STUDIES .... 122
6.3 FINAL CONCLUSION ........................................................................................ 125
6.4 RECOMMENDATIONS FOR FUTURE STUDIES............................................... 125
REFERENCES ......................................................................................................... 126

xiv
ADDENDUM A ......................................................................................................... 139
ADDENDUM B ......................................................................................................... 179
ADDENDUM C ......................................................................................................... 194
ADDENDUM D………………………………………………………………...………..….239
ADDENDUM E ......................................................................................................... 243
xv
LIST OF FIGURES __________________________________________________________________________________
Figure 1.1: Isobole curve based on 50% inhibition values of a combination of
ginkgolides A and B………………………………………...…………………..3
Figure 2.1: A schematic representation of the pathways and mechanisms of molecule
transport across the intestinal epithelium: a) paracellular passive diffusion,
b) transcellular passive diffusion, c) transcytosis, d) carrier-mediated
uptake at the apical domain followed by passive diffusion at the
basolateral membrane…………...………....................................................8
Figure 2.2: Schematic illustration of the barriers which can potentially limit drug
absorption………………………………………………………………………13
Figure 2.3: Schematic illustration of the structure of a biological cell membrane……14
Figure 2.4: A photograph of the leaves of an Aloe vera plant………………………….19
Figure 2.5: A photograph of a) an Aloe ferox plant and b) the leaves and yellow, bitter
sap of the Aloe ferox plant…………………………………………..……….19
Figure 2.6: A photograph showing a) the Aloe marlothii plant and b) the crude leaves
of the Aloe marlothii plant…………………………………..………………..20
Figure 2.7: Different models for screening of drugs during the discovery and
developmental phases…………………………………...…………………...25
Figure 2.8: A schematic representation of culture of Caco-2 cells on a microporous
filter……………………………………………………………………………...30
Figure 3.1: A graphic presentation of mono- and multi-target effects produced by a
mono-extract containing many chemical components…………………….34
Figure 3.2: Response surface of a combination of full agonist B with partial agonist A.
At low concentrations, A adds to the effect produced by B. At high
concentrations, A competes with B for receptors, lowering the combined
effect…………………………………………………………………………....37

xvi
Figure 3.3: Isobole graphs representing zero-interaction, synergism and
antagonism…………………………………………………………………….39
Figure 3.4: Isobologram representing synergism between components a and b. The
dashed line indicates zero-interaction……………………………………....40
Figure 3.5: Isobologram representing antagonism between two components a and b.
The dashed line indicates zero-interaction………………………………….40
Figure 3.6: Isobole for anaesthetic effects of fluorazepam and hexobarbital displaying
a synergistic region as well as antagonistic region by crossing the zero-
interaction line………………………………………………………………....41
Figure 4.1: Aloe marlothii leaves to demonstrate the removal of fillet material: a) fresh
leaves after harvesting b) removal of the ends of the leaves and c) cutting
of gel or fillet material into strips………………………………...…………...47
Figure 4.2: Photographs demonstrating a) the method used to liquidise the gel fillets
and b) how the liquidised pulp was packaged for freezing………………..48
Figure 4.3: The freeze-dryer setup used in the lyophilisation process………………..48
Figure 4.4: The process of forcing the dried Aloe marlothii gel pieces through the
sieve………………………………………………………………………….....49
Figure 4.5: Examples of typical isobolograms obtained from different experiments in
this study, where a) resulted in an overall synergistic effect and b) resulted
in an overall antagonistic effect………………………………………………62
Figure 5.1: 1H-NMR spectra of a) Aloe vera gel material, b) Aloe marlothii gel material
and c) Aloe ferox gel material………………………………………………..67
Figure 5.2: 1H-NMR spectrum of N-trimethyl chitosan chloride (TMC)……………….68
Figure 5.3: Linear regression graph obtained for FITC-dextran……………………….70
Figure 5.4: HPLC chromatogram illustrating the peak of FITC-dextran at a retention
time of 5.811 min………………………………………………………………75
Figure 5.5: HPLC chromatogram illustrating the peak of FITC-dextran at a retention
time of 5.974 min in the presence of Aloe vera gel…………………..……75

xvii
Figure 5.6: HPLC chromatogram illustrating the peak of FITC-dextran at a retention
time of 6.028 min in the presence of Aloe ferox gel………………...……..76
Figure 5.7: HPLC chromatogram illustrating the peak of FITC-dextran at a retention
time of 5.995 min in the presence of Aloe marlothii gel………………..….76
Figure 5.8: HPLC chromatogram illustrating the peak of FITC-dextran at a retention
time of 6.067 min in the presence of TMC……………………...…………..77
Figure 5.9: Reduction in the transepithelial electrical resistance (TEER) of Caco-2 cell
monolayers at concentration 0.1% w/v of different combination ratios of
Aloe vera and Aloe marlothii gel plotted as a function of time (n = 3, mean
± SD)…………………………………………………………………………….78
Figure 5.10: Percentage TEER reduction of Caco-2 cell monolayers at time points
60 and 120 min for all the ratios within combination 1 (i.e. Aloe vera and
Aloe marlothii) at concentration 0.1% w/v, as well as control groups. Bars
on the graph marked with * indicate statistically significant differences with
the negative control group (p ≤ 0.05) (n = 3, mean ± SD)…………….…..79
Figure 5.11: Reduction in the transepithelial electrical resistance (TEER) of Caco-2 cell
monolayers at concentration 0.5% w/v of different combination ratios of
Aloe vera and Aloe marlothii gel plotted as a function of time (n = 3, mean
± SD)…………………………………………………………………………….80
Figure 5.12: Percentage TEER reduction of Caco-2 cell monolayers at time points
60 and 120 min for all the ratios within combination 1 (i.e. Aloe vera and
Aloe marlothii) at concentration 0.5% w/v as well as control groups. Bars
on the graph marked with * indicate statistically significant differences with
the negative control group (p ≤ 0.05) (n = 3, mean ± SD)………………...81
Figure 5.13: The effect of combination 1 (Aloe vera and Aloe marlothii) at concentration
0.1% w/v on the transport (Papp values) of FITC-dextran across Caco-2
cell monolayers. Bars on the graph marked with * indicate statistically
significant differences with the negative control group (p ≤ 0.05) (n = 3,
mean ± SD)…………………………………………...………………………..82

xviii
Figure 5.14: Isobologram of the apparent permeability coefficient (Papp) values of FITC-
dextran in the presence of combination 1 (Aloe vera and Aloe marlothii) at
different ratios…………………………………...……………………………..84
Figure 5.15: Reduction in the transepithelial electrical resistance (TEER) of Caco-2 cell
monolayers at concentration 0.1% w/v of different combination ratios of
Aloe vera and Aloe ferox gel plotted as a function of time (n = 3, mean ±
SD)……………………………………………………………………………....85
Figure 5.16: Percentage TEER reduction of Caco-2 cell monolayers at time points
60 and 120 min for all the ratios within combination 2 (i.e. Aloe vera and
Aloe ferox) at concentration 0.1% w/v as well as control groups. Bars on
the graph marked with * indicate statistically significant differences with
the negative control group (p ≤ 0.05) (n = 3, mean ± SD)…………….…..86
Figure 5.17: Reduction in the transepithelial electrical resistance (TEER) of Caco-2 cell
monolayers at concentration 0.5% w/v of different combination ratios of
Aloe vera and Aloe ferox gel plotted as a function of time (n = 3, mean ±
SD)……………………………………………………………………………....87
Figure 5.18: Percentage TEER reduction of Caco-2 cell monolayers at time points
60 and 120 min for all the ratios within combination 2 (i.e. Aloe vera and
Aloe ferox) at concentration 0.5% w/v as well as control groups. Bars on
the graph marked with * indicate statistically significant differences with
the negative control group (p ≤ 0.05) (n = 3, mean ± SD)…………….…..88
Figure 5.19: The effect of combination 2 (Aloe vera and Aloe ferox) at concentration
0.1% w/v on the transport (Papp values) of FITC-dextran across Caco-2
cell monolayers. Bars on the graph marked with * indicate statistically
significant differences with the negative control group (p ≤ 0.05) (n = 3,
mean ± SD)…………………………………………………………………….89
Figure 5.20: Isobologram of the apparent permeability coefficient (Papp) values of FITC-
dextran in the presence of combination 2 (Aloe vera and Aloe ferox) at
different ratios………………………………………………………………….91

xix
Figure 5.21: Reduction in the transepithelial electrical resistance (TEER) of Caco-2 cell
monolayers at a concentration of 0.1% w/v of different combination ratios
of Aloe marlothii and Aloe ferox gel plotted as a function of time (n = 3,
mean ± SD)…………………………………………………………………….92
Figure 5.22: Percentage TEER reduction of Caco-2 cell monolayers at time points
60 and 120 min for all the ratios within combination 3 (i.e. Aloe marlothii
and Aloe ferox) at concentration 0.1% w/v, as well as control groups.
Bars on the graph marked with * indicate statistically significant
differences with the negative control group (p ≤ 0.05) (n = 3, mean ±
SD)……….…………………………………………………………………...…93
Figure 5.23: Reduction in the transepithelial electrical resistance (TEER) of Caco-2 cell
monolayers by a concentration of 0.5% w/v of different ratios of Aloe
marlothii and Aloe ferox gel plotted as a function of time (n = 3, mean ±
SD)……………………………………………………………………….……...94
Figure 5.24: Percentage TEER reduction of Caco-2 cell monolayers at time points
60 and 120 min for all the ratios within combination 3 (i.e. Aloe marlothii
and Aloe ferox) at concentration 0.5% w/v as well as control groups. Bars
on the graph marked with * indicate statistically significant differences with
the negative control group (p ≤ 0.05) (n = 3, mean ± SD)…………….. …95
Figure 5.25: The effect of combination 3 (i.e. Aloe marlothii and Aloe ferox) at
concentration 0.1% w/v on the transport (Papp values) of FITC-dextran
across Caco-2 cell monolayers. Bars on the graph marked with * indicate
statistically significant differences with the negative control group (p ≤
0.05) (n = 3, mean ± SD)…………….……………………………………….96
Figure 5.26: Isobologram of the apparent permeability coefficient (Papp) values of FITC-
dextran in the presence of combination 3 (i.e. Aloe marlothii and Aloe
ferox) ratios………………………………………………………………….....98
Figure 5.27: Reduction in the transepithelial electrical resistance (TEER) of Caco-2 cell
monolayers at a concentration of 0.1% w/v of different combination ratios
of Aloe vera and TMC plotted as a function of time (n = 3, mean ± SD)...99

xx
Figure 5.28: Percentage TEER reduction of Caco-2 cell monolayers at time points
60 and 120 min for all the ratios within combination 4 (i.e. Aloe vera and
TMC) at concentration 0.1% w/v as well as control groups. Bars on the
graph marked with * indicate statistically significant differences with the
negative control group (p ≤ 0.05) (n = 3, mean ± SD)……………………100
Figure 5.29: Reduction in the transepithelial electrical resistance (TEER) of Caco-2 cell
monolayers by a concentration of 0.5% w/v of different ratios of Aloe vera
gel and TMC, plotted as a function of time (n = 3, mean ± SD)…………101
Figure 5.30: Percentage TEER reduction of Caco-2 cell monolayers at time points
60 and 120 min for all the ratios within combination 4 (Aloe vera and TMC)
at concentration 0.5% w/v as well as control groups. Bars on the graph
marked with * indicate statistically significant differences with the negative
control group (p ≤ 0.05) (n = 3, mean ± SD)………………………………102
Figure 5.31: The effect of combination 4 (Aloe vera and TMC) on the transport
(Papp values) of FITC-dextran across Caco-2 cell monolayers. Bars on the
graph marked with * indicate statistically significant differences with the
negative control group (p ≤ 0.05) (n = 3, mean ± SD)……………………103
Figure 5.32: Isobologram of the apparent permeability coefficient (Papp) values of FITC-
dextran in the presence of combination 4 (Aloe vera and TMC) at different
ratios…………………………………………………………………………...105
Figure 5.33: Reduction in the transepithelial electrical resistance (TEER) of Caco-2 cell
monolayers at concentration 0.1% w/v of different combination ratios of
Aloe ferox gel and TMC plotted as a function of time (n = 3,
mean ± SD)……………………………………………...……………………106
Figure 5.34: Percentage TEER reduction of Caco-2 cell monolayers at time points
60 and 120 min for all the ratios within combination 5 (Aloe ferox and
TMC) at concentration 0.1% w/v, as well as control groups. Bars on the
graph marked with * indicate statistically significant differences with the
negative control group (p ≤ 0.05) (n = 3, mean ± SD)…………………...107
xxi
Figure 5.35: Reduction in the transepithelial electrical resistance (TEER) of Caco-2 cell
monolayers by concentration 0.5% w/v of different ratios of Aloe ferox gel
and TMC plotted as a function of time (n = 3, mean ± SD)……………...108
Figure 5.36: Percentage TEER reduction of Caco-2 cell monolayers at time points
60 and 120 min for all the ratios within combination 5 (i.e. Aloe ferox and
TMC) at concentration 0.5% w/v as well as control groups. Bars on the
graph marked with * indicate statistically significant differences with the
negative control group (p ≤ 0.05) (n = 3, mean ± SD)…………….……..109
Figure 5.37: The effect of combination 5 (Aloe ferox and TMC) on the transport
(Papp values) of FITC-dextran across Caco-2 cell monolayers. Bars on the
graph marked with * indicate statistically significant differences with the
negative control group (p ≤ 0.05) (n = 3, mean ± SD)……………….…..110
Figure 5.38: Isobologram of the apparent permeability coefficient (Papp) values of FITC-
dextran in the presence of combination 5 (Aloe ferox and TMC) at different
ratios…………………………………………………………………………...112
Figure 5.39: Reduction in the transepithelial electrical resistance (TEER) of Caco-2 cell
monolayers by concentration 0.1% w/v of different ratios of Aloe marlothii
gel and TMC plotted as a function of time (n = 3, mean ± SD)………….113
Figure 5.40: Percentage TEER reduction of Caco-2 cell monolayers at time points
60 and 120 min for all the ratios within combination 6 (Aloe marlothii and
TMC) at concentration 0.1 % w/v, as well as control groups. Bars on the
graph marked with * indicate statistically significant differences with the
negative control group (p ≤ 0.05) (n = 3, mean ± SD)…………………...114
Figure 5.41: Reduction in the transepithelial electrical resistance (TEER) of Caco-2 cell
monolayers by concentration 0.5% w/v of different ratios of Aloe marlothii
gel and TMC plotted as a function of time (n = 3, mean ± SD)………….115
Figure 5.42: Percentage TEER reduction of Caco-2 cell monolayers at time points 60
and 120 min for all the ratios within combination 6 (Aloe marlothii and
TMC) at concentration 0.5% w/v as well as control groups. Bars on the
graph marked with * indicate statistically significant differences with the
negative control group (p ≤ 0.05) (n = 3, mean ± SD)…………………...116

xxii
Figure 5.43: The effect of combination 6 (i.e. Aloe marlothii and TMC) on the transport
(Papp values) of FITC-dextran across Caco-2 cell monolayers. Bars on the
graph marked with * indicate statistically significant differences with the
negative control group (p ≤ 0.05) (n = 3, mean ± SD)………………..….117
Figure 5.44: Isobologram of the apparent permeability coefficient (Papp) values of FITC-
dextran in the presence of combination 6 (Aloe marlothii and TMC)
ratios…………………………………………………………………………...119
Figure 6.1: Percentage TEER reduction of Caco-2 cell monolayers at 120 min for all
combinations at a) concentration 0.1% w/v and b) concentration 0.5% w/v.
Bars on the graph marked with * indicate statistically significant
differences with the negative control group (p ≤ 0.05) (n = 3,
mean ± SD)…………………………………………………………………...121
Figure 6.2: Isobolograms of the apparent permeability coefficient (Papp) values of
FITC-dextran in the presence of different ratios of a) combination 1,
b) combination 2, c) combination 3, d) combination 4, e) combination 5
and f) combination 6…………………………………………………………123

xxiii
LIST OF TABLES __________________________________________________________________________________
Table 1.1: Combinations of absorption enhancers investigated for synergistic
effects…………………………………………………………………………..6
Table 2.1: Classification of intestinal permeation enhancers…………………..……17
Table 2.2: Cell lines (and their co-cultures) used for intestinal permeability
assessment of drugs……………………………………………………..….28
Table 2.3: Characteristics of Caco-2 cells………………………………………...…...29
Table 4.1: Chromatographic conditions for the validation and analysis of in vitro
transport samples…………………………………………………………….52
Table 4.2: Combinations of absorption enhancers for the TEER experiments…….58
Table 5.1: Peak areas and linearity results of FITC-dextran standard solutions…..71
Table 5.2: Accuracy based on recovery from spiked FITC-dextran samples……...72
Table 5.3: Results obtained from the inter-day precision measurements………….72
Table 5.4: The stability of FITC-dextran in solution over 24 h……………………….73
Table 5.5: %RSD for the peak area and retention time of FITC-dextran injected
repeatedly……………………………………………………………………..74
Table 5.6: P-values obtained from Dunnett’s test for Papp values of FITC dextran in
the presence of combination 1 compared with the control groups……..83
Table 5.7: P-values obtained from Dunnett’s test for Papp values of FITC dextran in
the presence of combination 2 compared with the control groups……..90
Table 5.8: P-values obtained from Dunnett’s test for Papp values of FITC dextran in
the presence of combination 3 compared with the control groups……..97
Table 5.9: P-values obtained from Dunnett’s test for Papp values of FITC dextran in
the presence of combination 4 compared with the control groups…....104

xxiv
Table 5.10: P-values obtained from Dunnett’s test for Papp values of FITC dextran in
the presence of combination 5 compared with the control groups……111
Table 5.11: P-values obtained from Dunnett’s test for Papp values of FITC dextran in
the presence of combination 6 compared with the control groups…....118
Table 6.1: The apparent permeability coefficient values (Papp) for FITC-dextran..122

1
CHAPTER 1 INTRODUCTION
__________________________________________________________________________________
1.1 BACKGROUND AND MOTIVATION
1.1.1 Oral drug delivery
Due to ease of administration and patient acceptability, the oral route of administration
remains the preferred means of administrating drugs (Daugherty & Mrsny, 1999:144). The
term “absorption,” with respect to oral administration, refers to the transport of drug
molecules from the site of administration across the intestinal epithelium into the blood
surrounding the gastrointestinal tract (Hamman, 2007:184).
The gastrointestinal tract epithelium separates the lumen of the stomach and the intestines
from the blood surrounding the gastrointestinal tract and eventually also the systemic
circulation. It is the main cellular barrier for the absorption of the drugs from the
gastrointestinal tract. The cell membrane is complex in nature as it has a lipid bi-layer
structure. This barrier has the characteristics of a semi-permeable membrane, allowing a
rapid transit of some materials and impeding passage of others. In addition, there are a
number of transporter proteins, or carrier molecules, which exist in the membrane and
transport materials back and forth across it with the use of energy (Asford, 2007a:270).
1.1.2 Pathways of drug transport across the intestinal epithelial barrier
In general, there are two pathways by which a molecule crosses the intestinal epithelium.
One pathway is through the epithelial cells, which is termed transcellular uptake or transport
and the other is between adjacent cells, which are termed paracellular uptake or transport
(Daugherty & Mrsny, 1999:147).
During transcellular passage, a substance has to be translocated through the apical and
basolateral cell membranes. This type of passage can proceed by simple diffusion, carrier
mediation or by pinocytosis. Paracellular passage occurs by the movement of molecules
through openings in the tight junctions and diffusion through the intercellular spaces. Tight
junctions are protein structures which morphologically fuse the membranes of adjacent
enterocytes close to the apical surface into a continuum (Hildalgo, 2001:388).
2
1.1.3 Delivery of peptide and protein drugs
A variety of drugs with a protein and peptide structure have been established as therapeutics
for the treatment of diseases (Antosova et al., 2009:628). For Diabetes Mellitus patients,
insulin is manufactured by means of recombinant DNA technology on an industrial scale.
Pharmaceutical proteins are currently mainly administered by means of the parenteral route
(i.e. subcutaneous, intramuscular and intravenous injections) because of its low epithelial
penetration capability (Crommelin et al., 2002:616). The parenteral route of administration
has disadvantages such as hypertrophy of subcutaneous fatty tissue and immune response
of the skin (Nolte et al., 2003:704).
One of the major challenges to overcome with oral delivery of peptide and protein drugs is
their poor bioavailability due to pre-systemic enzymatic degradation and poor penetration of
the intestinal mucosa. To overcome the poor permeation challenge, safe and effective
absorptions enhancers could be included in oral peptide and protein formulations (Legen et
al., 2005:183; Hamman et al., 2005:165).
1.1.4 Drug absorption enhancement
Absorption enhancers are compounds which temporarily disrupt or reversibly remove the
intestinal barrier with minimum tissue damage, thus allowing a drug to penetrate the
epithelial cells and enter the blood or lymph circulation. Many structurally diverse
compounds have shown the ability to increase drug transport across the intestinal epithelium
after oral administration. However, very few absorption enhancers have been incorporated
into marketed products due to concerns regarding efficacy, toxicity and other long term
adverse effects (Hamman et al., 2005:171).
Examples of drug absorption enhancers include chitosan and its derivative, N-trimethyl
chitosan chloride (TMC), which have the ability to influence the integrity of the epithelial tight
junctions which lead to an increase in paracellular transport of large hydrophilic compounds
(Kotzé et al., 1999:1197). Aloe vera gel enhanced the bioavailability of co-administered
vitamins when taken orally by humans (Vinson et al., 2005:760). Aloe vera, Aloe ferox, Aloe
marlothii gel and whole leaf materials, as well as precipitated polysaccharides from these
materials, improved insulin transport across in vitro models such as Caco-2 cell monolayers
and excised animal tissues (Beneke et al., 2012:481; Lebitsa et al., 2012:297).

3
1.1.5 Synergism
Synergism is a concept that refers to a situation where the effect of a mixture of compounds
exceeds that expected from the effects of the individual components (Howard & Webster,
2009:469). The use of binary combinations of permeation enhancers to create synergistic
drug absorption enhancing effects has been investigated within the Caco-2 cell model.
Some of the enhancer formulations (i.e. a combination of hexylamine and chembetaine)
have increased mannitol transport 15-fold and FITC-dextran transport 8-fold, indicating the
potential of achieving synergistic effects with combinations of absorption enhancers
(Whitehead et al., 2008:128).
1.1.5.1 Isobole method to determine synergism
One of the most effective and practical methods, in terms of experimental design, to
demonstrate synergism is the isobole method. This method is based on the concept of dose
equivalence, which leads to the observation that if a combination (da, db) is represented by a
point in a graph, the axes of which represent doses of A and B respectively, the point lies on
the straight line joining Da and Db, thus satisfy the equation da
Da + db
Db = 1, but only if there are
no drug interactions (Berenbaum, 1989:100).
An example for the verification of a synergistic effect between two compounds by the isobole
method is the combination of two natural products, ginkgolides A and B extracted from the
plant Ginkgo biloba (as shown in Figure 1.1).
Figure 1.1: Isobole curve based on 50% inhibition values of a combination of ginkgolides A
and B (Wagner, 2009:35)

4
1.1.6 Research problem
As mentioned before, therapeutic proteins and peptide drugs, for example insulin, are
administered almost exclusively by means of injection. This route of administration is used
due to the poor membrane permeability and absorption of proteins and peptides from the
gastrointestinal tract. Although the parenteral route of administration has many advantages,
it is unfortunately also associated with discomfort, pain, potential infections and lipoatrophy.
The most preferred route of drug administration is the oral route, mainly because of the ease
of use by the patient. Poorly permeable drugs such as insulin can be combined with a
natural absorption enhancer, which could effectively improve the absorption of insulin from
the gastrointestinal tract and thereby making oral drug delivery possible.
Although absorption enhancers have shown potential to deliver peptide drugs, their clinical
application have been hampered by indications of toxicity and insufficient absorption
enhancement effects. When intestinal drug transport enhancers are combined, they have
the potential to show synergist effects, which means a higher drug transport enhancement
effect can be obtained at lower concentrations. Combinations of drug absorption enhancers
can therefore make a contribution towards the development of effective oral drug delivery
systems for poorly absorbable drugs.
1.1.7 Hypothesis
Combinations of leaf gel materials from A. vera, A. ferox and A. marlothii or with N-trimethyl
chitosan chloride (TMC) will result in a synergistic drug absorption enhancement effect,
which will cause an increase of fluorescein isothiocyanate (FITC)-dextran (mol. wt 4000 Da)
transport across the intestinal epithelium.
1.1.8 Aim
The aim of this study was to determine if a synergistic drug absorption enhancement effect
could be obtained when combinations of leaf gel materials of three different aloe species,
namely A. vera, A. ferox and A. marlothii, as well as different combinations with N-trimethyl
chitosan chloride (TMC), were applied to intestinal epithelial cell monolayers.
The objectives of the study were as follows:
To harvest, process and freeze dry the gel material from A. marlothii leaves and source
commercially available gel materials of A. vera and A. ferox.
5
To chemical fingerprint the selected aloe gel materials, as well as TMC, by means of
Nuclear Magnetic Resonance (NMR) spectroscopy to identify specific marker molecules
typical of aloes.
To evaluate the effect of combinations of the aloe materials and TMC on the
transepithelial electrical resistance (TEER) of Caco-2 cell monolayers in
Transwell 24-well plates.
To evaluate the effect of combinations of the leaf materials from three different aloe
species and TMC on the transport of fluorescein isothiocyanate (FITC)-dextran as model
compound across Caco-2 cell monolayers in Transwell 6-well plates.
To optimise a High Performance Liquid Chromatography (HPLC) analytical method for
measuring the fluorescein isothiocyanate (FITC)-dextran concentration in the samples
obtained from the transport studies.
To determine the compatibility between the different materials (i.e. Aloe vera, Aloe
marlothii, Aloe ferox and N-trimethyl chitosan chloride (TMC)) used in each combination
by using isothermal microcalorimetry.
1.2 DESIGN OF THE STUDY
This was a quantitative research study with a true experimental design where the dependent
variable (drug absorption enhancement) was manipulated by addition of different
combinations and concentrations of aloe gel materials and TMC, whilst all other conditions
were kept constant. Control groups were included to indicate that the measured effect is
indeed caused by the chemical permeation enhancers and not by chance interferences or
external factors. The experiments were done in triplicate and the averages as well as
standard deviations were calculated to indicate repeatability.
The combinations of drug absorption enhancers investigated are listed in Table 1.1. In the
control group, the TEER of Caco-2 cell monolayers alone was measured during the TEER
studies, while the transport of FITC-dextran alone across Caco-2 cell monolayers was
determined during the transport studies and no chemical permeation enhancer was added.
In the positive control group, the TEER of Caco-2 cell monolayers in the presence of TMC as
well as the transport of FITC-dextran in the presence of TMC was determined. TMC is
known for its absorption enhancement effects (Kotzé et al., 1999:1197).
The TEER experiments were done at two concentrations namely 0.1% w/v and 0.5% w/v,
where the transport experiments were only performed at concentration 0.1% w/v. Both

6
experiments were executed in five different combination ratios namely 10:0, 8:2, 5:5, 2:8 and
0:10.
Table 1.1: Combinations of absorption enhancers investigated for synergistic effects
Combinations of absorption enhancers
Combination 1 A. vera and A. marlothii
Combination 2 A. vera and A. ferox
Combination 3 A. marlothii and A. ferox
Combination 4 A. vera and TMC
Combination 5 A. ferox and TMC
Combination 6 A. marlothii and TMC
1.3 STRUCTURE OF DISSERTATION
In this dissertation, the introductory chapter (Chapter 1) outlines the rationale as well as the
aim and objectives of the study, followed by a review of the relevant literature (Chapters 2
and 3) placing the study in the context of the field of protein and peptide drug delivery as well
as synergism. Chapter 4 describes the experimental procedures and statistical methods
used, whilst the results and discussions are displayed in Chapter 5. Chapter 6 consists of
the final conclusions and recommendations for future studies.

7
CHAPTER 2 INTESTINAL DRUG ABSORPTION ENHANCERS
___________________________________________________________________
2.1 INTRODUCTION
The oral route of drug administration is preferential to other routes of administration due to
its convenience for the patient. As a result of particularly low bioavailability, adequate oral
delivery of protein and peptide drugs is currently not possible and the development of oral
protein drug delivery systems is highly challenging (Park et al., 2011:280). Absorption of a
drug after oral administration refers to the transport of a drug from the site of administration
across the intestinal epithelium into the blood surrounding the gastrointestinal (Hamman,
2007:189). Absorption of drugs or solutes in the gastrointestinal tract occurs primarily in the
three sections of the small intestine (duodenum, jejunum and ileum) due to the relatively
large surface area available as a result of physiological adaptations such as villi (Shargel et
al., 2005:386). Drug absorption is dictated by each of these segments’ unique anatomical,
biochemical and physiological characteristics (Daugherty & Mrsny, 1999:144).
A single layer of epithelium separates the content of the lumen of the gastrointestinal tract
from the blood surrounding the gastrointestinal tract and eventually also the systemic
circulation. It is the main physical barrier to movement of drug molecules from the
gastrointestinal tract to the systemic circulation. The composition of cell membranes is
complex in nature with a lipid bilayer structure. The cell membrane is semi-permeable,
which allows rapid transit of some molecules, which are substrates for transporter proteins or
carrier molecules that exist in the membrane (Asford, 2007a:279).
In the intestine, the transport of substances from the lumen to the bloodstream (absorption)
and from the bloodstream to the lumen (efflux) occurs simultaneously. The primary
physiologic function of the intestine is absorption of nutrients and therefore the net result of
permeation is usually absorption, although efflux should not be neglected (Liu et al.,
2009:265).
Bioavailability is the relative amount of the administered dose of a drug that is absorbed and
that reaches the systemic circulation intact after extra-vascular administration (Ashford,
2007a:267). Poor absorption from the gastrointestinal tract which results in low
bioavailability is a characteristic of many hydrophilic drugs such as bisphosphonates,
proteins, peptides and peptide-like drugs. Movement of these molecules through the highly
non-polar lipid bilayer membrane is restricted due to the high energy needed for desolvation.
8
One approach that has been used to improve the permeability of these drugs across the
intestinal epithelium is co-administration of absorption enhancers (Legen et al., 2005:183;
Kerns & Di, 2008:87).
2.2 DRUG ABSORPTION FROM THE GASTROINTESTINAL TRACT
2.2.1 Pathways
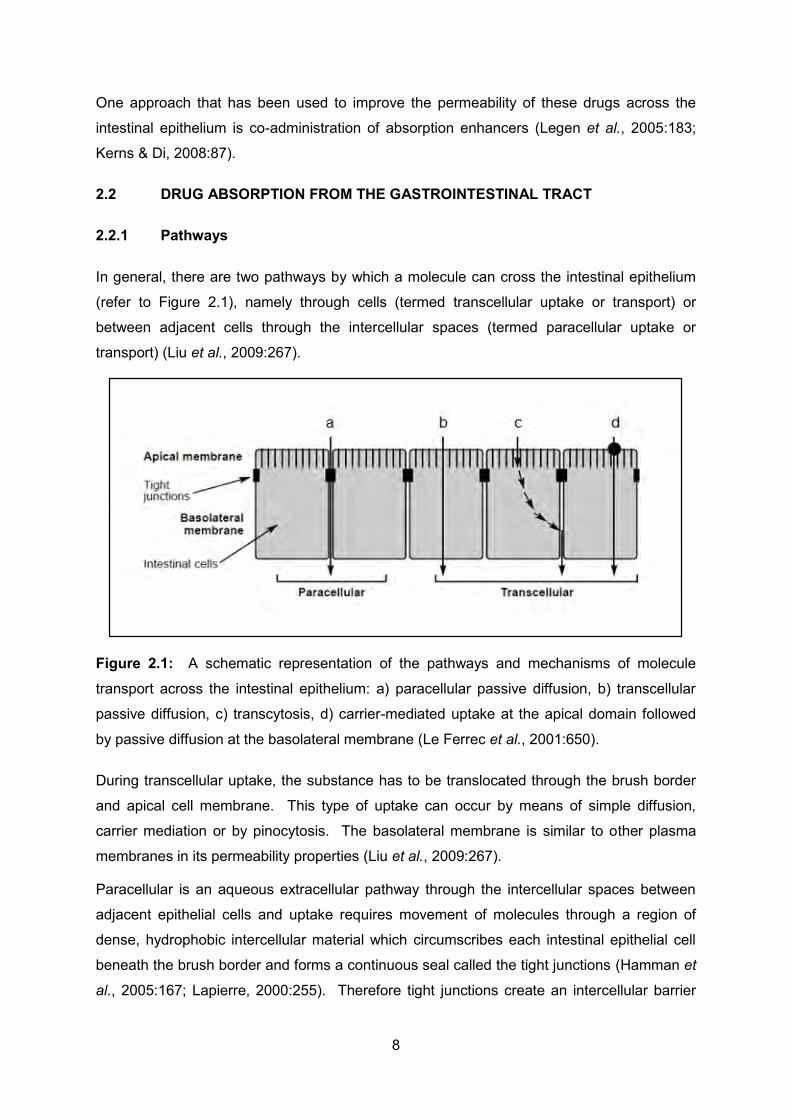
In general, there are two pathways by which a molecule can cross the intestinal epithelium
(refer to Figure 2.1), namely through cells (termed transcellular uptake or transport) or
between adjacent cells through the intercellular spaces (termed paracellular uptake or
transport) (Liu et al., 2009:267).
Figure 2.1: A schematic representation of the pathways and mechanisms of molecule
transport across the intestinal epithelium: a) paracellular passive diffusion, b) transcellular
passive diffusion, c) transcytosis, d) carrier-mediated uptake at the apical domain followed
by passive diffusion at the basolateral membrane (Le Ferrec et al., 2001:650).
During transcellular uptake, the substance has to be translocated through the brush border
and apical cell membrane. This type of uptake can occur by means of simple diffusion,
carrier mediation or by pinocytosis. The basolateral membrane is similar to other plasma
membranes in its permeability properties (Liu et al., 2009:267).
Paracellular is an aqueous extracellular pathway through the intercellular spaces between
adjacent epithelial cells and uptake requires movement of molecules through a region of
dense, hydrophobic intercellular material which circumscribes each intestinal epithelial cell
beneath the brush border and forms a continuous seal called the tight junctions (Hamman et
al., 2005:167; Lapierre, 2000:255). Therefore tight junctions create an intercellular barrier

9
limiting paracellular passing of water molecules, solutes (e.g. salts) and other materials
across epithelia (Van Itallie & Anderson, 2014:157). However, the tight junctions prevent
movement of larger molecules through the intercellular spaces (also referred to as fence
function) (Artursson et al., 2012:282).
2.2.2 Mechanisms of drug absorption
2.2.2.1 Transcellular passive diffusion
In this process, drug molecules move from a region of high concentration in the
gastrointestinal tract lumen through the cellular lipid bilayer membrane to a region of lower
concentration in the blood. The drug molecules pass through the apical membrane of the
epithelial cells, then pass through the cytoplasm and exit the cells through the basolateral
membrane (Liu et al., 2009:268; Kerns & Di, 2008:87). No external energy is expended and
the rate of transport is determined by three factors, namely the concentration gradient of the
drug across the membrane, the character of the membrane and the physicochemical
properties of the drug molecule (Shargel et al., 2005:375; Asford, 2007a:279).
At first, the drug will desolvate from the aqueous fluids within the gastrointestinal tract and
partition into the lipoidial-like membrane of the epithelium, where after the solute will diffuse
through the cytoplasm of the epithelial cells to the capillary blood vessels. A much lower
concentration will be maintained in the blood than at the absorption site due to rapid
distribution into the tissues and relatively fast flow of the blood (Ashford, 2007b:279).
2.2.2.2 Carrier-mediated transport
A large amount of absorption transporter proteins are expressed in the small intestinal
mucosa and are responsible for transcellular absorption of certain drugs, nutrients and
vitamins (Hildalgo, 2001:388). Transport proteins may be functionally divided into channels,
pumps and carriers according to dissimilarities in the mechanism facilitating the transport of
ions and non-electrolytes. Mainly two specialised carrier-mediated transport systems exist in
the human body, namely active transport and facilitated diffusion (Grassl, 2012:153; Dobson
& Kell, 2008:205).
2.2.2.2.1 Active transport
This type of transport involves the active participation of transporter proteins in the apical cell
membrane of the columnar absorptive epithelial cells. A carrier-drug complex is formed
when a carrier (or transporter protein) binds to a drug molecule and the complex is
transported through the membrane. The drug molecule is liberated on the other side of the

10
epithelial membrane. After delivery of the drug, the carrier returns to the surface of the cell
membrane to await the arrival of another molecule (Asford, 2007a:281). The carrier
molecule may be structurally selective for a drug molecule and therefore not all drugs will be
transported by the same carrier. This transport system may become saturated due to the
fact that only a certain number of carrier molecules are available (Shargel et al., 2005:380).
Active transport is characterised by the transport of drug molecules against a concentration
gradient, i.e. transport occurs from a lower to a higher concentration region. It is therefore
an energy-consuming process acquiring it either from hydrolysis of ATP or from the
transmembranous sodium gradient and/or electrical potential. A variety of carrier-mediated
active transport systems exist. Certain peptides and peptide like drugs make use of peptide
transporters for effective absorption into the systemic circulation (Grassl, 2012:154).
2.2.2.2.2 Facilitated diffusion or transport
Facilitated diffusion is also a carrier-mediated transport process, but differs from active
transport in that it does not transport a drug against a concentration gradient and therefore
does not need energy. Transport by facilitated diffusion is passive and reversible, with the
path of net transport into or out of the cell determined by the direction of the electrochemical
potential variance of the transported molecule (Grassl, 2012:154). This process can also get
saturated and displays competitive inhibition for molecules of similar chemical structure
(Shargel et al., 2005:380).
2.2.2.3 Endocytosis
Endocytosis is the process where a small intracellular membrane-bound vesicle, which
encircles a volume of material, originates when the plasma membrane of the cell
invaginates. This is an energy dependent uptake process, where the invaginated material is
transported to vesicles or lysosomes. Some vesicles’ contents escape enzymatic digestion
and migrate to the basolateral membranes of the cell where it is exocytosed. This uptake
mechanism can be further divided into pinocytosis, receptor-mediated endocytosis,
phagocytosis and transcytosis (Silverstein et al., 1977:673).
2.2.2.3.1 Pinocytosis
Pinocytosis is the process of vesicular uptake of small particles (lipoproteins, colloids and
immune complexes), soluble macromolecules (enzymes, hormones and antibodies), fluid
and low molecular-weight solutes. Small droplets consisting of these materials and

11
extracellular fluid are interiorised in membrane vesicles with an electron-lucent content
(Silverstein et al., 1977:673).
2.2.2.3.2 Receptor-mediated endocytosis
Ligand-receptor complexes are formed when suitable ligands bind with receptors on cell
surfaces (Ashford, 2007b:283). Due to the binding process between the ligand and the
receptor on the cell surface, the receptor undergoes a conformational change causing the
complexes to cluster on the cell surface, they then invaginate and break off from the
membrane to develop layered vesicles. After entering the cytoplasm of the cell, the layered
vesicles lose their coating, resulting in uncoated vesicles which deliver their contents to
endosomes. The internalised receptor typically returns to the cell surface for further binding,
whilst the internalised ligand is sorted and transported to the lysosomes for degradation
(Sato et al., 1996:446).
2.2.2.3.3 Phagocytosis
Phagocytosis describes the uptake of large particles (particles larger than 500 nm) and
possibly some viruses. The uptake process occurs by apposition of a section of plasma
membrane to the particle's surface, excluding most, if not all of the adjacent fluid. Polio and
other vaccines are absorbed from the gastrointestinal tract by phagocytosis (Asford,
2007a:283; Silverstein et al., 1977:673).
2.2.2.3.4 Transcytosis
Transcytosis can be defined as being an active process where material (e.g.
macromolecules, ions and vitamins) can be transported from one side of the cell to the other
in vesicles. This process can be selective receptor-mediated, but also non-selective in the
fluid phase of the vesicle (Di Paquale & Chiorini, 2006:506).
2.2.2.4 Paracellular pathway
The paracellular pathway is the only route through which drug molecules are being
transported through aqueous, extracellular spaces rather than across membranes.
Hydrostatic pressure, electrical potential as well as the electrochemical potential gradients
between the two sides of the epithelium, serves as the driving forces behind the movement
of molecules via the paracellular pathway (Asford, 2007a:283).
Generally, transport across the intestinal epithelium by the paracellular pathway is minimal,
due to the presence of tight junctions between the cells. Only small hydrophilic molecules
12
are allowed to pass between the cells, unless an absorption enhancer is present in the drug
formulation (Liu et al., 2009:267).
The paracellular route is mostly reserved for hydrophilic drugs and peptides which are slowly
and incompletely passively absorbed and poorly distributed into the cell membranes. These
protein and peptide drugs are rather transported through the water-filled pores of the
paracellular pathway across the intestinal epithelium (Artursson et al., 2001:281). New
approaches to increase the paracellular absorption of protein and peptide drugs across the
gastro-intestinal tract are continuously investigated. In general, these approaches are
divided into two main groups; namely, (1) physicochemical modification of the absorption
enhancer, and (2) moderating the tight junctions associated with the paracellular pathway
(Salamat-Miller & Johnston, 2005:203).
2.3 BARRIERS TO INTESTINAL ABSORPTION
The main purpose of the gastrointestinal tract is the digestion and uptake of nutrients,
electrolytes and fluids, whilst also being responsible for the protection of the human body
against a systemic attack of harmful agents such as toxins, antigens and pathogens
(Lennernäs, 1998:406).
After drug molecules have dissolved in the gastrointestinal fluids, they stay in solution and
do not become bound to food or any other material present in the gastrointestinal tract
lumen. The drug molecules should also be able to tolerate the pH variation of the
gastrointestinal tract regions and resist luminal enzymatic degradation. The drug molecules
need to diffuse across the mucus layer without binding to it, across the unstirred water layer
before crossing the main cellular barrier, the gastrointestinal membrane. To finally reach the
systemic circulation, the drug has to encounter the liver and metabolising enzymes. It is
possible these barriers can prevent some or the entire drug reaching systemic circulation,
ultimately leading to a decreasing bioavailability (Daugherty & Mrsny, 1999:144; Liu et al.,
2009:265).
The barriers (Figure 2.2) limiting the absorption of certain drugs can be classified into
physical and biochemical groups.

13
Figure 2.2: Schematic illustration of the barriers which can potentially limit drug absorption
(Asford, 2007a:276)
2.3.1 Physical barriers
The physical barrier consists mainly of the epithelial cell lining, which include the cell
membranes and tight junctions between adjacent epithelial cells (Hamman et al., 2005:166).
2.3.1.1 Unstirred water layer
The intestinal epithelial cells are covered by the unstirred water layer also known as the
aqueous boundary layer consisting of water, mucus and glycocalyx. Due to mechanical
movements of the gastrointestinal muscles, incomplete mixing of the luminal contents occurs
leaving this thin unmixed water layer near the intestinal mucosal surface. Diffusion of drugs
across this 30 to 100µm thick aqueous layer (offering resistance) is necessary in order to be
absorbed by intestinal cells (Hamman, 2007:102; Ashford, 2007b:279).
2.3.1.2 Membranes of the intestinal epithelial cells
The gastrointestinal epithelial cell membranes act as the main barrier to drug absorption
from the gastrointestinal tract and functionally separate the lumen from the stomach as well
as the intestines from the systemic circulation. As can be seen in Figure 2.3, the cell
membrane’s bilayer structure consists of proteins, lipids, lipoproteins and polysaccharides,
as well as transport proteins or carrier molecules. The cell membrane has the
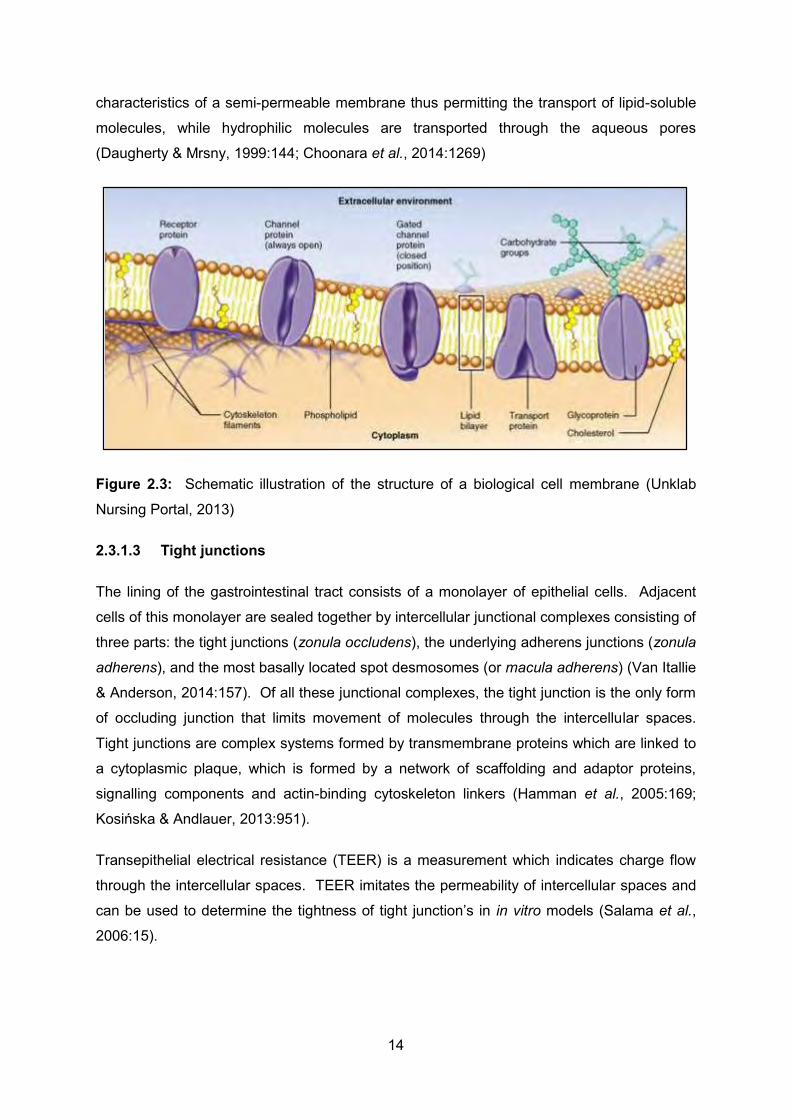
14
characteristics of a semi-permeable membrane thus permitting the transport of lipid-soluble
molecules, while hydrophilic molecules are transported through the aqueous pores
(Daugherty & Mrsny, 1999:144; Choonara et al., 2014:1269)
Figure 2.3: Schematic illustration of the structure of a biological cell membrane (Unklab
Nursing Portal, 2013)
2.3.1.3 Tight junctions
The lining of the gastrointestinal tract consists of a monolayer of epithelial cells. Adjacent
cells of this monolayer are sealed together by intercellular junctional complexes consisting of
three parts: the tight junctions (zonula occludens), the underlying adherens junctions (zonula
adherens), and the most basally located spot desmosomes (or macula adherens) (Van Itallie
& Anderson, 2014:157). Of all these junctional complexes, the tight junction is the only form
of occluding junction that limits movement of molecules through the intercellular spaces.
Tight junctions are complex systems formed by transmembrane proteins which are linked to
a cytoplasmic plaque, which is formed by a network of scaffolding and adaptor proteins,
signalling components and actin-binding cytoskeleton linkers (Hamman et al., 2005:169;
Kosińska & Andlauer, 2013:951).
Transepithelial electrical resistance (TEER) is a measurement which indicates charge flow
through the intercellular spaces. TEER imitates the permeability of intercellular spaces and
can be used to determine the tightness of tight junction’s in in vitro models (Salama et al.,
2006:15).
15
2.3.2 Biochemical barriers
The transit of drug molecules across the intestinal epithelium into the systemic circulation is
further complicated by biochemical processes (Gan & Thakker, 1997:83). The biochemical
processes which may affect drug absorption include the efflux of molecules into the intestinal
lumen from within the epithelial cells, as well as the enzymatic degradation of molecules in
the gastrointestinal lumen (Hamman et al., 2005:168; Choonara et al., 2014:1271).
2.3.2.1 Efflux of drugs from the intestine
Several transporter proteins exist in the intestinal epithelial cells, some facilitating drug
absorption while others inhibit the absorption of drugs. The latter are called counter-
transporter efflux proteins and P-glycoprotein is one of the key proteins in this group,
facilitating the secretion of drugs from inside the cell back out into the intestinal lumen.
P-glycoprotein is an energy-dependent, membrane-bound protein expressed at high levels
on the apical surface of the brush border membrane but also in other tissues such as the
blood-brain barrier, liver and kidneys (Asford, 2007a:283; Shargel et al., 2005:399,400).
2.3.2.2 Enzymatic degradation in the lumen
One of the most challenging obstacles towards the oral delivery of peptides is the enzymatic
barrier. This barrier is difficult to overcome as degradation takes place at more than one site
since enzymes are ubiquitous (Lee et al., 1991:305).
Due to the acidic environment of the gastric fluids, denaturation and degradation of protein
molecules occurs through the attainment of similar charges initiating internal repulsion or the
decrease in attractive forces that are responsible for holding the protein molecule together
(Cantor, 1994:95). Furthermore, enzymatic activity assists in the hydrolytic, irreversible
cleavage of proteins and peptide molecules into amino acids and small, absorbable
oligopeptides (Fei et al., 1994:563; Zhou, 1994:239). Chemical digestion of proteins in the
intestinal tract is also activated by pepsin (with minimal absorption) because of the small
surface area and non-absorptive environment of the epithelium (Lee et al., 2001:573). The
small intestine is responsible for the majority of absorption, however, the enzymes of the
pancreas and brush-border (e.g. trypsin, chymotrypsin, exopeptidases and endopeptidases)
contribute to the breakdown of protein and peptide molecules into non-essential amino acids
(Zhou, 1994:239; Lee, 2002:572).

16
2.4 DRUG ABSORPTION ENHANCERS
2.4.1 Chemical permeation enhancers
The intestinal absorption of protein and peptide molecules can be improved by the co-
administration of amphiphilic, low molecular mass absorption enhancing agents, which act
as functional adjuvants. Absorption enhancers can be described as compounds which
reversibly eradicate the barrier of the outer layer of the body tissues with minimum tissue
damage, thus permitting the drug to penetrate through the epithelial cells and move into the
blood and lymph circulation (Muranishi, 1990:3).
Absorption enhancers exert their effects by one or a combination of more mechanisms,
including the interference and opening of tight junctions to increase paracellular permeability
(leakage of peptides or proteins), a decrease in mucus viscosity and an increase in
membrane fluidity (Choonara et al., 2014:1269; Hamman et al., 2005:168).
Various classes of compounds with diverse chemical properties (Table 2.1) have shown
potential to enhance the intestinal absorption of small hydrophilic molecules and/or large
polypeptide drugs.

17
Table 2.1: Classification of intestinal permeation enhancers (Hamman, 2007:187)
Absorption enhancer Examples Mechanism of action
Salicylates Sodium salicylate,
Salicylate ion
Increasing cell membrane fluidity, decreasing concentration of non-protein thiols, prevention of protein aggregation or self-association
Fatty acids Medium chain glycerides,
Long chain fatty acid esters (palmitoylcarnitine)
Paracellular (e.g. sodium caprate dilates tight junctions) and transcellular (epithelial cell damage or disruption of cell membranes)
Bile salts Sodium taurocholate, Sodium taurodeoxycholate, Sodium taurodihydrofusidate
Disruption of membrane integrity by phospholipid solubilisation and cytolytic effects, reduction of mucus viscosity
Surfactants
Ionic: Sodium dodecyl sulfate, Sodium dioctyl sulfosuccinate
Nonionic: Polysorbitate, Tween 80
Membrane damage by extracting membrane proteins or lipids, phospholipid acyl chain perturbation
Chelating agents
Ethylene diamine tetraacetic acid (EDTA), ethylene glycol tetraacetic acid (EGTA), salicylates, citric acid
Complexation of calcium and magnesium (tight junction opening)
Complexation Cyclodextrins Increase aqueous solubility and dissolution rate
Ion pairing Counterion Ionised drug and counterion form a more lipophilic ion pair which can partition into the membrane.
Toxins and venom
extracts
Zonula occludens toxin (ZOT)
Melittin (bee venom extract)
Interaction with the zonulin surface receptor induces tight junction opening, -helix ion channel formation, bilayer micellisation and fusion
Efflux pump inhibitors 1st, 2nd & 3rd generation
Blocking drug binding site on P-gp, interfere with ATP hydrolysis and altering cell membrane integrity
Anionic polymers Poly(acrylic acid) derivatives
Combination of enzyme inhibition and extracellular calcium depletion (tight junction opening)
Cationic polymers
Chitosan salts
N-trimethyl chitosan chloride
Combination of mucoadhesion and ionic interactions with the cell membrane (tight junction opening)
18
2.4.2 Aloe materials as absorption enhancers
2.4.2.1 Botany of the aloe species
Aloe is a succulent plant belonging to the Xanthorrhoeaceae family, characterised by fibrous
roots as well as a number of stemless, thick, fleshy leaves which are enlarged to
accommodate aqueous tissue, whilst most contain thorns along their edges (Cousins &
Witkowski, 2012:1). Aloe species, of which there are more than 360 species of the genus
identified worldwide, are widely represented in southern Africa and particularly in South
Africa, where they form a conspicuous element of the landscape, taking on many different
growth forms and inhabiting a wide range of habitats (Van Wyk & Smith, 2005:7). There are
160 species indigenous to South Africa (Steenkamp & Stewart, 2007:411) which provoke
widespread interest amongst scientists and plant collectors for taxonomic, chemotaxonomic,
ecotouristic and ethnomedicinal reasons (Cousins & Witkowski, 2012:1). Research of the
therapeutic uses of aloe is mostly based on Aloe vera and therefore it is of utmost
importance for researchers to investigate and define the pharmaceutical applications and
medicinal uses of other aloe species (Loots et al., 2007:6891).
2.4.2.2 Aloe species indigenous to South Africa selected for this study
2.4.2.2.1 Aloe vera
Aloe vera is a stemless or very short-stemmed plant growing 60 to 100 cm in height,
spreading by offsets. This plant originated from North Africa or Arabia, but is nowadays
widely cultivated in many parts of the world, particularly in the West Indies (Van Wyk &
Smith, 2005:12). Each plant usually has 12 to 16 thick fleshy leaves in rosette, which gives
it a distinct appearance and weighs up to 2 to 3 kg on maturity. It produces erect
unbranched flowering stalks in its second year, during the winter season, which grows 90 to
150 cm tall. The leaves are green to grey-green with some varieties showing white flecks on
the upper and lower stem surfaces. The margin of the leaf is serrated and has small white
teeth. Flowers are produced in summer on a spike up to 90 cm in height, each flower
pendulous, with a yellow tubular corolla 2 to 3 cm long (Nandal & Bhardwaj, 2012:69).

19
Figure 2.4: A photograph of the leaves of an Aloe vera plant (Aloe Vera.com, 2014)
2.4.2.2.2 Aloe ferox
Aloe ferox is a tall, single-stemmed aloe which can reach a height of 2 to 5 metres. This
species has a distribution range that covers a wide variety of habitats from the Swellendam
area in the south-eastern parts of South Africa, throughout the Western Cape, Eastern
Cape, Southern KwaZulu-Natal and South-Eastern part of the Free State, with a few
localities in South-Western Lesotho in bush or open areas, on hillsides and in semi-karoid
scrub. The dull green to bluish leaves of Aloe ferox are edged with reddish spines and are
arranged in a rosette, marked with orange-red, red, yellowish and even white flowers (Van
Wyk & Smith, 2005:56; Kumbula Indigenous Nursery, 2014).
a b
Figure 2.5: A photograph of a) an Aloe ferox plant (The Highway Online, 2012) and b) the
leaves and yellow, bitter sap of the Aloe ferox plant (Alcare Aloe Skin, 2008)

20
2.4.2.2.3 Aloe marlothii
Aloe marlothii is a large plant, usually 2 to 4 m, but occasionally up to 10 m tall, found widely
in southern Africa, including Botswana, Mozambique, Swaziland and South Africa. Aloe
marlothii seldom branches and consists of a dense rosette-like crown and persistent dried
leaves covering the stem. The leaves are dull green-brown, succulent, broad at the base
and tapering to a sharp tip with irregular brown spines on the surfaces and margins. The
inflorescence is a spreading, branched panicle with up to 30 racemes borne more or less
horizontally. The tubular flowers vary from rich yellow to red, becoming lighter in colour on
opening (Kew Royal Botanic Gardens, 2013; Van Wyk & Smith, 2005:62).
a b
Figure 2.6: A photograph showing a) the Aloe marlothii plant (World of Succulents, 2013)
and b) the crude leaves of the Aloe marlothii plant (ISpot, 2009)
2.4.2.3 Composition of aloe leaves
The aloe plant has elongated and pointed leaves (Ni et al., 2004:1746), which consist of
three parts, namely an outer (green) rind, aloe latex and an inner clear pulp; the last two
parts of the leaves are widely used for therapeutic purposes (Hamman, 2008:1601). Aloe
latex is the bitter yellowish exudate originating from the pericyclic tubules underneath the
outer rind of the leaves and is composed of hydroxyanthracene derivatives such as the
anthraquinone glycosides, aloin A and B. The inner clear colourless pulp, commonly
referred to as the mucilaginous gel or leaf parenchyma, forms the major part of the volume
of the leaves. The gel consists primarily of water (>98%) and polysaccharides such as
mannose derivatives, pectins, cellulose, hemicellulose, glucomannan and acemannan.
Acemannan is composed of a long chain of acetylated mannose and is considered the main
21
functional component of the aloe leaf (Djeraba & Quere, 2000:366; Femenia et al.,
2003:397; Lee et al., 2001:1276).
2.4.2.4 Biological activities
The large thin-walled parenchyma cells, forming the innermost pulp or gel, are used for the
external treatment of conditions such as wounds, skin irritations, minor burns, infections and
parasite infestations (Ni et al., 2004:1746; Grace et al., 2008:605,606). Internally, it is used
for the treatment of constipation, coughs, ulcers, malaria and as an oral contraceptive by
women (Amoo et al., 2014:23-29).
By means of a randomised, double-blind clinical trial, the effect of A. vera juice on oral
bioavailability of selected vitamins was studied in humans and showed that it improved the
absorption of vitamins C and E. When the aloe juice was administered with vitamin C, the
bioavailability was 3 times higher compared to the control and even after a period of 24
hours, the level of this vitamin was significantly higher (p ≤ 0.05) than the baseline. For the
co-administration of the aloe juice with vitamin E, the bioavailability was 3.7 times higher
than administration of the vitamin alone (Vinson et al., 2005:760).
In an in vitro study by Chen et al. (2009:281), it was shown that A. vera gel significantly
decreased the transepithelial electrical resistance (TEER) of intestinal epithelial cell
monolayers (Caco-2 cell line). The TEER reduction by the aloe gel material indicates the
opening of the tight junctions between adjacent epithelial cells and shows the potential for
absorption enhancement of protein and peptide drugs. The transport of the macromolecule
drug across the Caco-2 cell monolayers, insulin, was significantly increased by A. vera gel
(Chen et al., 2009:281).
More intestinal applications of the aloe species include a study where the in vitro absorption
enhancing ability of gel materials of Aloe marlothii, Aloe ferox and Aloe speciosa were tested
across excised rat intestinal tissue and Caco-2 cell monolayers. The aloe gel materials
showed the ability to reduce the transepithelial electrical resistance as well as enhancing the
transport of FITC-dextran (Lebitsa et al., 2012:297).
An attempt has been made to study the effect of topical Aloe vera gel as an adjuvant in a
submucosal local injection to the treatment of oral submucous fibrosis, a chronic,
progressive disease of the oral mucosa and oropharynx. It was shown that Aloe vera gel
had the ability to act as an effective adjuvant in the treatment of oral submucous fibrosis by
reducing the burning sensation by 92.4% in the first month of treatment and continued this

22
reduction even after the completion of treatment and up to the six month follow-up (Alam et
al., 2013:717).
Aloe vera, Aloe marlothii and Aloe ferox also appeared to influence hydration and anti-
erythema effects positively. In a transdermal study by Fox et al. (2014:392), these three
natural plants were evaluated in human subjects and were found to improve the hydration of
the skin after a single application and some over a period of time (Fox et al., 2014:392).
2.4.3 Chitosan and derivatives
Chitosan is a ß-(1,4) linked polymer of 2-amino-2-deoxy-D-glucose and is obtained by
deacetylation of chitin, the second most copious natural polymer after cellulose. Chitosan is
a non-toxic, biocompatible polymer which has the ability to increase the paracellular
permeability of peptide drugs across the mucosal epithelium, thus acting like an absorption
enhancer of hydrophilic macromolecular model compounds such as insulin and buserelin
(Thanou et al., 2001:117; Thanou et al., 1999:74).
Due to chitosan’s limited solubility and efficiency as intestinal absorption enhancer in the
small intestine (at neutral to alkaline pH values), chitosan derivatives, such as N-trimethyl
chitosan chloride (TMC), have been evaluated and found to overcome chitosan’s limitations.
It has been shown that TMC can significantly increase the absorption of peptide drugs
across the intestinal epithelia by the mechanism similar to that of protonated chitosan. It
widens the fenestrae of the tight junctions without damaging the cell membrane nor altering
the viability of intestinal epithelial cells (Thanou et al., 2001:117).
2.4.4 Other methods to enhance bioavailability
2.4.4.1 Enzyme inhibitors
Enzyme inhibitors bring about their effects by binding reversibly or irreversibly to the target
enzyme, inactivating and decreasing its activity thereby targeting the enzymatic barrier which
hinders the successful oral absorption of proteins and peptide drugs. Depending on the
target enzyme that is required to be inactivated, intestinal protease inhibitors such as
aprotinin (inhibitor of trypsin and chymotrypsin), soybean trypsin inhibitor (inhibitor of
pancreatic endopeptidases), FK448 (chy- 381 motrypsin inhibitor) and chicken ovomucoid
(trypsin inhibitor) are available for intestinal enzyme inhibition (Choonara et al., 2014:1270).
Various studies, both in vivo and in vitro, have demonstrated the successful oral delivery of
insulin following co-administration of specific enzyme inhibitors. However, due to possible
adverse effects, feedback-regulated protease secretion, intestinal mucosal damage and the
23
digestion of dietary proteins, the use of enzyme inhibitors in chronic therapy is still
questionable. A possibility to overcome these effects is the usage of delivery systems which
offer simultaneous release of the drug and inhibitor whilst keeping them concentrated in a
limited area, immobilising an enzyme inhibitor on the delivery system or ensuring the contact
of the system with the mucosa is closer (Bernkop-Schnurch, 1998:2).
2.4.4.2 Bio-adhesive systems
Bioadhesion describes the prolonged contact between a drug delivery system and the
gastrointestinal mucosa due to adhesion. Two other terms are frequently used
synonymously with bioadhesion, namely mucoadhesion which refers to a bond between the
mucus layer and drug delivery system and cytoadhesion, which refers to very specific
interactions between an adhesive agent and the receptor-ligand interaction comparable to
the cell surface (Chickering & Mathiowitz, 1999:353; Bernkop-Schnurch, 1998:11).
The development of bioadhesive drug delivery systems aimed to extend the residence time
of a drug delivery system at the target absorption site. This intensifies contact with the
mucosa, which leads to a higher drug concentration gradient, ensuring instantaneous
absorption without degradation or dilution in the luminal fluids and localising the drug
delivery system at a certain site (Easson et al., 1999:410; Junginger, 1991:1058; Hejazi &
Amiji, 2003:157).
A pH sensitive mucoadhesive polymer (polymethacrylic acid-g-ethylene glycol)[P(MAA-g-
EG)], was used to encapsulate insulin showing pH-dependent swelling behaviour, due to
formation or dissociation of inter-polymer complex [MAA-g-EG] polymer. When the
bioavailability of insulin encapsulated in a pH sensitive mucoadhesive polymer was
compared to insulin alone, a 10% higher bioavailiabilty was obtained (Lowman & Peppas,
1997:4959; Peppas & Klier, 1991:209).
2.4.4.3 Particulate carrier systems
It has been shown that the use of colloidal polymeric particulate drug delivery systems could
avoid the barriers to oral drug delivery. A large number of particle carrier systems for protein
and peptide delivery such as emulsions, nanoparticles, microspheres and liposomes have
been used to protect the protein contents against the harsh environment of the
gastrointestinal tract (acidic medium and enzymes), controlling the release rate and targeting
the drug delivery to specific intestinal sites (Hamman et al., 2005:173; Muheem et al.,
2014?).
24
Many examples of polymeric carrier systems for improved drug delivery exist in scientific
literature, e.g. one study showed that a liposomal system containing insulin and sodium
taurocholate markedly reduced the blood glucose levels after oral administration and
showed a high in vitro / in vivo correlation (Degim et al., 2004:2819).
2.4.4.4 Site-specific delivery
Differences in the composition and thickness of the mucus layer, pH, surface area and
enzyme activity leads to absorption not being uniform throughout the gastrointestinal tract
and site-specific absorption occurs (Daugherty & Mrsny, 1999:149). To increase peptide
drug absorption after oral administration, the release of the drug should be in a particular
region of the gastrointestinal tract where uptake into the lymph system is maximised or
where enzyme activity is low (Sarciaux et al., 1995:130).
2.5 MODELS TO STUDY DRUG ABSORPTION AND PHARMACOKINETIC INTERACTIONS
In the development of new chemical entities as drugs, the evaluation of permeability
properties is essential. Intestinal permeability and sufficient aqueous solubility are
necessary after oral administration of a drug in order to reach therapeutic concentrations in
the blood (Balimane et al., 2000:301; Balimane & Chong, 2005:335).
Appropriate cost-effective screening models have been developed to assess these
properties (Balimane & Chong, 2005:335) and will be reviewed shortly in the following
sections. Figure 2.7 shows some of the most popular pre-clinical methods used by drug
delivery scientists when assessing the intestinal epithelial permeability of drugs during the
development phase. These techniques can be divided into in vivo, in situ, in vitro and in
silico models. In vivo experiments are performed in live animals, while in situ screens are
done in the actual organ within the intact organism under study. In vitro models include cell
cultures (e.g. Caco-2 cells and Mardin-Darby canine kidney [MDCK] cells), excised animal
tissue (e.g. the Ussing Chamber, membrane vesicles and everted gut), membranes (e.g.
parallel artificial membrane permeability assay [PAMPA]) and immobilised artificial
membrane chromatography. In silico is the study of drug permeability using computer-
generated models (Balimane & Chong, 2005:336).

25
Figure 2.7: Different models for screening of drugs during the discovery and developmental
phases (Varma et al., 2003:353)
2.5.1 In vivo models to study intestinal absorption
Drugs are administered orally to measure their permeation from the gastrointestinal tract to
the blood and tissue compartments of the body by using in vivo models (Hildalgo, 2001:389).
As the anatomy of mammals display functional resemblance with that of humans (Hildalgo,
2001:389), the characteristics of drug absorption in animals can, in most cases, be sufficient
as a reliable predictor of the biological factors which can influence the intestinal absorption of
drugs in humans. The most frequently used animal model is the rat, since it better reflects
the human situation with respect to paracellular space and metabolism (Kararli, 1995:372).
The advantages of in vivo models is that the dynamic components of the mesenteric blood
circulation, the mucous layer and other biological factors which influence drug dissolution are
integrated (Le Ferrec et al., 2001:653). Another advantage of studies with live animals is

26
that they can be used for studying the pharmacological and toxicological properties of the
investigated drug and P-gp modulator (Hildalgo, 2001:389). However, this model has the
disadvantage of it being impossible to separate the variables involved in the absorption
process, for example the individual rate-limiting factors cannot be identified (Le Ferrec et al.,
2001:653). In addition, the analytical methods necessary for plasma analysis are invasive
and complex and require a large amount of the drug (Hildalgo, 2001:389).
2.5.2 In situ models to study intestinal absorption
The in situ model is a powerful research technique which includes stable, vascularly
perfused preparations of the small intestine. A laparotomy is performed on an anaesthetised
animal, exposing the abdominal cavity. A closed or open loop can be used to introduce the
drug solution in the intestinal segment of interest. In situ models allow the researcher to
analyse drug factors such as formulation-independent breakdown in the stomach under
acidic conditions (Le Ferrec et al., 2001:653).
One of the most distinct advantages of the in situ model over the in vivo model is that the
drug does not have to pass through the stomach and therefore prevent the precipitation of
acidic compounds. In contrast to in vitro models, the in situ model ensures that the intestinal
mucosa, nerve system and blood flow stay intact, together with the expression of enzymes
and transporters (Holmstock et al., 2012:2474; Le Ferrec et al., 2001:653).
2.5.3 In vitro models to study intestinal drug absorption
In the early stages of drug development, it is not possible to use live animals studies as a
high throughput screening tool due to ethical and time limitations. This led to the
development of in vitro models for assessment of intestinal absorption of main compounds
on the large scale (Deferme et al., 2008:187). For the determination of the intestinal
absorption potential of drugs various in vitro methods, such as cell cultures excised animal
tissues, membranes and immobilised artificial membrane chromatography exists, each
having different advantages and disadvantages (Balimane et al., 2000:305; Balimane &
Chong, 2005:336).
The successful application of in vitro models to predict drug absorption across the intestinal
mucosa rest on how accurately the in vitro model mimics the characteristics of the in vivo
intestinal epithelium (Balimane et al., 2000:305). For purposes of this study, only cell-based
in vitro models focusing on Caco-2 cells will be further discussed in detail.

27
2.5.3.1 Cell-based in vitro models
The study of absorption mechanisms, is best executed in a model that contains only cells
responsible for absorption, without the interference of mucus, the lamina propria and the
muscularis mucosa (Le Ferrec et al., 2001:655). Cell monolayer models which mimic the in
vivo intestinal epithelium in humans have been developed and offer rapid assessment of the
intestinal permeability of drugs, making it an ideal in vitro model for research. Human
immortalised (tumour) epithelial cells grow rapidly into confluent monolayers which exhibit
several characteristics of differentiated epithelial cells, unlike enterocytes (Balimane et al.,
2000:305).
Currently, there are a number of cell culture-based in vitro models available to predict the
intestinal absorption of drugs (Table 2.2). Caco-2 cell monolayers are one of the most
popular models for simulation of the intestinal epithelium monolayer and for prediction of
drug absorption across the human small intestinal epithelium (Fearn & Hirst, 2006:172;
Rubas et al., 1996:165).

28
Table 2.2: Cell lines (and their co-cultures) used for intestinal permeability assessment of
drugs (Sarmento et al., 2012:610)
Cell line Origin Main characteristics
Caco-2 Human colorectal carcinoma
Polarised cells; produce P-gp and establish tight junctions, differentiate and express several relevant efflux transporters
TC-7
Caco-2 subclone Similar to Caco-2 cells but with higher brush-border enzymatic content
HT29-MTX
Human colorectal carcinoma cells
Mucin-producing cells
IEC-18
Small intestinal crypt-derived rat cells
Size-selective barrier for paracellularly transported compounds
Caco-2/HT29 co-culture
Human colorectal carcinoma cells
Mimics the small intestinal epithelial layer containing both mucus-producing (HT29) and the columnar absorptive Caco-2 cells
Caco-2/Raji B co-culture
Human colorectal carcinoma cells/
lymphocytes
Simulates the human follicle-associated epithelium; useful for nanoparticle internalisation studies through M cells
Caco-2/HT29/Raji B co-culture
Human colorectal carcinoma cells/
lymphocytes
Mimics different absorption pathways in the same model; useful for mucoadhesive nanoparticle internalisation studies through M cells and mucin-producing cells
2.5.3.1.1 Caco-2 cells
The use of the Caco-2 cell model has grown tremendously and is the most extensively
characterised and useful in vitro screening tool in the field of drug permeability studies and
drug discovery (Artursson, 1990:310; Artursson & Karlsson, 1991:882; Rubas et al.,
1996:168). Caco-2 cells (Table 2.3) derived from human colorectal adenocarcinoma,
undergo extemporaneous enterocytic differentiation in culture and are polarised with well-
established tight junctions between adjacent cells. After the Caco-2 cells reached
confluence, they structurally and functionally differentiate into small intestinal absorptive cells
resembling enterocytes and express typical characteristics, such as the presence of phase I
and phase II metabolic enzymes, membrane transporters, tight junctions between adjacent
cells, P-gp and several transport systems of different molecules (Antunes et al., 2013:9).

29
The expression of cytochrome P450 3A (CYP3A), an enzyme existing in nearly all intestinal
cells, is very weak in Caco-2 cells, therefore forcing the researcher to increase the
expression of CYP3A by intervention. There are two ways to increase the expression of
CYP3A levels in Caco-2 cells, which include treatment with a CYP3A inducer at mRNA level
(1α,25-dihydroxyvitamin D3) and transfection of CYP3A cDNA (Hu et al., 1999:1352).
Regarding phase II enzymes, Caco-2 cells express N-acetyl transferase and glutathione
transferase activity and it has been shown that the presence of P-gp activity in Caco-2
monolayers is higher than those found in vivo (Hunter et al., 1993:345; Burton et al.,
1993:766).
Table 2.3: Characteristics of Caco-2 cells (Le Ferrec et al., 2001:656)
Origin Human colorectal adenocarcinoma
Growth in culture Monolayer epithelial cells
Differentiation 14 to 21 days after confluence in standard culture medium
Morphology Polarised cells, with tight junctions and apical brush border
Electrical parameters High electrical resistance
Digestive enzymes Typical membranous peptidases and disaccharidases of the small intestine
Active transport Amino acids, sugars, vitamins and hormones
Membrane ionic transport Na+/K+ ATPase, H+/K+ ATPase, Na+/H+ exchange, Na+/K+/Cl- co-transport and apical Cl- channels
Membrane non-ionic transporters
Permeability-glycoprotein, multidrug resistant associated protein and lung cancer associated resistance protein
Receptors Vitamin B12, vitamin D3, epidermal growth factor and sugar transporters (GLUT1, GLUT3, GLUT5, GLUT2, SGLT1)
The Caco-2 cells grow as a monolayer and differentiate until confluent on a microporous
filter. It can be seen in Figure 2.8 that the Caco-2 cell model is designed to separate the
apical compartment from the basolateral compartment, which represent the lumen side and
the serosal side of the intestinal epithelia (Le Ferrec et al., 2001:658).

30
Figure 2.8: A schematic representation of culture of Caco-2 cells on a microporous filter (Le
Ferrec et al., 2001:658)
The most distinguished disadvantage associated with Caco-2 cells, is that the performance
of the cell model can be influenced by the culturing conditions. This happens because of the
parental cell line’s intrinsic heterogeneity, which results in a selection of subpopulations of
cells becoming prominent in the culture. In addition, it has been found that clonal cell lines,
which have been secluded from the parental line, display a more homogeneous expression
of differentiation traits but do not always express all the characters of the parental line
(Sambuy et al., 2005:2).

31
CHAPTER 3 SYNERGISM, ANTAGONISM AND ADDITIVE
EFFECTS ___________________________________________________________________
3.1 INTRODUCTION
From ancient times, the therapeutic significance of synergistic interactions has been known
and various natural healing systems have been dependent on this principle, believing that
combination therapy may result into enhanced efficacy (Van Vuuren & Viljoen, 2011:1168).
In modern days it is still believed that the efficacy of many phytomedicines available on the
market, consisting of a combination of plant extracts, are due to synergistic interactions
between components of an individual herb or between a combination of herbs (Williamson,
2001:401). The use of combinations of drugs is not limited to herbal medicine, but is
routinely employed in combination chemical drug treatment consisting of two or more
individual drugs (Williamson, 2001:401; Van Vuuren & Viljoen, 2011:1168). Examples of
clinical situations where multiple drugs are concomitantly administered resulting in some
form of interaction i.e. synergistic, antagonistic or additive include:
Antibiotic combinations resulting in a higher efficacy, less side effects and reduced
development of resistance, e.g. β-lactam antibiotic, penicillin in combination with
clavulinic acid (sulbactam or tazobactam) antagonises the penicillinase resistance (Lee
et al., 2003:1517; Wagner & Ulrich-Mezenich, 2009:104; Breitinger, 2012:143).
Cytotoxic drug combinations in the treatment of cancer requires lower doses of each
drug to achieve better therapeutic efficacy with less side effects and toxicity, e.g. cancer
therapy where the processes essential for the tumour’s survival is supressed or activated
with multiple drugs rather than destruction of the tumour (Wagner & Ulrich-Mezenich,
2009:98).
The effect of one drug may be improved by another drug which does not produce such
an effect on its own (Breitinger, 2012:143).
Many serious clinical situations require administration of several drugs simply because of
multiple therapeutic indications (Breitinger, 2012:143).
Breitinger (2012:143) states that not only pharmacological mechanisms must be considered
at synergistic effects but also parameters such as drug absorption, tissue distribution and
clearance. It was previously shown that it is possible to obtain an increased drug absorption

32
enhancement effect by combining absorption enhancing agents. Combining different
absorption enhancers resulted in both an increased reduction of the transepithelial electrical
resistance (TEER) and transport of a macromolecular drug across intestinal epithelial cell
monolayers. It was further shown that the absorption enhancers in combination exhibited
higher effects on the epithelial cells at lower concentrations compared with the individual
absorption enhancers (Enslin et al., 2008:1343). Wagner and Ulrich-Mezenich (2009:99)
stated that a reduction in the dose (or concentration) to produce the same effect will cause a
reduction in the potential of adverse effects. The search for more effective drug absorption
enhancers and the potential of synergistic enhancer formulations through combinations
formed the rationale and motivation for this study.
3.2 DEFINITION OF SYNERGISM, ANTAGONISM AND ADDITIVE EFFECTS
The term “synergy” refers to “working together” and is derived from the Greek word, syn-
ergos. Synergism is not only applied on medical drug interaction, but has been described in
a variety of settings including technical systems, mechanics and social life (Breitinger,
2012:143; Van Vuuren & Viljoen, 2011:1168). The terminology defining synergism and other
possible interactions are frequently subjected to debate and own interpretation. Since the
term “synergy” has a specific mathematical definition according to the method used to prove
it, it is rather difficult to provide a clear universal definition (Williamson, 2001:98). According
to Breitinger (2012:143), a general understanding of the concept of “synergy” refers to as
being an effect of the interaction of two or more components or forces, referred to as the
combination, resulting in the combined effect being greater than the sum of their individual
effects. It is clear from this definition that three possible ways of such an “interaction of two
or more components or forces” exists i.e. that the components could produce an effect
greater than the expected result (synergism), the combination could result in an effect less
than the sum of the individual effects (antagonism), or these components do not affect each
other and each component’s effect can simply be added (no interaction) (Breitinger,
2012:143).
In the medical world synergism is also referred to as “polyvalent activity”, “potentiation” or
“super addition”. Tammes (1964:74) defines synergy as a cooperative action of two
components in a mixture leading to a total effect being greater or more prolonged than the
sum of effects of the two components taken separately, whereas Van Vuuren and Viljoen
(2011:1168) refer to synergism as a combination that is significantly higher than the sum of
its components. The outcome of synergism is either an increased therapeutic effect or
reduced side effects, but preferably a combination of both (Williamson, 2001:403).

33
Antagonism (synonym: sub addition) is a much easier concept to define, being a
phenomenon where components in combination have an overall effect which is less than the
sum total of their individual effects and tends to be more easily demonstrated regardless of
the mathematical derivation (Breitinger, 2012:143; Tammes, 1964:74; Van Vuuren & Viljoen,
2011:1169). An additive or summation effect, also referred to as ‘zero-interaction’ or ‘non-
interactive,’ is where the effect of a combination of molecules results in an effect anticipated
by simply adding up the effects of each of the components (Berenbaum, 1989:99). A linear
response is expected when a cooperative action occurs leading to the sum total effect being
equal to the sum of the effects of the components taken separately (Tammes, 1964:74; Van
Vuuren & Viljoen, 2011:1169).
3.3 MECHANISMS OF SYNERGISTIC EFFECTS
The mechanism of action of various phytomedicines is still unknown and several instances
exist where a total herb extract displays an enhanced effect compared to an equivalent dose
of an isolated compound. The reason for the mechanism of action is uncertain, whether it
includes synergy, improved bioavailability, cumulative effects or merely the additive
properties of the components. This will probably implicate a comprehensively new research
approach, for example by investigating mechanisms using biology practices for the single
isolated components as well as in combination, as described by (Wagner, 2011:34). In this
respect, some possible mechanisms of action will be outlined in sections 3.3.1 to 3.3.4.
3.3.1 Multi-target effects
Synergistic multi-target effects are defined as effects obtained from a combination of single
components of a mono-extract or a multi-extract. A mono-extract consists of various
components which affect one target, where a multi-extract combination not only affects one
single target, but a number of targets (which may include enzymes, proteins, receptors, ion
channels, transporter proteins, DNA/RNA, ribosomes and monoclonal antibodies),
consequently resulting in a synergistic effect (Imming et al., 2006:821; Wagner & Ulrich-
Mezenich, 2009:100).
The principle of multi-target effects will show ultimate effectiveness, if secondary symptoms
can also be treated simultaneously. Many plant extracts contain several phytochemical
components as products of primary and secondary metabolites such as polyphenols and
terpenoids. Polyphenols possess a strong binding ability to different molecular structures
such as proteins or glycoproteins, whilst terpenoids have a high potential to permeate

34
through cell walls or bacteria due to their relatively high lipophilic properties (Wagner &
Ulrich-Mezenich, 2009:100; Wagner, 2011:35).
Figure 3.1: A graphic presentation of mono- and multi-target effects produced by a mono-
extract containing many chemical components (Wagner & Ulrich-Mezenich, 2009:100)
As shown in Figure 3.1, the ability of a molecule to bind to only one target will probably lead
to an additive effect, whereas if the single components each bind to several targets, a
potentiated effect leading to synergism can be expected. The hypothesis of multi-target
effects resulting into synergism is based on comprehensive pharmacological and molecular
biological investigations. These investigations involved fractions and isolated mixtures of the
single extract components which showed several targets are involved in the pharmacological
effects (Wagner & Ulrich-Mezenich, 2009:101).
3.3.2 Enhanced solubility, absorption rate and improved bioavailability
The probability exists that different compounds in a plant extract, for example polyphenols or
saponins, lack specific pharmacological effects themselves but have the ability to increase
the solubility and/or absorption rate of other components in the plant extract. This will
improve the other components’ bioavailability and consequently will result in a greater effect
of the plant extract than an isolated constituent (Wagner & Ulrich-Mezenich, 2009:100;
Wagner, 2011:35). An example of this mechanism is the leaf extract of Atropa belladonna
which mainly consists of l-hyoscyamine, however, flavonol-triglycosides are also present in
the extract, which act as absorption catalysers for l-hyocyamin and therefore better overall
effectiveness is obtained (List et al., 1969:181). Another example is Khellin, the main
component of Ammi visnaga, which is fully bioavailable after 10 minutes, whilst pure
Equimolar Khellin is not completely absorbed until 60 minutes (Eder & Mehnert, 2000:928).

35
3.3.3 Supression of resistance mechanisms of bacteria
The third option to achieve synergistic effects is the well-known example of where antibiotics
are used in combination with agents that partly or entirely supress bacterial resistance
mechanisms. One example of this mechanism is the combination of the β-lactam
antibioticum, penicillin, with clavulinic acid which inhibits penicillinase and results in
reduction of the resistance (Lee et al., 2003:1512).
3.3.4 The elimination of side effects by components contained in the extract
This mechanism occurs when a plant extract component, or artificial agent, is added to a
mixture which destroys a toxic constituent in the mixture resulting in better effectiveness in
comparison with the original product. An example of this mechanism of action can be found
in traditional Chinese medicine, where pre-treating the product with heat and the addition of
alcohol, alum and other substances is performed. As an example, there exist four
techniques to decrease the percentage of toxicity of Radix Aconiti (i.e. to reduce aconitin to
0.2%), making this product therapeutically suitable for treatment (Wagner, 2011:35).
3.4 METHODS TO MEASURE SYNERGISM, ANTAGONISM AND ADDITIVE EFFECTS
Several methods exist for the determination of synergism, antagonism and additive effects.
Berenbaum (1989:98) explains that the choice of method is mainly a matter of personal
preference, but the method will also depend on the nature of the problem or study. Due to
plant extracts consisting of complex mixtures of major compounds, minor concomitant
agents and fibres, it is more difficult to prove synergy in phytomedicine (Wagner & Ulrich-
Mezenich, 2009:98). A detailed explanation of the methods which are relevant to plant
extracts for the determination of the type of interaction (i.e. synergistic, antagonistic or
additive) that may exist between combinations is described in sections 3.4.1 to 3.4.7.
3.4.1 Summation of effects
The ‘summation of effects’ is based on the principle that the total effect of a combination is
greater than anticipated from the sum of its effects. This method depends on the
mechanism of action of every individual component of the mixture or combination and
assumes a linear response for each. This method is not applicable to complex mixtures
such as extracts from natural origin (Berenbaum, 1989:98).

36
3.4.2 Comparison of a fixed dose of one component on the dose-response curve of another component
In this method, a comparison of the dose-response curve of a single component is made
with the corresponding curve of the same component using either a fixed amount of a
second component or a fixed dose ratio. It is assumed that if the dose-response curve is
shift parallel by a fixed distance on a linear dose scale, a zero-interaction exists
(Berenbaum, 1989:98; Sühnel, 1998:197). This method has comparable disadvantages to
that of the “summation of effects” method (Williamson, 2001:403).
3.4.3 Comparing the results of a combination of components with that of a single component
This method states that synergy is present if the effect of a combination exceeds those of its
components due to the components assisting each other (Equation 3.1), whilst antagonism
is seen when the effect of a combination is less than that of one or more components
(Equation 3.2) (Berenbaum, 1989:98; Breitinger, 2012:143).
E(da,db) > E(da) Equation 3.1
E(da,db) < E(db) Equation 3.2
where E is the observed effect, and da and db are the doses of components a and b.
3.4.4 Median effect analysis
The median effect equation is a detailed derivation of the Michaelis-Menten enzyme
mechanisms which is based on the enzyme inhibition by one or two non-competitive
inhibitors (Breitinger, 2012:156; Chou, 1976:253):
dM
= Ed1-Ed
Equation 3.3
Where d is the dose of the drug, Ed the effect caused by this amount of drug and M the
median (dose causing 50% effect, i.e. EC50 or IC50).
The median effect equations have the possibility to be rearranged in many useful forms
especially in the form of dose-response curves, connecting ratios of drug doses to ratios of
obtained effects. The median effect equation can be applied on both, mechanism-based
(e.g. Michaelis-Menten) and effect-based (e.g. logistic) equations (Breitinger, 2012:157).
This method has been comprehensively verified and derived from mechanistic as well as
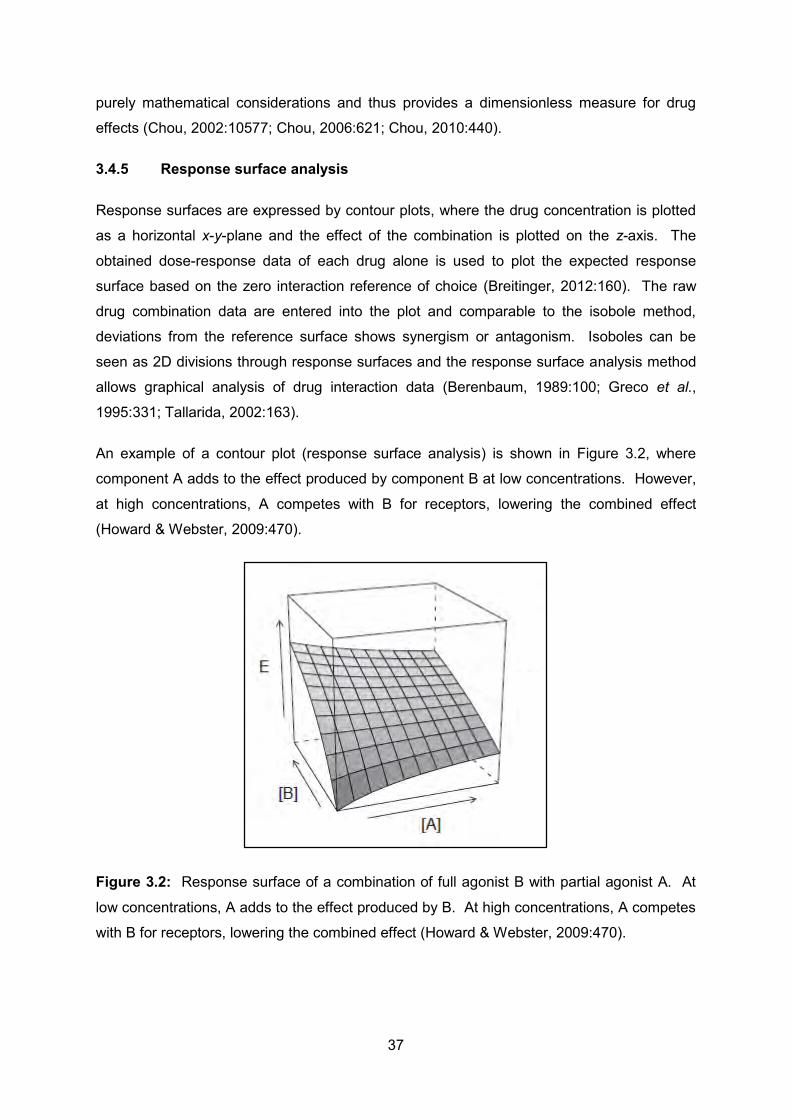
37
purely mathematical considerations and thus provides a dimensionless measure for drug
effects (Chou, 2002:10577; Chou, 2006:621; Chou, 2010:440).
3.4.5 Response surface analysis
Response surfaces are expressed by contour plots, where the drug concentration is plotted
as a horizontal x-y-plane and the effect of the combination is plotted on the z-axis. The
obtained dose-response data of each drug alone is used to plot the expected response
surface based on the zero interaction reference of choice (Breitinger, 2012:160). The raw
drug combination data are entered into the plot and comparable to the isobole method,
deviations from the reference surface shows synergism or antagonism. Isoboles can be
seen as 2D divisions through response surfaces and the response surface analysis method
allows graphical analysis of drug interaction data (Berenbaum, 1989:100; Greco et al.,
1995:331; Tallarida, 2002:163).
An example of a contour plot (response surface analysis) is shown in Figure 3.2, where
component A adds to the effect produced by component B at low concentrations. However,
at high concentrations, A competes with B for receptors, lowering the combined effect
(Howard & Webster, 2009:470).
Figure 3.2: Response surface of a combination of full agonist B with partial agonist A. At
low concentrations, A adds to the effect produced by B. At high concentrations, A competes
with B for receptors, lowering the combined effect (Howard & Webster, 2009:470).

38
3.4.6 The sum of the fractional inhibitory concentration index (ΣFIC)
A widely used and accepted way of measuring an interaction (i.e. synergistic, antagonistic or
additive interactions), is an algebraic equation to determine synergy by means of the
fractional inhibitory concentration index (ΣFIC). This index (i.e. ΣFIC) is expressed as the
interaction of two components in combination, where the concentration of each component
in the combination is expressed as a fraction of the concentration that would result in the
similar effect when used individually (Berenbaum, 1978:122). The ΣFIC is then calculated
for each individual component as indicated in the following equation:
sum FICab = [MIC(a) in combination with (b)MIC(a) independently
+ MIC(b) in combination with (a)
MIC(b) independently] Equation 3.4
where sum FICab is the sum of the fractional inhibitory concentration of component (a) and
component (b), MIC(a) is the minimum inhibitory concentration of component a and MIC(b)
is the minimum inhibitory concentration of component b.
3.4.7 Isobole method
Although the isobole method is a more complicated method, it has the advantage of not
depending on the mechanism of action of each component, can be applied to a variety of
experimental setups and makes no assumption to the behaviour of each component in the
combination or mixture. This method is especially applicable to multiple component mixtures
(Williamson, 2001:304; Breitinger, 2012:155) and is based on the fact that interactions may
vary depending on the ratio in which the two components (absorption enhancers) are
combined (Van Vuuren & Viljoen, 2011:1170).
In the depiction of the isobole graph (Figure 3.3) for a combination or mixture of two
components with the same effect, a graphic demonstration reflects the dose rates of the
individual agents on the x and y axes. The dose combinations are represented by geometric
points with coordinates correlating the dose rate of the single components in the combination
(Williamson, 2001:304; Wagner & Ulrich-Mezenich, 2009:98; Breitinger, 2012:155).

39
Figure 3.3: Isobole graphs representing zero-interaction, synergism and antagonism
(Wagner & Ulrich-Mezenich, 2009:98)
To compile an isobologram, numerous dose combinations are necessary with their effect
level data able to determine the type of interaction. By doing so, the combination
concentration of the components a and b, which are responsible for the synergy effect, can
be inferred from the graph if the mechanism of interaction is independent of the amount of
the single components. However, the quality and quantity of the interaction can depend on
the effect grade (Wagner & Ulrich-Mezenich, 2009:99; Williamson, 2001:403) and can be
described by equations 3.5 to 3.7.
According to Berenbaum (1989:98), the zero-interaction or additive effect relies on the
mechanism that the combined effect of two components a and b is a pure summation effect
(Equation 3.4). This means the components do not interact and the line connecting the
point, which is representative of the single doses with the same effect as the combinations,
will be a straight line (Williamson, 2001:403; Berenbaum, 1989:98).
E(da, db) = E(da) + E(db) Equation 3.5
Where E is the observed effect, and da and db are the doses of agents a and b.
If synergism occurs, the total effect of the two components a and b, which are applied
together as a mixture, must be greater than it would be expected by the summation of the
component’s separate effects (Wagner & Ulrich-Mezenich, 2009:99; Breitinger, 2012:158).
This will result in a concave curve (Figure 3.4) and are defined by Equation 3.6:
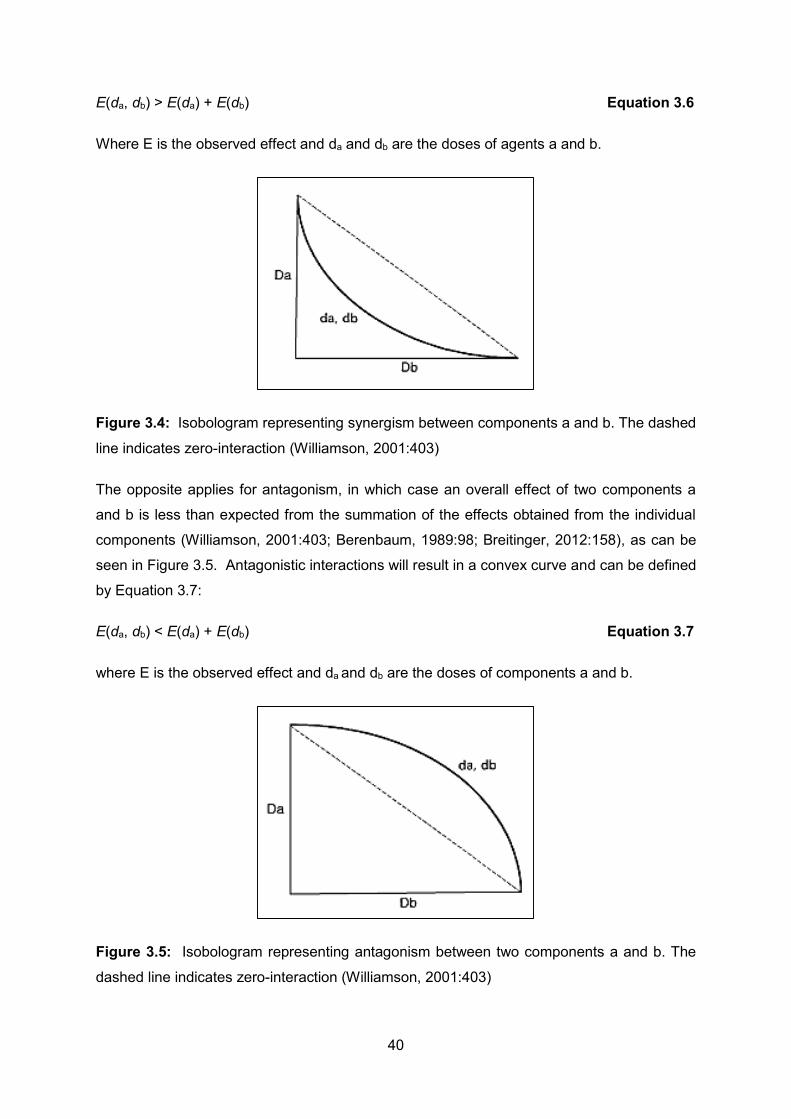
40
E(da, db) > E(da) + E(db) Equation 3.6
Where E is the observed effect and da and db are the doses of agents a and b.
Figure 3.4: Isobologram representing synergism between components a and b. The dashed
line indicates zero-interaction (Williamson, 2001:403)
The opposite applies for antagonism, in which case an overall effect of two components a
and b is less than expected from the summation of the effects obtained from the individual
components (Williamson, 2001:403; Berenbaum, 1989:98; Breitinger, 2012:158), as can be
seen in Figure 3.5. Antagonistic interactions will result in a convex curve and can be defined
by Equation 3.7:
E(da, db) < E(da) + E(db) Equation 3.7
where E is the observed effect and da and db are the doses of components a and b.
Figure 3.5: Isobologram representing antagonism between two components a and b. The
dashed line indicates zero-interaction (Williamson, 2001:403)

41
According to Wagner and Ulrich-Mezenich (2009:99), a lower amount of each of the agents
a and b are required to provide a greater than summation effect in combination in order to
achieve a synergistic effect. The obtained synergistic effect can result in doubling, or even a
greater increase, of the anticipated effect. The possibility also exists that simultaneously
with the dose reduction, the potential of adverse effects of components of a mixture can be
reduced (Wagner & Ulrich-Mezenich, 2009:99).
It is possible to have synergy at one dose combination (or one ratio of the mixture) and
antagonism at another, with the same components in the combination and this would give a
complex isobologram with a wave-like or even elliptical appearance (Williamson, 2001:403).
Berenbaum (1989:103) tested combinations where a particular effect or type of reaction
obtained was not consistent throughout its course. It was further stated that some
combinations, with a specified effect, may cross the zero-interaction line resulting in a
synergistic and antagonistic effect as demonstrated in Figure 3.6 (Berenbaum, 1989:103).
Figure 3.6: Isobole for anaesthetic effects of fluorazepam and hexobarbital displaying a
synergistic region as well as antagonistic region by crossing the zero-interaction line
(Berenbaum, 1989:103)
3.5 CONCLUSION
One of the most effective and practical mathematical methods, in terms of experimental
design to demonstrate synergism as a type of interaction between two components in a
mixture (or combination), is the isobole method designed by Berenbaum (Berenbaum,
1989:93-123). An adapted version of this isobole method was used in this study to
determine if combinations of drug absorption enhancers could produce synergistic effects. A

42
higher percentage reduction in the transepithelial electrical resistance (TEER) and/or
increase in the transport of the macromolecule across the intestinal epithelial monolayer
than expected, when compared to the single components’ effects, will indicate a synergistic
effect which is indicated by a convex curve.
43
CHAPTER 4 EXPERIMENTAL PROCEDURES
___________________________________________________________________
4.1 INTRODUCTION
To assess the intestinal permeability of drug molecules, several in vitro models have been
developed. The effective application of in vitro models for the prediction of intestinal drug
absorption depends on how effective the in vitro model imitates the in vivo intestinal
epithelium (Balimane et al., 2000:305). Numerous in vitro intestinal tissue simulations, such
as Caco-2 cell monolayers and excised intestinal tissue models making use of excised
intestinal tissue pieces obtained from rats, pig, rabbits and monkeys, have been used to
study the permeability of model drugs (Tarirai et al., 2012:255).
The use of the Caco-2 cell model has grown tremendously and is the most extensively
characterised and useful in vitro screening tool in the field of drug permeability studies and
drug discovery (Artursson, 1990:310; Artursson & Karlsson, 1991:882; Rubas et al.,
1996:168). Caco-2 cells derive from human colorectal adenocarcinoma, undergo
extemporaneous enterocytic differentiation in culture and are polarised with well-established
tight junctions between adjacent cells (Antunes et al., 2013:9). Caco-2 cells are grown as
monolayers and differentiate on a semi-permeable membrane thus separating the apical and
basolateral sides, which correspond to the intestinal lumen side and the serosal side,
respectively (Le Ferrec et al., 2001:656). Drug transport studies in cell monolayers are easy
to carry out and require small quantities of drug and have been proposed for drug absorption
screening at the initial stage in the drug development process (Artursson et al., 2012:280).
The Caco-2 cell line is also useful in evaluating the effects of drug absorption enhancers and
to determine if synergistic interactions exist between combinations (Enslin et al., 2008:1343).

44
4.2 MATERIALS
The following materials were used during this study:
4.2.1 Plant materials
Aloe marlothii leaves were collected from natural populations in the Koster district in the
North West Province of South Africa and manually processed at the North-West
University.
Aloe ferox leaves were collected from natural populations in the Albertinia district in the
Western Cape Province of South Africa and filleted by Organic Aloe Pty Ltd. (Albertinia,
South Africa).
Aloe vera gel powder was purchased from Warren Chem (Johannesburg, South Africa).
4.2.2 Materials used in N,N,N-trimethyl chitosan chloride (TMC) synthesis
ChitoClear® (Chitosan) (Lot No.: TM2832) was purchased from Primex (Siglufjordur,
Iceland).
The 1-Methyl-2-pyrrolidinone (Batch No.: SZBB3010V) was purchased from Sigma-
Aldrich (Johannesburg, South Africa).
Sodium iodide (Batch No.: 6397) was purchased from Sigma-Aldrich (Johannesburg,
South Africa).
Sodium hydroxide (NaOH) (Batch No.: 001427117) was purchased from Sigma-Aldrich
(Johannesburg, South Africa).
Iodomethane (Batch No: BCBG 7499V) was purchased from Sigma-Aldrich
(Johannesburg, South Africa).
Sodium chloride (Batch No.: 038K0096) was purchased from Sigma-Aldrich
(Johannesburg, South Africa).
Absolute Ethanol (Batch No.: SZBB2060V) was purchased from Sigma-Aldrich
(Johannesburg, South Africa).
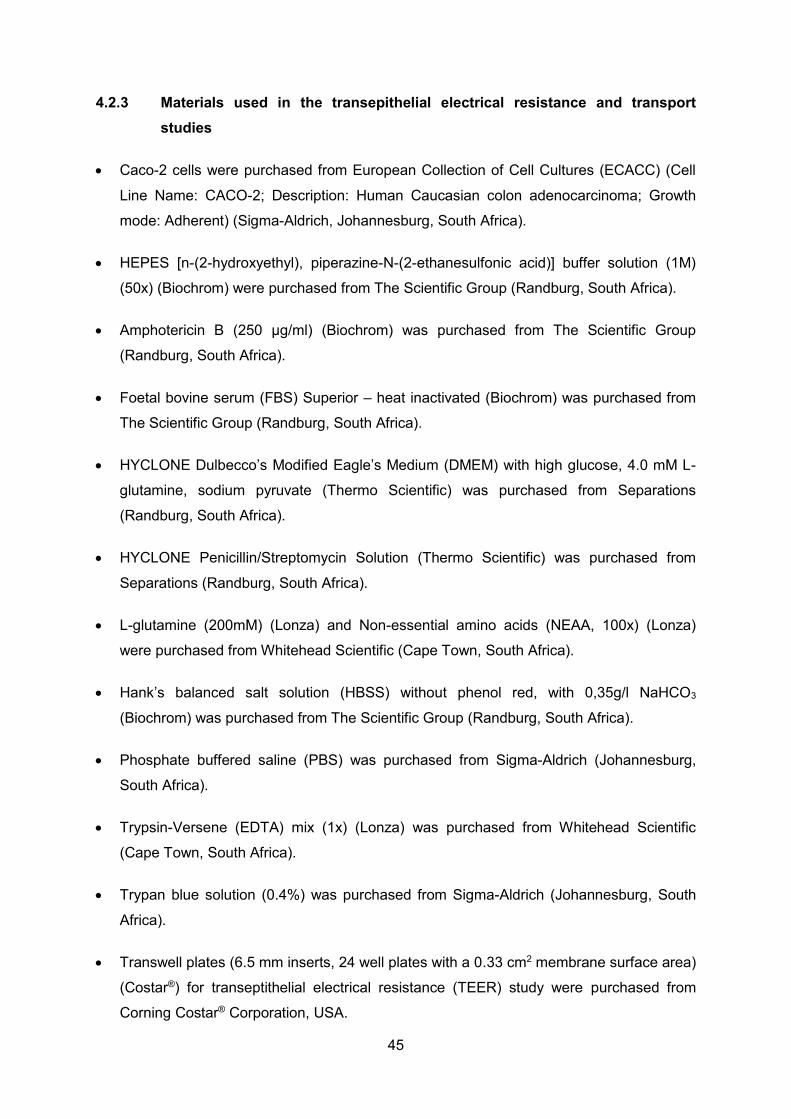
45
4.2.3 Materials used in the transepithelial electrical resistance and transport studies
Caco-2 cells were purchased from European Collection of Cell Cultures (ECACC) (Cell
Line Name: CACO-2; Description: Human Caucasian colon adenocarcinoma; Growth
mode: Adherent) (Sigma-Aldrich, Johannesburg, South Africa).
HEPES [n-(2-hydroxyethyl), piperazine-N-(2-ethanesulfonic acid)] buffer solution (1M)
(50x) (Biochrom) were purchased from The Scientific Group (Randburg, South Africa).
Amphotericin B (250 µg/ml) (Biochrom) was purchased from The Scientific Group
(Randburg, South Africa).
Foetal bovine serum (FBS) Superior – heat inactivated (Biochrom) was purchased from
The Scientific Group (Randburg, South Africa).
HYCLONE Dulbecco’s Modified Eagle’s Medium (DMEM) with high glucose, 4.0 mM L-
glutamine, sodium pyruvate (Thermo Scientific) was purchased from Separations
(Randburg, South Africa).
HYCLONE Penicillin/Streptomycin Solution (Thermo Scientific) was purchased from
Separations (Randburg, South Africa).
L-glutamine (200mM) (Lonza) and Non-essential amino acids (NEAA, 100x) (Lonza)
were purchased from Whitehead Scientific (Cape Town, South Africa).
Hank’s balanced salt solution (HBSS) without phenol red, with 0,35g/l NaHCO3
(Biochrom) was purchased from The Scientific Group (Randburg, South Africa).
Phosphate buffered saline (PBS) was purchased from Sigma-Aldrich (Johannesburg,
South Africa).
Trypsin-Versene (EDTA) mix (1x) (Lonza) was purchased from Whitehead Scientific
(Cape Town, South Africa).
Trypan blue solution (0.4%) was purchased from Sigma-Aldrich (Johannesburg, South
Africa).
Transwell plates (6.5 mm inserts, 24 well plates with a 0.33 cm2 membrane surface area)
(Costar®) for transeptithelial electrical resistance (TEER) study were purchased from
Corning Costar® Corporation, USA.

46
Transwell plates (24 mm inserts, 6 well plates with a 4.67 cm2 membrane surface area)
(Costar®) for Transport study were purchased from Corning Costar® Corporation, USA.
Fluorescein isothiocyanate (FITC) dextran (Batch no.: BCBK1623V) was purchased from
Sigma- Aldrich (Johannesburg, South Africa).
4.2.4 Materials used in high performance liquid chromatography HPLC analysis method
Potassium dihydrogen orthophosphate AR was purchased from LabChem (Edenvale,
South Africa).
Acetonitrile (Batch No.: I718530412) was purchased from Merck (Modderfontein, South
Africa).
4.2.5 Materials used in proton nuclear magnetic resonance (1H-NMR) spectroscopy
3-(Trimethylsilyl)-propionic acid-D4 sodium salt (TPS, Batch no.: S5537852) was
purchased from Merck (Modderfontein, South Africa).
Acetonitrile (Batch No.: I718530412) was purchased from Merck (Modderfontein, South
Africa).

47
4.3 PROCESSING OF ALOE MARLOTHII LEAVES
4.3.1 Harvesting of leaves
Sustainable harvesting of the Aloe marlothii leaves was ensured at all times and therefore
only lower leaves were harvested from each aloe plant. An incision was made close to the
base of the leaf during manual harvesting in such a way to prevent exposure of the interior of
the leaf to environmental factors. This ensured the harvested leaves were protected from
oxidation and microbial contamination. An example of the fresh leaves after harvesting,
removal of the ends of the leaves and cutting of the fillets into strips is shown in Figure 4.1.
Figure 4.1: Aloe marlothii leaves to demonstrate the removal of fillet material: a) fresh
leaves after harvesting b) removal of the ends of the leaves and c) cutting of gel or fillet
material into strips
4.3.2 Filleting
The traditional hand-filleting method was used to obtain the fillet or gel or pulp from the
leaves by removing the rind, thorns, tips and bases of each leaf. After filleting, the inner leaf
portion was cut into longitudinal strips (Ramachandra & Rao, 2008:505; O'Brien et al.,
2011:988). To remove any remaining yellow sap from the gel strips, they were rinsed with
mild warm water. The pulp gel was liquidised using a kitchen blender and frozen in ice cube
bags, as shown in Figure 4.2.
a b c
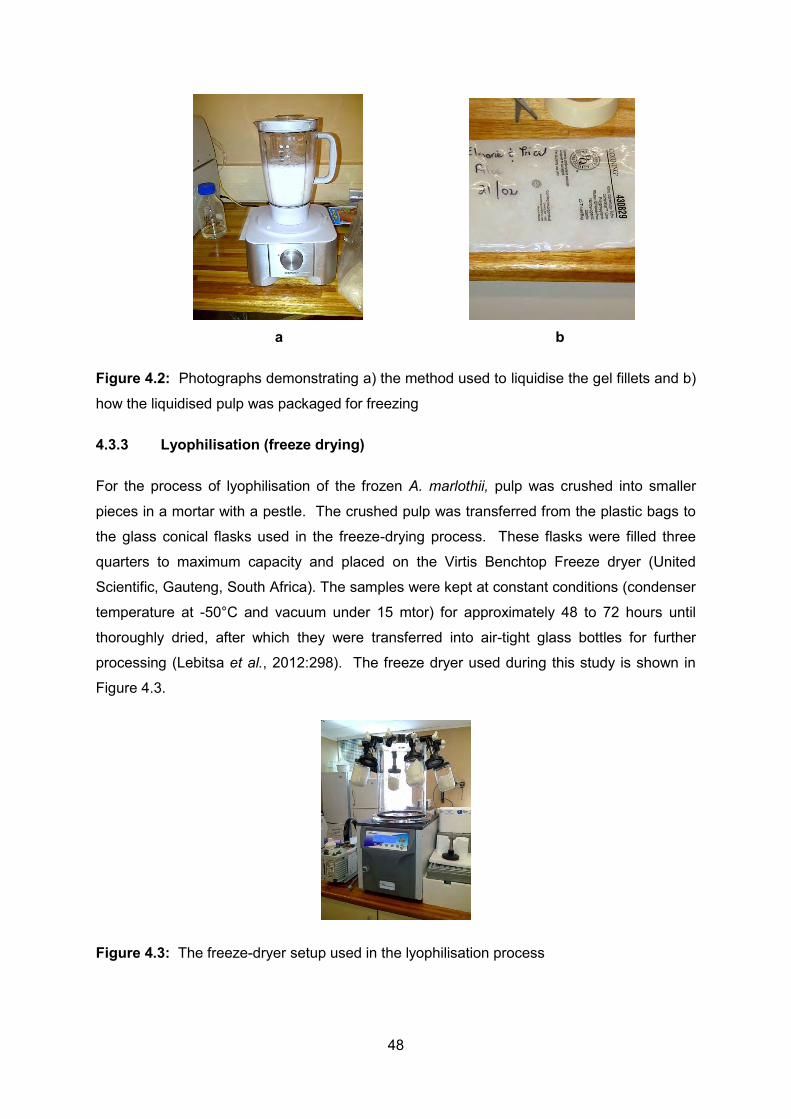
48
a b
Figure 4.2: Photographs demonstrating a) the method used to liquidise the gel fillets and b)
how the liquidised pulp was packaged for freezing
4.3.3 Lyophilisation (freeze drying)
For the process of lyophilisation of the frozen A. marlothii, pulp was crushed into smaller
pieces in a mortar with a pestle. The crushed pulp was transferred from the plastic bags to
the glass conical flasks used in the freeze-drying process. These flasks were filled three
quarters to maximum capacity and placed on the Virtis Benchtop Freeze dryer (United
Scientific, Gauteng, South Africa). The samples were kept at constant conditions (condenser
temperature at -50°C and vacuum under 15 mtor) for approximately 48 to 72 hours until
thoroughly dried, after which they were transferred into air-tight glass bottles for further
processing (Lebitsa et al., 2012:298). The freeze dryer used during this study is shown in
Figure 4.3.
Figure 4.3: The freeze-dryer setup used in the lyophilisation process

49
4.3.4 Particle size reduction
The dried A. marlothii gel material was crushed into a powder using a pestle and mortar. To
obtain a uniform particle size, the crushed material was manually forced through a sieve with
a 250 µm aperture size (Figure 4.4). The A. marlothii gel powder was then weighed and
transferred to air-tight glass containers.
Figure 4.4: The process of forcing the dried Aloe marlothii gel pieces through the sieve
4.4 CHEMICAL FINGERPRINTING OF ALOE GEL MATERIALS
All the aloe gel materials investigated in this study were chemically fingerprinted by means of
proton nuclear magnetic resonance (1H-NMR) spectroscopy to identify marker molecules
(Chen et al., 2009:588).
An amount of 35 mg of each gel material was dissolved, separately, in 2 ml of Deuterium
oxide (D2O) with 5 mg 3-(Trimethylsilyl)-propionic acid-D4 sodium salt (TPS) in an NMR tube
and filtered through cotton wool. The 1H-NMR spectra were recorded with an Avance III 600
Hz NMR spectrometer (Bruker BioSpin Corporation, Rheinstetlen, Germany) (Campestrini et
al., 2013:512). The 1H-NMR spectra were used to identify the presence of certain marker
molecules known to be present in fresh aloe leaf gel materials (Chen et al., 2009:588).
4.5 SYNTHESIS OF N,N,N-TRIMETHYL CHITOSAN CHLORIDE (TMC)
4.5.1 Reaction conditions of each step in the synthesis of TMC
The N,N,N-trimethyl chitosan chloride (TMC) was synthesised based on a modified method
by reductive methylation of chitosan (Polnok et al., 2004:78; Sieval et al., 1998:158). The
methylation of the chitosan was productively repeated with each polymer gained from the
previous step.

50
4.5.1.1 Reaction step 1
For the first reaction step, 4 g of chitosan was mixed with 160 ml of 1-methyl-2-pyrrolidinone
acting as a solvent. This mixture was heated to 60°C in a water bath and stirred until the
chitosan was dissolved, whereafter 9.6 g of sodium iodide, 22 ml of a 15% w/v aqueous
sodium hydroxide (NaOH) solution and 23.5 ml of iodomethane were added to the mixture.
The use of a Liebig’s condenser, assured the iodomethane was kept in reaction. On
reaching 60°C, the mixture was stirred for one hour, then removed from the water bath. An
excess of absolute ethanol was added to the mixture and left to precipitate overnight.
4.5.1.2 Reaction step 2
The product obtained from reaction step 1 (N-trimethyl chitosan iodide) was washed several
times with diethyl ether on a glass filter and dried by means of a vacuum. The polymer
obtained was dissolved in 160 ml 1-methyl-2-pyrrolidinone and 9.6 g of sodium iodide, 22 ml
of a 15% w/v aqueous sodium hydroxide (NaOH) solution and 23.5 ml of iodomethane were
added. The reaction was carried out in the presence of a Liebig’s condenser at 60°C. The
product was precipitated with absolute ethanol, washed with diethyl ether and dried.
4.5.1.3 Additional reaction step
At the end of the previous reaction step, prior to precipitation of the product, an additional
5 ml of iodomethane and 10 ml of a 15% w/v aqueous sodium hydroxide (NaOH) were
added and the reaction continued for another hour at 60°C. The product was precipitated
with absolute ethanol, washed with diethyl ether and dried by means of vacuum.
4.5.1.4 Ion-exchange step
To exchange the iodide ions of the product with chloride ions, the product obtained was
dissolved in 100 ml of a 10% w/v sodium chloride solution, which consequently was
precipitated by using ethanol and diethyl ether. The repeated dissolving of the products in
water and precipitation with ethanol and diethyl ether removed the residual sodium chloride.
A vacuum thoroughly dried the final product.
4.5.2 Determination of the degree of quaternisation
TMC polymers were chemically characterised by means of proton nuclear magnetic
resonance (1H-NMR) spectroscopy with an Avance III 600 Hz NMR spectrometer (Bruker
BioSpin Corporation, Rheinstetlen, Germany). A sample of the polymer (35 mg each) was
dissolved in 2 ml D2O at 80°C with suppression of the water peak. The degree of

51
quaternisation was calculated using the combined integrals, in the 1H-NMR spectra, H-3, H-
4, H-5, H-6 and H-6’ (6H) peaks at δ 3.6 – 4.5 and H-2 peak at 3.10 ppm. The following
equations were used to calculate the degree of substitution (Rúnarsson et al., 2007:2662):
% N,N,N-Trimethylation = [[N(CH3)3]
[H-2, H-3, H-4, H-5, H-6, H-6’] × 6
9 x 100] Equation 4.1
% N,N-Dimethylation = [[N(CH3)2]
[H-2, H-3, H-4, H-5, H-6, H-6’] × 6
6 x 100] Equation 4.2
% O-Methylation = [[O(CH3)]
[H-2, H-3, H-4, H-5, H-6, H-6’] × 6
6 x 100] Equation 4.3
Where [N(CH3)3], [N(CH3)2], [N(CH3)] are the integrals of the N,N,N-trimethyl- (3.30 ppm),
N,N-dimethyl- (δ 2.87 ppm or 3.00 ppm), N-monomethyl-amino (δ 2.77 ppm or 2.80 ppm)
singlet peaks, respectively. [O(CH3)] are the integrals of the O-methyl (δ 3.35 ppm, for O3-
CH3 and 3.43 ppm for O6-CH3). The integral [H-2, H-3, H-4, H-5, H-6, H-6’] represents six
protons. The quaternisation degree is expressed as the percentage trimethylation
(Rúnarsson et al., 2007:2662).
4.6 VALIDATION OF THE CHROMATOGRAPHIC ANALYTICAL METHOD
4.6.1 Introduction
The main objective of the validation of an analytical method is to verify that the process is
sensitive and consistent in the quantification of the active ingredient’s concentration. In this
study FITC-dextran was used as the model compound in the in vitro transport experiments
(ICH, 2005:1). The analytical method and procedure referred to in this section was
produced and developed, under the direction and supervision of Professor Jan du Preez in
the Analytical Technology Laboratory of the North-West University (NWU), Potchefstroom,
South Africa.

52
4.6.2 Chromatographic conditions
Table 4.1: Chromatographic conditions for the validation and analysis of in vitro transport
samples
4.6.3 Standard solution preparation
To define the correlation between the concentration of the analyte and instrument response,
a series of standard FITC-dextran solutions were prepared to generate a testing curve for
linearity. The FITC-dextran solutions were prepared as follows:
Analytical instrument Spectraphysics liquid chromatographic system equipped with a
pump (model P1000), autosampler (model AS3000) and
fluorescence detector (model FL2000). Chemstation Rev. A.
10.01 software was used for data acquisition and analysis.
Column A Poly-Sep-GFC-P Linear size exclusion column, 300 × 7.80
mm and PolySep-GFC-P guard column, 35 × 7.80 mm
(Phenomenex, USA distributed by Separations, Johannesburg,
South Africa) was used during the analysis.
Mobile phase The mobile phase consisted of 88 volumes of distilled water
and 12 volumes of acetonitrile (CH3CN). The buffer
component of the mobile phase with 0.05 M potassium
dihydrogen orthophosphate AR (KH2PO4) was prepared with
deionised water and the pH adjusted to 6.5 with NaOH. The
prepared mobile phase was filtered through a 0.45 μm nylon
filter and degassed under vacuum (Enslin et al., 2008:1345).
Flow rate 1 ml/min
Injection volume 20 µl
Detection Excitation wavelength at 494 nm and emission wavelength at 518 nm
Run time Approximately 10 minutes
Retention time The analyte eluted at approximately 4 minutes
Solvent Distilled water

53
Three mother solutions were prepared (i.e. 145 µg/ml, 151 µg/ml and 156 µg/ml) by
weighing 14.5 mg, 15.1 mg and 15.6 mg of FITC-dextran and dissolving each sample in
5 ml methanol in 100 ml volumetric flasks, which were made up to volume with distilled
water.
A volume of 10 ml of each mother solution was diluted to 50 ml with distilled water to
obtain 29 µg/ml, 30.5 µg/ml and 31.2 µg/ml FITC-dextran solutions.
A volume of 10 ml of each of these FITC-dextran solutions were diluted to 20 ml with
distilled water to obtain 14.5 µg/ml, 15.25 µg/ml and 15.6 µg/ml FITC-dextran solutions.
These solutions were injected at different volumes to conclude the remaining validation
parameters (Refer to Section 4.6.5).
4.6.4 Samples from in vitro transport studies
The samples collected from the in vitro transport studies were injected into the HPLC and
analysed directly. The concentrated master solutions were diluted with a dilution factor of 20
to ensure visible peaks. The standard preparation of the samples used in the in vitro
transport studies, is described in section 4.7.5.1.
4.6.5 Validation parameters
4.6.5.1 Linearity
According to the USP (2013a: 985), the linearity of an analytical method is its capability
(within a given range) to elicit test results (peak area) which are directly proportional to the
concentration of the analyte in the sample (µg/ml). The linearity of FITC-dextran was
determined by carrying out linear regression analysis on the plot of the peak area ratios
versus concentration (µg/ml) of the standard solutions. This plot should give a straight line
(r2 = 1) and can be described by the following linear equation:
y = mx + c Equation 4.4
Where y is the peak area on the chromatogram of the analyte (FITC-dextran), m is the slope,
x is the concentration of the analyte (FITC-dextran) and c is the y-intercept.
To obtain a concentration range between 0.15 and 21.90 µg/ml, the prepared standard
solutions were injected in duplicate into HPLC at different injection volumes.

54
4.6.5.2 Accuracy and precision
The accuracy of an analytical procedure is the closeness of test results obtained by that
procedure to the true value and should be established across a concentration range, where
the precision can be described as the degree of agreement amongst individual test results
when the procedure is applied repeatedly to multiple samplings of a homogeneous group
(USP, 2013a:985).
4.6.5.2.1 Accuracy
A recommendation made by the ICH (2005:10) states that the accuracy of an analytical
method should be investigated by using a minimum of nine determinations over a minimum
of three concentration levels covering the specified range (i.e. three concentrations and
three replicates of each concentration).
Nine standard solutions (prepared as described in section 4.6.3) of known concentrations
(i.e. 3.63, 7.25, 10.88; 3.78, 7.55, 11.33 and 3.90, 7.80, 11.70 µg/ml) of FITC-dextran were
analysed with the HPLC during the same day.
4.6.5.2.2 Inter-day precision
The HPLC analysis was executed on three different samples of a FITC-dextran solution (15
µg/ml), in triplicate on three different days. The percentage RSD should be equal to or less
than 5% (APVMA, 2004:5).
4.6.5.3 Ruggedness
A 15 µg/ml FITC-dextran solution was prepared to test the analytes’ stability over a period of
24 hours. A sample was placed in the autosampler tray and analysed by means of the
HPLC at hourly intervals. A period no longer than it takes a sample solution to degrade by
2% is acceptable
4.6.5.4 System repeatability
A sample from a FITC-dextran solution (15 µg/ml) was injected six consecutive times on the
HPLC, to calculate the repeatability of the peak area and retention time (USP, 2013a: 985).
According to method validation guidelines (Du Preez, 2010:5), the peak area and retention
times should have a percentage RSD of 2% or less.

55
4.6.5.5 Specificity
The ability to detect the analyte in the presence of components that may interfere with the
detection of the analyte is called the specificity (ICH, 2005:4). When no intrusive peaks with
the same retention time as the drug are identified, the method complies with specificity.
Solutions with the different aloe gel materials and TMC together with FITC-dextran were
prepared for evaluation of specificity, which represent the solutions used during the in vitro
transport studies.
4.6.6 Analysis of samples from the in vitro transport studies
Dulbecco's Modified Eagle’s Medium (DMEM), containing 4 mM/l glutamine,
4500 mg/l glucose and sodium pyruvate, replaced the distilled water as it is a more
appropriate solvent for in vitro transport studies across Caco-2 cells. According to the
product information sheet (ATCC, 2004:3), the Caco-2 cell line was grown and cultured in
DMEM and therefore, for the performance of in vitro transport studies, all samples were
dissolved in DMEM ensuring compliance of the cultured cells. HPLC analysis were done on
DMEM every time a transport experiment were analysed, ensuring there was no interference
with the FITC-dextran peak thus complying to specificity of an analytical method.
4.7 TRANSEPITHELIAL ELECTRICAL RESISTANCE AND TRANSPORT STUDIES
4.7.1 Reviving frozen cell stocks
The procedure of reviving frozen Caco-2 cells was carried out under sterile conditions inside
a laminar airflow unit (Filta-Matix Laminar Flow Cabinets, Johannesburg, South Africa). The
selected cryovial containing the cell stock was removed from the cryofreezer and rapidly
thawed at 37°C in a water bath. Once thawed, it was placed inside the laminar flow hood,
where a small volume of the pre-heated medium was slowly pipetted into the vial. The cell-
medium mixture was then slowly transferred to a cell culture flask (25 cm2) containing 10 ml
of pre-heated growth medium and was gently dispersed across the growth surface before
placing it in the CO2 incubator (Galaxy 170R, Eppendorf Company, Stevenage, United
Kingdom) overnight. After a period of 24 hours, it was checked to determine whether the
cells had successfully attached to the growth surface using a light microscope (Nikon Eclipse
TS100/TS100F, Nikon Instruments, Tokyo, Japan). The growth medium was removed from
the flask by decanting it and 10 ml of new, fresh growth medium was added to the flask and
returned to the CO2 incubator (Gouws, 2013a:3).

56
For the performance of the transepithelial electrical resistance (TEER), as well as the
transport experiments, cells with a passage number not higher than 60 were used (passage
numbers 52 – 60) (Briske-Anderson et al., 1997:248). High-passage Caco-2 cells may result
in lower TEER readings (ATCC, 2010:1).
4.7.2 Culturing of Caco-2 cells
Caco-2 cells were cultured in 75 cm2 growth flasks at 37ºC in a humidified atmosphere of
95% air and 5% CO2. Growth medium (consisting of 500 mL Hyclone DMEM supplemented
with 10% v/v foetal bovine serum (FBS), 2 mM L-glutamine, 1% v/v Amphotericin B, 1% v/v
non-essential amino acids (NEAA) and 1% v/v Penicillin/Streptomycin Solution) was
changed every second day and the confluence of the cells confirmed with a light microscope
prior to sub-culturing. Cells were sub-cultured after 60% to 80% confluence was reached
(Gouws, 2013c:3).
4.7.2.1 Changing the growth medium
Growth medium was changed every second day by decanting the flask to remove the growth
medium whereafter 10 ml to 15 ml pre-heated growth medium were added to the flask
(Gouws, 2013c:3).
4.7.2.2 Sub-culturing the Caco-2 cells
The growth medium was removed from the flask by decanting it. The flask was then rinsed
twice with 10 ml of pre-warmed phosphate buffer saline (PBS) (2 PBS tablets added and
dissolved in 400 ml ddH2O). The addition of 3 ml of Trypsin-Versene to the flask, was done
before being incubated at 37°C for 3 to 5 minutes. Once the cells were detached, 3 to 6 ml
pre-warmed growth medium was added to the flask and the use of a serological or Pasteur
pipette ensured that all the cells were aspirated from the sides of the flask. The cell
suspension was sub-cultured in either a ratio of 1:4 or 1:6, depending on the confluence of
the Caco-2 cells. Once again, pre-warmed growth medium was added and the flasks
returned to the CO2 incubator (Gouws, 2013b:3). After culturing the Caco-2 cells it was
seeded on to the Transwell® membrane plates.
4.7.3 Seeding of caco-2 cells onto Transwell® membrane plates
Caco-2 cells were seeded on tissue culture treated 0,4 µm polycarbonate membranes, with
a surface area of 0.33 cm², in Costar® Transwell® 24-well plates (6,5 mm inserts) at a
concentration of 2 X 10⁴ cells/ml for transepithelial electrical resistance (TEER) studies and
on tissue culture treated 0,4 µm polycarbonate membranes, with a surface area of 4.67 cm2

57
in Costar® Transwell® 6-well plates (24 mm inserts) at a concentration of 2 X 10⁴ cells/ml
cells/ml for the in vitro transport studies.
Growth medium was removed from the flask by decanting it and the flask rinsed twice with
10 ml of pre-warmed phosphate buffered saline (PBS). An addition of 3 ml of Trypsin-
Versene to the flask was done prior to incubation at 37°C for 3 to 5 min until a suspension
consisting of single cells (not agglomerates) was present, as observed with a light
microscope. An amount of 3 to 6 ml pre-warmed growth medium was added to the flask and
by using a serological or Pasteur pipette, ensured all the cells were gently removed from the
bottom of the flask. The cell suspension was transferred to a 50 ml tube.
The cell suspension was continuously mixed with a Pasteur pipette until 10 µL of this
suspension was extracted and added to a Trypan blue mixture (25 µL Trypan blue 0.4% w/v
and 15 µL PBS, freshly prepared) in a 1.2 ml tube. The tube was thoroughly mixed, which
ensured the total 50 µL volume was combined in the bottom of the tube, before it was
incubated for 3 minutes. An amount of 10 µL was extracted from the mixture and a
hemocytometer was used to count all live (clear, round) cells. The total of cells counted was
divided by two (average of the two sides of the hemocytometer) and then this number was
divided by five to obtain the average number of cells per square. This number was
multiplied by 5 x 10⁴ (where 5 is obtained from the above mentioned dilution, where 10 µL is
diluted to 50 µL and 104 a constant for cell counting with the hemocytometer), giving the
amount of cells present in the cell suspension to obtain the number of cells per milliliter of
the cell suspension. After this, it was multiplied with the total volume of the cell suspension
to calculate the number of cells present in the suspension. The dilution needed to seed the
cells out at a pre-determined concentration (2 x 10⁴ cells/ml) was calculated with the
following equation:
C1V1 = C2V2 Equation 4.5
Where C1 is the counted cell concentration (cells/ml), C2 is the pre-determined cell
concentration (2 x 10⁴ cells/ml), V2 is the final volume of cell suspension needed and V1 is
the volume needed to dilute to the accurate cell suspension.
The diluted cell suspension was mixed continuously with a Pasteur pipette while pipetting
200 µl into each apical chamber of the 24-well plates for the TEER studies and 2.5 ml into
each apical chamber of the 6-well plate for the transport studies. Each basolateral chamber
was filled with growth medium (1 ml for the 24-well plate and 2.5 ml for the 6-well plate).

58
The plates were incubated in the CO2 incubator at 37 °C in an atmosphere of 5% CO2 and
maintained for 21 to 24 days before performing the experiments (Gouws, 2013b:5-8).
4.7.4 TEER study
4.7.4.1 Preparation of test solutions
For the TEER studies, six different combinations of the aloe gel materials (i.e. A. vera, A.
ferox, A. marlothii) and TMC in two concentrations (i.e. 0.1% w/v and 0.5% w/v, total
concentration of both components together in each combination) were prepared in five
different ratios (i.e. 10:0, 8:2, 5:5, 2:8 and 0:10). Each combination of materials was added
to 2.5 ml of Hank’s Balanced Salt Solution (HBSS) and thoroughly stirred for approximately
30 minutes using a magnetic stirrer. The solutions were made up to volume (5 ml) in
volumetric flasks.
Table 4.2: Combinations of absorption enhancers for the TEER experiments
Combination 1 A. vera and A. marlothii
Combination 2 A. vera and A. ferox
Combination 3 A. marlothii and A. ferox
Combination 4 A. vera and N,N,N-trimethyl chitosan chloride (TMC)
Combination 5 A. ferox and N,N,N-trimethyl chitosan chloride (TMC)
Combination 6 A. marlothii and N,N,N-trimethyl chitosan chloride (TMC)
4.7.4.2 Measurement of TEER
A transepithelial electrical resistance value of the Caco-2 cell monolayers (Transwell® 24
well plates, 0.33 cm2) of at least 750 Ω (or 247.5 Ω/cm2) was required prior to the
commencement of the experiments.
The growth medium was removed from the basolateral chambers using an aspirator (Integra
Vacusafe, Switzerland) and replaced with 1 ml pre-warmed Hank’s Balanced Salt Solution
(HBSS) and incubated at 37°C for 30 minutes prior to the commencement of the
experiments. TEER was measured at 20 minute time intervals, starting 1 hour prior to the
addition of the test solutions on the apical chamber of the cells and continued for 2 hours
after the addition of the test solutions. The TEER was measured using a Millcell ERS meter
(Millipore, USA) connected to chopstick electrodes (Gouws, 2013d:4). TEER measurements

59
for the control groups were recorded under the same conditions. The negative control group
consisted of the Caco-2 cells alone without a permeation enhancer combination. This acted
as in indication that the monolayers stayed intact for the duration of the experiments and that
the Caco-2 cells alone had no effect. The positive control groups contained TMC in a
concentration of 0.1% w/v or 0.5% w/v, respectively. All the experiments were done in
triplicate and Transwell® plates were kept in a CO2 incubator at 37ºC in a humidified
atmosphere of 95% air and 5% CO2 (Lebitsa et al., 2012:299).
4.7.5 In vitro transport studies of FITC-dextran
4.7.5.1 Preparation of test solutions
For the performance of the in vitro transport studies across Caco-2 cell monolayers, the test
solutions (combinations of absorption enhancers, Table 4.2) were prepared in Dulbecco's
Modified Eagle Medium (DMEM) containing a final concentration of 1 mg/ml of FITC-dextran.
The different amounts of each of the absorption enhancers (i.e. A.vera, A. ferox, A. marlothii,
TMC) were weighed and dissolved in 5 ml of Dulbecco's Modified Eagle Medium (DMEM)
and thoroughly stirred for approximately 30 minutes using a magnetic stirrer. A 2 mg/ml
FITC-dextran solution was prepared and 5 ml of this, was added to the mixture (test solution)
and made up to volume (10 ml) in a volumetric flask with DMEM.
All the experiments were done in triplicate at concentration 0.1% w/v of the absorption
enhancer combination and each combination was prepared in five different ratios namely
10:0, 8:2, 5:5, 2:8 and 0:10.
4.7.5.2 Transport measurements of FITC-dextran across Caco-2 cell monolayers
A transepithelial electrical resistance value of the Caco-2 cell monolayers of at least 250 Ω
(or 1167.5 Ω/cm2) was required prior to the commencement of the transport experiment.
The growth medium was removed from the basolateral chambers using an aspirator and
each basolateral chamber was filled with 2.5 ml pre-warmed DMEM buffered to pH 7.4 with
HEPES (a mixture of 39 ml DMEM with 1 ml HEPES) and incubated at 37°C for 30 minutes,
prior to the start of the experiment. The medium in the apical chambers was removed and
2.5 ml of each of the test solutions were applied to three wells, individually (transport
experiments were done in triplicate). Samples of 400 µl were taken at 0, 20, 40, 60, 80, 100
and 120 minutes from the basolateral chamber. The withdrawn samples were replaced with
an equal volume of buffered DMEM. The negative control group contained a solution of
FITC-dextran without any permeation enhancer and the positive control group contained
60
TMC 0.1% w/v together with FITC-dextran. Samples withdrawn were stored in HPLC vials
until quantification by High Performance Liquid Chromatography (HPLC) as described in
section 4.6.
4.8 ISOTHERMAL MICROCALORIMETRY
To determine whether interactions occurred between different combinations and ratios of the
absorption enhancers the method of isothermal microcalorimetry was used. The usefulness
of this method lies with the ability to detect small, low energy interactions between
compounds. A Thermal Activity Monitor (TAMIII) apparatus (TA Instruments, New Castle,
Delaware, United States of America) equipped with an oil bath with a stability of ±100 µK
over 24 h was used during this study. The temperature of the samples (absorption enhancer
combinations as shown in Table 4.2 at 0.1% w/v and 0.5% w/v) was maintained at 60°C
throughout the monitoring of the heat flow. To determine interactions between the different
materials used in the combinations studies, the heat flow was measured for the single
components as well as the combinations. The samples were run against an inert reference
(an empty sealed ampoule). The calorimetric outputs observed for the individual samples
were summed to give an additive hypothetical response. This calculated hypothetical
response represents a calorimetric output that would be expected if the two materials do not
interact with each other. If the materials interact, the measured calorimetric response will
differ from the calculated hypothetical response. A heat flow difference of more than 100
µW/g was considered a significant difference that is indicative of an interaction between two
compounds. Correlation of the interaction data obtained by microcalorimetry with other data
resulted in the identification of interactions between the absorption enhancers and relating
such interactions to either synergistic or antagonistic effects observed.
4.9 DATA ANALYSIS AND STATISTICS
4.9.1 TEER studies
The TEER experiments were performed at two concentrations namely 0.1% w/v and 0.5%
w/v. The choice to use these concentrations is based on a previous study where it was
shown to be effective in reducing the TEER at this concentration range (Lebitsa et al.,
2012:302). Furthermore Wagner and Ulrich-Mezenich (2009:99) stated that a reduction in
the dose (or concentration) in a combination of two components will produce the same
desired effect but will lead to a reduction in the potential of adverse effects. To test if there
was a time dependent effect, the TEER experiments were performed over a period of 120
minutes.

61
4.9.1.1 Reduction in TEER
The reduction in TEER (% of the initial value) was calculated by multiplying the
transepithelial electrical resistance value of the Caco-2 cell monolayers at each time point
with the surface area (0.33 cm2) of the Transwell® 24 well plates. These values were then
processed to a normalised percentage with respect to the TEER value at time 0.
4.9.1.2 Percentage TEER reduction
The percentage TEER reduction was obtained by subtracting the percentage TEER values
(% of the initial value) from the value at time 0 (i.e. 100%), which quantitatively expresses
the extent to which each experimental group opened the tight junctions between Caco-2
cells in the monolayers.
4.9.2 In vitro transport
Based on the TEER reduction results from all the combinations obtained in this study, it was
decided to test the effects of the absorption enhancer combinations on FITC dextran
transport only in one concentration namely 0.1 % w/v. The apparent permeability coefficient
(Papp) values of FITC-dextran in the presence of the different combination ratios were
calculated from the cumulative transport (% of initial value as a function of time) results. The
Papp values were further processed by means of the isobole method to determine if
synergistic interactions existed for the combinations.
The apparent permeability is defined as the initial flux of compound through the membrane,
normalised by membrane surface area and donor concentration. It is an index widely used
as part of a general screening process to study drug absorption by means of in vitro and ex
vivo experiments and is calculated by means of the following equation (Palumbo et al.,
2008:235):
Papp= dQdt
1(A.60.C0)
Equation 4.6
Where Papp is the apparent permeability coefficient (cm.s-1), dQ/dt is the permeability rate
(amount permeated per minute), A is the diffusion area of the monolayer (cm²) and C0 is the
initial concentration of the model drug.
4.9.2.1 Isobole method
The isobole method used in this study to analyse the transport data is a combination
between the conventional 2D isobole method and a response surface analysis. The effects

62
of the drug combinations is presented as a contour plot, where the combination ratios are
plotted as a horizontal x-y plane and the effect obtained from the combination is plotted on
the x-axes, thus resulting in a 3D isobologram graph as illustrated by examples in Figure 4.5.
Figure 4.5: Examples of typical isobolograms obtained from different experiments in this
study, where a) resulted in an overall synergistic effect and b) resulted in an overall
antagonistic effect.
Since the isobole method was originally designed to use the doses of two or more drugs,
with constant potency ratios, needed to achieve a specific therapeutic effect, it had to be
modified to accommodate therapeutic agents of unknown molecular weights. The need for
this modification arises from the difficulty in isolating the individual components of a complex
mixture, such as the gel and whole leaf materials used in this study. To achieve this, the
isobole method was extended to a higher dimensional multivariable problem, in which the
isobologram is seen as the n-dimensional reflection from an (n+1)-dimensional hyperspace
containing the drug ratios and observed effects, where n is the number of drugs being
tested. This (n+1)-dimensional isobologram depends explicitly on the observed effects and
relates the ratios of the therapeutic agents to its corresponding effects in such a way that all
the information usually found in the classic n-dimensional isobologram is maintained. This
enables the researcher to obtain the desired drug interaction information directly from the
ratios and its corresponding effects. The mathematical proof is not presented in this study
but briefly, it can be shown mathematically that the drug ratio-effect data can be expressed
as vectors in ℝn+1 which extend from the origin to an n-dimensional plane that is normal to
the ratio axes. This (n+1)-dimensional isobologram can be related to the classic n-
a b
a b

63
dimensional isobologram by the matrix T, such that T:V → W is a linear transformation,
where V is the basis drug ratio-effect vectors and W is the basis drug dose vectors of the
isobologram. If a polynomial is fitted to the points on the isobologram, a similar polynomial
can be fitted to the drug ratio-effect points, containing the same maxima, minima and
inflection points. The method used to draw the (n+1)-dimensional isobolograms is
straightforward and the procedure can easily be adapted to any computer software package.
The procedure (presented here for n = 2):
Express the ratios and corresponding effects as vectors in matrix form, e.g.
A=
[
1 0 Eda
0.8 0.2 E(da,db)0.5 0.5 E(da,db)0.2 0.8 E(da,db)0 1 Edb ]
Find the equation of a plane that extends from the origin through the points (1, 0, Eda)
and (0, 1, Edb) to the point (1, 1, Eda + Edb). Let p be a point on the plane and let n be a
vector orthogonal to the plane, which can be found by:
det |i j k1 0 Eda
0 1 Edb
|
So the Cartesian equation of the plane through the origin can be found from the point
products
(x, y, z)∙(n)=(p)∙(n)
Calculate the values of z (the effect axis) that correspond to the different ratios. These z-
values represent the expected additive effect values. Express the ratios and
corresponding additive effects as vectors in matrix form, e.g.
B=
[
1 0 Eda
0.8 0.2 Eda+Edb
0.5 0.5 Eda+Edb0.2 0.8 Eda+Edb
0 1 Edb ]
Plot the matrices A and B to obtain a 3D plot containing the experimental and expected
additive values associated with each drug ratio.

64
4.9.3 Statistical analysis of results
The following statistical tests were done using Statistica software (StatSoft, Inc. 2012, Tulsa,
Oklahoma, United States of America) to determine if the effects obtained for the
combinations of permeation enhancers were statistically significantly different from the
control group or not. All tests were done on a 0.05 significant level.
One-way analyses of variance (ANOVA) were done to determine if statistical significant
differences exist between the mean percentage TEER reduction values of the experimental
groups and each of the control groups in general. These procedures were conducted when
analysing the mean Papp values to determine significant differences between the
experimental groups and each of the control groups. These were also done for TEER data
on concentrations 0.1% w/v and 0.5% w/v and for transport data on concentration 0.1% w/v.
Levenes’ tests were performed in each ANOVA’s case to assure equality of variances. In
cases of inequality of variances, Welch tests were performed. Normal probability plots on
the residuals were conducted in each analysis to ensure the data was distributed fairly
(Tabachnick & Fidell, 2001:966). Dunnett’s post-hoc tests were finally conducted in each
ANOVA’s case to determine which of the test compounds’ means differ statistically
significantly from the means of each of the control compounds.
65
CHAPTER 5 RESULTS AND DISCUSSION
___________________________________________________________________
5.1 INTRODUCTION
Synergistic drug absorption enhancement effects were investigated when combinations of
leaf gel materials of three different aloe species, namely Aloe vera, Aloe ferox and Aloe
marlothii, as well as different combinations with N-trimethyl chitosan chloride (TMC), were
applied to intestinal epithelial cell monolayers.
In the negative control group (i.e. Caco-2 cell monolayers without addition of any absorption
enhancers), the transepithelial electrical resistance (TEER) was measured over a 2 hour
period for the TEER studies, while the transport of FITC-dextran alone was determined for
the transport studies. In the positive control group, the TEER of Caco-2 cell monolayers in
the presence of TMC as well as the transport of FITC-dextran in the presence of TMC was
determined. TMC was used as positive control because its intestinal absorption
enhancement effects have been proven in several studies (Kotzé et al., 1999:243; Thanou et
al., 2000:15; Hamman et al., 2003:161). The TEER experiments were performed at two
concentrations for the test and control groups, namely 0.1% w/v and 0.5% w/v, whilst the
transport experiments were performed at a concentration 0.1% w/v for all combinations.
As described in Chapter 4, the results of the TEER experiments were processed to obtain
percentage TEER reduction as an indication of the extent to which each combination opened
the tight junctions. The transport data were processed to the apparent permeability (Papp)
coefficient values to compare the extent of the increase in FITC-dextran transport between
the different experimental groups. The isobole method was applied to the Papp values to
indicate the type of interaction between the components of each combination (i.e. synergism,
antagonism or additive effects).
5.2 1H-NMR CHARACTERISATION OF MATERIALS
5.2.1 1H-NMR characterization of aloe plant materials
The 1H-NMR spectra obtained for A. vera, A. marlothii and A. ferox respectively, are
illustrated in Figure 5.1. It is evident from the 1H-NMR spectrum of A. vera leaf gel material
that the marker molecules namely aloverose (partly acetylated polymannan or acemannan),
glucose and malic acid are present together with low levels of lactic acid and formic acid. In

66
general, high amounts of lactic acid can indicate bacterial degradation due to Lactobacillus,
whilst acetic acid and formic acid are present due to hydrolysis of aloverose and thermal
degradation of glucose during storage.
According to the 1H-NMR spectra of the A. marlothii and A. ferox leaf gel materials, glucose
and small amounts of lactic acid are present. Other phytochemicals such as malic acid,
acetic acid, formic acid, citric acid and benzoic acid are also identifiable on the spectra, but
aloverose is absent. These findings are in accordance with previously published data, which
showed that aloe species indigenous to South Africa (e.g. A. ferox) do not contain aloverose
(O'Brien et al., 2011:988).

67
Figure 5.1: 1H-NMR spectra of a) Aloe vera gel material, b) Aloe marlothii gel material and
c) Aloe ferox gel material

68
5.2.2 1H-NMR characterisation of N-trimethyl chitosan chloride (TMC)
The 1H-NMR spectrum for the synthesised TMC is shown in Figure 5.2.
Figure 5.2: 1H-NMR spectrum of N-trimethyl chitosan chloride (TMC)
The degree of quaternisation was calculated using the combined integrals on the 1H-NMR
spectra, namely H-3, H-4, H-5, H-6 and H-6’ (6H) peaks at δ 3.6 – 4.5 and H-2 peak at
δ 3.10 ppm.
The following equations were used to estimate the degree of quaternisation (Rúnarsson et
al., 2007:2662):
% N,N,N-Trimethylation = [[N(CH3)3]
[H-2, H-3, H-4, H-5, H-6, H-6’] x 6
9] x 100 Equation 5.1
% N,N-Dimethylation = [[N(CH3)]
[H-2, H-3, H-4, H-5, H-6, H-6’] x 6
9] x 100 Equation 5.2
% O-Methylation = [[O(CH3)]
[H-2, H-3, H-4, H-5, H-6, H-6’] x 6
6] x 100 Equation 5.3
Where the integrals of [N(CH3)3], [N(CH3)2], [N(CH3)] are obtained from the singlet peaks at
δ 3.30 ppm for N,N,N-trimethyl-, from δ 2.87 ppm or 3.00 ppm for N,N,-dimethyl- and from
δ 2.77 ppm or 2.80 ppm for N-monomethylamino , respectively. The integral of [O3 (CH3)] is
obtained from δ 3.35 ppm for the O-methyl and at δ 3.43 ppm for O6-CH3. The integral used

69
for the protons ([H-2, H-3, H-4, H-5, H-6, H-6’]) was obtained from δ 5.0 to 5.7 ppm. The
degree of quaternisation is calculated as a percentage (Rúnarsson et al., 2007:2662).
Degree of quaternisation of N-trimethyl chitosan chloride (TMC)
% N,N,N-Trimethylation = [[N(CH3)3]
[H-2, H-3, H-4, H-5, H-6, H-6’] x 6
9] x 100
= [ [22.21][28.78+0.36]
x 69] x 100
= 50.81%
The degree of quaternisation of the synthesised TMC polymer was 50.81%. The degree of
quaternisation of TMC increases as the amount and time of the reaction steps in the
synthesis process were increased. In a previous study, a degree of quaternisation of 49%
was obtained with a four step reaction and it was stated that the absorption enhancing
effects depended on the degree of quaternisation of TMC. The highest degree of
quaternisation of TMC (48.8%) resulted in the best permeation enhancing effect (Jonker et
al., 2002:205,209). The calculations for the degrees of dimethylation and O-methylation are
given below.
% N,N-Dimethylation = [[N(CH3)]
[H-2, H-3, H-4, H-5, H-6, H-6’] x 6
9] x 100
= [[6.53]
[28.78+0.36] x 6
6] x 100
= 22.41 %
O-Methylation (O6-CH3):
% O-Methylation = [[O(CH3)]
[H-2, H-3, H-4, H-5, H-6, H-6’] x 6
6] x 100
= [[5.66]
[28.78+0.36] x 6
6] x 100
= 19.42 %
O-Methylation (O3-CH3):
% O-Methylation = [[O(CH3)]
[H-2, H-3, H-4, H-5, H-6, H-6’] x 6
6] x 100
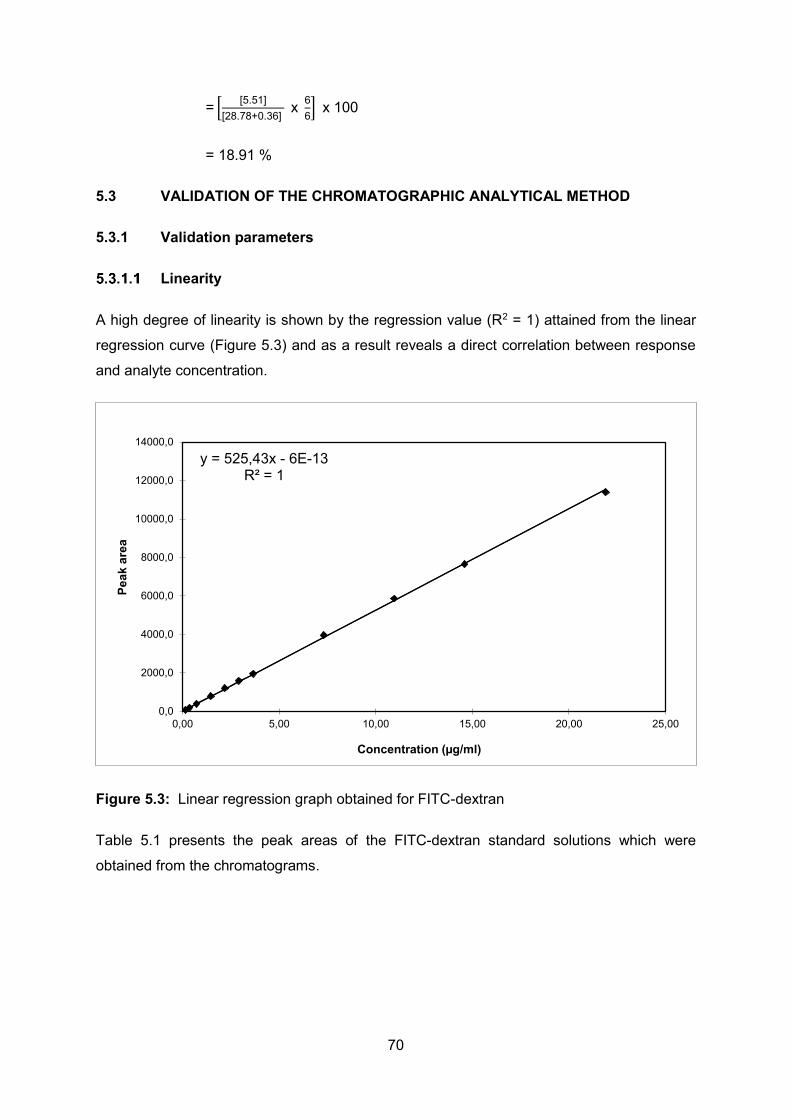
70
= [[5.51]
[28.78+0.36] x 6
6] x 100
= 18.91 %
5.3 VALIDATION OF THE CHROMATOGRAPHIC ANALYTICAL METHOD
5.3.1 Validation parameters
Linearity
A high degree of linearity is shown by the regression value (R2 = 1) attained from the linear
regression curve (Figure 5.3) and as a result reveals a direct correlation between response
and analyte concentration.
Figure 5.3: Linear regression graph obtained for FITC-dextran
Table 5.1 presents the peak areas of the FITC-dextran standard solutions which were
obtained from the chromatograms.
y = 525,43x - 6E-13R² = 1
0,0
2000,0
4000,0
6000,0
8000,0
10000,0
12000,0
14000,0
0,00 5,00 10,00 15,00 20,00 25,00
Peak
are
a
Concentration (µg/ml)

71
Table 5.1: Peak areas and linearity results of FITC-dextran standard solutions
5.3.2 Accuracy and precision
Accuracy
Table 5.2 displays the standard deviation (SD = 2.7%) and percentage relative standard
deviation (%RSD = 2.4%) on the recovery of FITC-dextran from spiked samples. The
results confirmed that the analytical method yielded an acceptable mean recovery of
116.0%.
Concentration (µg/ml) Mean peak area (mAU)
0.15 78.2
0.37 192.8
0.73 387.7
1.46 793.8
2.19 1206.3
2.92 1582.6
3.65 1960.9
7.30 3955.3
10.95 5855.6
14.60 7661.2
21.90 11401.6
R2 1 y-intercept 0
Slope 525.4299197
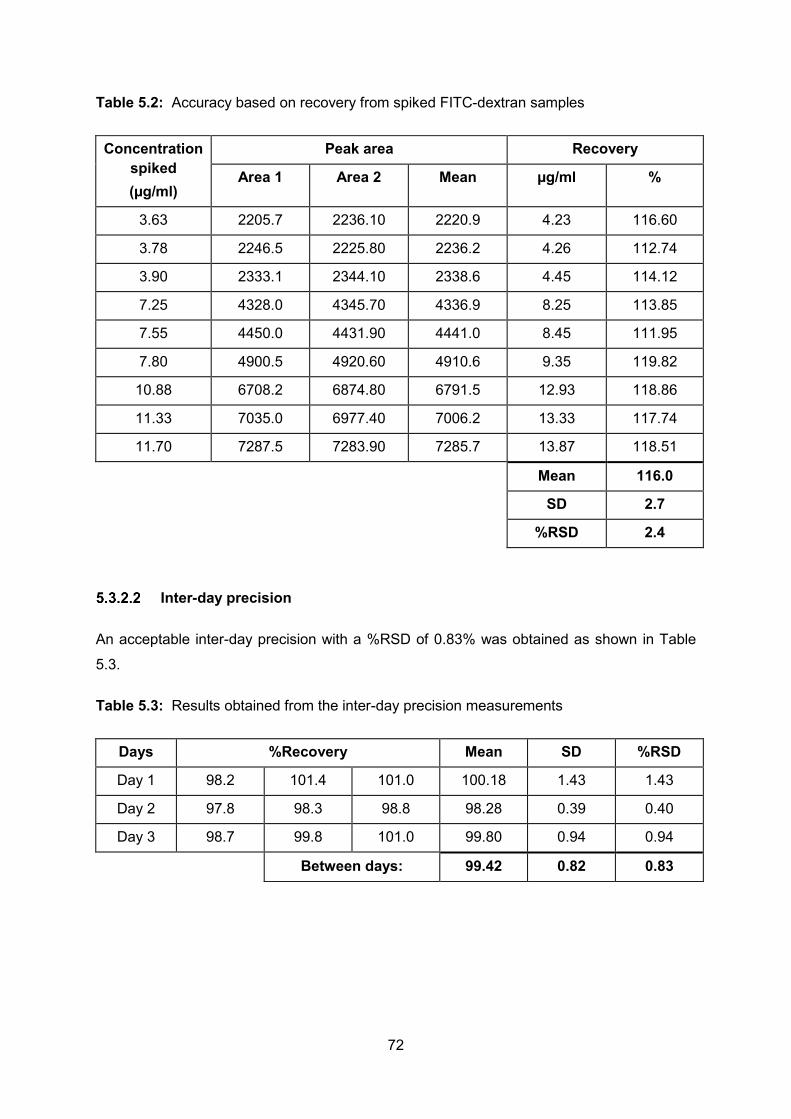
72
Table 5.2: Accuracy based on recovery from spiked FITC-dextran samples
Concentration spiked (µg/ml)
Peak area Recovery
Area 1 Area 2 Mean µg/ml %
3.63 2205.7 2236.10 2220.9 4.23 116.60
3.78 2246.5 2225.80 2236.2 4.26 112.74
3.90 2333.1 2344.10 2338.6 4.45 114.12
7.25 4328.0 4345.70 4336.9 8.25 113.85
7.55 4450.0 4431.90 4441.0 8.45 111.95
7.80 4900.5 4920.60 4910.6 9.35 119.82
10.88 6708.2 6874.80 6791.5 12.93 118.86
11.33 7035.0 6977.40 7006.2 13.33 117.74
11.70 7287.5 7283.90 7285.7 13.87 118.51
Mean 116.0
SD 2.7
%RSD 2.4
Inter-day precision
An acceptable inter-day precision with a %RSD of 0.83% was obtained as shown in Table
5.3.
Table 5.3: Results obtained from the inter-day precision measurements
Days %Recovery Mean SD %RSD
Day 1 98.2 101.4 101.0 100.18 1.43 1.43
Day 2 97.8 98.3 98.8 98.28 0.39 0.40
Day 3 98.7 99.8 101.0 99.80 0.94 0.94
Between days: 99.42 0.82 0.83

73
5.3.3 Ruggedness
As shown in Table 5.4, FITC-dextran was stable in solution over a period of 24 h.
Table 5.4: The stability of FITC-dextran in solution over 24 h
Time (h) Peak area of FITC-dextran Percentage (%)
0 3372.1 100.0
1 3334.9 98.9
2 3526.4 104.6
3 3255.0 96.5
4 3198.7 94.9
5 3236.3 96.0
6 3171.0 94.0
7 3256.0 96.6
8 3221.8 95.5
9 3277.2 97.2
10 3219.9 95.5
11 3310.9 98.2
12 3349.8 99.3
13 3332.7 98.8
14 3327.0 98.7
15 3413.2 101.2
16 3416.9 101.3
17 3410.5 101.1
18 3396.5 100.7
19 3438.7 102.0
20 3456.5 102.5
21 3475.3 103.1
22 3436.3 101.9
23 3466.4 102.8
24 3419.9 101.4
Mean 3349 99
SD 96.67 2.87
%RSD 2.89 2.89

74
5.3.4 System repeatability
As can be seen in Table 5.5, the %RSD for repeated injections of the same sample was in
the acceptable range with a value of 1.24% for peak area and a value of 0.031% for
retention time.
Table 5.5: %RSD for the peak area and retention time of FITC-dextran injected repeatedly
Injection number Peak area Retention times (min)
1 3067.8 4.951
2 3130.9 4.951
3 3104.2 4.951
4 3035.1 4.947
5 3063.1 4.949
6 3019.6 4.951
Mean 3070.1 4.950
SD 38.05 0.002
%RSD 1.24 0.031
5.3.5 Specificity
In Figure 5.4, the peak of the model compound alone, FITC-dextran, can be seen on the
HPLC chromatogram. The chromatograms showing the peaks of FITC-dextran in the
presence of A. vera, A. ferox, A. marlothii and TMC are shown in Figures 5.5 to 5.8,
respectively. The chromatograms confirm no intrusive peaks with the same retention time
as FITC-dextran were identified and that the method complies with specificity.

75
Figure 5.4: HPLC chromatogram illustrating the peak of FITC-dextran at a retention time of
5.811 min
Figure 5.5: HPLC chromatogram illustrating the peak of FITC-dextran at a retention time of
5.974 min in the presence of Aloe vera gel
min1 2 3 4 5 6 7 8 9
mAU
40
50
60
70
80
90
100
ADC1 A, ADC1 CHANNEL A (FITC\SPEC0100.D)
5.060
5.811
6.378
min1 2 3 4 5 6 7 8 9
mAU
0
200
400
600
800
1000
ADC1 A, ADC1 CHANNEL A (FITC\SPEC0106.D)
5.038
5.974
7.972
7.998
8.098
8.158
8.250
8.743

76
Figure 5.6: HPLC chromatogram illustrating the peak of FITC-dextran at a retention time of
6.028 min in the presence of Aloe ferox gel
Figure 5.7: HPLC chromatogram illustrating the peak of FITC-dextran at a retention time of
5.995 min in the presence of Aloe marlothii gel
min2 4 6 8
mAU
0
200
400
600
800
1000
ADC1 A, ADC1 CHANNEL A (FITC\SPEC0107.D)
5.066
6.028
8.064
8.579
9.189
9.297
9.435
9.482
9.559
9.796
9.983
min2 4 6 8
mAU
0
200
400
600
800
ADC1 A, ADC1 CHANNEL A (FITC\SPEC0108.D)
5.042
5.995

77
Figure 5.8: HPLC chromatogram illustrating the peak of FITC-dextran at a retention time of
6.067 min in the presence of TMC
5.3.6 Conclusion
The HPLC method for FITC-dextran was found to be consistent and sensitive enough for the
determination of the concentration of FITC-dextran in the in vitro transport samples. It is
also clear that the criteria for the validation parameters were met and the developed method
is therefore adequate and valid for the accurate analysis of transport samples.
min1 2 3 4 5 6 7 8 9
mAU
0
200
400
600
800
1000
ADC1 A, ADC1 CHANNEL A (FITC\SPEC0109.D)
5.038
6.067
8.080
8.238
9.145
9.299
9.443
9.758
9.859
9.955

78
5.4 EFFECT OF ABSORPTION ENHANCER COMBINATIONS ON TRANSEPITHELIAL ELECTRICAL RESISTANCE (TEER) AND DRUG TRANSPORT ACROSS CACO-2 CELL MONOLAYERS
5.4.1 Combination 1: Aloe vera and Aloe marlothii
Transepithelial electrical resistance (TEER) reduction at concentration 0.1% w/v
Figure 5.9 illustrates the effect of combination 1 (i.e. A. vera and A. marlothii), at
concentration 0.1% w/v, on the transepithelial electrical resistance (TEER) of Caco-2 cell
monolayers over a period of 120 min.
Figure 5.9: Reduction in the transepithelial electrical resistance (TEER) of Caco-2 cell
monolayers at concentration 0.1% w/v of different combination ratios of Aloe vera and Aloe
marlothii gel plotted as a function of time (n = 3, mean ± SD)
From Figure 5.9, it is evident some of the combination 1 ratios had an immediate reduction
effect (i.e. 20 min after application) on the TEER of the Caco-2 cell monolayers. At time 20
min, both A. vera alone (ratio 10:0) and in combination ratio 8:2 with A. marlothii had the
highest effect on TEER compared to the other groups in this experiment. Conversely, the
positive control group (TMC at 0.1% w/v) had the highest effect on the TEER from 60 min
onwards, but the TEER reduction effect occurred gradually over the first 60 min after
application of the solution to the cell monolayers. All other aloe gel material ratios in
0
20
40
60
80
100
120
140
160
180
0 20 40 60 80 100 120
Perc
enta
ge T
EER
(%)
Time (min)0.1% w/v AV_AM 10:0 0.1% w/v AV_AM 8:20.1% w/v AV_AM 5:5 0.1% w/v AV_AM 2:80.1% w/v AV_AM 0:10 Positive Control (TMC 0.1% w/v)Negative Control (Caco-2 cells)

79
combination 1 showed a decrease in TEER to different extends compared to the negative
control group (i.e. Caco-2 cell monolayers exposed only to DMEM). The TEER of the
negative control group remained constant over the entire period of the whole experiment,
indicating that the monolayers stayed intact for this period of time. The percentage TEER
reduction by 0.1% w/v of combination 1 at 60 and 120 min is shown in Figure 5.10. The
percentage TEER reduction was obtained by subtracting the percentage TEER values from
the value at time 0 (i.e. 100%), which quantitatively expresses the ability of each
experimental group to open the tight junctions between Caco-2 cells in the monolayers.
Figure 5.10: Percentage TEER reduction of Caco-2 cell monolayers at time points 60 and
120 min for all the ratios within combination 1 (i.e. Aloe vera and Aloe marlothii) at
concentration 0.1% w/v, as well as control groups. Bars on the graph marked with * indicate
statistically significant differences with the negative control group (p ≤ 0.05) (n = 3, mean ±
SD)
It is apparent from Figure 5.10 that combination ratios 10:0, 8:2 and 2:8, at both 60 and 120
min, had a statistically significant effect (p ≤ 0.05) on the TEER when compared to the
negative control group. Ratio 5:5 of combination 1 and A. marlothii alone (0:10) did not
show a significant difference from the negative control group. The lower effect on the TEER
caused by the combination at ratio 5:5 can possibly be explained by a potential chemical or
physical interaction between the polysaccharides of the two aloe species at this specific ratio
(i.e. a stoichiometric related interaction).
0
10
20
30
40
50
60
70
80
90
100
PositiveControl
NegativeControl
10:0 8:2 5:5 2:8 0:10
Perc
enta
ge T
EER
redu
ctio
n
Ratios
0.1% w/v at 60 min 0.1% w/v at 120 min
0.1%
w/v
(60
min
)
0.1%
w/v
(120
min
)
(Caco-2 cells)
* *
* *
(TMC)
* *

80
The results correspond with findings of a previous study where Aloe vera gel statistically
significantly reduced the TEER of Caco-2 cell monolayers (Chen et al., 2009:591), whilst
A. marlothii (0:10) had a lower effect on the TEER of the epithelium (Lebitsa et al.,
2012:297). The results in this study from combination 1 indicate that Aloe vera is capable of
increasing the effect of A. marlothii at some of the combination ratios, whilst decreasing it at
other combination ratios.
Transepithelial electrical resistance (TEER) reduction at concentration 0.5% w/v
Figure 5.11 illustrates the effect of combination 1 (i.e. A. vera and A. marlothii) at
concentration 0.5% w/v on the transepithelial electrical resistance (TEER) of Caco-2 cell
monolayers, over a period of 120 min.
Figure 5.11: Reduction in the transepithelial electrical resistance (TEER) of Caco-2 cell
monolayers at concentration 0.5% w/v of different combination ratios of Aloe vera and Aloe
marlothii gel plotted as a function of time (n = 3, mean ± SD)
The transepithelial electrical resistance (TEER) was greatly reduced by ratios 8:2 and 5:5 for
the first 40 min, but their effect on TEER decreased for the remaining period of the
experiment. None of the ratios had the ability to reduce the TEER greater than TMC alone
(i.e. the positive control group).
0
20
40
60
80
100
120
140
160
180
0 20 40 60 80 100 120
Perc
enta
ge T
EER
(%)
Time (min)0.5% w/v AV_AM 10:0 0.5% w/v AV_AM 8:20.5% w/v AV_AM 5:5 0.5% w/v AV_AM 2:80.5% w/v AV_AM 0:10 Positive Control (TMC 0.5% w/v)Negative Control (Caco-2 cells alone)
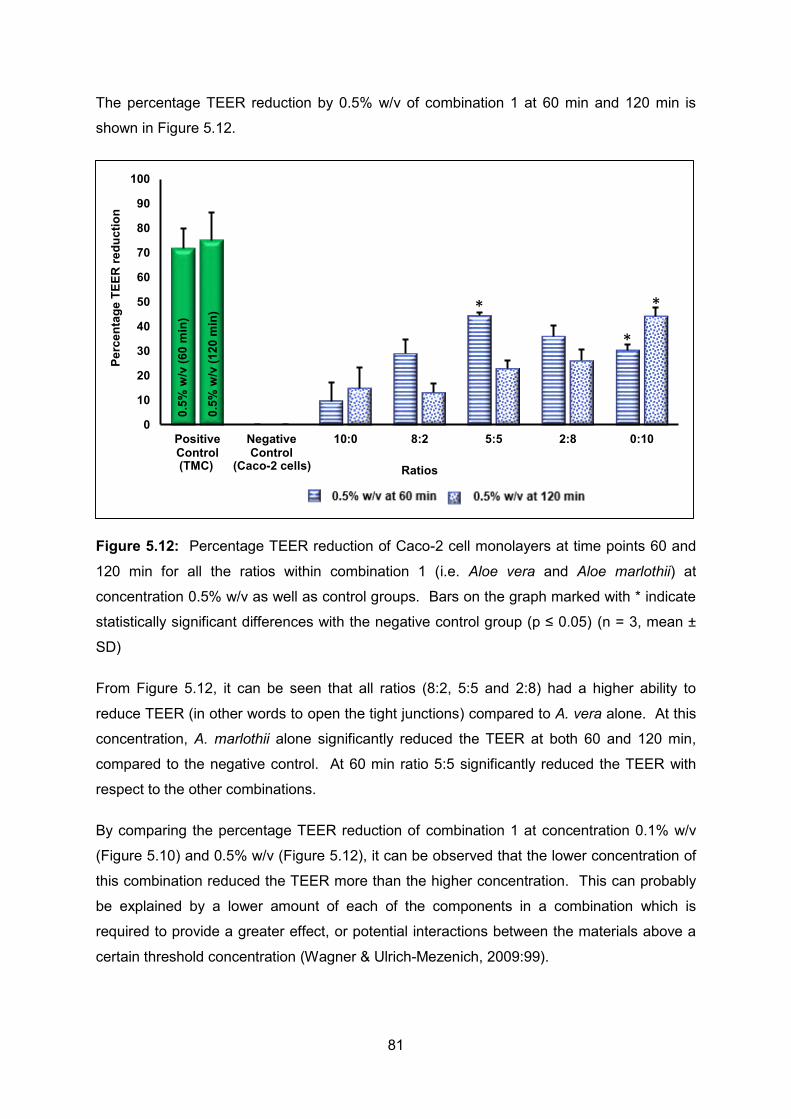
81
The percentage TEER reduction by 0.5% w/v of combination 1 at 60 min and 120 min is
shown in Figure 5.12.
Figure 5.12: Percentage TEER reduction of Caco-2 cell monolayers at time points 60 and
120 min for all the ratios within combination 1 (i.e. Aloe vera and Aloe marlothii) at
concentration 0.5% w/v as well as control groups. Bars on the graph marked with * indicate
statistically significant differences with the negative control group (p ≤ 0.05) (n = 3, mean ±
SD)
From Figure 5.12, it can be seen that all ratios (8:2, 5:5 and 2:8) had a higher ability to
reduce TEER (in other words to open the tight junctions) compared to A. vera alone. At this
concentration, A. marlothii alone significantly reduced the TEER at both 60 and 120 min,
compared to the negative control. At 60 min ratio 5:5 significantly reduced the TEER with
respect to the other combinations.
By comparing the percentage TEER reduction of combination 1 at concentration 0.1% w/v
(Figure 5.10) and 0.5% w/v (Figure 5.12), it can be observed that the lower concentration of
this combination reduced the TEER more than the higher concentration. This can probably
be explained by a lower amount of each of the components in a combination which is
required to provide a greater effect, or potential interactions between the materials above a
certain threshold concentration (Wagner & Ulrich-Mezenich, 2009:99).
0
10
20
30
40
50
60
70
80
90
100
PositiveControl
NegativeControl
10:0 8:2 5:5 2:8 0:10
Perc
enta
ge T
EER
redu
ctio
n
Ratios
0.5% w/v at 60 min 0.5% w/v at 120 min
0.5%
w/v
(60
min
)
0.5%
w/v
(120
min
)
(TMC) (Caco-2 cells)
0.5% w/
*
*
*
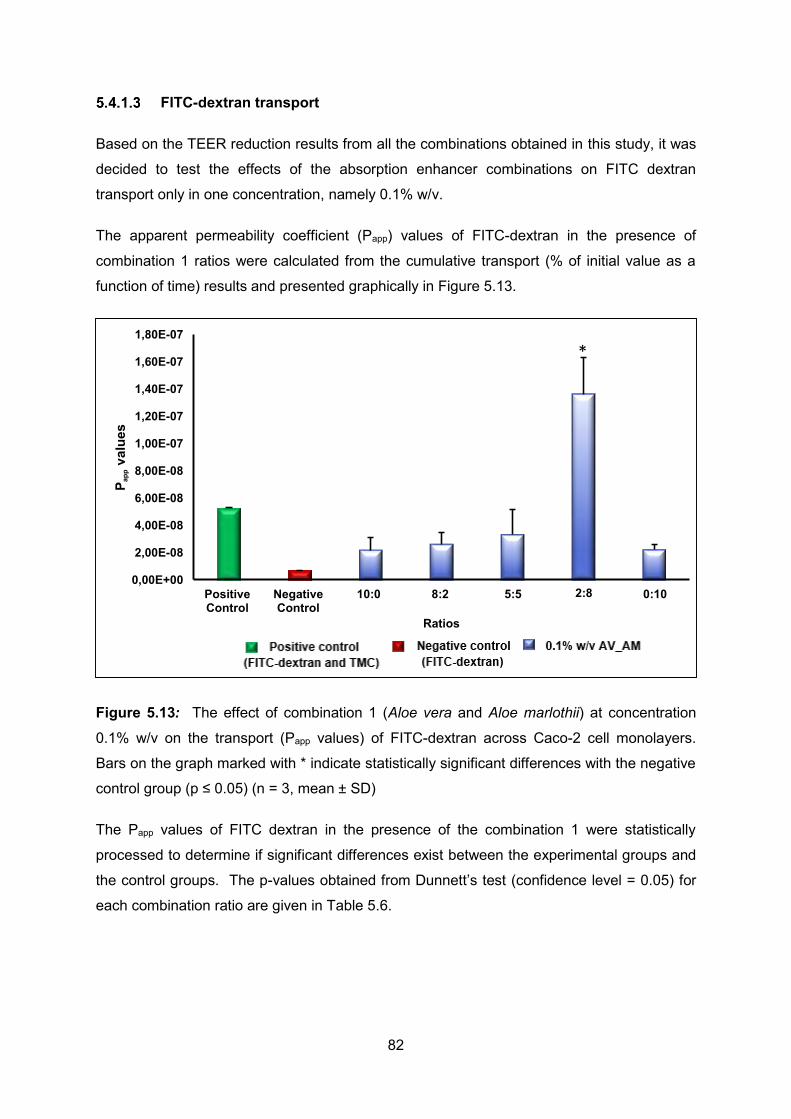
82
FITC-dextran transport
Based on the TEER reduction results from all the combinations obtained in this study, it was
decided to test the effects of the absorption enhancer combinations on FITC dextran
transport only in one concentration, namely 0.1% w/v.
The apparent permeability coefficient (Papp) values of FITC-dextran in the presence of
combination 1 ratios were calculated from the cumulative transport (% of initial value as a
function of time) results and presented graphically in Figure 5.13.
Figure 5.13: The effect of combination 1 (Aloe vera and Aloe marlothii) at concentration
0.1% w/v on the transport (Papp values) of FITC-dextran across Caco-2 cell monolayers.
Bars on the graph marked with * indicate statistically significant differences with the negative
control group (p ≤ 0.05) (n = 3, mean ± SD)
The Papp values of FITC dextran in the presence of the combination 1 were statistically
processed to determine if significant differences exist between the experimental groups and
the control groups. The p-values obtained from Dunnett’s test (confidence level = 0.05) for
each combination ratio are given in Table 5.6.
0,00E+00
2,00E-08
4,00E-08
6,00E-08
8,00E-08
1,00E-07
1,20E-07
1,40E-07
1,60E-07
1,80E-07
PositiveControl
NegativeControl
0.1% w/v
P app
valu
es
Ratios
Positive Control Negative Control 0.1% w/v
*
(FITC-dextran and TMC) (FITC-dextran)
10:0 8:2 5:5 2:8 0:10
0.1% w/v AV_AMPositive control Negative control
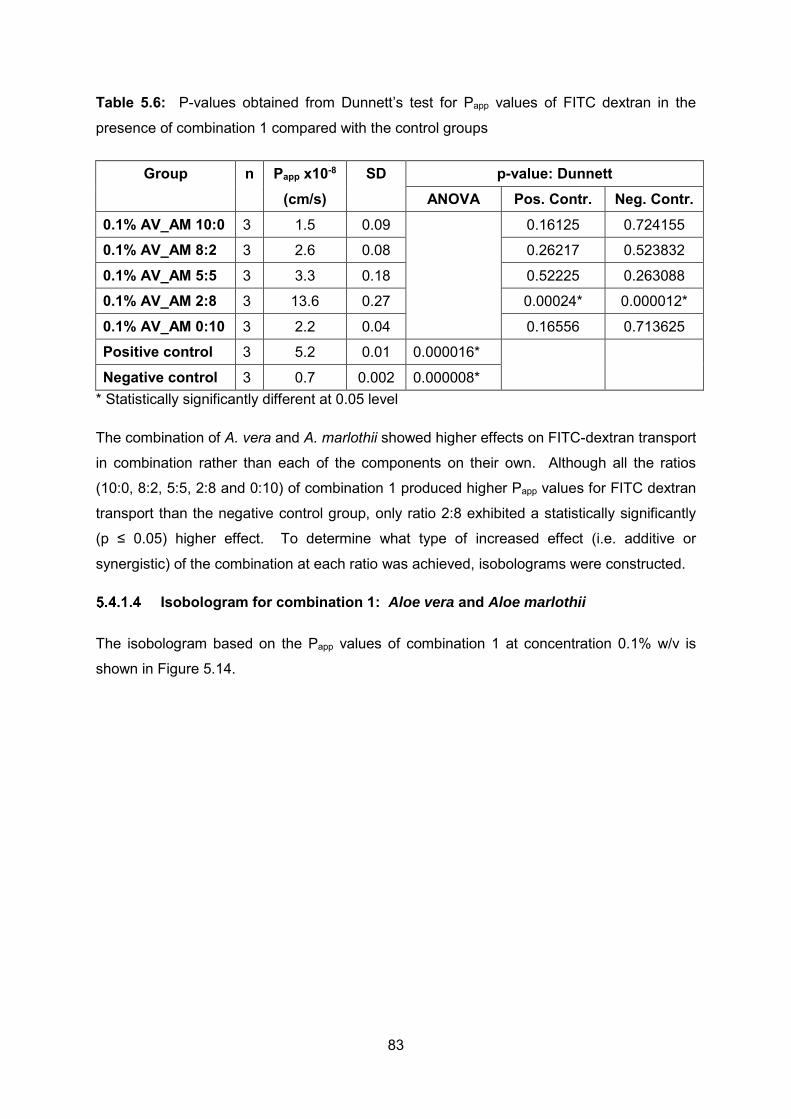
83
Table 5.6: P-values obtained from Dunnett’s test for Papp values of FITC dextran in the
presence of combination 1 compared with the control groups
Group n Papp x10-8 SD p-value: Dunnett
(cm/s)
ANOVA Pos. Contr. Neg. Contr.
0.1% AV_AM 10:0 3 1.5 0.09 0.16125 0.724155
0.1% AV_AM 8:2 3 2.6 0.08 0.26217 0.523832
0.1% AV_AM 5:5 3 3.3 0.18 0.52225 0.263088
0.1% AV_AM 2:8 3 13.6 0.27 0.00024* 0.000012*
0.1% AV_AM 0:10 3 2.2 0.04 0.16556 0.713625
Positive control 3 5.2 0.01 0.000016*
Negative control 3 0.7 0.002 0.000008* * Statistically significantly different at 0.05 level
The combination of A. vera and A. marlothii showed higher effects on FITC-dextran transport
in combination rather than each of the components on their own. Although all the ratios
(10:0, 8:2, 5:5, 2:8 and 0:10) of combination 1 produced higher Papp values for FITC dextran
transport than the negative control group, only ratio 2:8 exhibited a statistically significantly
(p ≤ 0.05) higher effect. To determine what type of increased effect (i.e. additive or
synergistic) of the combination at each ratio was achieved, isobolograms were constructed.
Isobologram for combination 1: Aloe vera and Aloe marlothii
The isobologram based on the Papp values of combination 1 at concentration 0.1% w/v is
shown in Figure 5.14.

84
Figure 5.14: Isobologram of the apparent permeability coefficient (Papp) values of FITC-
dextran in the presence of combination 1 (Aloe vera and Aloe marlothii) at different ratios
From Figure 5.14, it is apparent a synergistic absorption enhancement effect was obtained
at all ratios (8:2, 5:5 and 2:8) of combination 1 with the most prominent synergistic effect
found at ratio 2:8. Microcalorimetric data did not indicate any interactions occurring between
the A. vera and A. marlothii gels. Therefore it can be concluded that the two compounds
contribute individually to the synergistic effect regarding the enhanced transport of FITC-
dextran across the Caco-2 cell monolayers.
Conclusion
The TEER results obtained for combination 1 (A. vera and A. marlothii) showed a reduction
in TEER to different extents for the different ratios and therefore also different abilities of
each component and the different combinations to open tight junctions. The combinations
showed, in most cases, an enhanced TEER reduction effect compared to that of at least one
of the components and in some cases both components.
In correspondence with the TEER results, each component as well as the different ratios of
combination 1 showed the ability to increase FITC-dextran transport across Caco-2 cell
monolayers compared to that of the negative control group (FITC-dextran alone). The
combination of A. vera with A. marlothii gel produced a synergistic effect at all the ratios in
terms of FITC-dextran transport as determined by the isobole method.

85
5.4.2 Combination 2: Aloe vera and Aloe ferox
Transepithelial electrical resistance (TEER) reduction at concentration 0.1% w/v
The effect of combination 2 (i.e. A. vera and A. ferox) on the transepithelial electrical
resistance (TEER) of Caco-2 cell monolayers is shown in Figure 5.15, over a period of 120
min.
Figure 5.15: Reduction in the transepithelial electrical resistance (TEER) of Caco-2 cell
monolayers at concentration 0.1% w/v of different combination ratios of Aloe vera and Aloe
ferox gel plotted as a function of time (n = 3, mean ± SD)
Combination 2, in a ratio of 8:2, exhibited a relatively low TEER reduction effect, whilst ratio
5:5 and A. ferox alone (ratio 0:10) resulted in a negligible decrease in TEER over the entire
testing period of 120 min. It is further evident from Figure 5.15 that A. vera gel alone (ratio
10:0) initially caused (i.e. at time 20 min) a relatively high effect on the TEER, which was
higher than the positive control group (TMC 0.1% w/v). This effect could not be maintained
by A. vera gel throughout the entire testing period of 120 min and the TEER increased again
from 40 min onwards. In contrast, the effect of the positive control group (TMC alone at 0.1
% w/v) on the TEER increased constantly and it had the highest effect on the TEER from 60
min onwards. The TEER of the negative control group remained constant (slightly above
0
20
40
60
80
100
120
140
160
180
0 20 40 60 80 100 120
Perc
enta
ge T
EER
(%)
Time (min)0.1% w/v AV_AF 10:0 0.1% w/v AV_AF 8:20.1% w/v AV_AF 5:5 0.1% w/v AV_AF 2:80.1% w/v AV_AF 0:10 Positive Control (TMC 0.1% w/v)Negative Control (Caco-2 cells)

86
100%) over the entire period of the whole experiment, indicating the monolayers stayed
intact for this period of time.
The percentage TEER reduction values at time points 60 and 120 min at concentration
0.1% w/v of combination 2 are shown in Figure 5.16.
Figure 5.16: Percentage TEER reduction of Caco-2 cell monolayers at time points 60 and
120 min for all the ratios within combination 2 (i.e. Aloe vera and Aloe ferox) at concentration
0.1% w/v as well as control groups. Bars on the graph marked with * indicate statistically
significant differences with the negative control group (p ≤ 0.05) (n = 3, mean ± SD)
From Figure 5.16, it can be seen that A. vera alone (10:0) and in ratio 2:8 of combination 2
reduced the TEER of the Caco-2 cell monolayers statistically significantly compared to that
of the negative control group. Ratios 8:2 and 5:5 of combination 2 had a relatively low effect
on the TEER of the monolayers at both time points (i.e. 60 and 120 min). A. ferox alone
(0:10) had a time dependent effect on the TEER, which statistically significantly differed from
the negative control group at 120 min. The positive control group (TMC 0.1% w/v) resulted
in the highest reduction in TEER and none of the combinations were able to exert a higher
effect.
0
10
20
30
40
50
60
70
80
90
100
PositiveControl
NegativeControl
10:0 8:2 5:5 2:8 0:10
Perc
enta
ge T
EER
redu
ctio
n (%
)
Ratios
0.1% w/v at 60 min 0.1% w/v at 120 min
0.1%
w/v
(60m
in)
0.1%
w/v
(120
min
)
(TMC) (Caco-2 cells)
*
* *
*
*

87
Transepithelial electrical resistance (TEER) reduction at concentration 0.5% w/v
Figure 5.17 presents the TEER values of the Caco-2 cells exposed to combination 2 at a
concentration 0.5% w/v in different ratios, as well as that of the control groups over a period
of 120 min.
Figure 5.17: Reduction in the transepithelial electrical resistance (TEER) of Caco-2 cell
monolayers at concentration 0.5% w/v of different combination ratios of Aloe vera and Aloe
ferox gel plotted as a function of time (n = 3, mean ± SD)
It is clear from Figure 5.17 that ratio 2:8 had the highest reduction in TEER compared to the
other combination ratios. A. vera alone (10:0) exhibited a relatively low effect on the TEER
of the monolayers, which is similar to the TEER results obtained for A. vera in combination 1.
A. ferox showed a time-dependent TEER reduction effect on the Caco-2 cell monolayers.
Ratios 8:2 and 5:5 of combination 2 reduced the TEER to a relatively large extent at the first
time point of the experiment (i.e. 20 min), but the TEER increased slightly thereafter. The
highest TEER reduction effect was seen for the positive control group (TMC 0.5% w/v). The
negative control group (Caco-2 cells with no addition of absorption enhancers) displayed no
TEER reduction effect over the entire period of the experiment.
Figure 5.18 illustrates the percentage TEER reduction values at time points 60 and 120 min,
for combination 2 at a concentration of 0.5% w/v.
0
20
40
60
80
100
120
140
160
180
0 20 40 60 80 100 120
Perc
enta
ge T
EER
(%)
Time (min)0.5% w/v AV_AF 10:0 0.5% w/v AV_AF 8:20.5% w/v AV_AF 5:5 0.5% w/v AV_AF 2:80.5% w/v AV_AF 0:10 Positive Control (TMC 0.5% w/v)Negative Control (Caco-2 cells)

88
Figure 5.18: Percentage TEER reduction of Caco-2 cell monolayers at time points 60 and
120 min for all the ratios within combination 2 (i.e. Aloe vera and Aloe ferox) at concentration
0.5% w/v as well as control groups. Bars on the graph marked with * indicate statistically
significant differences with the negative control group (p ≤ 0.05) (n = 3, mean ± SD)
It can be seen in Figure 5.18 that only ratio 2:8 at 60 min showed a statistically significant
higher TEER reduction effect than the negative control group.
According to the percentage TEER reduction graphs for combination 2, at concentration
0.1% w/v (Figure 5.16) and concentration 0.5% w/v (Figure 5.18), none of the experimental
groups produced a significant higher effect than the positive control group (TMC 0.1% w/v
and TMC 0.5% w/v, respectively). A concentration-dependent effect was seen at ratios 5:5,
2:8 and A. ferox (0:10), where the percentage TEER reduction effect improved as the
concentration was increased.
The TEER results of combination 2 suggest that when A. vera is combined with A. ferox, it
may lead to increased TEER reduction in some ratios, while other ratios do not have the
ability to decrease the TEER to a higher extent than that of the components alone.
0
10
20
30
40
50
60
70
80
90
100
PositiveControl
NegativeControl
10:0 8:2 5:5 2:8 0:10
Perc
enta
ge T
EER
redu
ctio
n (%
)
Ratios
0.5% w/v at 60 min 0.5% w/v at 120 min
0.5%
w/v
(60
min
)
0.5%
w/v
(120
min
)
(Caco-2 cells)
0.5% w/v a
*
(TMC)

89
FITC-dextran transport
The apparent permeability coefficient (Papp) values of FITC-dextran in the presence of
combination 2 at different ratios were calculated from the cumulative transport (% of initial
value as a function of time) results and are presented graphically in Figure 5.19.
Figure 5.19: The effect of combination 2 (Aloe vera and Aloe ferox) at concentration
0.1% w/v on the transport (Papp values) of FITC-dextran across Caco-2 cell monolayers.
Bars on the graph marked with * indicate statistically significant differences with the negative
control group (p ≤ 0.05) (n = 3, mean ± SD)
The Papp values of FITC dextran in the presence of the combination 2 were statistically
processed to determine if they differ significantly from the control groups. The p-values from
Dunnett’s test for each combination ratio are given in Table 5.7.
0,00E+00
1,00E-08
2,00E-08
3,00E-08
4,00E-08
5,00E-08
6,00E-08
7,00E-08
8,00E-08
9,00E-08
PositiveControl
NegativeControl
0.1% w/vAV_AF
P app
valu
es
Ratios
Positive Control Negative Control 0.1% w/v AV_AF(FITC-dextran and TMC)
10:0 8:2 5:5 2:8 0:10
* * *
*
*

90
Table 5.7: P-values obtained from Dunnett’s test for Papp values of FITC dextran in the
presence of combination 2 compared with the control groups
Group n Papp x10-8 SD p-value: Dunnett
(cm/s)
ANOVA Pos. Contr. Neg. Contr.
0.1% AV_AF 10:0 3 1.5 0.09 0.00001* 0.00012*
0.1% AV_AF 8:2 3 2.6 0.002 0.00001* 0.00002*
0.1% AV_AF 5:5 3 2.6 0.02 0.00001* 0.00002*
0.1% AV_AF 2:8 3 4.2 0.04 0.00237* 0.00001*
0.1% AV_AF 0:10 3 7.6 0.04 0.00001* 0.00001*
Positive control 3 5.2 0.01 0.000000*
Negative control 3 0.7 0.002 1 * Statistically significantly different at 0.05 level
All the ratios of combination 2 resulted in a higher effect on the transport of FITC-dextran
compared to that of A. vera alone (10:0), which was statistically significantly (p ≤ 0.05) higher
than that of the negative control group. However, the all the combination 2 experimental
groups exhibited lower FITC dextran transport than that of A. ferox alone (0:10). To
determine the type of interaction (e.g. antagonistic or additive) between the components of
combination 2 at each ratio, isobolograms were constructed.
Isobologram for combination 2: Aloe vera and Aloe ferox
The isobologram, based on the Papp values of FITC dextran in the presence of the
combination 2 ratios at concentration 0.1% w/v is shown in Figure 5.20.

91
Figure 5.20: Isobologram of the apparent permeability coefficient (Papp) values of FITC-
dextran in the presence of combination 2 (Aloe vera and Aloe ferox) at different ratios
Combination 2 (i.e. A. vera gel combined with A. ferox gel) resulted in an additive effect (or
zero interaction) at ratio 8:2, while the other two ratios (i.e. 5:5 and 2:8) resulted in
antagonism with respect to FITC dextran transport across Caco-2 cell monolayers. This is in
line with the TEER reduction results obtained for combination 2 at a concentration of
0.1% w/v. A possible explanation for the negative interaction between A. vera gel and A.
ferox gel, in terms of FITC-dextran transport, may be a physical or chemical interaction
between the phytochemicals of these two gel materials. The isothermal heat-conduction
microcalorimetry results indicated that interactions occurred at ratios 8:2, 5:5 and 2:8.
Conclusion
The TEER results obtained for combination 2 (A. vera and A. ferox) at both concentrations
0.1% w/v and 0.5% w/v showed the ability of each component and the combinations to open
tight junctions between adjacent epithelial cells as evident from a decrease in the TEER of
the Caco-2 cell monolayers.
In correspondence with the TEER reduction results obtained for combination 2 at a
concentration of 0.1% w/v, each component as well as the different ratios of combination 2
showed increased FITC-dextran transport across Caco-2 cell monolayers when compared to
the negative control group, albeit lower than that of A. ferox alone (i.e. ratio 0:10). From the
isobologram of combination 2, an additive effect (or zero interaction) at ratio 8:2 was
detected, whilst the two remaining ratios, 5:5 and 2:8 resulted in antagonism.

92
5.4.3 Combination 3: Aloe marlothii and Aloe ferox
Transepithelial electrical resistance (TEER) reduction at concentration 0.1% w/v
Figure 5.21 illustrates the effect of combination 3 (i.e. A. marlothii and A. ferox) on the
transepithelial electrical resistance (TEER) of Caco-2 cell monolayers, over a period of 120
min.
Figure 5.21: Reduction in the transepithelial electrical resistance (TEER) of Caco-2 cell
monolayers at a concentration of 0.1% w/v of different combination ratios of Aloe marlothii
and Aloe ferox gel plotted as a function of time (n = 3, mean ± SD)
Combination 3 (i.e. A. marlothii and A. ferox) exhibited only a relatively slight (almost
negligible) TEER reduction at al ratios (10:0, 8:2, 5:5, 2:8 and 0:10) over the experiment time
period of 120 min. The positive control group (TMC at 0.5% w/v) had the highest effect on
the TEER reduction, which occurred gradually in a time dependent manner after application
of the TMC solution to the cell monolayers (which is in accordance with other groups
investigated in this study). The TEER of the negative control group remained constant
(close to and slightly above the initial measurement at time 0) over the entire period of the
experiment (i.e. 120 min), indicating that the monolayers stayed intact for this period of time.
Figure 5.22 illustrates the percentage TEER reduction values for combination 3 at different
ratios at time points, 60 and 120 min.
0
20
40
60
80
100
120
140
160
180
0 20 40 60 80 100 120
Perc
enta
ge T
EER
(%)
Time (min)0.1% w/v AM_AF 10:0 0.1% w/v AM_AF 8:20.1% w/v AM_AF 5:5 0.1% w/v AM_AF 2:80.1% w/v AM_AF 0:10 Positive Control (TMC 0.1% w/v)Negative Control (Caco-2 cells)

93
Figure 5.22: Percentage TEER reduction of Caco-2 cell monolayers at time points 60 and
120 min for all the ratios within combination 3 (i.e. Aloe marlothii and Aloe ferox) at
concentration 0.1% w/v, as well as control groups. Bars on the graph marked with * indicate
statistically significant differences with the negative control group (p ≤ 0.05) (n = 3, mean ±
SD)
Statistically significant higher TEER reduction effects were seen at all ratios of combination
3, except for A. marlothii alone at 120 min (i.e. ratio 10:0) compared to the negative control
group (i.e. Caco-2 cell monolayers without exposure to absorption enhancers). The effect of
the combination ratios on TEER was slightly higher than those of the individual components,
but was in general lower when compared to other aloe gel material combinations.
As previously mentioned, A. marlothii gel (0:10) had a lower effect on the TEER of the
epithelium (Lebitsa et al., 2012:297), where A. ferox gel showed to reduce the TEER
significantly across Caco-2 cell monolayers (Beneke et al., 2012:479). This confirms the
possibility of an interaction between the aloe components leading to a decrease in the TEER
reduction ability of the combination.
0
10
20
30
40
50
60
70
80
90
100
PositiveControl
NegativeControl
10:0 8:2 5:5 2:8 0:10
Perc
enta
ge T
EER
redu
ctio
n (%
)
Ratios
0.1% w/v at 60 min 0.1% w/v at 120 min
0.1%
w/v
(60m
in)
0.1%
w/v
(120
min
)
(TMC) (Caco-2 cells)
**
** * * ** *

94
Transepithelial electrical resistance (TEER) reduction at concentration 0.5% w/v
Figure 5.23 presents the TEER values of the Caco-2 cells exposed to the combination ratios
of A. marlothii and A. ferox at concentration 0.5% w/v, as well as the control groups over a
period of 120 min.
Figure 5.23: Reduction in the transepithelial electrical resistance (TEER) of Caco-2 cell
monolayers by a concentration of 0.5% w/v of different ratios of Aloe marlothii and Aloe ferox
gel plotted as a function of time (n = 3, mean ± SD)
From the TEER reduction results of combination 3 at concentration 0.5% w/v, A. marlothii
alone (10:0) showed the highest effect in terms of TEER reduction. Although ratio 8:2
reduced the TEER to a higher extent at 20 min than A. marlothii alone (10:0), this effect was
not maintained. Ratios 5:5 and 2:8 exhibited only a relatively slight reduction in TEER
across the monolayers, while A. ferox alone (0:10) only started to reduce the TEER from 40
min onwards.
Figure 5.24 illustrates the percentage TEER reduction by 0.5% w/v of combination 3 at 60
and 120 min.
0
20
40
60
80
100
120
140
160
180
0 20 40 60 80 100 120
Perc
enta
ge T
EER
(%)
Time (min)0.5% w/v AM_AF 10:0 0.5% w/v AM_AF 8:20.5% w/v AM_AF 5:5 0.5% w/v AM_AF 2:80.5% w/v AM_AF 0:10 Positive Control (TMC 0.5% w/v)Negative Control (Caco-2 cells)
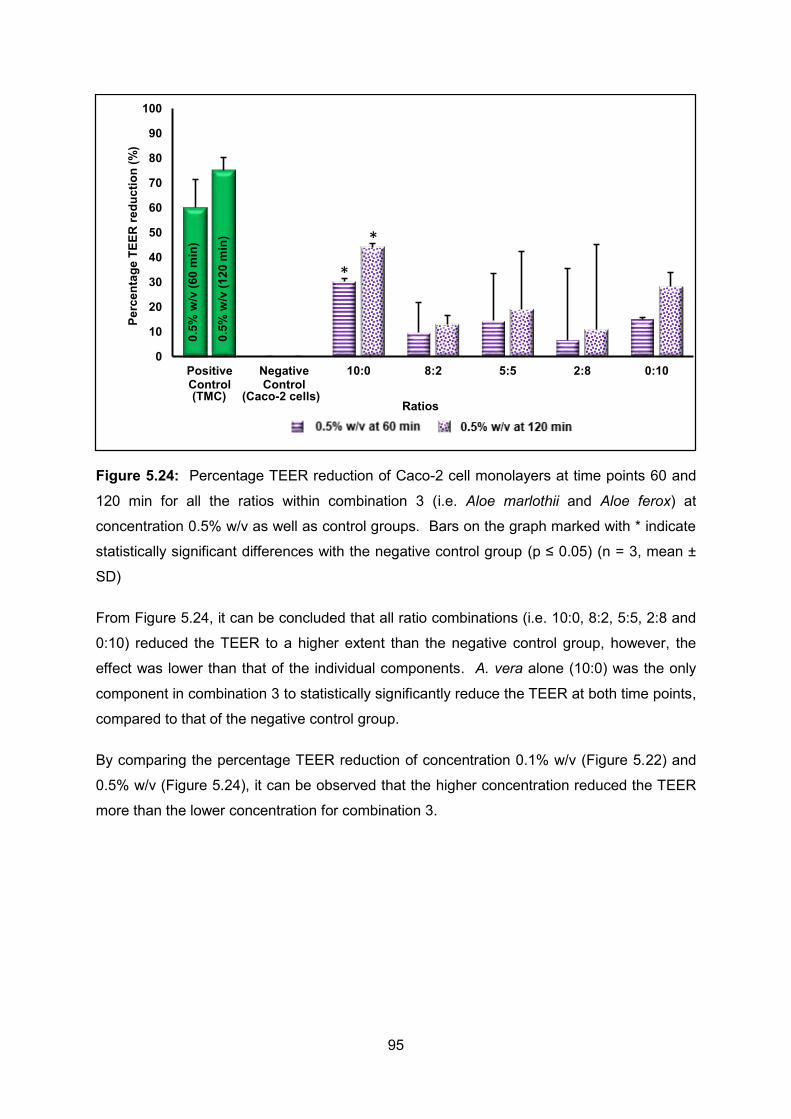
95
Figure 5.24: Percentage TEER reduction of Caco-2 cell monolayers at time points 60 and
120 min for all the ratios within combination 3 (i.e. Aloe marlothii and Aloe ferox) at
concentration 0.5% w/v as well as control groups. Bars on the graph marked with * indicate
statistically significant differences with the negative control group (p ≤ 0.05) (n = 3, mean ±
SD)
From Figure 5.24, it can be concluded that all ratio combinations (i.e. 10:0, 8:2, 5:5, 2:8 and
0:10) reduced the TEER to a higher extent than the negative control group, however, the
effect was lower than that of the individual components. A. vera alone (10:0) was the only
component in combination 3 to statistically significantly reduce the TEER at both time points,
compared to that of the negative control group.
By comparing the percentage TEER reduction of concentration 0.1% w/v (Figure 5.22) and
0.5% w/v (Figure 5.24), it can be observed that the higher concentration reduced the TEER
more than the lower concentration for combination 3.
0
10
20
30
40
50
60
70
80
90
100
PositiveControl
NegativeControl
10:0 8:2 5:5 2:8 0:10
Perc
enta
ge T
EER
redu
ctio
n (%
)
Ratios
0.5% w/v at 60 min 0.5% w/v at 120 min
0.5%
w/v
(60
min
)
0.5%
w/v
(120
min
)
(TMC) (Caco-2 cells)
*
*
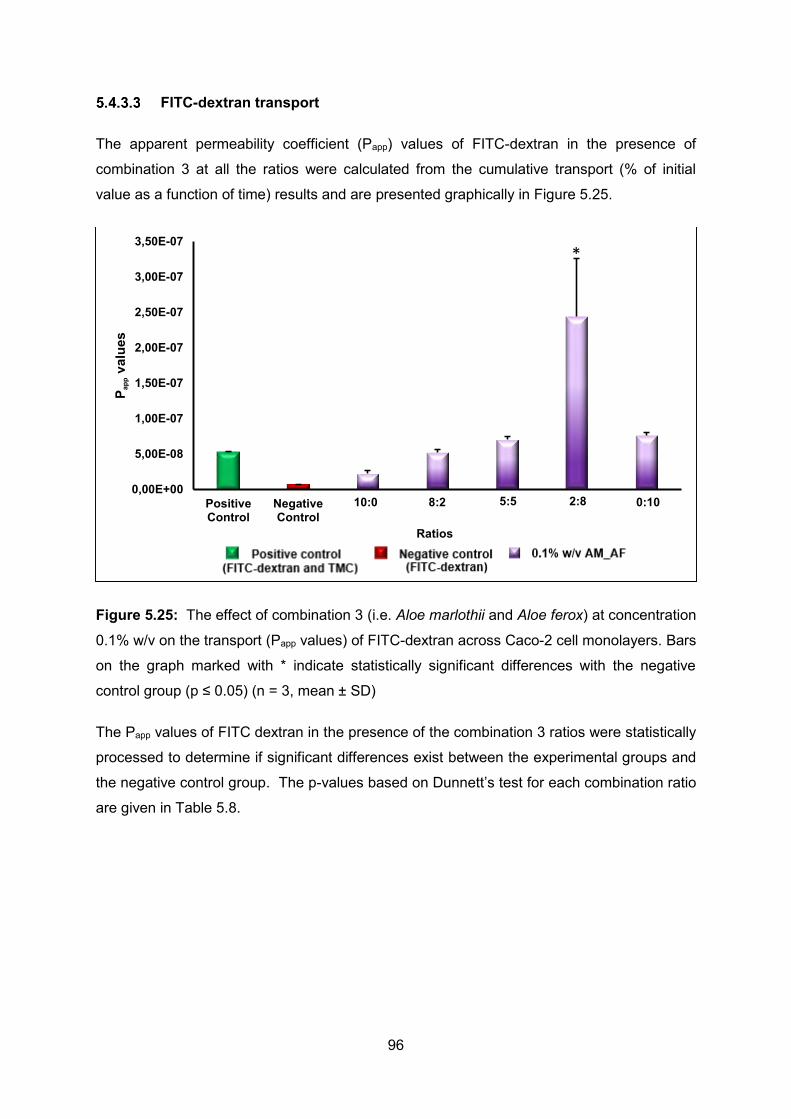
96
FITC-dextran transport
The apparent permeability coefficient (Papp) values of FITC-dextran in the presence of
combination 3 at all the ratios were calculated from the cumulative transport (% of initial
value as a function of time) results and are presented graphically in Figure 5.25.
Figure 5.25: The effect of combination 3 (i.e. Aloe marlothii and Aloe ferox) at concentration
0.1% w/v on the transport (Papp values) of FITC-dextran across Caco-2 cell monolayers. Bars
on the graph marked with * indicate statistically significant differences with the negative
control group (p ≤ 0.05) (n = 3, mean ± SD)
The Papp values of FITC dextran in the presence of the combination 3 ratios were statistically
processed to determine if significant differences exist between the experimental groups and
the negative control group. The p-values based on Dunnett’s test for each combination ratio
are given in Table 5.8.
0,00E+00
5,00E-08
1,00E-07
1,50E-07
2,00E-07
2,50E-07
3,00E-07
3,50E-07
PositiveControl
NegativeControl
0.1% w/vAM_AF
P app
valu
es
Ratios
Positive Control Negative Control 0.1% w/v AM_AF
10:0 8:2 5:5 2:8 0:10
(FITC-dextran and TMC) (FITC-dextran)Positive control Negative control 0.1% w/v AM_AF
*

97
Table 5.8: P-values obtained from Dunnett’s test for Papp values of FITC dextran in the
presence of combination 3 compared with the control groups.
Group n Papp x10-8 SD p-value: Dunnett
(cm/s)
ANOVA Pos. Contr. Neg. Contr.
0.1% AM_AF 10:0 3 2.2 0.04 0.83371 0.98754
0.1% AM_AF 8:2 3 5.2 0.05 1.00000 0.56020
0.1% AM_AF 5:5 3 7.0 0.05 0.97722 0.27646
0.1% AM_AF 2:8 3 24.4 0.82 0.00046* 0.00007*
0.1% AM_AF 0:10 3 7.6 0.04 0.92798 0.21025
Positive control 3 5.2 0.01 0.000364*
Negative control 3 0.7 0.002 0.00018* * Statistically significantly different at 0.05 level
All ratios of combination 3 (i.e. A. marlothii and A. ferox) increased the transport of FITC-
dextran more than A. marlothii alone (ratio 10:0), but only ratio 2:8 enhanced the FITC
dextran transport to a higher extent than A. ferox alone (ratio 0:10). Furthermore, only
combination ratio 2:8 increased the transport of FITC-dextran statistically significantly higher
than the negative control group across the Caco-2 cell monolayers. To determine the type
of effect (i.e. additive or synergistic) of the combination at each ratio, isobolograms were
constructed.
Isobologram for combination 3: Aloe marlothii and Aloe ferox
The isobologram based on the Papp values of FITC dextran transport for all ratios of
combination 3 at concentration 0.1% w/v is shown in Figure 5.26.

98
Figure 5.26: Isobologram of the apparent permeability coefficient (Papp) values of FITC-
dextran in the presence of combination 3 (i.e. Aloe marlothii and Aloe ferox) ratios
From Figure 5.26, it is apparent that combination 3 resulted in synergism in terms of FITC
dextran transport at all ratios (8:2, 5:5 and 2:8) with the most pronounced synergistic effect
found at ratio 2:8. The microcalorimetric data obtained with combination 3 showed an
interaction occurred between A. marlothii and A. ferox gel and it can therefore be concluded
that this interaction led to the synergistic enhancement of FITC-dextran transport across the
Caco-2 cell monolayer.
Conclusion
The TEER results obtained for combination 3 (i.e. A. marlothii and A. ferox) at both
concentrations (i.e. 0.1% w/v and 0.5% w/v) showed the different combination ratios are
capable of opening the tight junctions (to different extents) as indicated by a decrease in
TEER.
The in vitro transport results correspond with the TEER results of the same concentration.
Despite the overall relatively low TEER reduction and transport results, the combination of A.
marlothii with A. ferox gel produced a synergistic effect on FITC dextran transport as
determined by the isobole method.

99
5.4.4 Combination 4: Aloe vera and TMC
Transepithelial electrical resistance (TEER) reduction at concentration 0.1% w/v
Figure 5.27 illustrates the effect of combination 4 (i.e. A. vera and TMC) at concentration
0.1% w/v on the transepithelial electrical resistance (TEER) of Caco-2 cell monolayers over
a period of 120 min. The positive control group (TMC 0.1% w/v) is represented by ratio 0:10
where TMC 0.1% w/v is the only component (indicated as positive control in Figures 5.27
and 5.28).
Figure 5.27: Reduction in the transepithelial electrical resistance (TEER) of Caco-2 cell
monolayers at a concentration of 0.1% w/v of different combination ratios of Aloe vera and
TMC plotted as a function of time (n = 3, mean ± SD)
From Figure 5.27, it is clear that A. vera alone (10:0) reduced the TEER of the Caco-2 cell
monolayers to some extent after 20 min of application, but this was not maintained over
time. Ratio 8:2 of combination 4 displayed an effect comparable to that of the positive
control group (TMC 0.1% w/v) from 100 min onwards. Ratios 5:5 and 2:8, which contained
TMC in an equal or higher amount than A. vera, reduced the TEER to a lower extent
compared to that of ratio 8:2.
0
20
40
60
80
100
120
140
160
180
0 20 40 60 80 100 120
Perc
enta
ge T
EER
(%)
Time (min)0.1% w/v AV_TMC 10:0 0.1% w/v AV_TMC 8:20.1% w/v AV_TMC 5:5 0.1% w/v AV_TMC 2:8Positive Control (TMC 0.1% w/v) Negative Control (Caco-2 cells)

100
The TEER of the negative control group remained constant over the entire period of the
experiment, indicating the monolayers stayed intact for this period of time. Figure 5.28
illustrates the percentage TEER reduction by 0.1% w/v of combination 4 at 60 and 120 min.
Figure 5.28: Percentage TEER reduction of Caco-2 cell monolayers at time points 60 and
120 min for all the ratios within combination 4 (i.e. Aloe vera and TMC) at concentration
0.1% w/v as well as control groups. Bars on the graph marked with * indicate statistically
significant differences with the negative control group (p ≤ 0.05) (n = 3, mean ± SD)
It is clear from Figure 5.28 that combination 4 ratios 10:0, 8:2 and 0:10 at both time points
and ratio 2:8 at 120 min, statistically significantly (p ≤ 0.05) reduced the TEER when
compared to the negative control group (TMC 0.1% w/v). Ratio 5:5 of combination 4 and
ratio 2:8 at time 60 min did not show a significant difference from the negative control group.
In a previous study it was shown that A. vera gel statistically significantly reduced the TEER
of Caco-2 cell monolayers (Chen et al., 2009:591), where Kotzé et al. (1998: 40) indicated
that TMC reduced the TEER 60% from the initial value. The results of previous studies
correlates with the TEER data from this study and it is evident that combination 4 leads to an
increase in TEER reduction with the concurrent application of A. vera with TMC, where some
ratios enhanced the different components effect and other ratios negatively influenced the
TEER reduction effect.
0
10
20
30
40
50
60
70
80
90
100
PositiveControl
NegativeControl
10:0 8:2 5:5 2:8
Perc
enta
ge T
EER
redu
ctio
n (%
)
Ratios
0.1% w/v at 60 min 0.1% w/v at 120 min
0.1%
w/v
(60m
in)
0.1%
w/v
(120
min
)
(TMC) (Caco-2 cells)
*
*
*
*
*
0.1% w/v at 120 min
* *

101
Transepithelial electrical resistance (TEER) reduction at concentration 0.5% w/v
Figure 5.29 illustrates the effect of combination 4 (i.e. A. vera and TMC) at concentration
0.5% w/v on the transepithelial electrical resistance (TEER) of Caco-2 cell monolayers over
a period of 120 min. The positive control group (TMC 0.5% w/v) is represented by ratio 0:10
where TMC 0.5% w/v is the only component (indicated as positive control in Figures 5.29
and 5.30).
Figure 5.29: Reduction in the transepithelial electrical resistance (TEER) of Caco-2 cell
monolayers by a concentration of 0.5% w/v of different ratios of Aloe vera gel and TMC,
plotted as a function of time (n = 3, mean ± SD)
Incubation on the apical side of the Caco-2 cell monolayers with 0.5% w/v of combination 4
resulted in a pronounced and immediate reduction in TEER values compared to the A. vera
alone (10:0) and the negative control group (Caco-2 cells). Ratio 5:5 and 2:8 resulted in an
even greater reduction effect compared to the positive control group (TMC 0.5% w/v or ratio
0:10). A. vera alone (10:0) at 0.5 % w/v exhibited a relatively low decrease in the TEER.
This is in accordance with previous experiments on A. vera gel material, which showed lower
TEER reduction at higher concentrations occurred for A. vera gel (Lebitsa et al., 2012:302),
possibly due to a saturation effect.
0
20
40
60
80
100
120
140
160
180
0 20 40 60 80 100 120
Perc
enta
ge T
EER
(%)
Time (min)0.5% w/v AV_TMC 10:0 0.5% w/v AV_TMC 8:20.5% w/v AV_TMC 5:5 0.5% w/v AV_TMC 2:8Positive Control (TMC 0.5% w/v) Negative Control (Caco-2 cells)

102
The percentage TEER reduction by 0.5% w/v combination 4 at 60 minutes and 120 minutes
is shown in figure 5.30.
Figure 5.30: Percentage TEER reduction of Caco-2 cell monolayers at time points 60 and
120 min for all the ratios within combination 4 (Aloe vera and TMC) at concentration 0.5%
w/v as well as control groups. Bars on the graph marked with * indicate statistically
significant differences with the negative control group (p ≤ 0.05) (n = 3, mean ± SD)
From Figure 5.30, it can be seen that all ratios (8:2, 5:5 and 2:8) of combination 4 had a
pronouncedly higher ability to open the tight junctions compared to A. vera alone. A. vera
gel alone (ratio 10:0) was not statistically significantly different from the negative control
group. TMC alone (positive control) significantly reduced the TEER, at both 60 and 120
minutes, compared to the negative control group.
By comparing the percentage TEER reduction of concentration 0.1% w/v (Figure 5.28) and
0.5% w/v (Figure 5.30), it can be concluded that a definite concentration-dependent effect
occurred at ratios 8:2, 5:5 and 0:10, where 0.5% w/v resulted in a higher reduction in TEER
than 0.1% w/v.
0
10
20
30
40
50
60
70
80
90
100
PositiveControl
NegativeControl
10:0 8:2 5:5 2:8
Perc
enta
ge T
EER
redu
ctio
n (%
)
Ratios
0.5% w/v at 60 min 0.5% w/v at 120 min
0.5%
w/v
(60
min
)
0.5%
w/v
(120
min
)
(TMC) (Caco-2 cells)
**
0.5% w/v at 60 min
* * *
* * *

103
FITC-dextran transport
The apparent permeability coefficient (Papp) values of FITC-dextran in the presence of
combination 4 were calculated from the cumulative transport (% of initial value as a function
of time) results and are presented graphically in Figure 5.31.
Figure 5.31: The effect of combination 4 (Aloe vera and TMC) on the transport (Papp values)
of FITC-dextran across Caco-2 cell monolayers. Bars on the graph marked with * indicate
statistically significant differences with the negative control group (p ≤ 0.05) (n = 3, mean ±
SD)
The Papp values of FITC dextran in the presence of the combination 4 ratios were statistically
processed to determine if significant differences exist between the experimental groups and
the control groups. The p-values obtained from Dunnett’s test (confidence level = 0.05) for
each combination ratio are given in Table 5.9.
0,00E+00
1,00E-07
2,00E-07
3,00E-07
4,00E-07
5,00E-07
6,00E-07
7,00E-07
8,00E-07
PositiveControl
NegativeControl
0.1% w/vAV_TMC
P app
valu
es
RatiosPositive Control Negative Control 0.1% w/v AV_TMC
8:2 5:5 2:810:0
*
*

104
Table 5.9: P-values obtained from Dunnett’s test for Papp values of FITC dextran in the
presence of combination 4 compared with the control groups
Group n Papp x10-
8 SD p-value: Dunnett
(cm/s)
ANOVA Pos. Contr. Neg. Contr.
0.1% AV_TMC 10:0 3 1.5 0.09 0.78133 0.98332
0.1% AV_TMC 8:2 3 3.7 0.03 0.97400 0.78868
0.1% AV_TMC 5:5 3 61.1 0.73 0.00001* 0.00001*
0.1% AV_TMC 2:8 3 18.9 0.22
0.00819* 0.00034*
0.1% AV_TMC 0:10 3 5.2 0.01 - 0.47909
Positive control 3 5.2 0.01 0.00000*
Negative control 3 0.7 0.002 0.00000* * Statistically significantly different at 0.05 level
From Figure 5.31 and Table 5.9, it is apparent that all ratios of combination 4 increased the
transport of FITC-dextran from the apical to basolateral side of the monolayers. Statistically
significant (p ≤ 0.05) increases in the permeation was seen at ratio 5:5 (87-fold increase)
and at ratio 2:8 (27-fold increase) in the transport of FITC-dextran. A. vera alone (10:0) and
ratio 8:2 showed an increase in transport but it was not statistically significant compared to
the control groups. To determine if these increased effects of the combinations at each ratio
were either additive or synergistic, an isobologram was constructed.
Isobologram for combination 4: Aloe vera and TMC
The isobologram based on the Papp values of combination 4 at concentration 0.1% w/v is
shown in Figure 5.32.
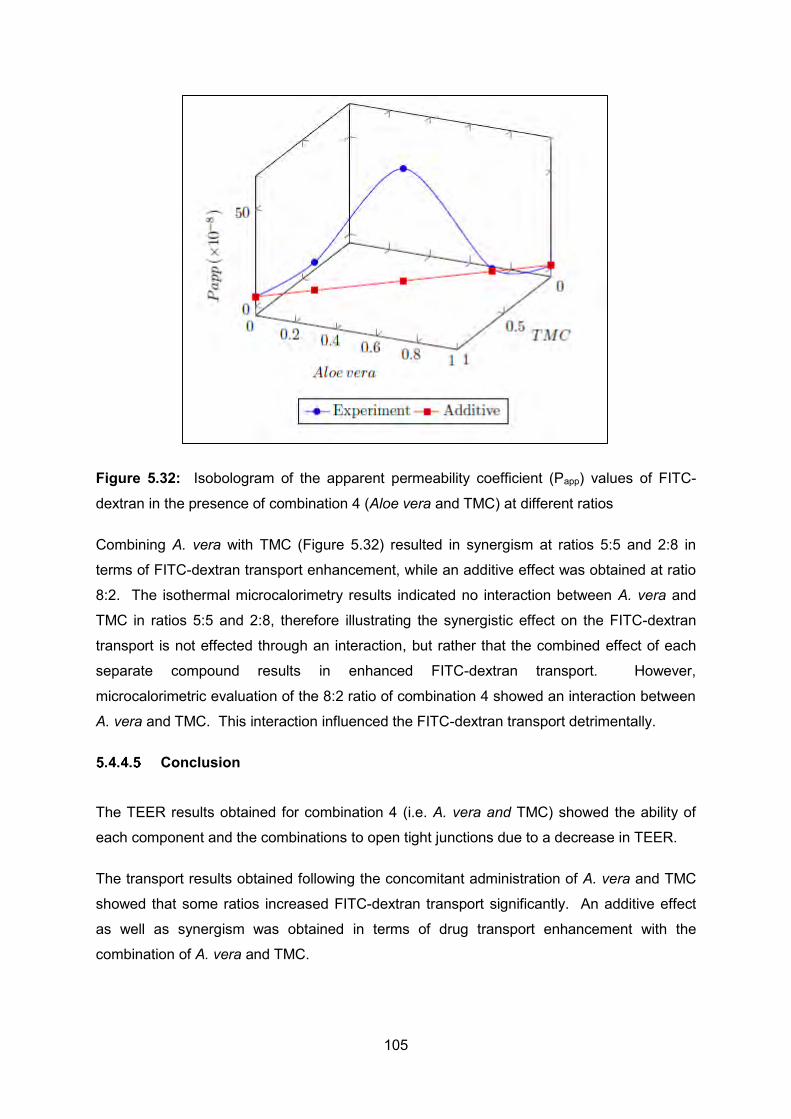
105
Figure 5.32: Isobologram of the apparent permeability coefficient (Papp) values of FITC-
dextran in the presence of combination 4 (Aloe vera and TMC) at different ratios
Combining A. vera with TMC (Figure 5.32) resulted in synergism at ratios 5:5 and 2:8 in
terms of FITC-dextran transport enhancement, while an additive effect was obtained at ratio
8:2. The isothermal microcalorimetry results indicated no interaction between A. vera and
TMC in ratios 5:5 and 2:8, therefore illustrating the synergistic effect on the FITC-dextran
transport is not effected through an interaction, but rather that the combined effect of each
separate compound results in enhanced FITC-dextran transport. However,
microcalorimetric evaluation of the 8:2 ratio of combination 4 showed an interaction between
A. vera and TMC. This interaction influenced the FITC-dextran transport detrimentally.
Conclusion
The TEER results obtained for combination 4 (i.e. A. vera and TMC) showed the ability of
each component and the combinations to open tight junctions due to a decrease in TEER.
The transport results obtained following the concomitant administration of A. vera and TMC
showed that some ratios increased FITC-dextran transport significantly. An additive effect
as well as synergism was obtained in terms of drug transport enhancement with the
combination of A. vera and TMC.
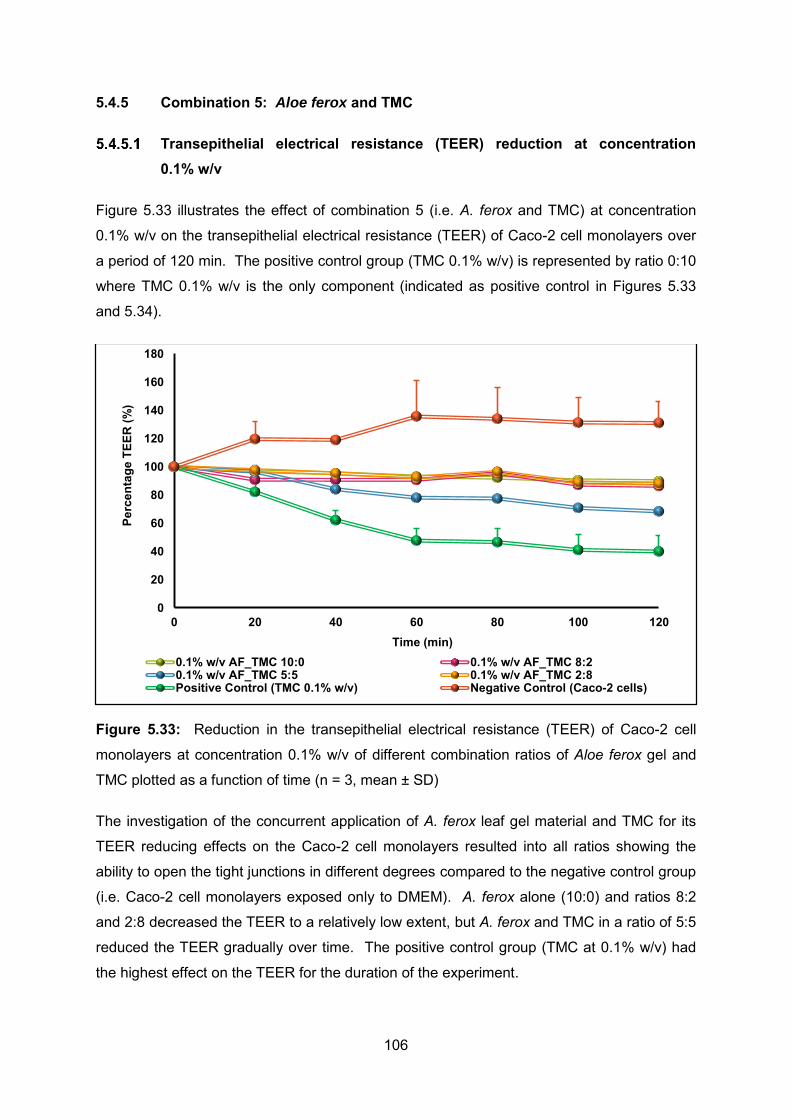
106
5.4.5 Combination 5: Aloe ferox and TMC
Transepithelial electrical resistance (TEER) reduction at concentration 0.1% w/v
Figure 5.33 illustrates the effect of combination 5 (i.e. A. ferox and TMC) at concentration
0.1% w/v on the transepithelial electrical resistance (TEER) of Caco-2 cell monolayers over
a period of 120 min. The positive control group (TMC 0.1% w/v) is represented by ratio 0:10
where TMC 0.1% w/v is the only component (indicated as positive control in Figures 5.33
and 5.34).
Figure 5.33: Reduction in the transepithelial electrical resistance (TEER) of Caco-2 cell
monolayers at concentration 0.1% w/v of different combination ratios of Aloe ferox gel and
TMC plotted as a function of time (n = 3, mean ± SD)
The investigation of the concurrent application of A. ferox leaf gel material and TMC for its
TEER reducing effects on the Caco-2 cell monolayers resulted into all ratios showing the
ability to open the tight junctions in different degrees compared to the negative control group
(i.e. Caco-2 cell monolayers exposed only to DMEM). A. ferox alone (10:0) and ratios 8:2
and 2:8 decreased the TEER to a relatively low extent, but A. ferox and TMC in a ratio of 5:5
reduced the TEER gradually over time. The positive control group (TMC at 0.1% w/v) had
the highest effect on the TEER for the duration of the experiment.
0
20
40
60
80
100
120
140
160
180
0 20 40 60 80 100 120
Perc
enta
ge T
EER
(%)
Time (min)0.1% w/v AF_TMC 10:0 0.1% w/v AF_TMC 8:20.1% w/v AF_TMC 5:5 0.1% w/v AF_TMC 2:8Positive Control (TMC 0.1% w/v) Negative Control (Caco-2 cells)

107
Figure 5.34 illustrates the percentage TEER reduction by 0.1% w/v of combination 5 at 60
and 120 min.
Figure 5.34: Percentage TEER reduction of Caco-2 cell monolayers at time points 60 and
120 min for all the ratios within combination 5 (Aloe ferox and TMC) at concentration
0.1% w/v, as well as control groups. Bars on the graph marked with * indicate statistically
significant differences with the negative control group (p ≤ 0.05) (n = 3, mean ± SD)
It is apparent from Figure 5.34 that ratios 8:2 and 5:5 of combination 5 and 0:10 (TMC alone
or positive control) at both 60 and 120 min had a statistically significant effect (p ≤ 0.05) on
the TEER when compared to the negative control group. Ratio 2:8 of combination 5
exhibited a significant effect only at 120 min. A. ferox alone (10:0) did not show a significant
difference from the negative control group. Of interest is ratio 5:5, which consisted of equal
amounts of each component (i.e. A. ferox and TMC), resulting in the highest TEER reduction
effect, where ratio 2:8 consisting of a higher amount of TMC, a known and proved absorption
enhancer, in the combination resulted in a lower reduction of TEER. This lower effect
obtained with a higher amount of TMC in the combination can possibly be attributed to the
cationic nature of TMC which can interact with anionic components of the aloe gel material.
0
10
20
30
40
50
60
70
80
90
100
PositiveControl
NegativeControl
10:0 8:2 5:5 2:8
Perc
enta
ge T
EER
redu
ctio
n (%
)
Ratios
0.1% w/v at 60 min 0.1% at 120 min
0.1%
w/v
(60m
in)
0.1%
w/v
(120
min
)
(TMC) (Caco-2 cells)
0.1% w/v at 60 min
* *
*
*
*
*
*

108
Transepithelial electrical resistance (TEER) reduction at concentration 0.5% w/v
Figure 5.35 illustrates the effect of combination 5 (A. ferox and TMC) at concentration
0.5% w/v on the transepithelial electrical resistance (TEER) of Caco-2 cell monolayers over
a period of 120 min. The positive control group (TMC 0.5% w/v) is represented by ratio 0:10
where TMC 0.5% w/v is the only component (indicated as positive control in Figures 5.35
and 5.36).
Figure 5.35: Reduction in the transepithelial electrical resistance (TEER) of Caco-2 cell
monolayers by concentration 0.5% w/v of different ratios of Aloe ferox gel and TMC plotted
as a function of time (n = 3, mean ± SD)
The transepithelial electrical resistance (TEER) was greatly reduced by ratio 2:8 of
combination 5 and TMC 0.5% w/v alone (positive control) for the total experiment time.
Ratio 2:8 even exerted a better TEER reduction effect than the positive control group. A.
ferox alone (10:0) and ratio 5:5 had a slow onset (i.e. 20 min) in terms of TEER reduction,
but this effect increased over time. Ratio 8:2 resulted in weakest TEER reduction effect
compared to the positive control. The negative control group remained constant over the
entire period of the whole experiment, showing the Caco-2 cell monolayers stayed intact.
Figure 5.36 illustrates the percentage TEER reduction by 0.5% w/v combination 5 at
concentration 0.5% w/v at 60 minutes and 120 minutes.
0
20
40
60
80
100
120
140
160
180
0 20 40 60 80 100 120
Perc
enta
ge T
EER
(%)
Time (min)0.5% w/v AF_TMC 10:0 0.5% w/v AF_TMC 8:20.5% w/v AF_TMC 5:5 0.5% w/v AF_TMC 2:8Positive Control (TMC 0.5% w/v) Negative Control (Caco-2 cells)

109
Figure 5.36: Percentage TEER reduction of Caco-2 cell monolayers at time points 60 and
120 min for all the ratios within combination 5 (i.e. Aloe ferox and TMC) at concentration
0.5% w/v as well as control groups. Bars on the graph marked with * indicate statistically
significant differences with the negative control group (p ≤ 0.05) (n = 3, mean ± SD)
From Figure 5.36, it can be seen that ratio 2:8 of combination 5 had a statistically significant
higher ability to open the tight junctions compared to both positive and negative control
groups. A. ferox alone (10:0) and ratio 5:5 also statistically significantly reduced the TEER
at both 60 and 120 min, compared to the negative control group. At both 60 and 120 min,
ratio 8:2 of combination 5 did not have the ability to significantly reduce the TEER in respect
to the negative control group.
By comparing the percentage TEER reduction of concentration 0.1% w/v (Figure 5.34) and
0.5% w/v (Figure 5.36), it can be observed that the higher concentration reduced the TEER
more than the lower concentration for A. ferox alone (10:0), ratios 5:5 and 2:8. Conversely,
an opposite effect occurred at ratio 8:2, which resulted in a lower TEER reduction effect at
the higher concentration (0.5% w/v).
0
10
20
30
40
50
60
70
80
90
100
PositiveControl
NegativeControl
10:0 8:2 5:5 2:8
Perc
enta
ge T
EER
redu
ctio
n (%
)
Ratios
0.5% w/v at 60 min 0.5% w/v at 120 min
0.5%
w/v
(60
min
)
0.5%
w/v
(120
min
)
(Caco-2 cells)
*
0.5% w/v at 60 min
(TMC)
*
*
*
*
*
*
*

110
FITC-dextran transport
The apparent permeability coefficient (Papp) values of FITC-dextran in the presence of
combination 5 ratios were calculated from the cumulative transport (% of initial value as a
function of time) results and are presented graphically in Figure 5.37.
Figure 5.37: The effect of combination 5 (Aloe ferox and TMC) on the transport
(Papp values) of FITC-dextran across Caco-2 cell monolayers. Bars on the graph marked
with * indicate statistically significant differences with the negative control group (p ≤ 0.05) (n
= 3, mean ± SD)
The Papp values of FITC-dextran in the presence of the combination 5 ratios were statistically
processed to determine if significant differences exist between the experimental groups and
the control groups. The p-values obtained from Dunnett’s test (confidence level = 0.05) for
each combination ratio are given in Table 5.10.
0,00E+00
2,00E-08
4,00E-08
6,00E-08
8,00E-08
1,00E-07
1,20E-07
1,40E-07
1,60E-07
1,80E-07
2,00E-07
PositiveControl
NegativeControl
0.1% w/vAF_TMC
P app
valu
es
Ratios
Positive Control Negative Control 0.1% w/v AF_TMC
8:2 5:5 2:8
(Caco-2 cells)(FITC-dextran and TMC)
**
*
10:0
Positive control Negative control(FITC-dextran)
*
*

111
Table 5.10: P-values obtained from Dunnett’s test for Papp values of FITC-dextran in the
presence of combination 5 compared with the control groups
Group n Papp x10-8 SD p-value: Dunnett
(cm/s)
ANOVA Pos. Contr. Neg. Contr.
0.1% AF_TMC 10:0 3 7.6 0.04 0.39516 0.00145*
0.1% AF_TMC 8:2 3 11.0 0.04 0.01199* 0.00004*
0.1% AF_TMC 5:5 3 14.1 0.34 0.00064* 0.00001*
0.1% AF_TMC 2:8 3 9.3 0.02 0.07398 0.00022*
0.1% AF_TMC 0:10 3 5.2 0.01 - 0.02682*
Positive control 3 5.2 0.01 0.001911*
Negative control 3 0.7 0.002 0.000011*
* Statistically significantly different at 0.05 level
The combination of A. ferox and TMC displayed higher effects on FITC-dextran transport in
combination compared to each of the components on their own. All the ratios (10:0, 8:2, 5:5,
2:8 and 0:10) of combination 5 produced statistically significantly (p ≤ 0.05) higher Papp
values for FITC dextran transport than the negative control group, where only ratios 8:2 and
5:5 exhibited a statistically significantly (p ≤ 0.05) higher effect in comparison with the
positive control group (FITC-dextran and TMC 0.1% w/v). To determine if these increased
effects of the combinations at each ratio are antagonistic, synergistic or additive,
isobolograms were constructed.

112
Isobologram for combination 5: Aloe ferox and TMC
The isobologram based on the Papp values of combination 5 at concentration 0.1% w/v is
shown in Figure 5.38.
Figure 5.38: Isobologram of the apparent permeability coefficient (Papp) values of FITC-
dextran in the presence of combination 5 (Aloe ferox and TMC) at different ratios
From Figure 5.38, it is apparent that combination 5 at all ratios (8:2, 5:5 and 2:8) resulted in
synergism with respect to FITC-dextran transport. The microcalorimetric data obtained with
combination 5 showed an interaction occurred between A. ferox gel and TMC. It can be
concluded that the interaction which occurred between A. ferox gel and TMC led to the
synergistic enhancement of FITC-dextran transport across the Caco-2 cell monolayer.
Conclusion
The TEER results obtained for combination 5 (Aloe ferox and TMC) showed the ability of
each component and the combinations to open tight junctions due to a decrease in TEER.
In correspondence with the TEER results, each component as well as the different ratios of
combination 5 showed increased FITC-dextran transport across Caco-2 cell monolayers.
The combination of A. ferox with TMC gel produced a synergistic effect at all the ratios.

113
5.4.6 Combination 6: Aloe marlothii and TMC
Transepithelial electrical resistance (TEER) reduction at concentration 0.1% w/v
Figure 5.39 illustrates the effect of combination 6 (i.e. A. marlothii and TMC) at concentration
0.1% w/v on the transepithelial electrical resistance (TEER) of Caco-2 cell monolayers over
a period of 120 min. The positive control group (TMC 0.1% w/v) is represented by ratio 0:10
where TMC 0.1% w/v is the only component (indicated as positive control in Figures 5.39
and 5.40).
Figure 5.39: Reduction in the transepithelial electrical resistance (TEER) of Caco-2 cell
monolayers by concentration 0.1% w/v of different ratios of Aloe marlothii gel and TMC
plotted as a function of time (n = 3, mean ± SD)
From Figure 5.39 it is clear that all ratios (i.e. 10:0, 8:2, 5:5, 2:8 and 0:10) of combination 6
opened the tight junctions as indicated by a reduction TEER values. Relatively low TEER
reduction effects were obtained with combination 6 at all ratios. Ratio 0:10 (TMC 0.1% w/v
or positive control) resulted in the highest TEER reduction effect. The TEER of the negative
control group remained constant over the entire period of the whole experiment, indicating
the monolayers stayed intact for this period of time.
Figure 5.40 illustrates the percentage TEER reduction by 0.1% w/v of combination 6 at 60
and 120 min.
0
20
40
60
80
100
120
140
160
180
0 20 40 60 80 100 120
Perc
enta
ge T
EER
(%)
Time (min)
0.1% w/v AM_TMC 10:0 0.1% w/v AM_TMC 8:20.1% w/v AM_TMC 5:5 0.1% w/v AM_TMC 2:8Positive Control (TMC 0.1% w/v) Negative Control (Caco-2 cells)

114
Figure 5.40: Percentage TEER reduction of Caco-2 cell monolayers at time points 60 and
120 min for all the ratios within combination 6 (Aloe marlothii and TMC) at concentration
0.1 % w/v, as well as control groups. Bars on the graph marked with * indicate statistically
significant differences with the negative control group (p ≤ 0.05) (n = 3, mean ± SD)
Combination 6 ratios 8:2, 5:5, 2:8 and TMC 0.5% w/v alone (0:10) at both 60 and 120 min
had a statistically significant effect (p ≤ 0.05) on the TEER when compared to the negative
control group (Figure 5.40). A. marlothii alone (10:0) did not show a significant difference
from the negative control group. The results in this study from combination 6 indicate that A.
marlothii is capable of increasing the effect of TMC at most of the combination ratios, whilst
alone it exhibited a relatively low TEER reduction effect.
0
10
20
30
40
50
60
70
80
90
100
PositiveControl
NegativeControl
10:0 8:2 5:5 2:8
Perc
enta
ge T
EER
redu
ctio
n (%
)
Ratios
0.1% w/v at 60 min 0.1% w/v at 120 min
0.1%
w/v
(60m
in)
0.1%
w/v
(120
min
)
(Caco-2 cells)
**
* *
*
*
0.1% w/v at 60 min
(TMC)
* *

115
Transepithelial electrical resistance (TEER) reduction at concentration 0.5% w/v
Figure 5.41 illustrates the effect of combination 6 (i.e. A. marlothii and TMC) at concentration
0.5% w/v on the transepithelial electrical resistance (TEER) of Caco-2 cell monolayers over
a period of 120 min. The positive control group (TMC 0.5% w/v) is represented by ratio 0:10
where TMC 0.5% w/v is the only component (indicated as positive control in Figures 5.41
and 5.42).
Figure 5.41: Reduction in the transepithelial electrical resistance (TEER) of Caco-2 cell
monolayers by concentration 0.5% w/v of different ratios of Aloe marlothii gel and TMC
plotted as a function of time (n = 3, mean ± SD)
Although a relatively high reduction in TEER can be seen in Figure 5.41 for ratios 5:5 and
2:8 of combination 6, TMC 0.5% w/v alone (0:10) exerted the highest TEER reduction effect
over the entire time period of 120 min. Ratio 8:2 decreased the TEER prominently for the
first 40 min, but this effect was not maintained for the duration of the experiment. A gradual
TEER reduction effect is exhibited by A. marlothii alone (10:0) over the 120 min period. The
TEER of the negative control group remained constant over the entire period of the whole
experiment, indicating the monolayers stayed intact for this period of time.
The percentage TEER reduction by 0.5% w/v of combination 6 at 60 and 120 min is shown
in Figure 5.42.
0
20
40
60
80
100
120
140
160
180
0 20 40 60 80 100 120
Perc
enta
ge T
EER
(%)
Time (min)
0.5% w/v AM_TMC 10:0 0.5% w/v AM_TMC 8:20.5% w/v AM_TMC 5:5 0.5% w/v AM_TMC 2:8Positive Control (TMC 0.5% w/v) Negative Control (Caco-2 cells)

116
Figure 5.42: Percentage TEER reduction of Caco-2 cell monolayers at time points 60 and
120 min for all the ratios within combination 6 (Aloe marlothii and TMC) at concentration
0.5% w/v as well as control groups. Bars on the graph marked with * indicate statistically
significant differences with the negative control group (p ≤ 0.05) (n = 3, mean ± SD)
Combination 6, at concentration 0.5% w/v, resulted in a relatively high TEER reduction effect
at all ratios. In fact, all ratios (10:0, 5:5, 2:8 and 0:10) of combination 6 had a statistically
significant higher ability to open the tight junctions when compared to the negative control
group. At ratio 8:2 of combination 6, a statistically significant reduction effect was obtained
at 60 min, but this effect was not sustained over time and no significant effect was obtained
at time 120 min. Comparing all ratios (10:0, 8:2, 5:5 and 2:8) to TMC 0.5% w/v alone (0:10
or positive control), none of the above-mentioned ratios had the ability to open the tight
junction more than TMC 0.5% w/v alone.
By relating the percentage TEER reduction of concentration 0.1% w/v (Figure 5.40) and
0.5% w/v (Figure 5.42), it can be observed that the higher concentration reduced the TEER
to a larger extent than the lower concentration. An equal amount of each component in
combination 6 (i.e. ratio 5:5 of A. marlothii and TMC) resulted in a higher reduction effect
than the other ratios. Combining these two chemical drug absorption enhancing agents
resulted in an enhanced effect when compared to each component alone.
0
10
20
30
40
50
60
70
80
90
100
PositiveControl
NegativeControl
10:0 8:2 5:5 2:8
Perc
enta
ge T
EER
redu
ctio
n (%
)
Ratios
0.5% w/v at 60 min 0.5% w/v at 120 min
0.5%
w/v
(60
min
)
0.5%
w/v
(120
min
)
(Caco-2 cells)
*
*
*
*
* ***
(TMC)
0.5% w/v at 60 min
*

117
FITC-dextran transport
The apparent permeability coefficient (Papp) values of FITC-dextran in the presence of
combination 6 ratios were calculated from the cumulative transport (% of initial value as a
function of time) results and are presented graphically in Figure 5.43.
Figure 5.43: The effect of combination 6 (i.e. Aloe marlothii and TMC) on the transport
(Papp values) of FITC-dextran across Caco-2 cell monolayers. Bars on the graph marked
with * indicate statistically significant differences with the negative control group (p ≤ 0.05) (n
= 3, mean ± SD)
The Papp values of FITC dextran in the presence of the combination 6 ratios were statistically
processed to determine if significant differences exist between the experimental groups and
the control groups. The p-values obtained from Dunnett’s test (confidence level = 0.05) for
each combination ratio are given in Table 5.11.
0,00E+00
5,00E-08
1,00E-07
1,50E-07
2,00E-07
2,50E-07
3,00E-07
3,50E-07
4,00E-07
4,50E-07
5,00E-07
PositiveControl
NegativeControl
0.1% w/vAM_TMC
P app
valu
es
Ratios
Positive Control Negative Control 0.1% w/v AM_TMC
10:0 8:2 5:5 2:8
(FITC-dextran and TMC) (FITC-dextran)Positive control Negative control
*
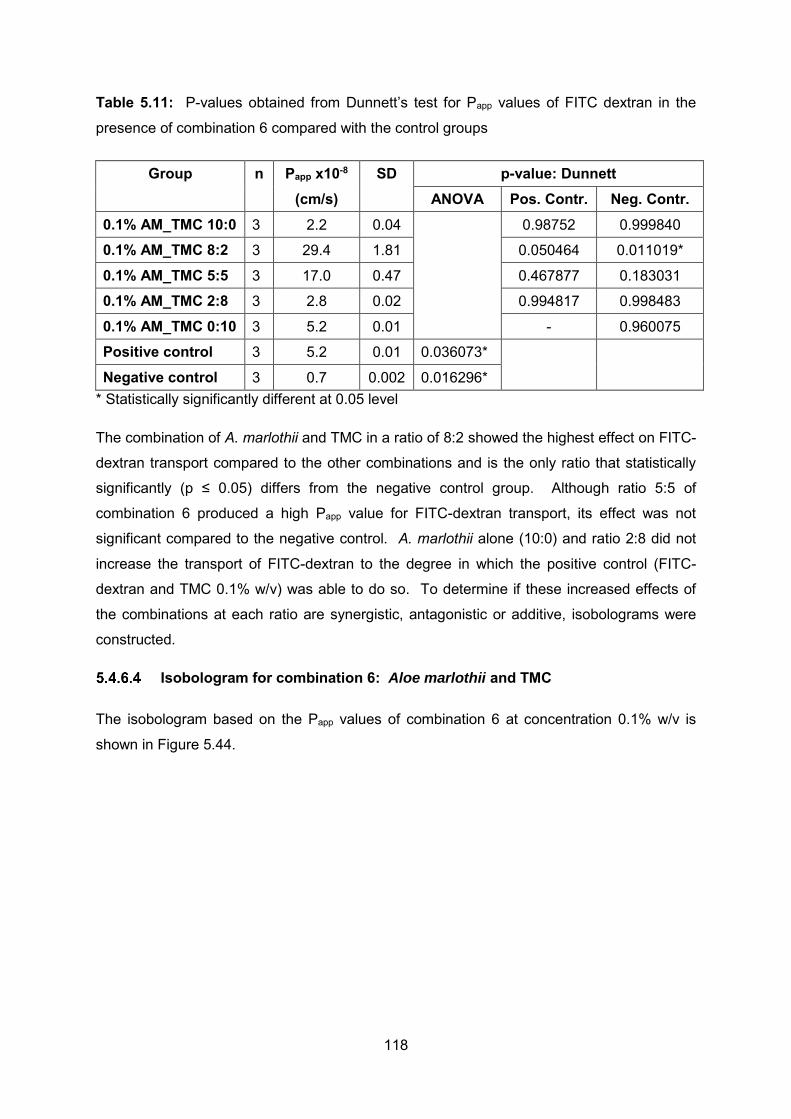
118
Table 5.11: P-values obtained from Dunnett’s test for Papp values of FITC dextran in the
presence of combination 6 compared with the control groups
Group n Papp x10-8 SD p-value: Dunnett
(cm/s)
ANOVA Pos. Contr. Neg. Contr.
0.1% AM_TMC 10:0 3 2.2 0.04 0.98752 0.999840
0.1% AM_TMC 8:2 3 29.4 1.81 0.050464 0.011019*
0.1% AM_TMC 5:5 3 17.0 0.47 0.467877 0.183031
0.1% AM_TMC 2:8 3 2.8 0.02 0.994817 0.998483
0.1% AM_TMC 0:10 3 5.2 0.01 - 0.960075
Positive control 3 5.2 0.01 0.036073*
Negative control 3 0.7 0.002 0.016296* * Statistically significantly different at 0.05 level
The combination of A. marlothii and TMC in a ratio of 8:2 showed the highest effect on FITC-
dextran transport compared to the other combinations and is the only ratio that statistically
significantly (p ≤ 0.05) differs from the negative control group. Although ratio 5:5 of
combination 6 produced a high Papp value for FITC-dextran transport, its effect was not
significant compared to the negative control. A. marlothii alone (10:0) and ratio 2:8 did not
increase the transport of FITC-dextran to the degree in which the positive control (FITC-
dextran and TMC 0.1% w/v) was able to do so. To determine if these increased effects of
the combinations at each ratio are synergistic, antagonistic or additive, isobolograms were
constructed.
Isobologram for combination 6: Aloe marlothii and TMC
The isobologram based on the Papp values of combination 6 at concentration 0.1% w/v is
shown in Figure 5.44.

119
Figure 5.44: Isobologram of the apparent permeability coefficient (Papp) values of FITC-
dextran in the presence of combination 6 (Aloe marlothii and TMC) ratios
For combination 6 (i.e. A. marlothii and TMC), synergism was observed at ratios 8:2 and 5:5,
while antagonism was observed at ratio 2:8, where TMC was present at a higher
concentration in the combination. From the results of the isothermal microcalorimetry, it was
evident that interactions occurred between A. marlothii and TMC in all the compound ratios,
which indicated both the synergistic and antagonistic effects are possibly due to physical and
chemical interactions occurring between A. marlothii and TMC.
Conclusion The TEER results obtained for combination 6 (A. marlothii and TMC) showed the ability of
each component and the combinations to open tight junctions due to a decrease in TEER.
In correspondence with the TEER results of concentration 0.1% w/v, each component as
well as the different ratios of combination 6 showed increased FITC-dextran transport across
Caco-2 cell monolayers. The combination of A. marlothii gel with TMC produced a
synergistic effect at ratios 8:2 and 5:5 and an antagonistic effect at ratio 2:8.

120
CHAPTER 6 SUMMARY OF RESULTS, FINAL CONCLUSIONS
AND FUTURE RECOMMENDATIONS
6.1 SUMMARY OF THE RESULTS OF THE TRANSEPITHELIAL ELECTRICAL RESISTANCE (TEER) STUDIES
Figure 6.1 illustrates the percentage TEER reduction values after 120 min exposure to the
different absorption enhancer combinations at concentrations of 0.1% w/v and 0.5% w/v,
respectively.
0
10
20
30
40
50
60
70
80
90
100
AV/AM AV/AF AM/AF AV/TMC AF/TMC AM/TMC
% T
EER
Red
uctio
n
10:0 8:2
5:5
2:8
0:10
AV / AMCombination 1
*
*
AV / AFCombination 2
AM / AFCombination 3
AV / TMCCombination 4
AF / TMCCombination 5
AM / TMCCombination 6
5:5
2:8
0:10
*
*
* **
* *
*
*
*
*
*
*
*
*
*
*
*
*
2:8
0:10
10:0 8:2
5:5
2:8
0:10
10:0 8:2
5:5
2:8
0:10
10:0 8:2
5:5
2:8
0:10
10:0 8:2
a

121
Figure 6.1: Percentage TEER reduction of Caco-2 cell monolayers at 120 min for all
combinations at a) concentration 0.1% w/v and b) concentration 0.5% w/v. Bars on the
graph marked with * indicate statistically significant differences with the negative control
group (p ≤ 0.05) (n = 3, mean ± SD)
It is clear from Figure 6.1, that some of the single absorption enhancers as well as some of
the combinations between the different aloe species gel materials had a statistically
significant (p ≤ 0.05) reduction effect on the TEER of the Caco-2 cell monolayers when
compared to the negative control group. Some of the aloe material combinations with TMC
showed a higher TEER reduction effect compared to that of TMC alone (TMC alone also
served as the positive control in this study). In general, the TEER reduction effect of all
combination ratios at concentration 0.5% w/v was higher than that at 0.1% w/v.
Some of the combinations between different aloe species showed enhanced TEER
reduction effects when compared to those of the single components, especially the
combinations between A. vera and A. marlothii at 0.1% w/v, as well as between A. vera and
A. ferox at 0.5% w/v. Almost all ratios at the combinations which consisted of TMC as one
component and aloe gel as the other component (i.e. combination 4, 5 and 6) had a
statistically significantly higher effect (p ≤ 0.05) on the TEER, compared to that of the
negative control group. Furthermore, many of the combinations between aloe gel material
and TMC resulted in increased TEER reduction effects compared to those of the single
components.
0
10
20
30
40
50
60
70
80
90
100
1 2 3 4 5 6
% T
EER
redu
ctio
n
5:5
2:8
0:10
10:0
10:0
10:0
10:0
10:08:2
8:2
8:2
8:2
8:2
5:5
5:5
5:5
5:5
5:5
2:8
2:8
2:8
2:8
2:8
0:10
0:10
0:10
0:10
0:10
*
* *
*
*
*
*
*
*
*
*
AV / AMCombination 1
AV / AFCombination 2
AM / AFCombination 3
AV / TMCCombination 4
AF / TMCCombination 5
AM / TMCCombination 6
b
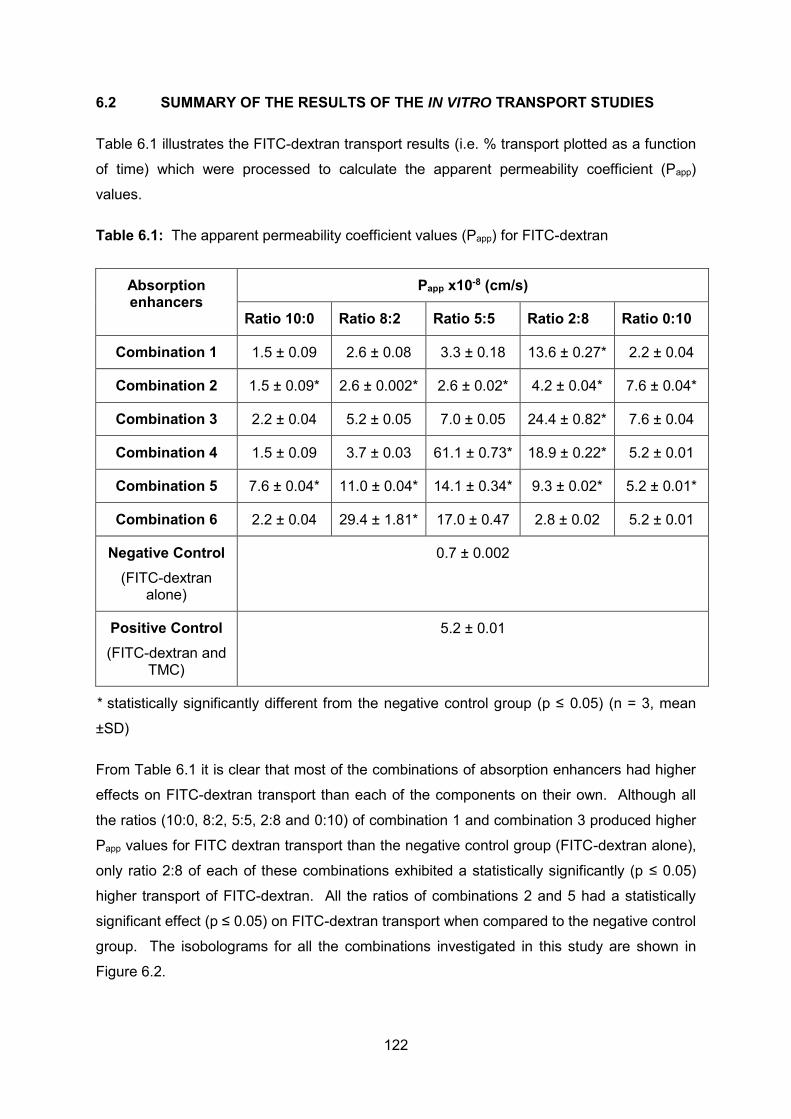
122
6.2 SUMMARY OF THE RESULTS OF THE IN VITRO TRANSPORT STUDIES
Table 6.1 illustrates the FITC-dextran transport results (i.e. % transport plotted as a function
of time) which were processed to calculate the apparent permeability coefficient (Papp)
values.
Table 6.1: The apparent permeability coefficient values (Papp) for FITC-dextran
Absorption enhancers
Papp x10-8 (cm/s)
Ratio 10:0 Ratio 8:2 Ratio 5:5 Ratio 2:8 Ratio 0:10
Combination 1 1.5 ± 0.09 2.6 ± 0.08 3.3 ± 0.18 13.6 ± 0.27* 2.2 ± 0.04
Combination 2 1.5 ± 0.09* 2.6 ± 0.002* 2.6 ± 0.02* 4.2 ± 0.04* 7.6 ± 0.04*
Combination 3 2.2 ± 0.04 5.2 ± 0.05 7.0 ± 0.05 24.4 ± 0.82* 7.6 ± 0.04
Combination 4 1.5 ± 0.09 3.7 ± 0.03 61.1 ± 0.73* 18.9 ± 0.22* 5.2 ± 0.01
Combination 5 7.6 ± 0.04* 11.0 ± 0.04* 14.1 ± 0.34* 9.3 ± 0.02* 5.2 ± 0.01*
Combination 6 2.2 ± 0.04 29.4 ± 1.81* 17.0 ± 0.47 2.8 ± 0.02 5.2 ± 0.01
Negative Control (FITC-dextran
alone)
0.7 ± 0.002
Positive Control (FITC-dextran and
TMC)
5.2 ± 0.01
* statistically significantly different from the negative control group (p ≤ 0.05) (n = 3, mean
±SD)
From Table 6.1 it is clear that most of the combinations of absorption enhancers had higher
effects on FITC-dextran transport than each of the components on their own. Although all
the ratios (10:0, 8:2, 5:5, 2:8 and 0:10) of combination 1 and combination 3 produced higher
Papp values for FITC dextran transport than the negative control group (FITC-dextran alone),
only ratio 2:8 of each of these combinations exhibited a statistically significantly (p ≤ 0.05)
higher transport of FITC-dextran. All the ratios of combinations 2 and 5 had a statistically
significant effect (p ≤ 0.05) on FITC-dextran transport when compared to the negative control
group. The isobolograms for all the combinations investigated in this study are shown in
Figure 6.2.

123
Figure 6.2: Isobolograms of the apparent permeability coefficient (Papp) values of FITC-
dextran in the presence of different ratios of a) combination 1, b) combination 2, c)
combination 3, d) combination 4, e) combination 5 and f) combination 6
a b
c d
e f

124
It is clear from Figure 6.2(a) that synergism in terms of FITC-dextran transport enhancement
across Caco-2 cell monolayers was obtained at all ratios of combination 1 (i.e. A. vera gel
combined with A. marlothii gel). This is in line with the TEER reduction results obtained for
combination 1 at a concentration of 0.1% w/v, which indicated improved TEER reduction
effects at most of the ratios as compared to that of the single components. Microcalorimetric
data did not indicate any interactions occurring between the A. vera and A. marlothii gels,
therefore it can be deduced that the two compounds contribute individually to the synergistic
effect observed with the enhanced transport of FITC-dextran across the Caco-2 cell
monolayers. Conversely, combination 2 (i.e. A. vera gel combined with A. ferox gel as
shown in Figure 6.2(b)) resulted in an additive effect (or zero interaction) at ratio 8:2, whilst
the other two ratios (i.e. 5:5 and 2:8) resulted in antagonism. This is in line with the TEER
reduction results obtained for combination 2 at a concentration of 0.1% w/v. A possible
explanation for this negative interaction between A. vera gel and A. ferox gel in terms of
FITC-dextran transport may be a physical or chemical interaction between the
phytochemicals of these two gel materials. The isothermal heat-conduction calorimetry
results indicated that interactions did occur at ratios 8:2, 5:5 and 2:8 of combination 2.
Combining A. marlothii gel with A. ferox gel (combination 3), as well as A. ferox and TMC
(combination 5) resulted in synergistic effects on FITC-dextran transport, as evident from
Figures 6.2(c) and 6.2(e). The microcalorimetric data obtained with combination 3 and 5
showed an interaction occurred between A. marlothii and A. ferox gel, as well as between A.
ferox and TMC, therefore confirming the data obtained through comparison of the Papp
values of the two combinations. It can be concluded that the interaction which occurred
between A. marlothii and A. ferox gel or A. ferox and TMC lead to the synergistic
enhancement of FITC-dextran transport across the Caco-2 cell monolayer.
A combination of A. vera with TMC (combination 4 as shown in Figure 6.2(d)), resulted in
synergism at ratios 5:5 and 2:8 in terms of FITC-dextran transport enhancement, whilst an
additive effect was obtained at ratio 8:2. The isothermal microcalorimetry results indicated
no interaction between A. vera and TMC in ratios 5:5 and 2:8, therefore showing that the
synergistic effect on the FITC-dextran transport is not effected through an interaction but
rather the combined effect of each separate compound results in enhanced FITC-dextran
transport. However, microcalorimetric evaluation of the 8:2 ratio of combination 4 showed
an interaction between A. vera and TMC. This interaction influenced the FITC-dextran
transport detrimentally.
For combination 6 (i.e. TMC and A. marlothii), synergism was observed at ratios 8:2 and 5:5,
whilst antagonism was observed at ratio 2:8, where TMC was in the majority. From the

125
results of the isothermal microcalorimetry, it was evident that interactions occurred between
A. marlothii and TMC in all the compound ratios, indicating that both the synergistic and
antagonistic effects are due to interactions occurring between the two.
6.3 FINAL CONCLUSION
The results from this study indicated that combinations of certain drug absorption enhancers
can produce synergetic effects in terms of tight junction modulation of epithelial cell
monolayers, whilst others cause additive or antagonistic effects. Furthermore, the type of
effect is dependent on the concentration and ratio of the binary mixture. Contradictory
effects between ratios of the same combination could possibly be explained by physical or
chemical interactions between the components of the materials at that specific ratio
combination as indicated by isothermal microcalorimetry.
6.4 RECOMMENDATIONS FOR FUTURE STUDIES
From the results obtained with this in vitro study, it can be concluded that by combining
different aloe leaf materials (i.e. A. vera, A. ferox and A. marlothii) with each other as well as
with TMC, a higher transport effect of the macromolecule FITC-dextran was obtained, as
with the individual components alone. The extent of transport enhancement effect of each
combination ratio differed and there is no assurance of the clinical significance of any of
these effects. With the intention to clarify the clinical significance of these combinations of
absorption enhancers and before any clinical conclusions can be drawn, in vivo studies in
appropriate animal models are suggested. In order to identify the pure phytoconstituents in
the individual aloe materials responsible for the synergistic enhancement when in
combination, the use of more refined materials are recommended. With more refined
materials, interaction studies can be performed, not only to indicate synergistic interactions
but also the mechanisms of action responsible for such interactions. A further
recommendation includes the performance of cytotoxic and metabolism studies of the aloe
materials and TMC in combination, at the ratios where synergistic drug absorption
enhancement was obtained. Supplementary to the above-mentioned recommendations, is
the authentication of the results of this study by comparing them with additional in vitro
transport models to see how the results correlate. As all materials used in this study were in
powder form, a suggestion to formulate these combinations into beads or nanoparticles to
test the absorption enhancing effects could also be considered.

126
REFERENCES __________________________________________________________________________________
Alam, S., Ali, I., Giri, K.Y., Gokkulakrishnan, S., Natu, S.S., Faisal, M. & Sharma,
H. 2013. Efficacy of Aloe vera gel as an adjuvant treatment of oral submucous
fibrosis. Oral Surgery, Oral Medicine, Oral Pathology and Oral Radiology, 116(6):717-724.
Alcare Aloe Skin. 2008. The allure of aloe. http://www.aloe.co.za/ Date of access: 2 Aug.
2014.
Aloe Vera.com. 2014. The ultimate guide to the Aloe vera plant. http://aloevera.com/the-
ultimate-guide-to-the-aloe-vera-plant/ Date of access: 23 Aug. 2014.
American Type Cultured Collection. 2004. Product Information Sheet for HTB-37.
www.atcc.org/~/ps/30-2004.ashx Date of access: 2 Jul. 2014.
American Type Cultured Collection. 2010. Passage Number effects in cell lines.
www.atcc.org/~/media/PDFs/Technical%20Bulletins/tb07.ashxCached Date of access: 28
Jun. 2014.
Amoo, S.O., Aremu, A.O. & Van Staden, J. 2014. Unraveling the medicinal potential of
South African Aloe species. Journal of Ethnopharmacology, 153:19–41.
Antosova, Z., Mackova, M., Kral, V. & Macek, T. 2009. Therapeutic application of peptides
and proteins: parenteral forever? Trends in Biotechnology, 27(11):628-635.
Antunes, F., Andrade, F., Ferreira, D., Morck-Nielsen, H. & Sarmento, B. 2013. Models to
predict intestinal absorption of therapeutic peptides and proteins. Current Drug
Metabolism, 14(1):4-20.
APVMA see Australian Pesticides & Veterinary Medicines Authority.
Artursson, P. 1990. Cell cultures as models for drug absorption across the intestinal
mucosa. Critical Reviews in Therapeutic Drug Carrier Systems, 8(4):305-330.
Artursson, P. & Karlsson, J. 1991. Correlation between oral drug absorption in humans and
apparent drug permeability coefficients in human intestinal epithelial (Caco-2)
cells. Biochemical and Biophysical Research Communications, 175(3):880-885.

127
Artursson, P., Palm, K. & Luthman, K. 2001. Caco-2 monolayers in experimental and
theoretical predictions of drug transport. Advanced Drug Delivery Reviews, 46(1):27-43.
Artursson, P., Palm, K. & Luthman, K. 2012. Caco-2 monolayers in experimental and
theoretical predictions of drug transport. Advanced Drug Delivery Reviews, 64:280-289.
Ashford, M. 2007a. Introduction to biopharmaceutics. (In: Aulton, M.E., ed. Aulton's pharmaceutics. The design and manufacture of medicines, 3rd ed. New York: Churchill Livingstone. p. 266-269).
Ashford, M. 2007b. The gastrointestinal physiology and drug absorption. (In: Aulton, M.E.,
ed. Aulton's pharmaceutics. The design and manufacture of medicines, 3rd ed. New York:
Churchill Livingstone. p. 270-285).
ATCC see American Type Cultured Collection.
Authority Australian Pesticides and Veterinary Medicines. 2004. Guidelines for the
validation of analytical methods for active constituent, agricultural and veterinary chemical
products. http://www.apvma.gov.au/publications/guidelines/docs/gl_69_analytical_methods.
pdf Date of access: 28 Jun. 2014.
Balimane, P.V. & Chong, S. 2005. Cell culture-based models for intestinal permeability:
a critique. Drug Discovery Today, 10(5):335-343.
Balimane, P.V., Chong, S. & Morrison, R.A. 2000. Current methodologies used for
evaluation of intestinal permeability and absorption. Journal of Pharmacological and
Toxicological Methods, 44(1):301-312.
Beneke, C., Viljoen, A. & Hamman, J. 2012. In vitro absorption enhancement effects of
Aloe vera and Aloe ferox. Scientia Pharmaceutica, 80(2):475-486.
Berenbaum, M.C. 1978. A method for testing for synergy with any number of
agents. Journal of Infectious Diseases, 137(2):122–130.
Berenbaum, M.C. 1989. What is synergy? Pharmacological Reviews, 41(3):93-129.
Bernkop-Schnurch, A. 1998. The use of inhibitory agents to overcome the enzymatic
barrier to perorally administered therapeutic peptides and proteins. Journal of Controlled
Release, 52(1):1-16.
Breitinger, H.G. 2012. Drug synergy–mechanisms and methods of analysis.
http://www.intechopen.com/books/toxicity-and-drug-test Date of access: 2 Jul. 2014.
128
Briske-Anderson, M.J., Finley, J.W. & Newman, S.M. 1997. The influence of culture time
and passage number on the morphological and physiological development of Caco-2
cells. Proceedings of the Society for Experimental Biology and Medicine, 214(3):248-257.
Burton, P.S., Conradi, R.A., Hilgers, A.R. & Ho, N.F.H. 1993. Evidence for a polarized
efflux system for peptides in the apical membrane of Caco-2 cells. Biochemical and
biophysical research communications, 190(3):760-766.
Campestrini, L.H., Silveira, J.L.M., Duarte, M.E.R., Koop, H.S. & Noseda, M.D. 2013. NMR
and rheological study of Aloe barbadensis partially acetylated glucomannan. Carbohydrate
Polymers, 94(1):511– 519.
Cantor, C.R. 1994. Protein purification: principles and practice. (In: Scopes, R.K.,
ed. Separation by precipitation, New York: Springer Science. p. 95-100).
Chen, W., Lu, Z., Viljoen, A. & Hamman, J. 2009. Intestinal drug transport enhancement by
Aloe vera. Planta Medica, 76(12):587–595.
Chickering, D.E. & Mathiowitz, E. 1999. Definitions, mechanisms and theories of
bioadhesion. (In: Mathiowitz, E., Chickering, D.E. & Lehr, C.-M., eds. Bioadhesive drug
delivery systems fundamentals, novel approaches and development, New York: Marcel
Dekker Inc. p. 1-10).
Choonara, B.F., Choonara, Y.E., Kumar, P., Bijukumar, D., Du Toit, L.C. & Pillay,
V. 2014. A review of advanced oral drug delivery technologies facilitating the protection and
absorption of protein and peptide molecules. Biotechnology Advances, 32(7):1269-1282.
Chou, T.C. 1976. Derivation and properties of Michaelis-Menten type and Hill type
equations for reference ligands. Journal of Theoretical Biology, 59(2):253-276.
Chou, T.C. 2002. Synergy determination issues. Journal of Virology, 76(20):10577-10578.
Chou, T.C. 2006. Theoretical basis, experimental design, and computerized simulation of
synergism and antagonism in drug combination studies. Pharmacological
Reviews, 58(3):621-681.
Chou, T.C. 2010. Drug combination studies and their synergy quantification using the
Chou-Talalay method. Cancer Research, 70(2):440-446.
Cousins, S. R. & Witkowski, E. T. F. 2012. African aloe ecology: a review. Journal of Arid
Environments, 85:1-17.

129
Crommelin, D., Van Winden, E. & Mekking, A. 2002. Delivery of pharmaceutical
proteins. (In: Aulton, M.E., ed. Aulton's pharmaceutics: the design and manufacture of
medicines, 3rd ed. New York: Churchill Livingstone. p. 616-625).
Daugherty, A.L. & Mrsny, R.J. 1999. Transcellular uptake mechanisms of the intestinal
epithelial barrier: part one. Pharmaceutical Science and Technology Today, 2(4):144-151.
Deferme, S., Annaert, P. & Augustijns, P. 2008. Drug absorption studies. (In: Ehrhardt, C.
& Kim, K.-W., eds. In vitro screening models to assess intestinal drug absorption and
metabolism, New York: Springer. p. 182-215).
Degim, Z., Unal, N., Essiz, D. & Abbasoglu, U. 2004. The effect of various liposome
formulations on insulin penetration across Caco-2 cell monolayer. Life Sciences,
75(23):2819-2827.
Di Paquale, G & Chiorini, J.A. 2006. AVV transcytosis through barrier epithelia and
endothelium. Molecular Therapy, 13(3):506-515.
Djeraba, A. & Quere, P. 2000. In vivo macrophage activation in chickens with Acemannan,
a complex carbohydrate extracted from Aloe vera. International Journal of
Immunopharmacology, 22(5):365-372.
Dobson, P.D. & Kell, D.B. 2008. Carrier-mediated cellular uptake of pharmaceutical drugs:
an exception or the rule? Nature Reviews Drug Discovery, 7(3):205-220.
Du Preez, J.L. 2010. Method validation-protocol. Potchefstroom. NWU. Analytical
Technology Laboratory (ATL). (SOP) 17-002A.
Easson, J.H., Haltner, E. & Lehr, C.-M. 1999. Bacterial invasion factors and lectins as
second-generation bioadhesives. (In: Mathiowitz, E., Chickering, D.E. & Lehr, C.-M.,
eds. Bioadhesive drug delivery systems fundamentals, novel approaches and
development, New York: Marcel Dekker Inc. p. 409-431).
Eder, M. & Mehnert, W. 2000. Solubility and dissolution rate of digoxin from Digitalis lanata
drug extracts. Die Pharmazie, 55(12):928-933.
Enslin, G.M., Hamman, J.H. & Kotzé, A.F. 2008. Intestinal drug absorption enhancers:
synergistic effects of combinations. Drug Development and Industrial Pharmacy,
34(12):1343-1349.

130
Fearn, R.A. & Hirst, B.H. 2006. Predicting oral drug absorption and hepatobiliary clearance:
human intestinal and hepatic in vitro cell models. Environmental Toxicology and
Pharmacology, 21(2):168-178.
Fei, Y.J., Kanai, Y., Nussberger, S., Ganapathy, V., Leibach, F.H. & Romero, M.F. 1994.
Expression cloning of a mammalian proton-coupled oligopeptide transporter. Nature,
368(6471):563-565.
Femenia, A., García-Pascual, P., Simal, S. & Rosselló, C. 2003. Effects of heat treatment
and dehydration on bioactive polysaccharide acemannan and cell wall polymers from Aloe
barbadensis Miller. Carbohydrate Polymers, 51(4):397-405.
Fox, L.T., Du Plessis, J., Gerber, M., Boneschans, B. & Hamman, J.H. 2014. In vivo skin
hydration and anti-erythema effects of Aloe vera, Aloe ferox and Aloe marlothii gel materials
after single and multiple applications. Pharmacognosy Magazine, 10(38):392.
Gan, L.S.L. & Thakker, D.R. 1997. Applications of the Caco-2 model in the design and
development of orally active drugs: elucidation of biochemical and physical barriers posed by
the intestinal epithelium. Advanced Drug Delivery Reviews, 23(1):77-79.
Gouws, C. 2013a. Reviving frozen cell stocks. Centre of Excellence for Pharmaceutical
Sciences: Mammalian Cell Cultures. SOP No: CEPS_CTC_SOP007_v01_Reviving cell
stocks.
Gouws, C. 2013b. Seeding Caco-2 cells on Transwell® plates. Centre of Excellence for
Pharmaceutical Sciences: Mammalian Cell Cultures. SOP No:
CEPS_CTC_SOP004_v01_Seeding Caco-2 cells on Transwell.
Gouws, C. 2013c. Standard culturing of Caco-2 cells. Centre of Excellence for
Pharmaceutical Sciences: Mammalian Cell Cultures. SOP No:
CEPS_CTC_SOP003_v01_Culturing Caco-2 cells.
Gouws, C. 2013d. TEER study. Centre of Excellence for Pharmaceutical Sciences:
Mammalian Cell Cultures. SOP No: CEPS_CTC_SOP001_v02_TEER study.
Grace, O.M., Simmonds, M.S.J., Smith, G.F. & Van Wyk, A.E. 2008. Therapeutic uses of
Aloe L. (Asphodelaceae) in Southern Africa. Journal of Ethnopharmacology, 119(3):604–
614.

131
Grassl, S. M. 2012. Mechanisms of carrier-mediated transport: facilitated diffusion,
cotransport, countertransport. (In: Sperelakis, N., ed. Cell physiology: source book, 4th
ed. San Diego: CA Academic. p. 153-165).
Greco, W.R., Bravo, G. & Parsons, J.C. 1995. The search for synergy: a critical review from
a response surface perspective. Pharmacological Reviews, 47(2):331-385.
Hamman, J.H. 2007. Drug absorption enhancement. (In: Oral drug delivery,
biopharmaceutical principles, evaluation and optimization. Pretoria: Content Solutions. p.
184-208).
Hamman, J.H. 2008. Composition and applications of Aloe vera leaf gel. Molecules,
13(8):1599-1616.
Hamman, J.H., Enslin, G.M. & Kotzé, A.F. 2005. Oral delivery of peptide drugs. Biodrugs,
19(3):165-177.
Hamman, J.H., Schultz, C.M. & Kotzé, A.F. 2003. N-trimethyl chitosan chloride: optimum
degree of quaternisation for drug absorption enhancement across epithelial cells. Drug
Development and Industrial Pharmacy, 29(2):161-172.
Hejazi, R. & Amiji, M. 2003. Chitosan-based gastrointestinal delivery systems. Journal of
Controlled Release, 89(2):151-165.
Hildalgo, I.J. 2001. Assessing the absorption of new pharmaceuticals. Current Topics in
Medicinal Chemistry, 1(5):388.
Holmstock, N., Annaert, P. & Augustijns, P. 2012. Boosting of HIV protease inhibitors by
ritonavir in the intestine: the relative role of Cyp and P-gp inhibition based on Caco-2
monolayers versus in situ intestinal perfusion in mice. Drug metabolism and
disposition, 40(8):1473-1477.
Howard, G.J. & Webster, T.F. 2009. Generalized concentration addition: a method for
examining mixtures containing partial agonists. Journal of Theoretical Biology, 259(3):469-
477.
Hu, M., Li, Y., Davitt, C.M., Huang, S.M., Thummel, K., Penman, B.W. & Crespi, C.L. 1999.
Transport and metabolic characterization of Caco-2 cells expressing CYP3A4 and CYP3A4
plus oxidoreductase. Pharmaceutical Research, 16(9):1352-1359.

132
Hunter, J., Hirst, B.H. & Simmons, N.L. 1993. Drug absorption limited by P-glycoprotein-
mediated secretory drug transport in human intestinal epithelial Caco-2 cell
layers. Pharmaceutical Research, 10(5):743-749.
ICH see International Conference On Harmonisation.
Imming, P., Sinning, C. & Meyer, A. 2006. Drugs, their targets and the nature and number
of drug targets. Nature Reviews Drug Discovery, 5(10):821-834.
International conference on harmonisation of technical requirements for registration of
pharmaceuticals for human use. 2005. Validation of analytical procedures: test and
methodology Q2(R1). http://www.ich.org/fileadmin/Public_Web_Site/ICH_Products/
Guidelines/Quality/Q2_R1/Step4/Q2_R1__Guideline.pdf Date of access: 25 Jun. 2014.
ISpot. 2009. Aloe marlothii. http://www.ispot.org.za/node/224879 Date of access: 2 Aug.
2014.
Jonker, C., Hamman, J.H. & Kotzé, A.F. 2002. Intestinal paracellular permeation
enhancement with quaternised chitosan: in situ and in vitro evaluation. International Journal
of Pharmaceutics, 238(1):205-213.
Junginger, H.E. 1991. Mucoadhesive hydrogels. Indian Journal of Pharmaceutical
Sciences, 53(11):1056-1065.
Kararli, T.T. 1995. Comparison of the gastrointestinal anatomy, physiology, and
biochemistry of humans and commonly used laboratory animals. Biopharmaceutics and
Drug Disposition, 16(5):351-380.
Kerns, E.H. & Di, L. 2008. Permeability. (In: Drug-like properties: concepts, structure
design and methods from ADME to toxicity optimization, 2nd ed. Amsterdam: Academic
Press. p. 86-99).
Kew Royal Botanic Gardens. 2013. http://www.kew.org/science-conservation/plants-fungi/
aloe-marlothii-mountain-aloe Date of access: 31 July 2014.
Kosińska, A. & Andlauer, W. 2013. Modulation of tight junction integrity by food
components. Food Research International, 54(1):951-960.
Kotzé, A.F., Lueßen, H.L., De Leeuw, B.J., De Boer, A.G., Verhoef, J.C. & Junginger, H.E.
1999. Effect of the degree of quaternization of N-trimethyl chitosan chloride on the

133
permeability of intestinal epithelial cells (Caco-2). European Journal of Pharmaceutics and
Biopharmaceutics, 47(3):269-274.
Kumbula Indigenous Nursery. 2014. http://kumbulanursery.co.za/plants/aloe-ferox Date of
access: 23 July 2014.
Lapierre, L.A. 2000. The molecular structure of the tight junction. Advanced Drug Delivery
Reviews, 41(3):255-264.
Le Ferrec, E., Chesne, C., Artusson, P., Brayden, D., Fabre, G., Gires, P., Guillou, F.,
Rousset, M., Rubas, W. & Scarino, M.L. 2001. In vitro models of the intestinal barrier.
Alternatives to Laboratory Animals, 29:649-668.
Lebitsa, T., Viljoen, A., Lu, Z. & Hamman, J.H. 2012. In vitro drug permeation enhancement
potential of aloe gel materials. Current Drug Delivery, 9(3):297-304.
Lee, H.J. 2002. Protein drug oral delivery: the recent progress. Archives of Pharmaceutical
Research, 25(5):572-584.
Lee, J.K., Lee, M.K., Yun, Y.-P., Kim, Y., Kim, J.S., Kim, Y.S., Kim, K., Han, S.S. & Lee, C.-
K. 2001. Acemannan purified from Aloe vera induces phenotypic and functional maturation
of immature dendritic cells. International Immunopharmacology, 1(7):1275–1284.
Lee, V.H., Traver, R.D. & Taub, M.E. 1991. Enzymatic barriers to peptide and protein drug
delivery. (In. Lee, V.H., ed. Peptide and protein drug delivery. New York: CRC Press.
p. 303-358).
Lee, N., Yuen, K.Y. & Kumana, C.R. 2003. Clinical role of β-lactam / β-lactamase inhibitor
combinations. Drugs, 63(14):1511-1524.
Legen, I., Salobir, M. & Kerč, J. 2005. Comparison of different intestinal epithelia as models
for absorption enhancement studies. International Journal of Pharmaceutics, 291(1):183-
188.
Lennernäs, H. 1998. Human intestinal permeability. Journal of Pharmaceutical Sciences,
87(4):403-410.
List, P.H., Schmid, W. & Weil, E. 1969. Reinsubstanz oder galennische Zubereitung.
Arzneim Forsch, 19(1):181-185.

134
Liu, Z., Wang, S. & Hu, M. 2009. Oral absorption basics: pathways, physico-chemical and
biological factors affecting. (In: Developing solid oral dosage forms: pharmaceutical theory
and practice. Massachusetts: Academic Press. p. 265-287).
Loots, D.T., Van Der Westhuizen, F.H. & Botes, L. 2007. Aloe ferox leaf gel phytochemical
content, antioxidant capacity and possible health benefits. Journal of Agricultural and Food
Chemistry, 55(17):6891-6896.
Lowman, A.M. & Peppas, N.A. 1997. Analysis of complexation / decomplexation
phenomena in graft copolymer networks. Macromolecules, 30(10):4959–4965.
Muheem, A., Shakeel, F., Jahangir, M.A., Anwar, M., Mallick, N., Jain, G.K., Warsi, M.H. &
Ahmad, F.J. 2014? A review on the strategies for oral delivery of proteins and peptides and
their clinical perspectives. Saudi Pharmaceutical Journal:In press.
Muranishi, S. 1990. Absorption enhancers. Critical reviews in therapeutic drug carrier
systems, 7(1):1-33.
Nandal, U & Bhardwaj, R.L. 2012. Aloe vera: a valuable wonder plant for food, medicine
and cosmetic use - a review. International Journal of Pharmaceutical Sciences Review and
Research, 13(1):69-76.
Ni, Y., Turner., D., Yates, K.M. & Tizard, I. 2004. Isolation and characterization of structural
components of Aloe vera L. leaf pulp. International Immunopharmacology, 4(14):1745-
1755.
Nolte, M.S., Karam, M.D. & Karam, J.H. 2003. Pancreatic hormones and antidiabetic
drugs. (In: Weitz, M. & Lebowitz, H., ed. Basic and clinical pharmacology, 9th ed. San
Francisco: McGraw-Hill. p. 693-714).
O'Brien, C., Van Wyk, B.-E. & Van Heerden, F.R. 2011. Physical and chemical
characteristics of Aloe ferox leaf gel. South African Journal of Botany, 77(4):988-995.
Palumbo, P., Picchini, U., Beck, B., Van Gelder, J., Delbar, N. & Degaetano, A. 2008. A
general approach to the apparent permeability index. Journal of Pharmacokinetics and
Pharmacodynamics, 35(2):235-248.
Park, K., Kwon, I.C. & Park, K. 2011. Oral protein delivery: current status and future
prospect. Reactive and Functional Polymers, 71(3):280-287.
135
Peppas, N.A. & Klier, J. 1991. Controlled release by using poly(methacrylic acid-g-ethylene
glycol) hydrogels. Journal of Controlled Release, 16(1):203-214.
Polnok, A., Borchard, G., Verhoef, J.C., Sarisuta, N. & Junginger, H.E. 2004. Influence of
methylation process on the degree of quaternization of N-trimethyl chitosan chloride.
European Journal of Pharmaceutics and Biopharmaceutics, 57(1):77-83.
Ramachandra, C.T. & Rao, P.S. 2008. Processing of Aloe Vera leaf gel: a review.
American Journal of Agricultural and Biological Sciences, 3(2):502-510.
Rubas, W., Cromwell, M.E.M., Shahrokh, Z., Villagran, J., Nguyen, T.N., Wellton, M. &
Mrsny, R.J. 1996. Flux measurements across Caco‐2 monolayers may predict transport in
human large intestinal tissue. Journal of Pharmaceutical Sciences, 85(2):165-169.
Rúnarsson, O.V., Holappa, J., Nevalainen, T., Hjálmarsdóttir, M., Järvinen, T., Loftsson, T.,
Einarsson, J.M., Jónsdóttir, S., Valdimarsdóttir, M. & Másson, M. 2007. Antibacterial activity
of methylated chitosan and chitooligomer derivatives: synthesis and structure activity
relationships. European Polymer Journal, 43(6):2660-2671.
Salama, N.N., Eddington, N.D. & Fasano, A. 2006. Tight junction modulation and its
relationship to drug delivery. Advanced Drug Delivery Reviews, 58(1):15-28.
Salamat-Miller, N. & Johnston, T.P. 2005. Current strategies used to enhance the
paracellular transport of therapeutic polypeptides across the intestinal epithelium.
International Journal of Pharmaceutics, 294(1):201-216.
Sambuy, Y., De Angelis, I., Ranaldi, G., Scarino, M.L., Stammati, A. & Zucco, F. 2005. The
Caco-2 cell line as a model of the intestinal barrier: influence of cell and culture-related
factors on Caco-2 cell functional characteristics. Cell Biology and Toxicology, 21(1):1-26.
Sarciaux, J.M., Acar, L. & Sado, P.A. 1995. Using microemulsion formulations for oral drug
delivery of therapeutic peptides. International Journal of Pharmacology, 120(2):127-136.
Sarmento, B., Andrade, F., Silva, S.B.D., Rodrigues, F., Das Neves, J. & Ferreira, D. 2012.
Cell-based in vitro models for predicting drug permeability. Expert Opinion on Drug
Metabolism and Toxicology, 8(5):607-621.
Sato, H., Sugiyama, Y., Tsuji, A. & Horikoshi, I. 1996. Importance of receptor-mediated
endocytosis in peptide delivery and targeting: kinetic aspects. Advanced Drug Delivery
Reviews, 19(3):445-467.

136
Shargel, L., Wu-Pong, S. & Yu, A.B.C. 2005. Physiologic factors related to drug
absorption. (In: Applied biopharmaceutics and pharmacokinetics, 5th ed. New York: The
McGraw-Hill Companies. p. 371-408).
Sieval, A.B., Thanou, M., Kotzé, A.F., Verhoef, J.C., Brussee, J. & Junginger, H.E. 1998.
Preparation and NMR characterization of highly substituted N-trimethyl chitosan chloride.
Carbohydrate Polymers, 36(3):157-165.
Silverstein, S.C., Steinman, R.M. & Cohn, Z.A. 1977. Endocytosis. Annual Review of
Biochemistry, 46(1):669-772.
Steenkamp, V. & Stewart, M.J. 2007. Medicinal applications and toxicological activities of
aloe products. Pharmaceutical Biology, 45(5):411-420.
Sühnel, J. 1998. Parallel dose-response curves in combination experiments. Bulletin of
Mathematical Biology, 60(2):197-213.
Tabachnick, B.G. & Fidell, L.S. 2001. Using multivariate statistics. 4th ed. Boston: Allyn
and Bacon.
Tallarida, R.J. 2002. The interaction index: a measure of drug synergism. Pain, 98(1):163-
168.
Tammes, P.M.L. 1964. Isoboles, a graphic representation of synergism in pesticides.
Netherlands Journal of Plant Pathology, 70(3):73-80.
Tarirai, C., Viljoen, A.M. & Hamman, J.H. 2012. Effects of dietary fruits, vegetables and a
herbal tea on the in vitro transport of cimetidine: comparing the Caco-2 model with porcine
jejunum tissue. Pharmaceutical Biology, 50(2):254-263.
Thanou, M.M., Kotzé, A.F., Scharringhausen, T., Luessen, H.L., De Boer, A.G., Verhoef,
J.C. & Junginger, H.E. 2000. Effect of degree of quaternization of N-trimethyl chitosan
chloride for enhanced transport of hydrophilic compounds across intestinal Caco-2 cell
monolayers. Journal of Controlled Release, 64(1):15-25.
Thanou, M., Verhoef, J.C. & Junginger, H.E. 2001. Oral drug absorption enhancement by
chitosan and its derivatives. Advanched Drug Delivery Reviews, 52(2):117-126.
Thanou, M.M., Verhoef, J.C., Romeijn, S.G., Nagelkerke, J.F., Merkus, F.W.H.M. &
Junginger, H.E. 1999. Effects of N-trimethyl chitosan chloride, a novel absorption enhancer,

137
on Caco-2 intestinal epithelia and the ciliary beat frequency of chicken embryo
trachea. International Journal of Pharmaceutics, 185(1):73-82.
The Highway Online. 2012. Many Benefits of Aloe Vera / Aloe Ferox. http://www.the
highwayonline.co.za/2013/08/04/many-benefits-of-aloe-veraaloe-ferox/ Date of access: 2
Aug. 2014.
United States Pharmacopoeia. 2013a. Validation of compendial procedures. https://hmc.
usp.org/sites/default/files/documents/HMC/GCs-Pdfs/c1225%20USP36.pdf Date of access:
6 Jun. 2014.
Unklab Nursing Portal. 2013. Introduction to biological membranes. http://perawatunk
lab.wordpress.com/2013/01/20/introduction-to-biological-membranes/ Date of access: 10
Aug. 2014.
USP see United States Pharmacopoeia.
Van Itallie, C.M. & Anderson, J.M. 2014 Architecture of tight junctions and principles of
molecular composition. Seminars in Cell and Developmental Biology, 36:157-165.
Van Vuuren, S & Viljoen, A. 2011. Plant-based antimicrobial studies–methods and
approaches to study the interaction between natural products. Planta Medica, 77(11):1168-
1182.
Van Wyk, B.-E & Smith, G.F. 2005. (In: Ferreira, R., ed. Guide to the aloes of South
Africa, 2nd ed. Pretoria: Briza. p. 1-62).
Varma, M.V.S., Ashokraj, Y., Dey, C.S. & Panchagnula, R. 2003. P-glycoprotein inhibitors
and their screening: a perspective from bioavailability enhancement. Pharmacological
Research, 48(4):347-359.
Vinson, J.A., Al Kharrat, H. & Andreoli, L. 2005. Effect of Aloe vera preparations on the
human bioavailability of vitamins C and E. Phytomedicine, 12(10):760-765.
Wagner, H. 1999. New approaches in phytopharmacological research. Pure and Applied
Chemistry, 71(9):1649-1654.
Wagner, H. 2009. Synergy research: approaching a new generation of
phytopharmaceuticals. Phytomedicine, 16(2-3):97-110.
138
Wagner, H. 2011. Synergy research: approaching a new generation of
phytopharmaceuticals. Fitoterapia, 82(1):34-37.
Wagner, H. & Ulrich-Mezenich, G. 2009. Synergy research: approaching a new generation
of phytopharmaceuticals. Phytomedicine, 16(2):97-110.
Whitehead, K., Karr, N. & Mitragotri, S. 2008. Discovery of synergistic permeation
enhancers for oral drug delivery. Journal of Controlled Release, 128(2):128-133.
Williamson, E.M. 2001. Synergy and other interactions in phytomedicines.
Phytomedicine, 8(5):401-409.
World of Succulents. 2013. http://www.worldofsucculents.com/aloe-marlothii-mountain-
aloe-flat-flowered-aloe/ Date of access: 2014 July 31.
Zhou, X.H. 1994. Overcoming enzymatic and absorption barriers to non-parenterally
administered protein and peptide drugs. Journal of Controlled Release, 29(3):239-252.

139
ADDENDUM A TRANSEPITHELIAL ELECTRICAL RESISTANCE
ACROSS CACO-2 CELL MONOLAYERS
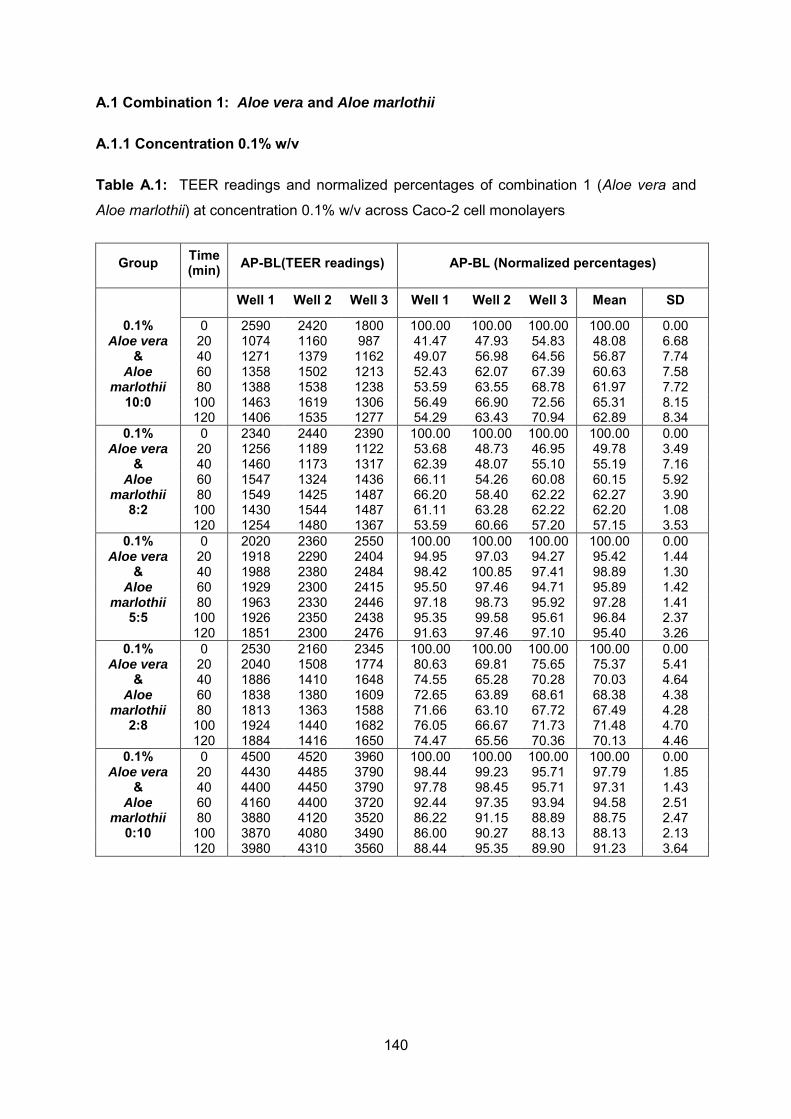
140
A.1 Combination 1: Aloe vera and Aloe marlothii
A.1.1 Concentration 0.1% w/v
Table A.1: TEER readings and normalized percentages of combination 1 (Aloe vera and
Aloe marlothii) at concentration 0.1% w/v across Caco-2 cell monolayers
Group Time (min) AP-BL(TEER readings) AP-BL (Normalized percentages)
Well 1 Well 2 Well 3 Well 1 Well 2 Well 3 Mean SD
0.1% 0 2590 2420 1800 100.00 100.00 100.00 100.00 0.00 Aloe vera 20 1074 1160 987 41.47 47.93 54.83 48.08 6.68
& 40 1271 1379 1162 49.07 56.98 64.56 56.87 7.74 Aloe 60 1358 1502 1213 52.43 62.07 67.39 60.63 7.58
marlothii 80 1388 1538 1238 53.59 63.55 68.78 61.97 7.72 10:0 100 1463 1619 1306 56.49 66.90 72.56 65.31 8.15
120 1406 1535 1277 54.29 63.43 70.94 62.89 8.34 0.1% 0 2340 2440 2390 100.00 100.00 100.00 100.00 0.00
Aloe vera 20 1256 1189 1122 53.68 48.73 46.95 49.78 3.49 & 40 1460 1173 1317 62.39 48.07 55.10 55.19 7.16
Aloe 60 1547 1324 1436 66.11 54.26 60.08 60.15 5.92 marlothii 80 1549 1425 1487 66.20 58.40 62.22 62.27 3.90
8:2 100 1430 1544 1487 61.11 63.28 62.22 62.20 1.08 120 1254 1480 1367 53.59 60.66 57.20 57.15 3.53
0.1% 0 2020 2360 2550 100.00 100.00 100.00 100.00 0.00 Aloe vera 20 1918 2290 2404 94.95 97.03 94.27 95.42 1.44
& 40 1988 2380 2484 98.42 100.85 97.41 98.89 1.30 Aloe 60 1929 2300 2415 95.50 97.46 94.71 95.89 1.42
marlothii 80 1963 2330 2446 97.18 98.73 95.92 97.28 1.41 5:5 100 1926 2350 2438 95.35 99.58 95.61 96.84 2.37
120 1851 2300 2476 91.63 97.46 97.10 95.40 3.26 0.1% 0 2530 2160 2345 100.00 100.00 100.00 100.00 0.00
Aloe vera 20 2040 1508 1774 80.63 69.81 75.65 75.37 5.41 & 40 1886 1410 1648 74.55 65.28 70.28 70.03 4.64
Aloe 60 1838 1380 1609 72.65 63.89 68.61 68.38 4.38 marlothii 80 1813 1363 1588 71.66 63.10 67.72 67.49 4.28
2:8 100 1924 1440 1682 76.05 66.67 71.73 71.48 4.70 120 1884 1416 1650 74.47 65.56 70.36 70.13 4.46
0.1% 0 4500 4520 3960 100.00 100.00 100.00 100.00 0.00 Aloe vera 20 4430 4485 3790 98.44 99.23 95.71 97.79 1.85
& 40 4400 4450 3790 97.78 98.45 95.71 97.31 1.43 Aloe 60 4160 4400 3720 92.44 97.35 93.94 94.58 2.51
marlothii 80 3880 4120 3520 86.22 91.15 88.89 88.75 2.47 0:10 100 3870 4080 3490 86.00 90.27 88.13 88.13 2.13
120 3980 4310 3560 88.44 95.35 89.90 91.23 3.64

141
Table A.2: Percentage reduced TEER of combination 1 (Aloe vera and Aloe marlothii) at
concentration 0.1% w/v across Caco-2 cell monolayers
Group Time (min) AP-BL (Percentage reduced TEER)
Well 1 Well 2 Well 3 Mean SD
0.1% 0 0.00 0.00 0.00 0.00 0.00 Aloe vera 20 58.53 52.07 45.17 51.92 6.68
& 40 50.93 43.02 35.44 43.13 7.74 Aloe 60 47.57 37.93 32.61 39.37 7.58
marlothii 80 46.41 36.45 31.22 38.03 7.72 10:0 100 43.51 33.10 27.44 34.69 8.15
120 45.71 36.57 29.06 37.11 8.34 0.1% 0 0.00 0.00 0.00 0.00 0.00
Aloe vera 20 46.32 51.27 53.05 50.22 3.49 & 40 37.61 51.93 44.90 44.81 7.16
Aloe 60 33.89 45.74 39.92 39.85 5.92 marlothii 80 33.80 41.60 37.78 37.73 3.90
8:2 100 38.89 36.72 37.78 37.80 1.08 120 46.41 39.34 42.80 42.85 3.53
0.1% 0 0.00 0.00 0.00 0.00 0.00 Aloe vera 20 5.05 2.97 5.73 4.58 1.44
& 40 1.58 0.00 2.59 1.39 1.30 Aloe 60 4.50 2.54 5.29 4.11 1.42
marlothii 80 2.82 1.27 4.08 2.72 1.41 5:5 100 4.65 0.42 4.39 3.16 2.37
120 8.37 2.54 2.90 4.60 3.26 0.1% 0 0.00 0.00 0.00 0.00 0.00
Aloe vera 20 19.37 30.19 24.35 24.63 5.41 & 40 25.45 34.72 29.72 29.97 4.64
Aloe 60 27.35 36.11 31.39 31.62 4.38 marlothii 80 28.34 36.90 32.28 32.51 4.28
2:8 100 23.95 33.33 28.27 28.52 4.70 120 25.53 34.44 29.64 29.87 4.46
0.1% 0 0.00 0.00 0.00 0.00 0.00 Aloe vera 20 1.56 0.77 4.29 2.21 1.85
& 40 2.22 1.55 4.29 2.69 1.43 Aloe 60 7.56 2.65 6.06 5.42 2.51
marlothii 80 13.78 8.85 11.11 11.25 2.47 0:10 100 14.00 9.73 11.87 11.87 2.13
120 11.56 4.65 10.10 8.77 3.64

142
Table A.3: P-values for the reduced percentage TEER values of combination 1 (Aloe vera
and Aloe marlothii) at concentration 0.1% w/v at time 60 min across Caco-2 cell monolayers
comparing to the control groups
Group n Mean SD p-value: Dunnett
TEER
ANOVA Pos. Contr. Neg. Contr.
0.1% AV_AM 10:0 3 39.37 7.58 0.057789 0.000009*
0.1% AV_AM 8:2 3 39.85 5.92 0.069272 0.000009*
0.1% AV_AM 5:5 3 4.11 1.42 0.000010* 0.694797
0.1% AV_AM 2:8 3 31.62 4.38 0.002959* 0.000016*
0.1% AV_AM 0:10 3 5.42 2.51 0.000010* 0.467520
Positive control 3 52.26 8.26 0.000001*
Negative control 3 0.00 0.00 0.00
* Statistically significantly different at 0.05 level
Table A.4: P-values for the TEER values of combination 1 (Aloe vera and Aloe marlothii) at
concentration 0.1% w/v at time 120 min across Caco-2 cell monolayers comparing to the
control groups
Group n Mean SD p-value: Dunnett
TEER
ANOVA Pos. Contr. Neg. Contr.
0.1% AV_AM 10:0 3 37.11 8.34 0.004311* 0.000010*
0.1% AV_AM 8:2 3 42.85 3.53 0.028746 0.000009*
0.1% AV_AM 5:5 3 4.60 3.26 0.000010* 0.626466
0.1% AV_AM 2:8 3 29.87 4.46 0.000465* 0.000026*
0.1% AV_AM 0:10 3 8.77 3.64 0.000011* 0.129893
Positive control 3 59.96 11.35 0.000002*
Negative control 3 0.00 0.00 0.00
* Statistically significantly different at 0.05 level

143
A.1.2 Concentration 0.5% w/v
Table A.5: TEER readings and normalized percentages of combination 1 (Aloe vera and
Aloe marlothii) at concentration 0.5% w/v across Caco-2 cell monolayers
Experiment Time (min) AP-BL(TEER readings) AP-BL (Normalized percentages)
Well 1 Well 2 Well 3 Well 1 Well 2 Well 3 Mean SD
0.5% 0 4285 4280 4290 100.00 100.00 100.00 100.00 0.00 Aloe vera 20 3825 3710 3940 89.26 86.68 91.84 89.26 2.58
& 40 4175 4210 4140 97.43 98.36 96.50 97.43 0.93 Aloe 60 3870 3910 3830 90.32 91.36 89.28 90.32 1.04
marlothii 80 3815 3790 3840 89.03 88.55 89.51 89.03 0.48 10:0 100 3605 3680 3530 84.13 85.98 82.28 84.13 1.85
120 3645 3710 3580 85.06 86.68 83.45 85.07 1.62 0.5% 0 2760 3020 2600 100.00 100.00 100.00 100.00 0.00
Aloe vera 20 1253 1526 1232 45.40 50.53 47.38 47.77 2.59 & 40 1522 1925 1673 55.14 63.74 64.35 61.08 5.15
Aloe 60 1726 2240 2000 62.54 74.17 76.92 71.21 7.64 marlothii 80 1835 2460 2160 66.49 81.46 83.08 77.01 9.15
8:2 100 1995 2680 2330 72.28 88.74 89.62 83.55 9.76 120 2220 2695 2370 80.43 89.24 91.15 86.94 5.72
0.5% 0 3275 3270 3280 100.00 100.00 100.00 100.00 0.00 Aloe vera 20 1799 1288 1544 54.93 39.39 47.07 47.13 7.77
& 40 1615 1686 1544 49.31 51.56 47.07 49.32 2.24 Aloe 60 1822 2100 1544 55.63 64.22 47.07 55.64 8.57
marlothii 80 2310 2420 2200 70.53 74.01 67.07 70.54 3.47 5:5 100 2475 2680 2270 75.57 81.96 69.21 75.58 6.37
120 2525 2740 2310 77.10 83.79 70.43 77.11 6.68 0.5% 0 689 735 3300 100.00 100.00 100.00 100.00 0.00
Aloe vera 20 451 489 1665 65.46 66.53 50.45 60.81 8.99 & 40 470 535 2040 68.21 72.79 61.82 67.61 5.51
Aloe 60 486 566 1470 70.54 77.01 44.55 64.03 17.18 marlothii 80 490 600 1910 71.12 81.63 57.88 70.21 11.90
2:8 100 456 610 2200 66.18 82.99 66.67 71.95 9.57 120 462 637 2250 67.05 86.67 68.18 73.97 11.01
0.5% 0 3750 4080 4390 100.00 100.00 100.00 100.00 0.00 Aloe vera 20 3230 3180 3960 86.13 77.94 90.21 84.76 6.25
& 40 2930 2680 3380 78.13 65.69 76.99 73.60 6.88 Aloe 60 2700 2960 2830 72.00 72.55 64.46 69.67 4.52
marlothii 80 2920 3150 3035 77.87 77.21 69.13 74.74 4.86 0:10 100 2850 3060 2955 76.00 75.00 67.31 72.77 4.75
120 2250 2280 2265 60.00 55.88 51.59 55.83 4.20

144
Table A.6: Percentage reduced TEER of combination 1 (Aloe vera and Aloe marlothii)
concentration at 0.5% w/v across Caco-2 cell monolayers
Experiment Time (min) AP-BL (Percentage reduced TEER)
Well 1 Well 2 Well 3 Mean SD
0.5% 0 0.00 0.00 0.00 0.00 0.00 Aloe vera 20 10.74 13.32 8.16 10.74 2.58
& 40 2.57 1.64 3.50 2.57 0.93 Aloe 60 9.68 8.64 10.72 9.68 1.04
marlothii 80 10.97 11.45 10.49 10.97 0.48 10:0 100 15.87 14.02 17.72 15.87 1.85
120 14.94 13.32 16.55 14.93 1.62 0.5% 0 0.00 0.00 0.00 0.00 0.00
Aloe vera 20 54.60 49.47 52.62 52.23 2.59 & 40 44.86 36.26 35.65 38.92 5.15
Aloe 60 37.46 25.83 23.08 28.79 7.64 marlothii 80 33.51 18.54 16.92 22.99 9.15
8:2 100 27.72 11.26 10.38 16.45 9.76 120 19.57 10.76 8.85 13.06 5.72
0.5% 0 0.00 0.00 0.00 0.00 0.00 Aloe vera 20 45.07 60.61 52.93 52.87 7.77
& 40 50.69 48.44 52.93 50.68 2.24 Aloe 60 44.37 35.78 52.93 44.36 8.57
marlothii 80 29.47 25.99 32.93 29.46 3.47 5:5 100 24.43 18.04 30.79 24.42 6.37
120 22.90 16.21 29.57 22.89 6.68 0.5% 0 0.00 0.00 0.00 0.00 0.00
Aloe vera 20 34.54 33.47 49.55 39.19 8.99 & 40 31.79 27.21 38.18 32.39 5.51
Aloe 60 29.46 22.99 55.45 35.97 17.18 marlothii 80 28.88 18.37 42.12 29.79 11.90
2:8 100 33.82 17.01 33.33 28.05 9.57 120 32.95 13.33 31.82 26.03 11.01
0.5% 0 0.00 0.00 0.00 0.00 0.00 Aloe vera 20 13.87 22.06 9.79 15.24 6.25
& 40 21.87 34.31 23.01 26.40 6.88 Aloe 60 28.00 27.45 35.54 30.33 4.52
marlothii 80 22.13 22.79 30.87 25.26 4.86 0:10 100 24.00 25.00 32.69 27.23 4.75
120 40.00 44.12 48.41 44.17 4.20

145
Table A.7: P-values for the TEER values of combination 1 (Aloe vera and Aloe marlothii)
concentration at 0.5% w/v at time 60 min across Caco-2 cell monolayers comparing to the
control groups
Group n Mean SD p-value: Dunnett
TEER
ANOVA Pos. Contr. Neg. Contr.
0.5% AV_AM 10:0 3 9.68 1.04 0.000021* 0.947219
0.5% AV_AM 8:2 3 28.79 7.64 0.000427* 0.260673
0.5% AV_AM 5:5 3 44.36 8.57 0.013466* 0.047079*
0.5% AV_AM 2:8 3 35.97 17.18 0.001964* 0.122276
0.5% AV_AM 0:10 3 54.66 40.33 0.000585* 0.014076*
Positive control 3 71.77 7.82 0.000084*
Negative control 3 0.00 0.00 0.027481*
* Statistically significantly different at 0.05 level
Table A.8: P-values for the TEER values of combination 1 (Aloe vera and Aloe marlothii)
concentration at 0.5% w/v at time 120 min. across Caco-2 cell monolayers comparing to the
control groups
Group n Mean SD p-value: Dunnett
TEER
ANOVA Pos.
Contr. Neg.
Contr.
0.5% AV_AM 10:0 3 14.93 1.62 0.000009* 0.587509
0.5% AV_AM 8:2 3 13.06 5.72 0.000009* 0.693120
0.5% AV_AM 5:5 3 22.89 6.68 0.000010* 0.233110
0.5% AV_AM 2:8 3 26.03 11.01 0.000012* 0.151609
0.5% AV_AM 0:10 3 64.51 31.68 0.000304* 0.000525*
Positive control 3 75.17 5.15 0.00
Negative control 3 0.00 0.00 0.002435*
* Statistically significantly different at 0.05 level

146
A.2 Combination 2: Aloe vera and Aloe ferox
A.2.1 Concentration 0.1% w/v
Table A.9: TEER readings and normalized percentages of combination 2 (Aloe vera and
Aloe ferox) at concentration 0.1% w/v across Caco-2 cell monolayers
Group Time (min) AP-BL(TEER readings) AP-BL (Normalized percentages)
Well 1 Well 2 Well 3 Well 1 Well 2 Well 3 Mean SD
0.1% 0 2590 2420 1800 100.00 100.00 100.00 100.00 0.00 Aloe vera 20 1074 1160 987 41.47 47.93 54.83 48.08 6.68
& 40 1271 1379 1162 49.07 56.98 64.56 56.87 7.74 Aloe 60 1358 1502 1213 52.43 62.07 67.39 60.63 7.58 ferox 80 1388 1538 1238 53.59 63.55 68.78 61.97 7.72 10:0 100 1463 1619 1306 56.49 66.90 72.56 65.31 8.15
120 1406 1535 1277 54.29 63.43 70.94 62.89 8.34 0.1% 0 1415 1640 1190 100.00 100.00 100.00 100.00 0.00
Aloe vera 20 1143 1214 1072 80.78 74.02 90.08 81.63 8.06 & 40 1213 1359 1066 85.72 82.87 89.58 86.06 3.37
Aloe 60 1257 1434 1080 88.83 87.44 90.76 89.01 1.67 ferox 80 1272 1436 1108 89.89 87.56 93.11 90.19 2.79 8:2 100 1308 1485 1130 92.44 90.55 94.96 92.65 2.21
120 1347 1546 1147 95.19 94.27 96.39 95.28 1.06 0.1% 0 3478 3560 3530 100.00 100.00 100.00 100.00 0.00
Aloe vera 20 3305 3280 3330 95.03 92.13 94.33 93.83 1.51 & 40 3350 3320 3380 96.32 93.26 95.75 95.11 1.63
Aloe 60 3400 3370 3430 97.76 94.66 97.17 96.53 1.64 ferox 80 3373 3360 3385 96.98 94.38 95.89 95.75 1.31 5:5 100 3365 3390 3340 96.75 95.22 94.62 95.53 1.10
120 3335 3350 3320 95.89 94.10 94.05 94.68 1.05 0.1% 0 3210 2960 3690 100.00 100.00 100.00 100.00 0.00
Aloe vera 20 2750 2730 2885 85.67 92.23 78.18 85.36 7.03 & 40 2290 2170 2080 71.34 73.31 56.37 67.01 9.27
Aloe 60 2415 2480 2350 75.23 83.78 63.69 74.23 10.09 ferox 80 2780 2680 2580 86.60 90.54 69.92 82.35 10.95 2:8 100 2445 2130 2760 76.17 71.96 74.80 74.31 2.15
120 2510 2070 2950 78.19 69.93 79.95 76.02 5.35 0.1% 0 4790 4830 4540 100.00 100.00 100.00 100.00 0.00
Aloe vera 20 4695 4610 4420 98.02 95.45 97.36 96.94 1.34 & 40 4600 4560 4360 96.03 94.41 96.04 95.49 0.94
Aloe 60 4395 4480 4310 91.75 92.75 94.93 93.15 1.63 ferox 80 4355 4410 4300 90.92 91.30 94.71 92.31 2.09 0:10 100 4270 4310 4230 89.14 89.23 93.17 90.52 2.30
120 4240 4280 4200 88.52 88.61 92.51 89.88 2.28

147
Table A.10: Percentage reduced TEER of combination 2 (Aloe vera and Aloe ferox) at
concentration 0.1% w/v across Caco-2 cell monolayers
Group Time (min) AP-BL (Percentage reduced TEER)
Well 1 Well 2 Well 3 Mean SD
0.1% 0 0.00 0.00 0.00 0.00 0.00 Aloe vera 20 58.53 52.07 45.17 51.92 6.68
& 40 50.93 43.02 35.44 43.13 7.74 Aloe 60 47.57 37.93 32.61 39.37 7.58 ferox 80 46.41 36.45 31.22 38.03 7.72 10:0 100 43.51 33.10 27.44 34.69 8.15
120 45.71 36.57 29.06 37.11 8.34 0.1% 0 0.00 0.00 0.00 0.00 0.00
Aloe vera 20 19.22 25.98 9.92 18.37 8.06 & 40 14.28 17.13 10.42 13.94 3.37
Aloe 60 11.17 12.56 9.24 10.99 1.67 ferox 80 10.11 12.44 6.89 9.81 2.79 8:2 100 7.56 9.45 5.04 7.35 2.21
120 4.81 5.73 3.61 4.72 1.06 0.1% 0 0.00 0.00 0.00 0.00 0.00
Aloe vera 20 4.97 7.87 5.67 6.17 1.51 & 40 3.68 6.74 4.25 4.89 1.63
Aloe 60 2.24 5.34 2.83 3.47 1.64 ferox 80 3.02 5.62 4.11 4.25 1.31 5:5 100 3.25 4.78 5.38 4.47 1.10
120 4.11 5.90 5.95 5.32 1.05 0.1% 0 0.00 0.00 0.00 0.00 0.00
Aloe vera 20 14.33 7.77 21.82 14.64 7.03 & 40 28.66 26.69 43.63 32.99 9.27
Aloe 60 24.77 16.22 36.31 25.77 10.09 ferox 80 13.40 9.46 30.08 17.65 10.95 2:8 100 23.83 28.04 25.20 25.69 2.15
120 21.81 30.07 20.05 23.98 5.35 0.1% 0 0.00 0.00 0.00 0.00 0.00
Aloe vera 20 1.98 4.55 2.64 3.06 1.34 & 40 3.97 5.59 3.96 4.51 0.94
Aloe 60 8.25 7.25 5.07 6.85 1.63 ferox 80 9.08 8.70 5.29 7.69 2.09 0:10 100 10.86 10.77 6.83 9.48 2.30
120 11.48 11.39 7.49 10.12 2.28

148
Table A.11: P-values for the reduced percentage TEER values of combination 2 (Aloe vera
and Aloe ferox) at concentration 0.1% w/v at time 60 min across Caco-2 cell monolayers
comparing to the control groups
Group n Mean SD p-value: Dunnett
TEER
ANOVA Pos. Contr. Neg. Contr.
0.1% AV_AF 10:0 3 39.37 7.58 0.096649 0.000013*
0.1% AV_AF 8:2 3 10.99 1.67 0.000024* 0.92053
0.1% AV_AF 5:5 3 3.47 1.64 0.000011* 0.882332
0.1% AV_AF 2:8 3 25.77 10.09 0.000982* 0.000287*
0.1% AV_AF 0:10 3 6.85 1.63 0.000014* 0.408332
Positive control 3 52.26 8.26 0.000002*
Negative control 3 0.00 0.00 0.000006*
* Statistically significantly different at 0.05 level
Table A.12: P-values for the TEER values of combination 2 (Aloe vera and Aloe ferox) at
concentration 0.1% w/v at time 120 min across Caco-2 cell monolayers comparing to the
control groups
Group n Mean SD p-value: Dunnett
TEER
ANOVA Pos. Contr. Neg. Contr.
0.1% AV_AF 10:0 3 37.11 8.34 0.003158* 0.000009*
0.1% AV_AF 8:2 3 4.72 1.10 0.000009* 0.532831
0.1% AV_AF 5:5 3 5.32 1.05 0.000010* 0.428361
0.1% AV_AF 2:8 3 23.98 5.35 0.000067* 0.000072*
0.1% AV_AF 0:10 3 10.12 2.28 0.000011* 0.045576*
Positive control 3 59.96 11.35 0.000001*
Negative control 3 0.00 0.00 0.000001*
* Statistically significantly different at 0.05 level

149
A.2.2 Concentration 0.5% w/v
Table A.13: TEER readings and normalized percentages of combination 2 (Aloe vera and
Aloe ferox) at concentration 0.5% w/v across Caco-2 cell monolayers
Group Time (min) AP-BL(TEER readings) AP-BL (Normalized percentages)
Well 1 Well 2 Well 3 Well 1 Well 2 Well 3 Mean SD
0.5% 0 4285 4280 4290 100.00 100.00 100.00 100.00 0.00 Aloe vera 20 3825 3710 3940 89.26 86.68 91.84 89.26 2.58
& 40 4175 4210 4140 97.43 98.36 96.50 97.43 0.93 Aloe 60 3870 3910 3830 90.32 91.36 89.28 90.32 1.04 ferox 80 3815 3790 3840 89.03 88.55 89.51 89.03 0.48 10:0 100 3605 3680 3530 84.13 85.98 82.28 84.13 1.85
120 3645 3710 3580 85.06 86.68 83.45 85.07 1.62 0.5% 0 2800 2780 2811 100.00 100.00 100.00 100.00 0.00
Aloe vera 20 1924 1297 2670 68.71 46.65 94.98 70.12 24.20 & 40 2080 1895 2880 74.29 68.17 102.45 81.64 18.29
Aloe 60 2080 2080 2690 74.29 74.82 95.70 81.60 12.21 ferox 80 2380 2390 3010 85.00 85.97 107.08 92.68 12.48 8:2 100 2080 2320 2590 74.29 83.45 92.14 83.29 8.93
120 2620 2540 2760 93.57 91.37 98.19 94.37 3.48 0.5% 0 2365 2480 2250 100.00 100.00 100.00 100.00 0.00
Aloe vera 20 1303 1903 1702 55.10 76.73 75.64 69.16 12.19 & 40 1858 1325 2190 78.56 53.43 97.33 76.44 22.03
Aloe 60 1881 1522 2240 79.53 61.37 99.56 80.15 19.10 ferox 80 1952 1888 2016 82.54 76.13 89.60 82.76 6.74 5:5 100 1402 1012 1792 59.28 40.81 79.64 59.91 19.43
120 1581 1112 2050 66.85 44.84 91.11 67.60 23.15 0.5% 0 1940 2070 2005 100.00 100.00 100.00 100.00 0.00
Aloe vera 20 897 1360.5 1824 46.24 65.72 90.97 67.64 22.43 & 40 525 1146.5 1768 27.06 55.39 88.18 56.88 30.59
Aloe 60 507 1093 1679 26.13 52.80 83.74 54.23 28.83 ferox 80 528 1166 1804 27.22 56.33 89.98 57.84 31.41 2:8 100 509 1094.5 1680 26.24 52.87 83.79 54.30 28.80
120 573 1272.5 1972 29.54 61.47 98.35 63.12 34.44 0.5% 0 2940 3520 3230 100.00 100.00 100.00 100.00 0.00
Aloe vera 20 2830 3445 3138 96.26 97.87 97.15 97.09 0.81 & 40 2720 3370 3045 92.52 95.74 94.27 94.18 1.61
Aloe 60 2480 3010 2745 84.35 85.51 84.98 84.95 0.58 ferox 80 2160 2780 2470 73.47 78.98 76.47 76.31 2.76 0:10 100 2030 2680 2355 69.05 76.14 72.91 72.70 3.55
120 1938 2720 2329 65.92 77.27 72.11 71.77 5.68

150
Table A.14: Percentage reduced TEER of combination 2 (Aloe vera and Aloe ferox) at
concentration 0.5% w/v across Caco-2 cell monolayers
Group Time (min) AP-BL (Percentage reduced TEER)
Well 1 Well 2 Well 3 Mean SD
0.5% 0 0.00 0.00 0.00 0.00 0.00 Aloe vera 20 10.74 13.32 8.16 10.74 2.58
& 40 2.57 1.64 3.50 2.57 0.93 Aloe 60 9.68 8.64 10.72 9.68 1.04 ferox 80 10.97 11.45 10.49 10.97 0.48 10:0 100 15.87 14.02 17.72 15.87 1.85
120 14.94 13.32 16.55 14.93 1.62 0.5% 0 0.00 0.00 0.00 0.00 0.00
Aloe vera 20 31.29 53.35 5.02 29.88 24.20 & 40 25.71 31.83 2.45 18.36 18.29
Aloe 60 25.71 25.18 4.30 18.40 12.21 ferox 80 15.00 14.03 7.08 7.32 12.48 8:2 100 25.71 16.55 7.86 16.71 8.93
120 6.43 8.63 1.81 5.63 3.48 0.5% 0 0.00 0.00 0.00 0.00 0.00
Aloe vera 20 44.90 23.27 24.36 30.84 12.19 & 40 21.44 46.57 2.67 23.56 22.03
Aloe 60 20.47 38.63 0.44 19.85 19.10 ferox 80 17.46 23.87 10.40 17.24 6.74 5:5 100 40.72 59.19 20.36 40.09 19.43
120 33.15 55.16 8.89 32.40 23.15 0.5% 0 0.00 0.00 0.00 0.00 0.00
Aloe vera 20 53.76 34.28 9.03 32.36 22.43 & 40 72.94 44.61 11.82 43.12 30.59
Aloe 60 73.87 47.20 16.26 45.77 28.83 ferox 80 72.78 43.67 10.02 42.16 31.41 2:8 100 73.76 47.13 16.21 45.70 28.80
120 70.46 38.53 1.65 36.88 34.44 0.5% 0 0.00 0.00 0.00 0.00 0.00
Aloe vera 20 3.74 2.13 2.85 2.91 0.81 & 40 7.48 4.26 5.73 5.82 1.61
Aloe 60 15.65 14.49 15.02 15.05 0.58 ferox 80 26.53 21.02 23.53 23.69 2.76 0:10 100 30.95 23.86 27.09 27.30 3.55
120 34.08 22.73 27.89 28.23 5.68

151
Table A.15: P-values for the TEER values of combination 2 (Aloe vera and Aloe ferox) at
concentration 0.5% w/v at time 60 min across Caco-2 cell monolayers comparing to the
control groups
Group n Mean SD p-value: Dunnett
TEER
ANOVA Pos. Contr. Neg. Contr.
0.5% AV_AF 10:0 3 9.68 1.04 0.001394* 0.888560
0.5% AV_AF 8:2 3 18.40 12.21 0.004510* 0.456055
0.5% AV_AF 5:5 3 19.85 19.10 0.005511* 0.390564
0.5% AV_AF 2:8 3 45.77 28.83 0.199643 0.011289*
0.5% AV_AF 0:10 3 15.10 0.58 0.002852* 0.626728
Positive control 3 71.77 7.82 0.002309*
Negative control 3 0.00 0.00 0.048163*
* Statistically significantly different at 0.05 level
Table A.16: P-values for the TEER values of combination 2 (Aloe vera and Aloe ferox) at
concentration 0.5% w/v at time 120 min across Caco-2 cell monolayers comparing to the
control groups
Group n Mean SD p-value: Dunnett
TEER
ANOVA Pos. Contr. Neg. Contr.
0.5% AV_AF 10:0 3 14.94 1.62 0.004532* 0.733868
0.5% AV_AF 8:2 3 5.63 3.48 0.001490* 0.992368
0.5% AV_AF 5:5 3 32.40 23.15 0.04005* 0.137180
0.5% AV_AF 2:8 3 36.88 34.44 0.069676 0.080029
0.5% AV_AF 0:10 3 28.23 5.68 0.023731* 0.220817
Positive control 3 75.17 5.15 0.006015*
Negative control 3 0.00 0.00 0.108269
* Statistically significantly different at 0.05 level
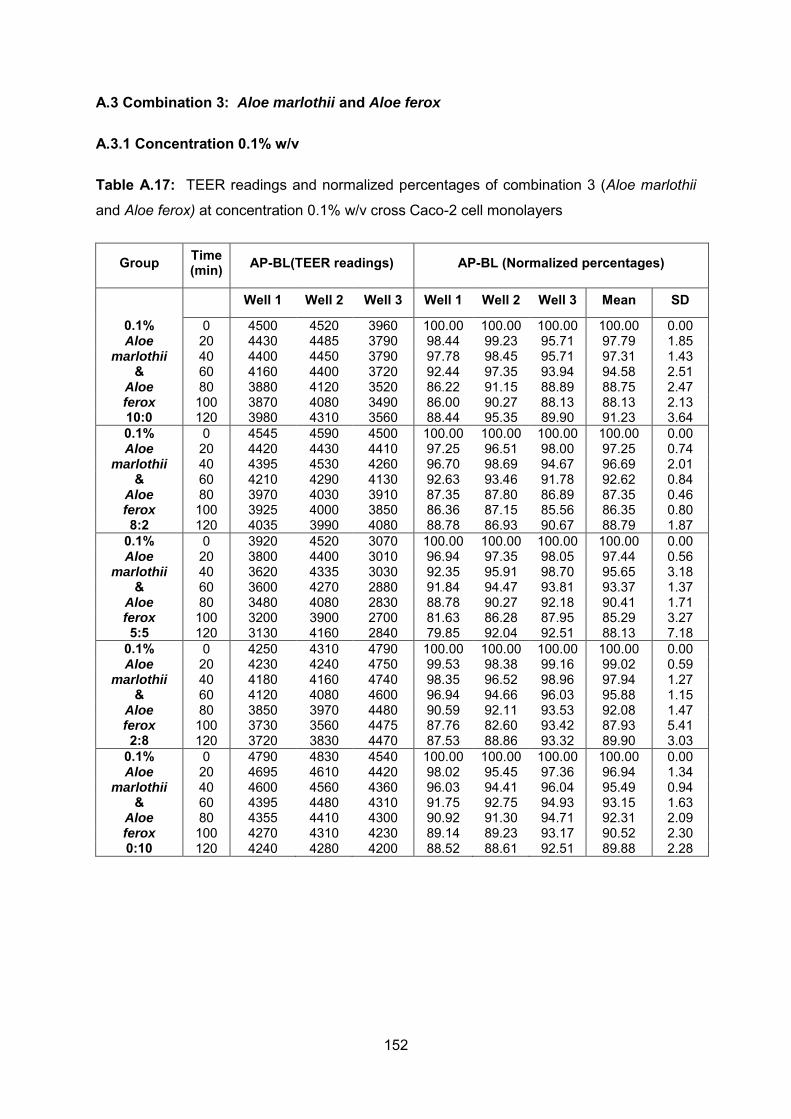
152
A.3 Combination 3: Aloe marlothii and Aloe ferox
A.3.1 Concentration 0.1% w/v
Table A.17: TEER readings and normalized percentages of combination 3 (Aloe marlothii
and Aloe ferox) at concentration 0.1% w/v cross Caco-2 cell monolayers
Group Time (min) AP-BL(TEER readings) AP-BL (Normalized percentages)
Well 1 Well 2 Well 3 Well 1 Well 2 Well 3 Mean SD
0.1% 0 4500 4520 3960 100.00 100.00 100.00 100.00 0.00 Aloe 20 4430 4485 3790 98.44 99.23 95.71 97.79 1.85
marlothii 40 4400 4450 3790 97.78 98.45 95.71 97.31 1.43 & 60 4160 4400 3720 92.44 97.35 93.94 94.58 2.51
Aloe 80 3880 4120 3520 86.22 91.15 88.89 88.75 2.47 ferox 100 3870 4080 3490 86.00 90.27 88.13 88.13 2.13 10:0 120 3980 4310 3560 88.44 95.35 89.90 91.23 3.64 0.1% 0 4545 4590 4500 100.00 100.00 100.00 100.00 0.00 Aloe 20 4420 4430 4410 97.25 96.51 98.00 97.25 0.74
marlothii 40 4395 4530 4260 96.70 98.69 94.67 96.69 2.01 & 60 4210 4290 4130 92.63 93.46 91.78 92.62 0.84
Aloe 80 3970 4030 3910 87.35 87.80 86.89 87.35 0.46 ferox 100 3925 4000 3850 86.36 87.15 85.56 86.35 0.80 8:2 120 4035 3990 4080 88.78 86.93 90.67 88.79 1.87
0.1% 0 3920 4520 3070 100.00 100.00 100.00 100.00 0.00 Aloe 20 3800 4400 3010 96.94 97.35 98.05 97.44 0.56
marlothii 40 3620 4335 3030 92.35 95.91 98.70 95.65 3.18 & 60 3600 4270 2880 91.84 94.47 93.81 93.37 1.37
Aloe 80 3480 4080 2830 88.78 90.27 92.18 90.41 1.71 ferox 100 3200 3900 2700 81.63 86.28 87.95 85.29 3.27 5:5 120 3130 4160 2840 79.85 92.04 92.51 88.13 7.18
0.1% 0 4250 4310 4790 100.00 100.00 100.00 100.00 0.00 Aloe 20 4230 4240 4750 99.53 98.38 99.16 99.02 0.59
marlothii 40 4180 4160 4740 98.35 96.52 98.96 97.94 1.27 & 60 4120 4080 4600 96.94 94.66 96.03 95.88 1.15
Aloe 80 3850 3970 4480 90.59 92.11 93.53 92.08 1.47 ferox 100 3730 3560 4475 87.76 82.60 93.42 87.93 5.41 2:8 120 3720 3830 4470 87.53 88.86 93.32 89.90 3.03
0.1% 0 4790 4830 4540 100.00 100.00 100.00 100.00 0.00 Aloe 20 4695 4610 4420 98.02 95.45 97.36 96.94 1.34
marlothii 40 4600 4560 4360 96.03 94.41 96.04 95.49 0.94 & 60 4395 4480 4310 91.75 92.75 94.93 93.15 1.63
Aloe 80 4355 4410 4300 90.92 91.30 94.71 92.31 2.09 ferox 100 4270 4310 4230 89.14 89.23 93.17 90.52 2.30 0:10 120 4240 4280 4200 88.52 88.61 92.51 89.88 2.28

153
Table A.18: Percentage reduced TEER of combination 3 (Aloe marlothii and Aloe ferox) at
concentration 0.1% w/v across Caco-2 cell monolayers
Group Time (min) AP-BL (Percentage reduced TEER)
Well 1 Well 2 Well 3 Mean SD
0.1% 0 0.00 0.00 0.00 0.00 0.00 Aloe 20 1.56 0.77 4.29 2.21 1.85
marlothii 40 2.22 1.55 4.29 2.69 1.43 & 60 7.56 2.65 6.06 5.42 2.51
Aloe 80 13.78 8.85 11.11 11.25 2.47 ferox 100 14.00 9.73 11.87 11.87 2.13 10:0 120 11.56 4.65 10.10 8.77 3.64 0.1% 0 0.00 0.00 0.00 0.00 0.00 Aloe 20 2.75 3.49 2.00 2.75 0.74
marlothii 40 3.30 1.31 5.33 3.31 2.01 & 60 7.37 6.54 8.22 7.38 0.84
Aloe 80 12.65 12.20 13.11 12.65 0.46 ferox 100 13.64 12.85 14.44 13.65 0.80 8:2 120 11.22 13.07 9.33 11.21 1.87
0.1% 0 0.00 0.00 0.00 0.00 0.00 Aloe 20 3.06 2.65 1.95 2.56 0.56
marlothii 40 7.65 4.09 1.30 4.35 3.18 & 60 8.16 5.53 6.19 6.63 1.37
Aloe 80 11.22 9.73 7.82 9.59 1.71 ferox 100 18.37 13.72 12.05 14.71 3.27 5:5 120 20.15 7.96 7.49 11.87 7.18
0.1% 0 0.00 0.00 0.00 0.00 0.00 Aloe 20 0.47 1.62 0.84 0.98 0.59
marlothii 40 1.65 3.48 1.04 2.06 1.27 & 60 3.06 5.34 3.97 4.12 1.15
Aloe 80 9.41 7.89 6.47 7.92 1.47 ferox 100 12.24 17.40 6.58 12.07 5.41 2:8 120 12.47 11.14 6.68 10.10 3.03
0.1% 0 0.00 0.00 0.00 0.00 0.00 Aloe 20 1.98 4.55 2.64 3.06 1.34
marlothii 40 3.97 5.59 3.96 4.51 0.94 & 60 8.25 7.25 5.07 6.85 1.63
Aloe 80 9.08 8.70 5.29 7.69 2.09 ferox 100 10.86 10.77 6.83 9.48 2.30 0:10 120 11.48 11.39 7.49 10.12 2.28
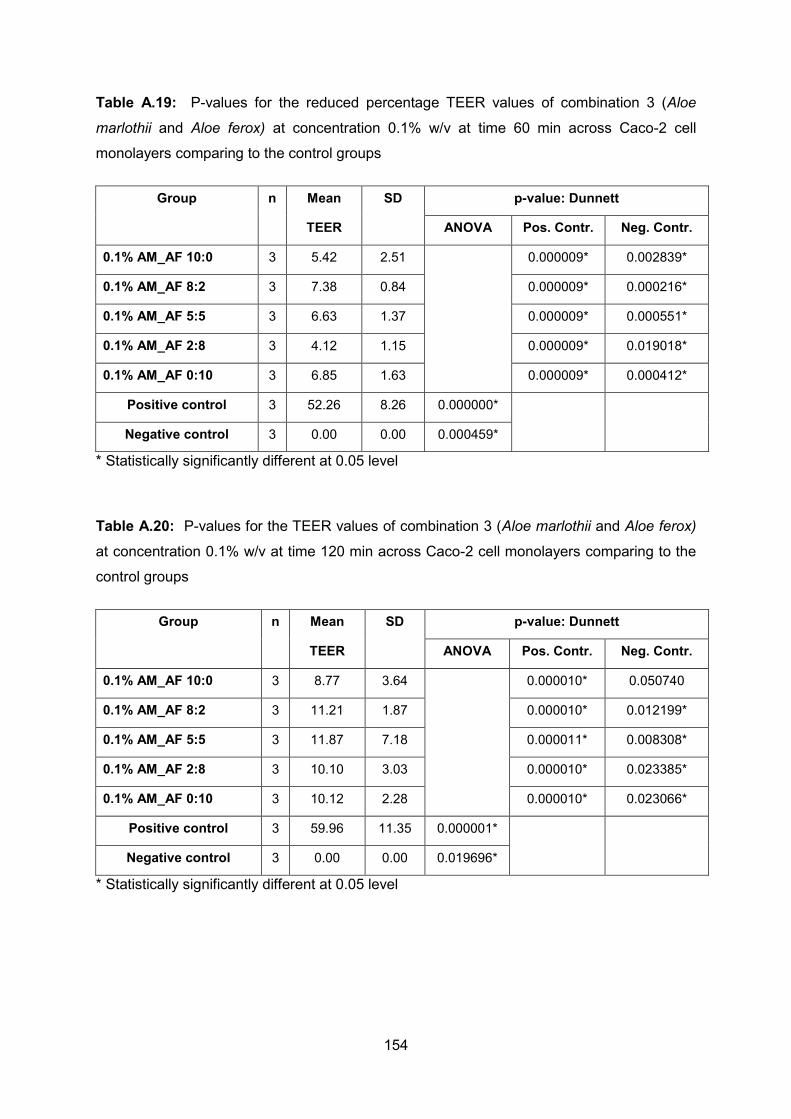
154
Table A.19: P-values for the reduced percentage TEER values of combination 3 (Aloe
marlothii and Aloe ferox) at concentration 0.1% w/v at time 60 min across Caco-2 cell
monolayers comparing to the control groups
Group n Mean SD p-value: Dunnett
TEER
ANOVA Pos. Contr. Neg. Contr.
0.1% AM_AF 10:0 3 5.42 2.51 0.000009* 0.002839*
0.1% AM_AF 8:2 3 7.38 0.84 0.000009* 0.000216*
0.1% AM_AF 5:5 3 6.63 1.37 0.000009* 0.000551*
0.1% AM_AF 2:8 3 4.12 1.15 0.000009* 0.019018*
0.1% AM_AF 0:10 3 6.85 1.63 0.000009* 0.000412*
Positive control 3 52.26 8.26 0.000000*
Negative control 3 0.00 0.00 0.000459*
* Statistically significantly different at 0.05 level
Table A.20: P-values for the TEER values of combination 3 (Aloe marlothii and Aloe ferox)
at concentration 0.1% w/v at time 120 min across Caco-2 cell monolayers comparing to the
control groups
Group n Mean SD p-value: Dunnett
TEER
ANOVA Pos. Contr. Neg. Contr.
0.1% AM_AF 10:0 3 8.77 3.64 0.000010* 0.050740
0.1% AM_AF 8:2 3 11.21 1.87 0.000010* 0.012199*
0.1% AM_AF 5:5 3 11.87 7.18 0.000011* 0.008308*
0.1% AM_AF 2:8 3 10.10 3.03 0.000010* 0.023385*
0.1% AM_AF 0:10 3 10.12 2.28 0.000010* 0.023066*
Positive control 3 59.96 11.35 0.000001*
Negative control 3 0.00 0.00 0.019696*
* Statistically significantly different at 0.05 level

155
A.3.2 Concentration 0.5% w/v
Table A.21: TEER readings and normalized percentages of combination 3 (Aloe marlothii
and Aloe ferox) at concentration 0.5% w/v across Caco-2 cell monolayers
Group Time (min) AP-BL(TEER readings) AP-BL (Normalized percentages)
Well 1 Well 2 Well 3 Well 1 Well 2 Well 3 Mean SD
0.5% 0 3750 4080 4390 100.00 100.00 100.00 100.00 0.00 Aloe 20 3230 3180 3960 86.13 77.94 90.21 84.76 6.25
marlothii 40 2930 2680 3380 78.13 65.69 76.99 73.60 6.88 & 60 2700 2960 2830 72.00 72.55 64.46 69.67 4.52
Aloe 80 2920 3150 3035 77.87 77.21 69.13 74.74 4.86 ferox 100 2850 3060 2955 76.00 75.00 67.31 72.77 4.75 10:0 120 2250 2280 2265 60.00 55.88 51.59 55.83 4.20 0.5% 0 4360 4450 4630 100.00 100.00 100.00 100.00 0.00 Aloe 20 2540 3540 4540 58.26 79.55 98.06 78.62 19.92
marlothii 40 3290 3910.5 4531 75.46 87.88 97.86 87.07 11.22 & 60 3510 4155 4509 80.50 93.37 97.39 90.42 8.82
Aloe 80 3770 4135 4500 86.47 92.92 97.19 92.19 5.40 ferox 100 3500 3850 4200 80.28 86.52 90.71 85.83 5.25 8:2 120 3510 3905 4300 80.50 87.75 92.87 87.04 6.21
0.5% 0 4860 4960 4960 100.00 100.00 100.00 100.00 0.00 Aloe 20 4640 4670 4720 95.47 94.15 95.16 94.93 0.69
marlothii 40 4520 4860 4930 93.00 97.98 99.40 96.79 3.36 & 60 3970 4210 4480 81.69 84.88 90.32 85.63 4.37
Aloe 80 3770 4600 4410 77.57 92.74 88.91 86.41 7.89 ferox 100 3460 4230 4398 71.19 85.28 88.67 81.72 9.27 5:5 120 3390 4250 4330 69.75 85.69 87.30 80.91 9.70
0.5% 0 4198 4730 4290 100.00 100.00 100.00 100.00 0.00 Aloe 20 4172 4700 3960 99.38 99.37 92.31 97.02 4.08
marlothii 40 4070 4675 4180 96.95 98.84 97.44 97.74 0.98 & 60 3730 4650 3980 88.85 98.31 92.77 93.31 4.75
Aloe 80 3550 4480 3910 84.56 94.71 91.14 90.14 5.15 ferox 100 3410 4340 3800 81.23 91.75 88.58 87.19 5.40 2:8 120 3580 4330 3890 85.28 91.54 90.68 89.17 3.39
0.5% 0 2940 3520 3230 100.00 100.00 100.00 100.00 0.00 Aloe 20 2830 3445 3138 96.26 97.87 97.15 97.09 0.81
marlothii 40 2720 3370 3045 92.52 95.74 94.27 94.18 1.61 & 60 2480 3010 2745 84.35 85.51 84.98 84.95 0.58
Aloe 80 2160 2780 2470 73.47 78.98 76.47 76.31 2.76 ferox 100 2030 2680 2355 69.05 76.14 72.91 72.70 3.55 0:10 120 1938 2720 2329 65.92 77.27 72.11 71.77 5.68

156
Table A.22: Percentage reduced TEER of combination 3 (Aloe marlothii and Aloe ferox) at
concentration 0.5% w/v across Caco-2 cell monolayers
Group Time (min) AP-BL (Percentage reduced TEER)
Well 1 Well 2 Well 3 Mean SD
0.5% 0 0.00 0.00 0.00 0.00 0.00 Aloe 20 13.87 22.06 9.79 15.24 6.25
marlothii 40 21.87 34.31 23.01 26.40 6.88 & 60 28.00 27.45 35.54 30.33 4.52
Aloe 80 22.13 22.79 30.87 25.26 4.86 ferox 100 24.00 25.00 32.69 27.23 4.75 10:0 120 40.00 44.12 48.41 44.17 4.20 0.5% 0 0.00 0.00 0.00 0.00 0.00 Aloe 20 41.74 20.45 1.94 21.38 19.92
marlothii 40 24.54 12.12 2.14 12.93 11.22 & 60 19.50 6.63 2.61 9.58 8.82
Aloe 80 13.53 7.08 2.81 7.81 5.40 ferox 100 19.72 13.48 9.29 14.17 5.25 8:2 120 19.50 12.25 7.13 12.96 6.21
0.5% 0 0.00 0.00 0.00 0.00 0.00 Aloe 20 4.53 5.85 4.84 5.07 0.69
marlothii 40 7.00 2.02 0.60 3.21 3.36 & 60 18.31 15.12 9.68 14.37 4.37
Aloe 80 22.43 7.26 11.09 13.59 7.89 ferox 100 28.81 14.72 11.33 18.28 9.27 5:5 120 30.25 14.31 12.70 19.09 9.70
0.5% 0 0.00 0.00 0.00 0.00 0.00 Aloe 20 0.62 0.63 7.69 2.98 4.08
marlothii 40 3.05 1.16 2.56 2.26 0.98 & 60 11.15 1.69 7.23 6.69 4.75
Aloe 80 15.44 5.29 8.86 9.86 5.15 ferox 100 18.77 8.25 11.42 12.81 5.40 2:8 120 14.72 8.46 9.32 10.83 3.39
0.5% 0 0.00 0.00 0.00 0.00 0.00 Aloe 20 3.74 2.13 2.85 2.91 0.81
marlothii 40 7.48 4.26 5.73 5.82 1.61 & 60 15.65 14.49 15.02 15.05 0.58
Aloe 80 26.53 21.02 23.53 23.69 2.76 ferox 100 30.95 23.86 27.09 27.30 3.55 0:10 120 34.08 22.73 27.89 28.23 5.68

157
Table A.23: P-values for the TEER values of combination 3 (Aloe marlothii and Aloe ferox)
at concentration 0.5% w/v at time 60 min across Caco-2 cell monolayers comparing to the
control groups
Group n Mean SD p-value: Dunnett
TEER
ANOVA Pos. Contr. Neg. Contr.
0.5% AM_AF 10:0 3 54.66 40.33 0.000016* 0.008241*
0.5% AM_AF 8:2 3 9.58 8.82 0.000009* 0.931757
0.5% AM_AF 5:5 3 6.12 4.64 0.000009* 0.988713
0.5% AM_AF 2:8 3 6.69 4.75 0.000009* 0.983436
0.5% AM_AF 0:10 3 15.10 0.58 0.000009* 0.724741
Positive control 3 71.77 7.82 0.000112*
Negative control 3 0.00 0.00 0.021645*
* Statistically significantly different at 0.05 level
Table A.24: P-values for the TEER values of combination 3 (Aloe marlothii and Aloe ferox)
at concentration 0.5% w/v at time 120 min across Caco-2 cell monolayers comparing to the
control groups
Group n Mean SD p-value: Dunnett
TEER
ANOVA Pos. Contr. Neg. Contr.
0.5% AM_AF 10:0 3 64.10 31.68 0.000322* 0.000531*
0.5% AM_AF 8:2 3 12.96 6.21 0.000009* 0.699698
0.5% AM_AF 5:5 3 11.25 11.04 0.000009* 0.792210
0.5% AM_AF 2:8 3 10.83 3.40 0.000009* 0.813207
0.5% AM_AF 0:10 3 28.23 5.68 0.000014* 0.111167
Positive control 3 75.17 5.15 0.001456*
Negative control 3 0.00 0.00 0.001684*
* Statistically significantly different at 0.05 level

158
A.4 Combination 4: Aloe vera and TMC
A.4.1 Concentration 0.1% w/v
Table A.25: TEER readings and normalized percentages of combination 4 (Aloe vera and
TMC) at concentration 0.1% w/v across Caco-2 cell monolayers
Group Time (min) AP-BL(TEER readings) AP-BL (Normalized percentages)
Well 1 Well 2 Well 3 Well 1 Well 2 Well 3 Mean SD
0.1% 0 2590 2420 1800 100.00 100.00 100.00 100.00 0.00 Aloe vera 20 1074 1160 987 41.47 47.93 54.83 48.08 6.68
& 40 1271 1379 1162 49.07 56.98 64.56 56.87 7.74 TMC 60 1358 1502 1213 52.43 62.07 67.39 60.63 7.58 10:0 80 1388 1538 1238 53.59 63.55 68.78 61.97 7.72
100 1463 1619 1306 56.49 66.90 72.56 65.31 8.15 120 1406 1535 1277 54.29 63.43 70.94 62.89 8.34
0.1% 0 4100 4175 4250 100.00 100.00 100.00 100.00 0.00 Aloe vera 20 3550 3460 3505 86.59 82.87 82.47 83.98 2.27
& 40 3520 3320 2490 85.85 79.52 58.59 74.65 14.27 TMC 60 2840 2960 2130 69.27 70.90 50.12 63.43 11.56 8:2 80 2430 2630 1900 59.27 62.99 44.71 55.66 9.66
100 1570 2400 1680 38.29 57.49 39.53 45.10 10.74 120 1441 2360 1690 35.15 56.53 39.76 43.81 11.25
0.1% 0 3960 4160 3960 100.00 100.00 100.00 100.00 0.00 Aloe vera 20 3410 3740 3530 86.11 89.90 89.14 88.39 2.01
& 40 3540 3960 3770 89.39 95.19 95.20 93.26 3.35 TMC 60 3465 3750 3600 87.50 90.14 90.91 89.52 1.79 5:5 80 3390 3500 3430 85.61 84.13 86.62 85.45 1.25
100 3340 3460 3320 84.34 83.17 83.84 83.78 0.59 120 3330 3380 3280 84.09 81.25 82.83 82.72 1.42
0.1% 0 4120 3880 4450 100.00 100.00 100.00 100.00 0.00 Aloe vera 20 3850 3550 4070 93.45 91.49 91.46 92.13 1.14
& 40 4120 3810 4330 100.00 98.20 97.30 98.50 1.37 TMC 60 3470 3550 3990 84.22 91.49 89.66 88.46 3.78 2:8 80 3240 3410 3820 78.64 87.89 85.84 84.12 4.86
100 3910 3300 3640 94.90 85.05 81.80 87.25 6.82 120 2740 3180 3600 66.50 81.96 80.90 76.45 8.63
0.1% 0 4180 3440 4020 100.00 100.00 100.00 100.00 0.00 Aloe vera 20 3700 2570 3360 88.52 74.71 83.58 82.27 7.00
& 40 2300 2200 2730 55.02 63.95 67.91 62.30 6.60 TMC 60 1600 1770 2150 38.28 51.45 53.48 47.74 8.26 0:10 80 1490 1820 2070 35.65 52.91 51.49 46.68 9.58
100 1198 1652 1880 28.66 48.02 46.77 41.15 10.83 120 1131 1653 1810 27.06 48.05 45.02 40.04 11.35

159
Table A.26: Percentage reduced TEER of combination 4 (Aloe vera and TMC) at
concentration 0.1% w/v across Caco-2 cell monolayers
Group Time (min) AP-BL (Percentage reduced TEER)
Well 1 Well 2 Well 3 Mean SD
0.1% 0 0.00 0.00 0.00 0.00 0.00 Aloe vera 20 58.53 52.07 45.17 51.92 6.68
& 40 50.93 43.02 35.44 43.13 7.74 TMC 60 47.57 37.93 32.61 39.37 7.58 10:0 80 46.41 36.45 31.22 38.03 7.72
100 43.51 33.10 27.44 34.69 8.15 120 45.71 36.57 29.06 37.11 8.34
0.1% 0 0.00 0.00 0.00 0.00 0.00 Aloe vera 20 13.41 17.13 17.53 16.02 2.27
& 40 14.15 20.48 41.41 25.35 14.27 TMC 60 30.73 29.10 49.88 36.57 11.56 8:2 80 40.73 37.01 55.29 44.34 9.66
100 61.71 42.51 60.47 54.90 10.74 120 64.85 43.47 60.24 56.19 11.25
0.1% 0 0.00 0.00 0.00 0.00 0.00 Aloe vera 20 13.89 10.10 10.86 11.61 2.01
& 40 10.61 4.81 4.80 6.74 3.35 TMC 60 12.50 9.86 9.09 10.48 1.79 5:5 80 14.39 15.87 13.38 14.55 1.25
100 15.66 16.83 16.16 16.22 0.59 120 15.91 18.75 17.17 17.28 1.42
0.1% 0 0.00 0.00 0.00 0.00 0.00 Aloe vera 20 6.55 8.51 8.54 7.87 1.14
& 40 0.00 1.80 2.70 1.50 1.37 TMC 60 15.78 8.51 10.34 11.54 3.78 2:8 80 21.36 12.11 14.16 15.88 4.86
100 5.10 14.95 18.20 12.75 6.82 120 33.50 18.04 19.10 23.55 8.63
0.1% 0 0.00 0.00 0.00 0.00 0.00 Aloe vera 20 11.48 25.29 16.42 17.73 7.00
& 40 44.98 36.05 32.09 37.70 6.60 TMC 60 61.72 48.55 46.52 52.26 8.26 0:10 80 64.35 47.09 48.51 53.32 9.58
100 71.34 51.98 53.23 58.85 10.83 120 72.94 51.95 54.98 59.96 11.35
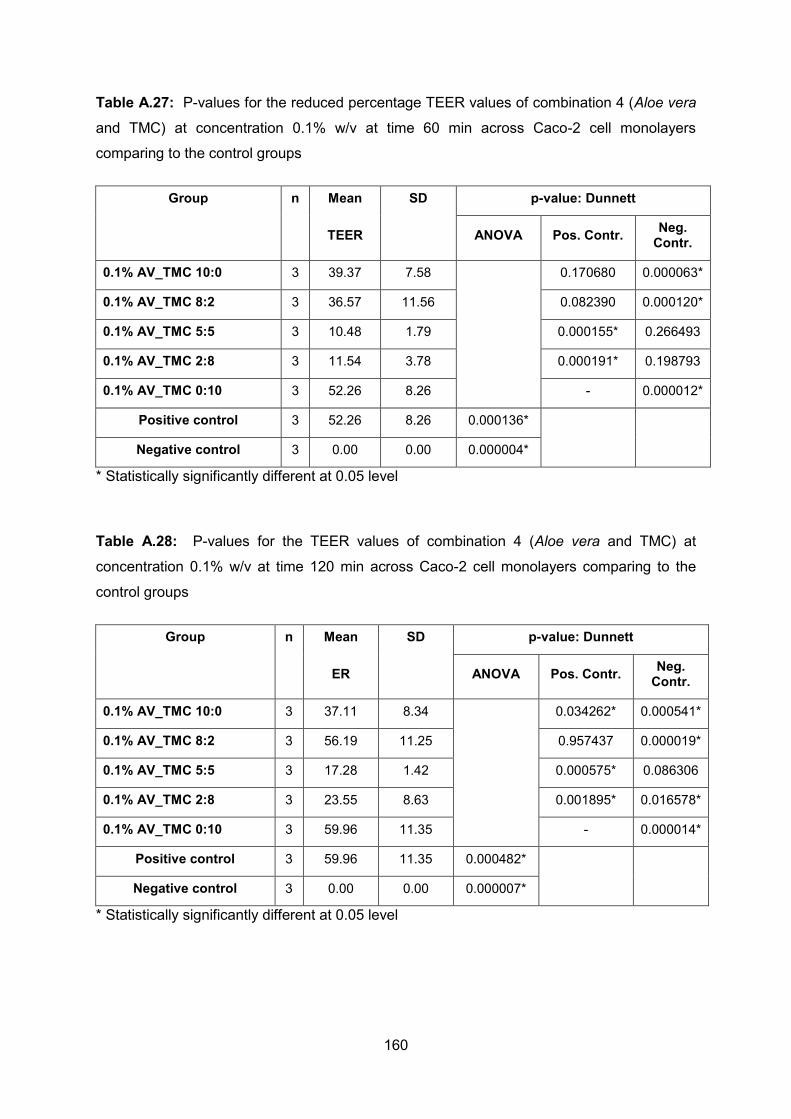
160
Table A.27: P-values for the reduced percentage TEER values of combination 4 (Aloe vera
and TMC) at concentration 0.1% w/v at time 60 min across Caco-2 cell monolayers
comparing to the control groups
Group n Mean SD p-value: Dunnett
TEER
ANOVA Pos. Contr. Neg.
Contr.
0.1% AV_TMC 10:0 3 39.37 7.58 0.170680 0.000063*
0.1% AV_TMC 8:2 3 36.57 11.56 0.082390 0.000120*
0.1% AV_TMC 5:5 3 10.48 1.79 0.000155* 0.266493
0.1% AV_TMC 2:8 3 11.54 3.78 0.000191* 0.198793
0.1% AV_TMC 0:10 3 52.26 8.26 - 0.000012*
Positive control 3 52.26 8.26 0.000136*
Negative control 3 0.00 0.00 0.000004*
* Statistically significantly different at 0.05 level
Table A.28: P-values for the TEER values of combination 4 (Aloe vera and TMC) at
concentration 0.1% w/v at time 120 min across Caco-2 cell monolayers comparing to the
control groups
Group n Mean SD p-value: Dunnett
ER
ANOVA Pos. Contr. Neg.
Contr.
0.1% AV_TMC 10:0 3 37.11 8.34 0.034262* 0.000541*
0.1% AV_TMC 8:2 3 56.19 11.25 0.957437 0.000019*
0.1% AV_TMC 5:5 3 17.28 1.42 0.000575* 0.086306
0.1% AV_TMC 2:8 3 23.55 8.63 0.001895* 0.016578*
0.1% AV_TMC 0:10 3 59.96 11.35 - 0.000014*
Positive control 3 59.96 11.35 0.000482*
Negative control 3 0.00 0.00 0.000007*
* Statistically significantly different at 0.05 level

161
A.4.2 Concentration 0.5% w/v
Table A.29: TEER readings and normalized percentages of combination 4 (Aloe vera and
TMC) at concentration 0.5% w/v across Caco-2 cell monolayers
Group Time (min) AP-BL(TEER readings) AP-BL (Normalized percentages)
Well 1 Well 2 Well 3 Well 1 Well 2 Well 3 Mean SD
0.5% 0 4285 4280 4290 100.00 100.00 100.00 100.00 0.00 Aloe vera 20 3825 3710 3940 89.26 86.68 91.84 89.26 2.58
& 40 4175 4210 4140 97.43 98.36 96.50 97.43 0.93 TMC 60 3870 3910 3830 90.32 91.36 89.28 90.32 1.04 10:0 80 3815 3790 3840 89.03 88.55 89.51 89.03 0.48
100 3605 3680 3530 84.13 85.98 82.28 84.13 1.85 120 3645 3710 3580 85.06 86.68 83.45 85.07 1.62
0.5% 0 3800 3810 3120 100.00 100.00 100.00 100.00 0.00 Aloe vera 20 2260 2400 1690 59.47 62.99 54.17 58.88 4.44
& 40 1116 1637 1176 29.37 42.97 37.69 36.68 6.86 TMC 60 750 1526 1033 19.74 40.05 33.11 30.97 10.33 8:2 80 600 1298 924 15.79 34.07 29.62 26.49 9.53
100 530 1256 911 13.95 32.97 29.20 25.37 10.07 120 514 1615 1087 13.53 42.39 34.84 30.25 14.97
0.5% 0 3900 3800 3880 100.00 100.00 100.00 100.00 0.00 Aloe vera 20 1600 1300 1400 41.03 34.21 36.08 37.11 3.52
& 40 1161 942 1116 29.77 24.79 28.76 27.77 2.63 TMC 60 814 791 1028 20.87 20.82 26.49 22.73 3.26 5:5 80 618 735 925 15.85 19.34 23.84 19.68 4.01
100 540 730 940 13.85 19.21 24.23 19.09 5.19 120 578 707 1147 14.82 18.61 29.56 21.00 7.66
0.5% 0 4220 3750 3660 100.00 100.00 100.00 100.00 0.00 Aloe vera 20 1700 1180 1080 40.28 31.47 29.51 33.75 5.74
& 40 351 917 856 8.32 24.45 23.39 18.72 9.02 TMC 60 252 508 726 5.97 13.55 19.84 13.12 6.94 2:8 80 184 345 591 4.36 9.20 16.15 9.90 5.92
100 145 298 528 3.44 7.95 14.43 8.60 5.52 120 126 306 558 2.99 8.16 15.25 8.80 6.15
0.5% 0 3560 3930 4100 100.00 100.00 100.00 100.00 0.00 Aloe vera 20 1530 1520 1560 42.98 38.68 38.05 39.90 2.68
& 40 1075 885 1464 30.20 22.52 35.71 29.47 6.62 TMC 60 975 820 1494 27.39 20.87 36.44 28.23 7.82 0:10 80 843 851 1338 23.68 21.65 32.63 25.99 5.84
100 818 806 1337 22.98 20.51 32.61 25.37 6.39 120 834 807 1252 23.43 20.53 30.54 24.83 5.15

162
Table A.30: Percentage reduced TEER of combination 4 (Aloe vera and TMC) at
concentration 0.5% w/v across Caco-2 cell monolayers
Group Time (min) AP-BL (Percentage reduced TEER)
Well 1 Well 2 Well 3 Mean SD
0.5% 0 0.00 0.00 0.00 0.00 0.00 Aloe vera 20 10.74 13.32 8.16 10.74 2.58
& 40 2.57 1.64 3.50 2.57 0.93 TMC 60 9.68 8.64 10.72 9.68 1.04 10:0 80 10.97 11.45 10.49 10.97 0.48
100 15.87 14.02 17.72 15.87 1.85 120 14.94 13.32 16.55 14.93 1.62
0.5% 0 0.00 0.00 0.00 0.00 0.00 Aloe vera 20 40.53 37.01 45.83 41.12 4.44
& 40 70.63 57.03 62.31 63.32 6.86 TMC 60 80.26 59.95 66.89 69.03 10.33 8:2 80 84.21 65.93 70.38 73.51 9.53
100 86.05 67.03 70.80 74.63 10.07 120 86.47 57.61 65.16 69.75 14.97
0.5% 0 0.00 0.00 0.00 0.00 0.00 Aloe vera 20 58.97 65.79 63.92 62.89 3.52
& 40 70.23 75.21 71.24 72.23 2.63 TMC 60 79.13 79.18 73.51 77.27 3.26 5:5 80 84.15 80.66 76.16 80.32 4.01
100 86.15 80.79 75.77 80.91 5.19 120 85.18 81.39 70.44 79.00 7.66
0.5% 0 0.00 0.00 0.00 0.00 0.00 Aloe vera 20 59.72 68.53 70.49 66.25 5.74
& 40 91.68 75.55 76.61 81.28 9.02 TMC 60 94.03 86.45 80.16 86.88 6.94 2:8 80 95.64 90.80 83.85 90.10 5.92
100 96.56 92.05 85.57 91.40 5.52 120 97.01 91.84 84.75 91.20 6.15
0.5% 0 0.00 0.00 0.00 0.00 0.00 Aloe vera 20 57.02 61.32 61.95 60.10 2.68
& 40 69.80 77.48 64.29 70.53 6.62 TMC 60 72.61 79.13 63.56 71.77 7.82 0:10 80 76.32 78.35 67.37 74.01 5.84
100 77.02 79.49 67.39 74.63 6.39 120 76.57 79.47 69.46 75.17 5.15

163
Table A.31: P-values for the TEER values of combination 4 (Aloe vera and TMC) at
concentration 0.5% w/v at time 60 min across Caco-2 cell monolayers comparing to the
control groups
Group n Mean SD p-value: Dunnett
TEER
ANOVA Pos. Contr. Neg. Contr.
0.5% AV_TMC 10:0 3 9.68 7.10 0.000007* 0.252957
0.5% AV_TMC 8:2 3 69.03 10.33 0.962355 0.000009*
0.5% AV_TMC 5:5 3 77.27 3.26 0.719548 0.000009*
0.5% AV_TMC 2:8 3 86.88 6.94 0.063632 0.000009*
0.5% AV_TMC 0:10 3 71.77 7.82 - 0.000009*
Positive control 3 71.77 7.82 0.000001*
Negative control 3 0.00 0.00 0.00
* Statistically significantly different at 0.05 level
Table A.32: P-values for the TEER values of combination 4 (Aloe vera and TMC) at
concentration 0.5% w/v at time 120 min across Caco-2 cell monolayers comparing to the
control groups
Group n Mean SD p-value: Dunnett
TEER
ANOVA Pos. Contr. Neg. Contr.
0.5% AV_TMC 10:0 3 14.93 10.92 0.000023* 0.119146
0.5% AV_TMC 8:2 3 69.75 14.97 0.841366 0.000009*
0.5% AV_TMC 5:5 3 79.00 7.66 0.943310 0.000009*
0.5% AV_TMC 2:8 3 91.20 6.15 0.119948 0.000009*
0.5% AV_TMC 0:10 3 75.17 5.15 - 0.000009*
Positive control 3 75.17 5.15 0.000005*
Negative control 3 0.00 0.00 0.00
* Statistically significantly different at 0.05 level

164
A.5 Combination 5: Aloe ferox and TMC
A.5.1 Concentration 0.1% w/v
Table A.33: TEER readings and normalized percentages of combination 5 (Aloe ferox and
TMC) at concentration 0.1% w/v across Caco-2 cell monolayers
Group Time (min) AP-BL(TEER readings) AP-BL (Normalized percentages)
Well 1 Well 2 Well 3 Well 1 Well 2 Well 3 Mean SD
0.1% 0 4790 4830 4540 100.00 100.00 100.00 100.00 0.00 Aloe ferox 20 4695 4610 4420 98.02 95.45 97.36 96.94 1.34
& 40 4600 4560 4360 96.03 94.41 96.04 95.49 0.94 TMC 60 4395 4480 4310 91.75 92.75 94.93 93.15 1.63 10:0 80 4355 4410 4300 90.92 91.30 94.71 92.31 2.09
100 4270 4310 4230 89.14 89.23 93.17 90.52 2.30 120 4240 4280 4200 88.52 88.61 92.51 89.88 2.28
0.1% 0 4000 3360 4430 100.00 100.00 100.00 100.00 0.00 Aloe ferox 20 3590 2910 4270 89.75 86.61 96.39 90.92 4.99
& 40 3582.5 2935 4230 89.56 87.35 95.49 90.80 4.21 TMC 60 3580 2960 4200 89.50 88.10 94.81 90.80 3.54 8:2 80 3760 3190 4330 94.00 94.94 97.74 95.56 1.95
100 3435 2900 3970 85.88 86.31 89.62 87.27 2.05 120 3400 2920 3880 85.00 86.90 87.58 86.50 1.34
0.1% 0 4190 4350 4190 100.00 100.00 100.00 100.00 0.00 Aloe ferox 20 4130 3995 4160 98.57 91.84 99.28 96.56 4.11
& 40 3570 3640 3500 85.20 83.68 83.53 84.14 0.93 TMC 60 3315 3350 3280 79.12 77.01 78.28 78.14 1.06 5:5 80 3290 3320 3260 78.52 76.32 77.80 77.55 1.12
100 3010 3070 2950 71.84 70.57 70.41 70.94 0.78 120 2905 2970 2840 69.33 68.28 67.78 68.46 0.79
0.1% 0 4400 4580 4030 100.00 100.00 100.00 100.00 0.00 Aloe ferox 20 4268 4455 3985 97.00 97.27 98.88 97.72 1.02
& 40 4135 4330 3940 93.98 94.54 97.77 95.43 2.04 TMC 60 4010 4190 3830 91.14 91.48 95.04 92.55 2.16 2:8 80 4185 4440 3930 95.11 96.94 97.52 96.53 1.26
100 3860 4130 3590 87.73 90.17 89.08 88.99 1.23 120 3820 4100 3540 86.82 89.52 87.84 88.06 1.36
0.1% 0 4180 3440 4020 100.00 100.00 100.00 100.00 0.00 Aloe ferox 20 3700 2570 3360 88.52 74.71 83.58 82.27 7.00
& 40 2300 2200 2730 55.02 63.95 67.91 62.30 6.60 TMC 60 1600 1770 2150 38.28 51.45 53.48 47.74 8.26 0:10 80 1490 1820 2070 35.65 52.91 51.49 46.68 9.58
100 1198 1652 1880 28.66 48.02 46.77 41.15 10.83 120 1131 1653 1810 27.06 48.05 45.02 40.04 11.35

165
Table A.34: Percentage reduced TEER of combination 5 (Aloe ferox and TMC) at
concentration 0.1% w/v across Caco-2 cell monolayers
Group Time (min) AP-BL (Percentage reduced TEER)
Well 1 Well 2 Well 3 Mean SD
0.1% 0 0.00 0.00 0.00 0.00 0.00 Aloe ferox 20 1.98 4.55 2.64 3.06 1.34
& 40 3.97 5.59 3.96 4.51 0.94 TMC 60 8.25 7.25 5.07 6.85 1.63 10:0 80 9.08 8.70 5.29 7.69 2.09
100 10.86 10.77 6.83 9.48 2.30 120 11.48 11.39 7.49 10.12 2.28
0.1% 0 0.00 0.00 0.00 0.00 0.00 Aloe ferox 20 10.25 13.39 3.61 9.08 4.99
& 40 10.44 12.65 4.51 9.20 4.21 TMC 60 10.50 11.90 5.19 9.20 3.54 8:2 80 6.00 5.06 2.26 4.44 1.95
100 14.13 13.69 10.38 12.73 2.05 120 15.00 13.10 12.42 13.50 1.34
0.1% 0 0.00 0.00 0.00 0.00 0.00 Aloe ferox 20 1.43 8.16 0.72 3.44 4.11
& 40 14.80 16.32 16.47 15.86 0.93 TMC 60 20.88 22.99 21.72 21.86 1.06 5:5 80 21.48 23.68 22.20 22.45 1.12
100 28.16 29.43 29.59 29.06 0.78 120 30.67 31.72 32.22 31.54 0.79
0.1% 0 0.00 0.00 0.00 0.00 0.00 Aloe ferox 20 3.00 2.73 1.12 2.28 1.02
& 40 6.02 5.46 2.23 4.57 2.04 TMC 60 8.86 8.52 4.96 7.45 2.16 2:8 80 4.89 3.06 2.48 3.47 1.26
100 12.27 9.83 10.92 11.01 1.23 120 13.18 10.48 12.16 11.94 1.36
0.1% 0 0.00 0.00 0.00 0.00 0.00 Aloe ferox 20 11.48 25.29 16.42 17.73 7.00
& 40 44.98 36.05 32.09 37.70 6.60 TMC 60 61.72 48.55 46.52 52.26 8.26 0:10 80 64.35 47.09 48.51 53.32 9.58
100 71.34 51.98 53.23 58.85 10.83 120 72.94 51.95 54.98 59.96 11.35

166
Table A.35: P-values for the reduced percentage TEER values of combination 5 (Aloe ferox
and TMC) at concentration 0.1% w/v at time 60 min across Caco-2 cell monolayers
comparing to the control groups
Group n Mean SD p-value: Dunnett
TEER
ANOVA Pos. Contr. Neg. Contr.
0.1% AF_TMC 10:0 3 6.85 1.63 0.000006* 0.170479
0.1% AF_TMC 8:2 3 9.20 3.54 0.000006* 0.048107*
0.1% AF_TMC 5:5 3 21.86 1.06 0.000023* 0.000076*
0.1% AF_TMC 2:8 3 7.45 2.16 0.000006* 0.125134
0.1% AF_TMC 0:10 3 52.26 8.26 - 0.000009*
Positive control 3 52.26 8.26 0.000000*
Negative control 3 0.00 0.00 0.000000*
* Statistically significantly different at 0.05 level
Table A.36: P-values for the TEER values of combination 5 (Aloe ferox and TMC) at
concentration 0.1% w/v at time 120 min across Caco-2 cell monolayers comparing to the
control groups
Group n Mean SD p-value: Dunnett
TEER
ANOVA Pos. Contr. Neg. Contr.
0.1% AF_TMC 10:0 3 10.12 2.28 0.000007* 0.07033
0.1% AF_TMC 8:2 3 13.50 1.34 0.000008* 0.019110*
0.1% AF_TMC 5:5 3 31.54 0.80 0.000212* 0.00024*
0.1% AF_TMC 2:8 3 11.94 1.36 0.000007* 0.038743*
0.1% AF_TMC 0:10 3 59.96 11.35 - 0.000009*
Positive control 3 59.96 11.35 0.000002*
Negative control 3 0.00 0.00 0.000000*
* Statistically significantly different at 0.05 level

167
A.3.2 Concentration 0.5% w/v
Table A.37: TEER readings and normalized percentages of combination 5 (Aloe ferox and
TMC) at concentration 0.5% w/v across Caco-2 cell monolayers
Group Time (min) AP-BL(TEER readings) AP-BL (Normalized percentages)
Well 1 Well 2 Well 3 Well 1 Well 2 Well 3 Mean SD
0.5% 0 2940 3520 3230 100.00 100.00 100.00 100.00 0.00 Aloe ferox 20 2830 3445 3138 96.26 97.87 97.15 97.09 0.81
& 40 2720 3370 3045 92.52 95.74 94.27 94.18 1.61 TMC 60 2480 3010 2745 84.35 85.51 84.98 84.95 0.58 10:0 80 2160 2780 2470 73.47 78.98 76.47 76.31 2.76
100 2030 2680 2355 69.05 76.14 72.91 72.70 3.55 120 1938 2720 2329 65.92 77.27 72.11 71.77 5.68
0.5% 0 4520 4425 4345 100.00 100.00 100.00 100.00 0.00 Aloe ferox 20 4780 4750 4650 105.75 107.34 107.02 106.71 0.84
& 40 4100 4480 4230 90.71 101.24 97.35 96.43 5.33 TMC 60 4155 4310 4000 91.92 97.40 92.06 93.80 3.12 8:2 80 4260 4430 4090 94.25 100.11 94.13 96.16 3.42
100 4175 4400 3950 92.37 99.44 90.91 94.24 4.56 120 4215 4400 4030 93.25 99.44 92.75 95.15 3.72
0.5% 0 3930 3340 4140 100.00 100.00 100.00 100.00 0.00 Aloe ferox 20 4070 3300 3860 103.56 98.80 93.24 98.53 5.17
& 40 2960 2780 3560 75.32 83.23 85.99 81.51 5.54 TMC 60 2630 2190 2940 66.92 65.57 71.01 67.83 2.84 5:5 80 2490 2170 2720 63.36 64.97 65.70 64.68 1.20
100 2220 2020 2420 56.49 60.48 58.45 58.47 2.00 120 2150 2030 2350 54.71 60.78 56.76 57.42 3.09
0.5% 0 4250 4060 4860 100.00 100.00 100.00 100.00 0.00 Aloe ferox 20 1160 1210 1220 27.29 29.80 25.10 27.40 2.35
& 40 520 890 1030 12.24 21.92 21.19 18.45 5.39 TMC 60 423 640 701 9.95 15.76 14.42 13.38 3.04 2:8 80 330 318 595 7.76 7.83 12.24 9.28 2.57
100 280 565 623 6.59 13.92 12.82 11.11 3.95 120 280 558 626 6.59 13.74 12.88 11.07 3.91
0.5% 0 3560 3930 4100 100.00 100.00 100.00 100.00 0.00 Aloe ferox 20 1530 1520 1560 42.98 38.68 38.05 39.90 2.68
& 40 1075 885 1464 30.20 22.52 35.71 29.47 6.62 TMC 60 975 820 1494 27.39 20.87 36.44 28.23 7.82 0:10 80 843 851 1338 23.68 21.65 32.63 25.99 5.84
100 818 806 1337 22.98 20.51 32.61 25.37 6.39 120 834 807 1252 23.43 20.53 30.54 24.83 5.15

168
Table A.38: Percentage reduced TEER of combination 5 (Aloe ferox and TMC) at
concentration 0.5% w/v across Caco-2 cell monolayers
Group Time (min) AP-BL (Percentage reduced TEER)
Well 1 Well 2 Well 3 Mean SD
0.5% 0 0.00 0.00 0.00 0.00 0.00 Aloe ferox 20 3.74 2.13 2.85 2.91 0.81
& 40 7.48 4.26 5.73 5.82 1.61 TMC 60 15.65 14.49 15.02 15.05 0.58 10:0 80 26.53 21.02 23.53 23.69 2.76
100 30.95 23.86 27.09 27.30 3.55 120 34.08 22.73 27.89 28.23 5.68
0.5% 0 0.00 0.00 0.00 0.00 0.00 Aloe ferox 20 0.95 3.85 0.21 1.67 1.92
& 40 1.35 0.97 0.47 0.93 0.44 TMC 60 1.54 4.73 5.88 4.05 2.25 8:2 80 0.47 2.08 3.76 2.11 1.65
100 0.24 2.74 7.06 3.35 3.45 120 0.12 2.74 5.18 2.68 2.53
0.5% 0 0.00 0.00 0.00 0.00 0.00 Aloe ferox 20 6.97 1.20 6.76 4.98 3.28
& 40 24.68 16.77 14.01 18.49 5.54 TMC 60 33.08 34.43 28.99 32.17 2.84 5:5 80 36.64 35.03 34.30 35.32 1.20
100 43.51 39.52 41.55 41.53 2.00 120 45.29 39.22 43.24 42.58 3.09
0.5% 0 0.00 0.00 0.00 0.00 0.00 Aloe ferox 20 72.71 70.20 74.90 72.60 2.35
& 40 87.76 78.08 78.81 81.55 5.39 TMC 60 90.05 84.24 85.58 86.62 3.04 2:8 80 92.24 92.17 87.76 90.72 2.57
100 93.41 86.08 87.18 88.89 3.95 120 93.41 86.26 87.12 88.93 3.91
0.5% 0 0.00 0.00 0.00 0.00 0.00 Aloe ferox 20 57.02 61.32 61.95 60.10 2.68
& 40 69.80 77.48 64.29 70.53 6.62 TMC 60 72.61 79.13 63.56 71.77 7.82 0:10 80 76.32 78.35 67.37 74.01 5.84
100 77.02 79.49 67.39 74.63 6.39 120 76.57 79.47 69.46 75.17 5.15

169
Table A.39: P-values for the TEER values of combination 5 (Aloe ferox and TMC) at
concentration 0.5% w/v at time 60 min across Caco-2 cell monolayers comparing to the
control groups
Group n Mean SD p-value: Dunnett
TEER
ANOVA Pos. Contr. Neg. Contr.
0.5% AF_TMC 10:0 3 15.05 0.58 0.000005* 0.001836*
0.5% AF_TMC 8:2 3 6.20 3.12 0.000005* 0.233429
0.5% AF_TMC 5:5 3 32.17 2.84 0.000007* 0.000010*
0.5% AF_TMC 2:8 3 86.62 3.04 0.005043* 0.000009*
0.5% AF_TMC 0:10 3 71.77 7.82 - 0.000009*
Positive control 3 71.77 7.82 0.00
Negative control 3 0.00 0.00 0.00
* Statistically significantly different at 0.05 level
Table A.40: P-values for the TEER values of combination 5 (Aloe ferox and TMC) at
concentration 0.5% w/v at time 120 min across Caco-2 cell monolayers comparing to the
control groups
Group n Mean SD p-value: Dunnett
TEER
ANOVA Pos. Contr. Neg. Contr.
0.5% AF_TMC 10:0 3 28.23 5.68 0.000006* 0.000017*
0.5% AF_TMC 8:2 3 4.85 3.72 0.000005* 0.473148
0.5% AF_TMC 5:5 3 42.58 3.09 0.000019* 0.000009*
0.5% AF_TMC 2:8 3 88.92 3.91 0.011114* 0.000009*
0.5% AF_TMC 0:10 3 75.17 5.15 - 0.000009*
Positive control 3 75.17 5.15 0.00
Negative control 3 0.00 0.00 0.00
* Statistically significantly different at 0.05 level

170
A.6 Combination 6: Aloe marlothii and TMC
A.6.1 Concentration 0.1% w/v
Table A.41: TEER readings and normalized percentages of combination 6 (Aloe marlothii
and TMC) at concentration 0.1% w/v across Caco-2 cell monolayers
Group Time (min) AP-BL(TEER readings) AP-BL (Normalized percentages)
Well 1 Well 2 Well 3 Well 1 Well 2 Well 3 Mean SD
0.1% 0 4500 4520 3960 100.00 100.00 100.00 100.00 0.00 Aloe 20 4430 4485 3790 98.44 99.23 95.71 97.79 1.85
marlothii 40 4400 4450 3790 97.78 98.45 95.71 97.31 1.43 & 60 4160 4400 3720 92.44 97.35 93.94 94.58 2.51
TMC 80 3880 4120 3520 86.22 91.15 88.89 88.75 2.47 10:0 100 3870 4080 3490 86.00 90.27 88.13 88.13 2.13
120 3980 4310 3560 88.44 95.35 89.90 91.23 3.64 0.1% 0 2890 3870 4210 100.00 100.00 100.00 100.00 0.00 Aloe 20 2760 3610 4060 95.50 93.28 96.44 95.07 1.62
marlothii 40 2250 3400 3760 77.85 87.86 89.31 85.01 6.24 & 60 2230 3300 3280 77.16 85.27 77.91 80.11 4.48
TMC 80 2260 3250 3320 78.20 83.98 78.86 80.35 3.16 8:2 100 2100 3150 3300 72.66 81.40 78.38 77.48 4.44
120 2070 3120 3350 71.63 80.62 79.57 77.27 4.92 0.1% 0 4190 4170 3640 100.00 100.00 100.00 100.00 0.00 Aloe 20 3600 3400 3100 85.92 81.53 85.16 84.21 2.34
marlothii 40 3050 3110 3170 72.79 74.58 87.09 78.15 7.79 & 60 2750 2755 2760 65.63 66.07 75.82 69.17 5.76
TMC 80 3010 2975 2940 71.84 71.34 80.77 74.65 5.31 5:5 100 2800 2865 2930 66.83 68.71 80.49 72.01 7.41
120 2750 2455 2160 65.63 58.87 59.34 61.28 3.77 0.1% 0 4380 4020 4090 100.00 100.00 100.00 100.00 0.00 Aloe 20 3500 3360 3630 79.91 83.58 88.75 84.08 4.44
marlothii 40 3460 3360 3560 79.00 83.58 87.04 83.21 4.04 & 60 3445 3290 3600 78.65 81.84 88.02 82.84 4.76
TMC 80 3515 3550 3480 80.25 88.31 85.09 84.55 4.06 2:8 100 3415 3490 3340 77.97 86.82 81.66 82.15 4.44
120 3470 3560 3380 79.22 88.56 82.64 83.47 4.72 0.1% 0 4180 3440 4020 100.00 100.00 100.00 100.00 0.00 Aloe 20 3700 2570 3360 88.52 74.71 83.58 82.27 7.00
marlothii 40 2300 2200 2730 55.02 63.95 67.91 62.30 6.60 & 60 1600 1770 2150 38.28 51.45 53.48 47.74 8.26
TMC 80 1490 1820 2070 35.65 52.91 51.49 46.68 9.58 0:10 100 1198 1652 1880 28.66 48.02 46.77 41.15 10.83
120 1131 1653 1810 27.06 48.05 45.02 40.04 11.35

171
Table A.42: Percentage reduced TEER of combination 6 (Aloe marlothii and TMC) at
concentration 0.1% w/v across Caco-2 cell monolayers
Group Time (min) AP-BL (Percentage reduced TEER)
Well 1 Well 2 Well 3 Mean SD
0.1% 0 0.00 0.00 0.00 0.00 0.00 Aloe 20 1.56 0.77 4.29 2.21 1.85
marlothii 40 2.22 1.55 4.29 2.69 1.43 & 60 7.56 2.65 6.06 5.42 2.51
TMC 80 13.78 8.85 11.11 11.25 2.47 10:0 100 14.00 9.73 11.87 11.87 2.13
120 11.56 4.65 10.10 8.77 3.64 0.1% 0 0.00 0.00 0.00 0.00 0.00 Aloe 20 4.50 6.72 3.56 4.93 1.62
marlothii 40 22.15 12.14 10.69 14.99 6.24 & 60 22.84 14.73 22.09 19.89 4.48
TMC 80 21.80 16.02 21.14 19.65 3.16 8:2 100 27.34 18.60 21.62 22.52 4.44
120 28.37 19.38 20.43 22.73 4.92 0.1% 0 0.00 0.00 0.00 0.00 0.00 Aloe 20 14.08 18.47 14.84 15.79 2.34
marlothii 40 27.21 25.42 12.91 21.85 7.79 & 60 34.37 33.93 24.18 30.83 5.76
TMC 80 28.16 28.66 19.23 25.35 5.31 5:5 100 33.17 31.29 19.51 27.99 7.41
120 34.37 41.13 40.66 38.72 3.77 0.1% 0 0.00 0.00 0.00 0.00 0.00 Aloe 20 20.09 16.42 11.25 15.92 4.44
marlothii 40 21.00 16.42 12.96 16.79 4.04 & 60 21.35 18.16 11.98 17.16 4.76
TMC 80 19.75 11.69 14.91 15.45 4.06 2:8 100 22.03 13.18 18.34 17.85 4.44
120 20.78 11.44 17.36 16.53 4.72 0.1% 0 0.00 0.00 0.00 0.00 0.00 Aloe 20 11.48 25.29 16.42 17.73 7.00
marlothii 40 44.98 36.05 32.09 37.70 6.60 & 60 61.72 48.55 46.52 52.26 8.26
TMC 80 64.35 47.09 48.51 53.32 9.58 0:10 100 71.34 51.98 53.23 58.85 10.83
120 72.94 51.95 54.98 59.96 11.35

172
Table A.43: P-values for the reduced percentage TEER values of combination 6 (Aloe
marlothii and TMC) at concentration 0.1% w/v at time 60 min across Caco-2 cell monolayers
comparing to the control groups
Group n Mean SD p-value: Dunnett
TEER
ANOVA Pos. Contr. Neg. Contr.
0.1% AM_TMC 10:0 3 5.42 2.51 0.000009* 0.564623
0.1% AM_TMC 8:2 3 19.89 4.48 0.000104* 0.001646*
0.1% AM_TMC 5:5 3 30.83 5.76 0.002503* 0.000039*
0.1% AM_TMC 2:8 3 17.16 4.76 0.000055* 0.005089*
0.1% AM_TMC 0:10 3 52.26 8.26 - 0.000009*
Positive control 3 52.26 8.26 0.000013*
Negative control 3 0.00 0.00 0.000000*
* Statistically significantly different at 0.05 level
Table A.44: P-values for the TEER values of combination 6 (Aloe marlothii and TMC) at
concentration 0.1% w/v at time 120 min across Caco-2 cell monolayers comparing to the
control groups
Group n Mean SD p-value: Dunnett
TEER
ANOVA Pos. Contr. Neg. Contr.
0.1% AM_TMC 10:0 3 8.77 3.64 0.000012* 0.284322
0.1% AM_TMC 8:2 3 22.73 4.92 0.000113* 0.001867*
0.1% AM_TMC 5:5 3 38.72 3.77 0.007294* 0.000022*
0.1% AM_TMC 2:8 3 16.53 4.72 0.000034* 0.017917*
0.1% AM_TMC 0:10 3 59.96 11.35 - 0.00009*
Positive control 3 59.96 11.35 0.000014*
Negative control 3 0.00 0.00 0.000000*
* Statistically significantly different at 0.05 level

173
A.6.2 Concentration 0.5% w/v
Table A.45: TEER readings and normalized percentages of combination 6 (Aloe marlothii
and TMC) at concentration 0.5% w/v across Caco-2 cell monolayers
Group Time (min) AP-BL(TEER readings) AP-BL (Normalized percentages)
Well 1 Well 2 Well 3 Well 1 Well 2 Well 3 Mean SD
0.5% 0 3750 4080 4390 100.00 100.00 100.00 100.00 0.00 Aloe 20 3230 3180 3960 86.13 77.94 90.21 84.76 6.25
marlothii 40 2930 2680 3380 78.13 65.69 76.99 73.60 6.88 & 60 2700 2960 2830 72.00 72.55 64.46 69.67 4.52
TMC 80 2920 3150 3035 77.87 77.21 69.13 74.74 4.86 10:0 100 2850 3060 2955 76.00 75.00 67.31 72.77 4.75
120 2250 2280 2265 60.00 55.88 51.59 55.83 4.20 0.5% 0 3580 3460 3240 100.00 100.00 100.00 100.00 0.00 Aloe 20 3000 2600 2120 83.80 75.14 65.43 74.79 9.19
marlothii 40 2000 2250 1840 55.87 65.03 56.79 59.23 5.04 & 60 2695 3040 2350 75.28 87.86 72.53 78.56 8.17
TMC 80 2860 3260 2460 79.89 94.22 75.93 83.34 9.62 8:2 100 2940 3270 2610 82.12 94.51 80.56 85.73 7.64
120 2975 3280 2670 83.10 94.80 82.41 86.77 6.96 0.5% 0 2930 3140 3300 100.00 100.00 100.00 100.00 0.00 Aloe 20 1500 1760 2250 51.19 56.05 68.18 58.48 8.75
marlothii 40 680 1331 1880 23.21 42.39 56.97 40.86 16.93 & 60 924 1460 1360 31.54 46.50 41.21 39.75 7.59
TMC 80 900 1676 752 30.72 53.38 22.79 35.63 15.87 5:5 100 9540 1877 513 325.60 59.78 15.55 133.64 167.70
120 900 1940 402 30.72 61.78 12.18 34.89 25.06 0.5% 0 3560 2740 3250 100.00 100.00 100.00 100.00 0.00 Aloe 20 2140 1760 1230 60.11 64.23 37.85 54.06 14.20
marlothii 40 1074 1390 919 30.17 50.73 28.28 36.39 12.45 & 60 1260 1540 1110 35.39 56.20 34.15 41.92 12.39
TMC 80 1343 1692 1231 37.72 61.75 37.88 45.78 13.83 2:8 100 1223 1597 1312 34.35 58.28 40.37 44.34 12.45
120 1176 1495 1332 33.03 54.56 40.98 42.86 10.89 0.5% 0 3560 3930 4100 100.00 100.00 100.00 100.00 0.00 Aloe 20 1530 1520 1560 42.98 38.68 38.05 39.90 2.68
marlothii 40 1075 885 1464 30.20 22.52 35.71 29.47 6.62 & 60 975 820 1494 27.39 20.87 36.44 28.23 7.82
TMC 80 843 851 1338 23.68 21.65 32.63 25.99 5.84 0:10 100 818 806 1337 22.98 20.51 32.61 25.37 6.39
120 834 807 1252 23.43 20.53 30.54 24.83 5.15

174
Table A.46: Percentage reduced TEER of combination 6 (Aloe marlothii and TMC) at
concentration 0.5% w/v across Caco-2 cell monolayers
Group Time (min) AP-BL (Percentage reduced TEER)
Well 1 Well 2 Well 3 Mean SD
0.5% 0 0.00 0.00 0.00 0.00 0.00 Aloe 20 13.87 22.06 9.79 15.24 6.25
marlothii 40 21.87 34.31 23.01 26.40 6.88 & 60 28.00 27.45 35.54 30.33 4.52
TMC 80 22.13 22.79 30.87 25.26 4.86 10:0 100 24.00 25.00 32.69 27.23 4.75
120 40.00 44.12 48.41 44.17 4.20 0.5% 0 0.00 0.00 0.00 0.00 0.00 Aloe 20 16.20 24.86 34.57 25.21 9.19
marlothii 40 44.13 34.97 43.21 40.77 5.04 & 60 24.72 12.14 27.47 21.44 8.17
TMC 80 20.11 5.78 24.07 16.66 9.62 8:2 100 17.88 5.49 19.44 14.27 7.64
120 16.90 5.20 17.59 13.23 6.96 0.5% 0 0.00 0.00 0.00 0.00 0.00 Aloe 20 48.81 43.95 31.82 41.52 8.75
marlothii 40 76.79 57.61 43.03 59.14 16.93 & 60 68.46 53.50 58.79 60.25 7.59
TMC 80 69.28 46.62 77.21 64.37 15.87 5:5 100 69.15 40.22 84.45 64.61 22.46
120 69.28 38.22 87.82 65.11 25.06 0.5% 0 0.00 0.00 0.00 0.00 0.00 Aloe 20 39.89 35.77 62.15 45.94 14.20
marlothii 40 69.83 49.27 71.72 63.61 12.45 & 60 64.61 43.80 65.85 58.08 12.39
TMC 80 62.28 38.25 62.12 54.22 13.83 2:8 100 65.65 41.72 59.63 55.66 12.45
120 66.97 45.44 59.02 57.14 10.89 0.5% 0 0.00 0.00 0.00 0.00 0.00 Aloe 20 57.02 61.32 61.95 60.10 2.68
marlothii 40 69.80 77.48 64.29 70.53 6.62 & 60 72.61 79.13 63.56 71.77 7.82
TMC 80 76.32 78.35 67.37 74.01 5.84 0:10 100 77.02 79.49 67.39 74.63 6.39
120 76.57 79.47 69.46 75.17 5.15

175
Table A.47: P-values for the TEER values of combination 6 (Aloe marlothii and TMC) at
concentration 0.5% w/v at time 60 min across Caco-2 cell monolayers comparing to the
control groups
Group n Mean SD p-value: Dunnett
TEER
ANOVA Pos. Contr. Neg. Contr.
0.5% AM_TMC 10:0 3 30.33 4.52 0.000470* 0.001832*
0.5% AM_TMC 8:2 3 21.44 8.17 0.000100* 0.020957*
0.5% AM_TMC 5:5 3 60.25 7.59 0.333680 0.000011*
0.5% AM_TMC 2:8 3 58.08 12.39 0.212766 0.000013*
0.5% AM_TMC 0:10 3 71.77 7.82 - 0.000009*
Positive control 3 71.77 7.82 0.001523*
Negative control 3 0.00 0.00 0.000001*
* Statistically significantly different at 0.05 level
Table A.48: P-values for the TEER values of combination 6 (Aloe marlothii and TMC) at
concentration 0.5% w/v at time 120 min across Caco-2 cell monolayers comparing to the
control groups
Group n Mean SD p-value: Dunnett
TEER
ANOVA Pos. Contr. Neg. Contr.
0.5% AM_TMC 10:0 3 44.17 4.20 0.046896* 0.002670*
0.5% AM_TMC 8:2 3 13.23 6.96 0.000559* 0.537097
0.5% AM_TMC 5:5 3 65.11 25.06 0.749347 0.000099*
0.5% AM_TMC 2:8 3 57.14 10.89 0.315590 0.000313*
0.5% AM_TMC 0:10 3 75.17 5.15 - 0.000031*
Positive control 3 75.17 5.15 0.000238*
Negative control 3 0.00 0.00 0.000024*
* Statistically significantly different at 0.05 level

176
A.7 Negative control: Caco-2 cells alone
Table A.49: TEER readings and normalized percentages of the negative control (Caco-2
cells alone)
Group Time (min) AP-BL (TEER readings) AP-BL (Normalized percentages)
Well 1 Well 2 Well 3 Well 1 Well 2 Well 3 Mean SD
0 1886 1790 1339 100 100 100 100 0 Caco-2 cells 20 2110 2020 1800 111.87 112.85 134.43 119.72 12.75 alone 40 2160 2110 1629 117.71 117.88 121.66 119.08 2.23
(Negative 60 2220 2170 2210 120.89 121.23 165.05 135.72 25.40 control) 80 2280 2170 2140 121.16 121.24 159.82 134.07 22.30
100 2285 2165 2036 121.16 120.94 152.054 131.39 17.90 120 2331 2161 1995 123.59 120.72 148.99 131.10 15.56
Table A.50: Percentage reduced TEER of negative control (Caco-2 cells alone)
Group Time (min) AP-BL (Percentage reduced TEER)
Well 1 Well 2 Well 3 Mean SD
0 0 0 0 0 0 Caco-2 cells 20 -11.88 -12.84 -34.42 -19.71 10.40
alone 40 -17.71 -17.87 -21.65 -19.08 1.82 (Negative 60 -20.89 -21.22 -65.04 -35.72 20.73 control) 80 -21.15 -21.22 -59.82 -34.06 18.20
100 -21.15 -20.94 -52.05 -31.38 14.61 120 -23.59 -20.72 -48.99 -31.10 12.70

177
A.8 Positive control: N-Trimethyl chitosan chloride (TMC)
A.8.1 Concentration 0.1% w/v
Table A.51: TEER readings and normalized percentages of the positive control (TMC) at
concentration 0.1% w/v across Caco-2 cell monolayers
Group Time (min) AP-BL (TEER readings) AP-BL (Normalized percentages)
Well 1 Well 2 Well 3 Well 1 Well 2 Well 3 Mean SD
0 4180 3440 4020 100 100 100 100 0 0.1% w/v 20 3700 2570 3360 88.52 74.71 83.58 82.27 6.70
TMC 40 2300 2200 2730 55.02 63.95 67.91 62.30 6.60 (Positive 60 1600 1770 2150 38.28 51.45 53.48 47.74 8.26 control) 80 1490 1820 2070 35.65 52.91 51.49 46.68 9.58
100 1198 1652 1880 28.66 48.02 46.77 41.15 10.83 120 1131 1653 1810 27.06 48.05 45.02 40.04 11.34
Table A.52: Percentage reduced TEER of the positive control (TMC) at concentration 0.1%
w/v across Caco-2 cell monolayers
Group Time (min) AP-BL (Percentage reduced TEER)
Well 1 Well 2 Well 3 Mean SD
0 0 0 0 0 0 0.1% w/v 20 11.48 25.29 16.42 17.73 6.70
TMC 40 44.98 36.05 32.09 37.70 6.60 (Positive 60 61.72 48.55 46.52 52.26 8.26 control) 80 64.35 47.09 48.51 53.32 9.58
100 71.34 51.98 53.23 58.85 10.83 120 72.94 51.95 54.98 59.96 11.35

178
A.8.2 Concentration 0.5% w/v
Table A.53: TEER readings and normalized percentages of the positive control (TMC) at
concentration 0.5% w/v across Caco-2 cell monolayers
Group Time (min) AP-BL(TEER readings) AP-BL (Normalized percentages)
Well 1 Well 2 Well 3 Well 1 Well 2 Well 3 Mean SD
0 3560 3930 4100 100 100 100 100 0 0.5% w/v 20 1530 1520 1560 42.98 38.68 38.05 39.90 2.68
TMC 40 1075 885 1464 30.20 22.52 35.71 29.47 6.62 (Positive 60 975 820 1494 27.39 20.87 36.44 28.23 7.82 control) 80 843 851 1338 23.68 21.65 32.63 25.99 5.84
100 818 806 1337 22.98 20.51 32.61 25.37 6.40 120 834 807 1252 23.43 20.53 30.54 24.83 5.15
Table A.54: Percentage reduced TEER of the positive control (TMC) at concentration 0.5%
w/v across Caco-2 cell monolayers
Group Time (min) AP-BL (Percentage reduced TEER)
Well 1 Well 2 Well 3 Mean SD
0 0 0 0 0 0 0.5% w/v 20 57.02 61.32 61.95 60.10 2.68
TMC 40 69.80 77.48 64.29 70.53 6.62 (Positive 60 72.61 79.13 63.56 71.77 7.82 control) 80 76.32 78.35 67.37 74.01 5.84
100 77.02 79.49 67.39 74.63 6.39 120 76.57 79.47 69.46 75.17 5.15

179
ADDENDUM B IN VITRO TRANSPORT OF FITC-DEXTRAN ACROSS
CACO-2 CELL MONOLAYERS

180
B.1 Combination 1: Aloe vera and Aloe marlothii
Table B.1: Peak areas of in vitro transport and percentage transport of combination 1 (Aloe
vera and Aloe marlothii) at a concentration of 0.1% w/v across Caco-2 cell monolayers
Experiment Time (min)
AP-BL (Peak area)
AP-BL (Percentage transport)
Well 1
Well 2
Well 3
Well 1
Well 2
Well 3
Mean SD
0.1% 0 0.00 0.00 0.00 0.00 0.00 0.00 0.00 0.00 Aloe vera 20 229.90 257.43 284.96 0.06 0.01 0.07 0.04 0.03
& 40 295.82 313.81 331.80 0.08 0.01 0.09 0.06 0.04 Aloe 60 305.70 321.52 337.33 0.08 0.01 0.09 0.06 0.04
marlothii 80 309.82 341.20 372.59 0.08 0.01 0.10 0.06 0.04 10:0 100 358.02 372.90 387.78 0.09 0.01 0.10 0.07 0.04
120 363.97 363.80 363.63 0.09 0.01 0.10 0.06 0.04 0.1% 0 0.00 0.00 0.00 0.00 0.00 0.00 0.00 0.00
Aloe vera 20 36.46 30.06 29.92 0.06 0.06 0.06 0.06 0.00 & 40 39.78 32.52 36.15 0.06 0.06 0.06 0.06 0.00
Aloe 60 53.38 52.65 167.17 0.07 0.07 0.12 0.09 0.02 marlothii 80 61.45 55.19 169.25 0.07 0.07 0.13 0.09 0.03
8:2 100 90.87 70.21 170.78 0.09 0.08 0.13 0.10 0.02 120 91.63 70.39 171.67 0.09 0.08 0.13 0.10 0.02
0.1% 0 0.00 0.00 0.00 0.00 0.00 0.00 0.00 0.00 Aloe vera 20 31.84 33.86 54.16 0.05 0.05 0.06 0.05 0.00
& 40 34.63 33.98 203.19 0.05 0.05 0.12 0.07 0.03 Aloe 60 57.40 56.98 245.51 0.06 0.06 0.14 0.09 0.04
marlothii 80 95.57 70.53 315.97 0.08 0.07 0.17 0.11 0.05 5:5 100 96.06 91.38 340.48 0.08 0.08 0.19 0.11 0.05
120 97.90 104.02 384.40 0.08 0.08 0.20 0.12 0.06 0.1% 0 0.00 0.00 0.00 0.00 0.00 0.00 0.00 0.00
Aloe vera 20 239.11 249.14 267.51 0.09 0.09 0.09 0.09 0.00 & 40 304.10 301.36 702.67 0.11 0.11 0.21 0.15 0.05
Aloe 60 640.55 530.77 750.32 0.45 0.17 0.24 0.29 0.12 marlothii 80 1729.11 534.72 848.61 0.53 0.18 0.27 0.33 0.15
2:8 100 1446.82 568.73 1199.62 0.46 0.19 0.36 0.34 0.11 120 1729.72 1949.16 1280.24 0.52 0.54 0.40 0.49 0.06
0.1% 0 0 0 0 0.00 0.00 0.00 0.00 0.00 Aloe vera 20 89.41 98.95 89.45 0.04 0.04 0.04 0.04 0.00
& 40 164.22 106.95 165.33 0.06 0.05 0.06 0.06 0.01 Aloe 60 189.02 177.99 200.05 0.07 0.06 0.07 0.07 0.00
marlothii 80 196.36 157.95 234.76 0.07 0.06 0.08 0.07 0.01 0:10 100 266.88 178.99 227.62 0.08 0.06 0.08 0.08 0.01
120 351.56 195.93 318.05 0.10 0.07 0.10 0.09 0.01
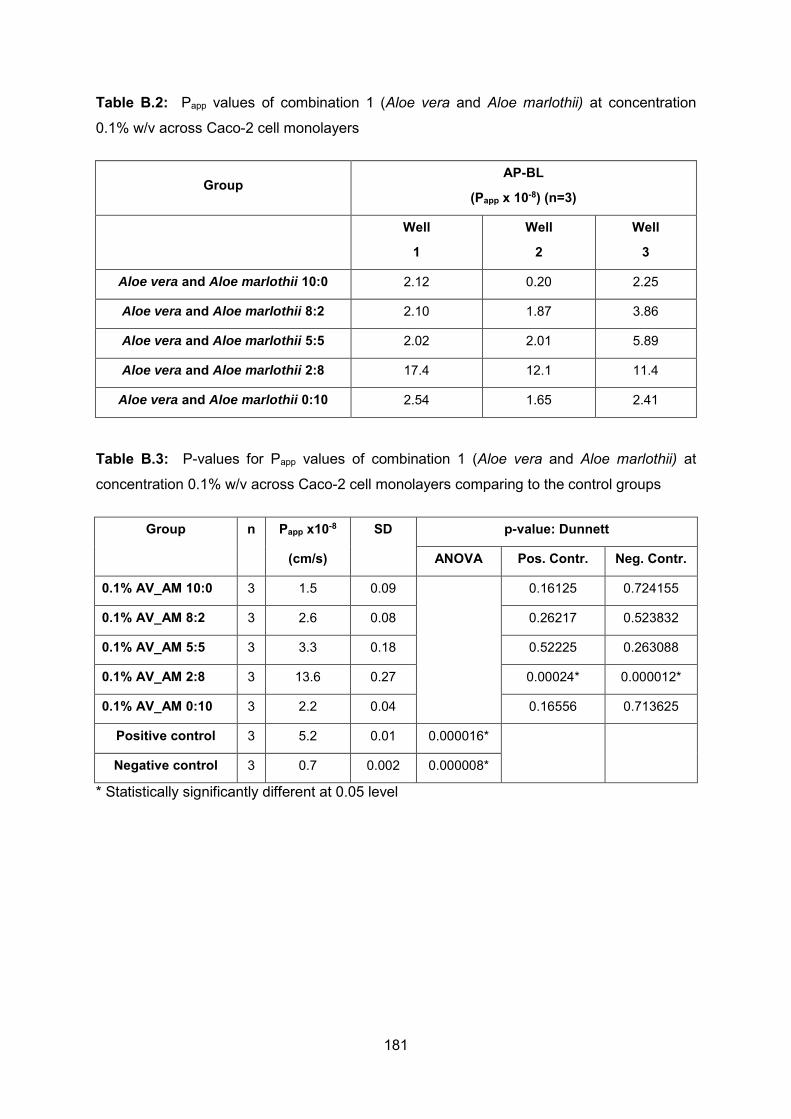
181
Table B.2: Papp values of combination 1 (Aloe vera and Aloe marlothii) at concentration
0.1% w/v across Caco-2 cell monolayers
Group AP-BL
(Papp x 10-8) (n=3)
Well
1
Well
2
Well
3
Aloe vera and Aloe marlothii 10:0 2.12 0.20 2.25
Aloe vera and Aloe marlothii 8:2 2.10 1.87 3.86
Aloe vera and Aloe marlothii 5:5 2.02 2.01 5.89
Aloe vera and Aloe marlothii 2:8 17.4 12.1 11.4
Aloe vera and Aloe marlothii 0:10 2.54 1.65 2.41
Table B.3: P-values for Papp values of combination 1 (Aloe vera and Aloe marlothii) at
concentration 0.1% w/v across Caco-2 cell monolayers comparing to the control groups
Group n Papp x10-8 SD p-value: Dunnett
(cm/s)
ANOVA Pos. Contr. Neg. Contr.
0.1% AV_AM 10:0 3 1.5 0.09 0.16125 0.724155
0.1% AV_AM 8:2 3 2.6 0.08 0.26217 0.523832
0.1% AV_AM 5:5 3 3.3 0.18 0.52225 0.263088
0.1% AV_AM 2:8 3 13.6 0.27 0.00024* 0.000012*
0.1% AV_AM 0:10 3 2.2 0.04 0.16556 0.713625
Positive control 3 5.2 0.01 0.000016*
Negative control 3 0.7 0.002 0.000008*
* Statistically significantly different at 0.05 level

182
B.2 Combination 2: Aloe vera and Aloe ferox
Table B.4: Peak areas of in vitro transport and percentage transport of combination 2 (Aloe
vera and Aloe ferox) at concentration 0.1% w/v across Caco-2 cell monolayers
Experiment Time (min)
AP-BL (Peak area)
AP-BL (Percentage transport)
Well 1
Well 2
Well 3
Well 1
Well 2
Well 3
Mean SD
0.1% 0 0.00 0.00 0.00 0.00 0.00 0.00 0.00 0.00 Aloe vera 20 229.90 257.43 284.96 0.06 0.01 0.07 0.04 0.03
& 40 295.82 313.81 331.80 0.08 0.01 0.09 0.06 0.04 Aloe 60 305.70 321.52 337.33 0.08 0.01 0.09 0.06 0.04 ferox 80 309.82 341.20 372.59 0.08 0.01 0.10 0.06 0.04 10:0 100 358.02 372.90 387.78 0.09 0.01 0.10 0.07 0.04
120 363.97 363.80 363.63 0.09 0.01 0.10 0.06 0.04 0.1% 0 0.00 0.00 0.00 0.00 0.00 0.00 0.00 0.00
Aloe vera 20 242.89 255.51 230.28 0.10 0.11 0.10 0.10 0.01 & 40 230.87 225.92 235.82 0.11 0.11 0.11 0.11 0.00
Aloe 60 244.37 244.90 243.84 0.11 0.12 0.11 0.11 0.00 ferox 80 260.16 262.31 258.01 0.12 0.12 0.11 0.12 0.00 8:2 100 274.03 262.78 285.29 0.12 0.12 0.12 0.12 0.00
120 259.21 263.20 255.22 0.12 0.12 0.11 0.12 0.00 0.1% 0 0.00 0.00 0.00 0.00 0.00 0.00 0.00 0.00
Aloe vera 20 297.21 262.49 220.34 0.11 0.11 0.10 0.11 0.01 & 40 223.65 226.47 227.36 0.11 0.11 0.11 0.11 0.00
Aloe 60 240.76 230.51 232.26 0.11 0.11 0.12 0.11 0.00 ferox 80 258.89 274.70 243.07 0.11 0.12 0.12 0.12 0.00 5:5 100 262.66 275.72 249.60 0.12 0.12 0.12 0.12 0.00
120 279.71 274.29 285.14 0.12 0.12 0.13 0.12 0.00 0.1% 0 0.00 0.00 0.00 0.00 0.00 0.00 0.00 0.00
Aloe vera 20 248.78 250.44 249.61 0.14 0.14 0.14 0.14 0.00 & 40 296.78 252.07 274.43 0.17 0.16 0.17 0.17 0.01
Aloe 60 312.93 276.79 294.86 0.18 0.16 0.18 0.18 0.01 ferox 80 325.07 278.51 301.79 0.19 0.17 0.18 0.18 0.01 2:8 100 354.93 295.27 325.10 0.20 0.17 0.19 0.19 0.01
120 342.02 278.16 310.09 0.20 0.17 0.19 0.18 0.01 0.1% 0 0 0 0 0.00 0.00 0.00 0.00 0.00
Aloe vera 20 327.08 347.07 307.08 0.07 0.08 0.07 0.08 0.01 & 40 340.56 367.77 313.36 0.08 0.10 0.08 0.09 0.01
Aloe 60 911.21 930.48 891.94 0.18 0.20 0.18 0.19 0.01 ferox 80 957.71 995.12 920.31 0.20 0.23 0.20 0.21 0.01 0:10 100 1093.4 1101.8 1085 0.22 0.25 0.23 0.24 0.01
120 1157.9 1204.5 1111.3 0.24 0.27 0.24 0.25 0.01
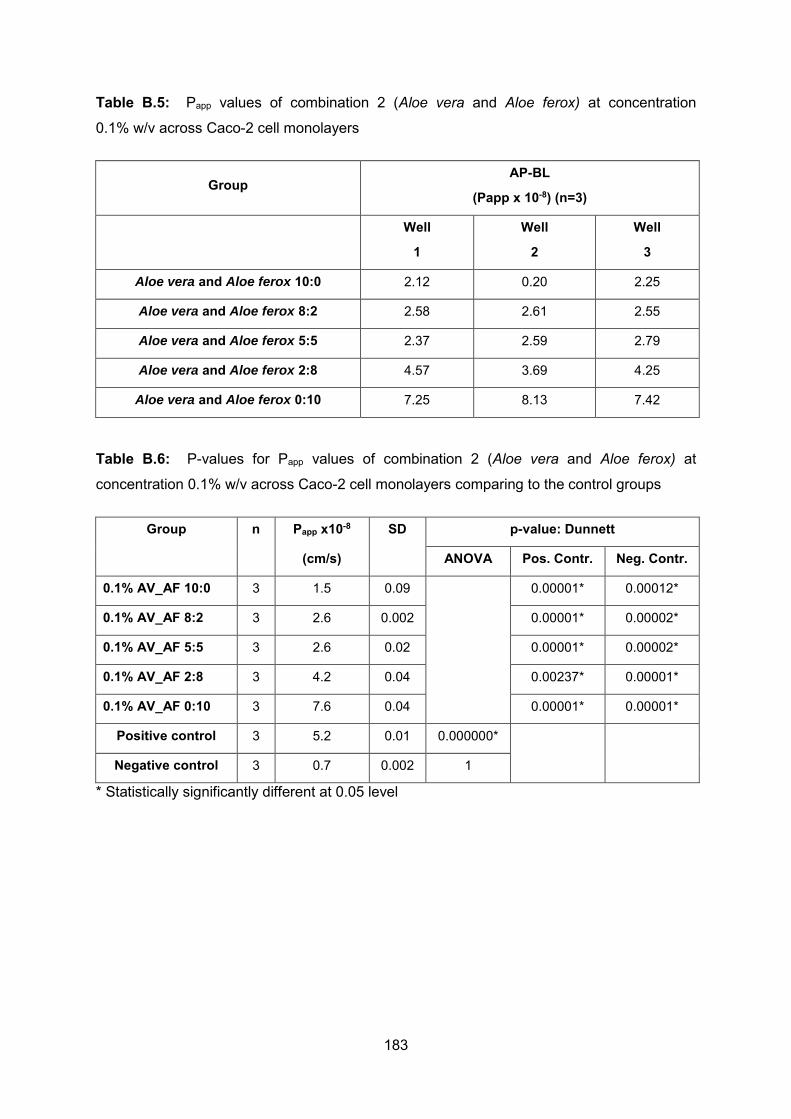
183
Table B.5: Papp values of combination 2 (Aloe vera and Aloe ferox) at concentration
0.1% w/v across Caco-2 cell monolayers
Group AP-BL
(Papp x 10-8) (n=3)
Well
1
Well
2
Well
3
Aloe vera and Aloe ferox 10:0 2.12 0.20 2.25
Aloe vera and Aloe ferox 8:2 2.58 2.61 2.55
Aloe vera and Aloe ferox 5:5 2.37 2.59 2.79
Aloe vera and Aloe ferox 2:8 4.57 3.69 4.25
Aloe vera and Aloe ferox 0:10 7.25 8.13 7.42
Table B.6: P-values for Papp values of combination 2 (Aloe vera and Aloe ferox) at
concentration 0.1% w/v across Caco-2 cell monolayers comparing to the control groups
Group n Papp x10-8 SD p-value: Dunnett
(cm/s)
ANOVA Pos. Contr. Neg. Contr.
0.1% AV_AF 10:0 3 1.5 0.09 0.00001* 0.00012*
0.1% AV_AF 8:2 3 2.6 0.002 0.00001* 0.00002*
0.1% AV_AF 5:5 3 2.6 0.02 0.00001* 0.00002*
0.1% AV_AF 2:8 3 4.2 0.04 0.00237* 0.00001*
0.1% AV_AF 0:10 3 7.6 0.04 0.00001* 0.00001*
Positive control 3 5.2 0.01 0.000000*
Negative control 3 0.7 0.002 1
* Statistically significantly different at 0.05 level
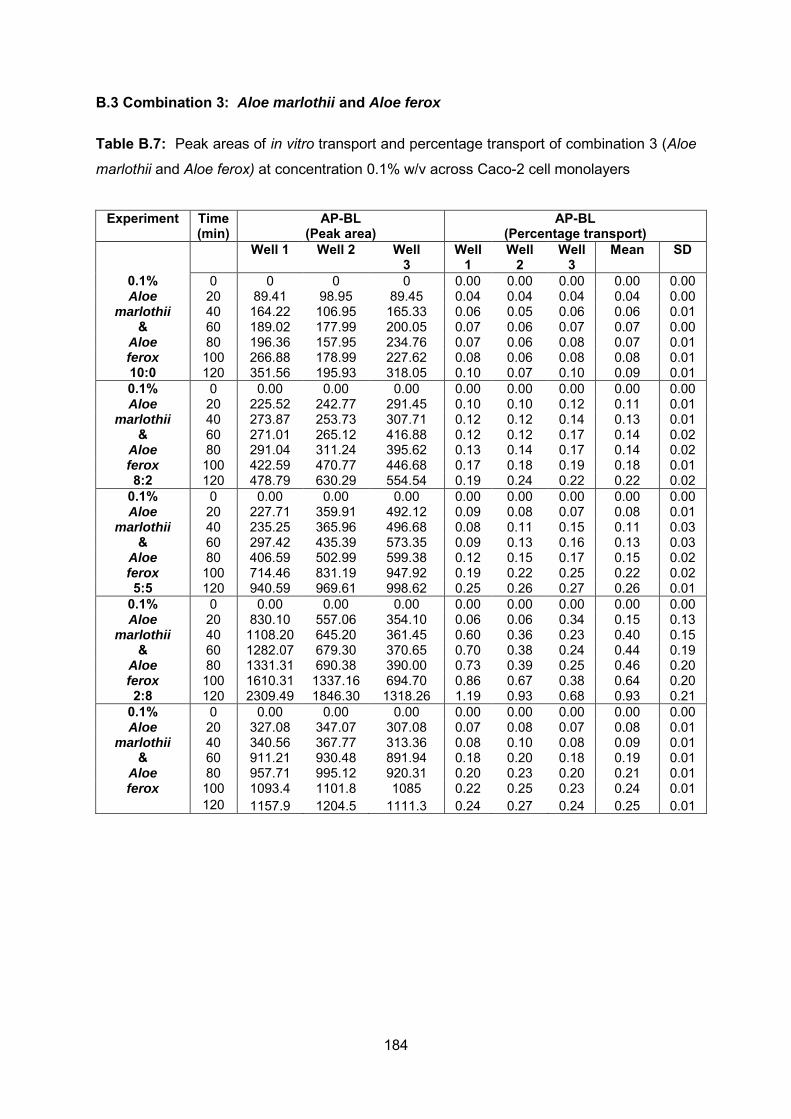
184
B.3 Combination 3: Aloe marlothii and Aloe ferox
Table B.7: Peak areas of in vitro transport and percentage transport of combination 3 (Aloe
marlothii and Aloe ferox) at concentration 0.1% w/v across Caco-2 cell monolayers
Experiment Time (min)
AP-BL (Peak area)
AP-BL (Percentage transport)
Well 1 Well 2 Well 3
Well 1
Well 2
Well 3
Mean SD
0.1% 0 0 0 0 0.00 0.00 0.00 0.00 0.00 Aloe 20 89.41 98.95 89.45 0.04 0.04 0.04 0.04 0.00
marlothii 40 164.22 106.95 165.33 0.06 0.05 0.06 0.06 0.01 & 60 189.02 177.99 200.05 0.07 0.06 0.07 0.07 0.00
Aloe 80 196.36 157.95 234.76 0.07 0.06 0.08 0.07 0.01 ferox 100 266.88 178.99 227.62 0.08 0.06 0.08 0.08 0.01 10:0 120 351.56 195.93 318.05 0.10 0.07 0.10 0.09 0.01 0.1% 0 0.00 0.00 0.00 0.00 0.00 0.00 0.00 0.00 Aloe 20 225.52 242.77 291.45 0.10 0.10 0.12 0.11 0.01
marlothii 40 273.87 253.73 307.71 0.12 0.12 0.14 0.13 0.01 & 60 271.01 265.12 416.88 0.12 0.12 0.17 0.14 0.02
Aloe 80 291.04 311.24 395.62 0.13 0.14 0.17 0.14 0.02 ferox 100 422.59 470.77 446.68 0.17 0.18 0.19 0.18 0.01 8:2 120 478.79 630.29 554.54 0.19 0.24 0.22 0.22 0.02
0.1% 0 0.00 0.00 0.00 0.00 0.00 0.00 0.00 0.00 Aloe 20 227.71 359.91 492.12 0.09 0.08 0.07 0.08 0.01
marlothii 40 235.25 365.96 496.68 0.08 0.11 0.15 0.11 0.03 & 60 297.42 435.39 573.35 0.09 0.13 0.16 0.13 0.03
Aloe 80 406.59 502.99 599.38 0.12 0.15 0.17 0.15 0.02 ferox 100 714.46 831.19 947.92 0.19 0.22 0.25 0.22 0.02 5:5 120 940.59 969.61 998.62 0.25 0.26 0.27 0.26 0.01
0.1% 0 0.00 0.00 0.00 0.00 0.00 0.00 0.00 0.00 Aloe 20 830.10 557.06 354.10 0.06 0.06 0.34 0.15 0.13
marlothii 40 1108.20 645.20 361.45 0.60 0.36 0.23 0.40 0.15 & 60 1282.07 679.30 370.65 0.70 0.38 0.24 0.44 0.19
Aloe 80 1331.31 690.38 390.00 0.73 0.39 0.25 0.46 0.20 ferox 100 1610.31 1337.16 694.70 0.86 0.67 0.38 0.64 0.20 2:8 120 2309.49 1846.30 1318.26 1.19 0.93 0.68 0.93 0.21
0.1% 0 0.00 0.00 0.00 0.00 0.00 0.00 0.00 0.00 Aloe 20 327.08 347.07 307.08 0.07 0.08 0.07 0.08 0.01
marlothii 40 340.56 367.77 313.36 0.08 0.10 0.08 0.09 0.01 & 60 911.21 930.48 891.94 0.18 0.20 0.18 0.19 0.01
Aloe 80 957.71 995.12 920.31 0.20 0.23 0.20 0.21 0.01 ferox 100 1093.4 1101.8 1085 0.22 0.25 0.23 0.24 0.01
120 1157.9 1204.5 1111.3 0.24 0.27 0.24 0.25 0.01

185
Table B.8: Papp values of combination 3 (Aloe marlothii and Aloe ferox) at concentration
0.1% w/v across Caco-2 cell monolayers
Group AP-BL
(Papp x 10-8) (n=3)
Well
1
Well
2
Well
3
Aloe marlothii and Aloe ferox 10:0 2.54 1.65 2.41
Aloe marlothii and Aloe ferox 8:2 4.57 5.73 5.27
Aloe marlothii and Aloe ferox 5:5 6.34 7.01 7.63
Aloe marlothii and Aloe ferox 2:8 33.7 25.7 13.7
Aloe marlothii and Aloe ferox 0:10 7.25 8.13 7.41
Table B.9: P-values for Papp values of combination 3 (Aloe marlothii and Aloe ferox) at
concentration 0.1% w/v across Caco-2 cell monolayers comparing to the control groups
Group n Papp x10-8 SD p-value: Dunnett
(cm/s)
ANOVA Pos. Contr. Neg. Contr.
0.1% AM_AF 10:0 3 2.2 0.04 0.83371 0.98754
0.1% AM_AF 8:2 3 5.2 0.05 1.00000 0.56020
0.1% AM_AF 5:5 3 7.0 0.05 0.97722 0.27646
0.1% AM_AF 2:8 3 24.4 0.82 0.00046* 0.00007*
0.1% AM_AF 0:10 3 7.6 0.04 0.92798 0.21025
Positive control 3 5.2 0.01 0.000364*
Negative control 3 0.7 0.002 0.00018*
* Statistically significantly different at 0.05 level

186
B.4 Combination 4: Aloe vera and TMC
Table B.10: Peak areas of in vitro transport and percentage transport of combination 4
(Aloe vera and TMC) at concentration 0.1% w/v across Caco-2 cell monolayers
Experiment Time (min)
AP-BL (Peak area)
AP-BL (Percentage transport)
Well 1
Well 2
Well 3
Well 1
Well 2
Well 3
Mean SD
0.1% 0 0.00 0.00 0.00 0.00 0.00 0.00 0.00 0.00 Aloe vera 20 229.90 257.43 284.96 0.06 0.01 0.07 0.04 0.03
& 40 295.82 313.81 331.80 0.08 0.01 0.09 0.06 0.04 TMC 60 305.70 321.52 337.33 0.08 0.01 0.09 0.06 0.04 10:0 80 309.82 341.20 372.59 0.08 0.01 0.10 0.06 0.04
100 358.02 372.90 387.78 0.09 0.01 0.10 0.07 0.04 120 363.97 363.80 363.63 0.09 0.01 0.10 0.06 0.04
0.1% 0 0.00 0.00 0.00 0.00 0.00 0.00 0.00 0.00 Aloe vera 20 235.93 249.31 223.83 0.10 0.10 0.10 0.10 0.00
& 40 239.03 258.11 241.84 0.11 0.11 0.11 0.11 0.00 TMC 60 297.36 259.40 248.28 0.13 0.11 0.12 0.12 0.01 8:2 80 341.72 319.20 334.14 0.14 0.13 0.14 0.14 0.01
100 354.73 343.92 340.81 0.15 0.14 0.15 0.15 0.00 120 385.80 352.32 389.37 0.16 0.14 0.16 0.15 0.01
0.1% 0 0.00 0.00 0.00 0.00 0.00 0.00 0.00 0.00 Aloe vera 20 3862.50 3432.74 3002.98 1.33 1.18 1.04 1.18 0.12
& 40 4137.88 3582.18 3026.48 1.63 1.41 1.21 1.42 0.17 TMC 60 4983.28 4071.41 3159.55 1.93 1.59 1.25 1.59 0.28 5:5 80 5282.13 5060.05 4837.98 2.08 1.94 1.82 1.95 0.11
100 6575.90 5551.16 4526.43 2.53 2.16 1.81 2.16 0.30 120 6929.50 6066.76 5204.03 2.72 2.36 2.02 2.36 0.29
0.1% 0 0.00 0.00 0.00 0.00 0.00 0.00 0.00 0.00 Aloe vera 20 1724.04 551.89 1280.58 0.51 0.18 0.38 0.36 0.14
& 40 1794.78 597.06 1470.22 0.61 0.22 0.49 0.44 0.16 TMC 60 1925.11 684.20 1790.98 0.65 0.24 0.58 0.49 0.18 2:8 80 1955.78 903.95 1993.24 0.67 0.31 0.65 0.54 0.17
100 2152.54 1365.98 2208.13 0.72 0.44 0.72 0.63 0.13 120 2261.99 2197.05 2720.92 0.76 0.69 0.87 0.77 0.07
0.1% 0 0 0 0 0.00 0.00 0.00 0.00 0.00 Aloe vera 20 383.58 322.02 285.28 0.13 0.09 0.07 0.10 0.03
& 40 531.86 376.11 434.80 0.15 0.11 0.11 0.12 0.02 TMC 60 593.53 553.00 588.53 0.16 0.15 0.14 0.15 0.01 0:10 80 604.06 603.08 735.135 0.17 0.17 0.17 0.17 0.00
100 693.94 700.14 790.60 0.19 0.19 0.18 0.19 0.00 120 867.20 701.21 809.48 0.22 0.19 0.19 0.20 0.02

187
Table B.11: Papp values of combination 4 (Aloe vera and TMC) at concentration 0.1% w/v
across Caco-2 cell monolayers
Group AP-BL
(Papp x 10-8) (n=3)
Well
1
Well
2
Well
3
Aloe vera and TMC 10:0 2.12 0.20 2.24
Aloe vera and TMC 8:2 3.86 3.36 3.95
Aloe vera and TMC 5:5 70.1 60.9 52.2
Aloe vera and TMC 2:8 17.6 17.2 22.0
Aloe vera and TMC 0:10 5.12 5.24 5.37
Table B.12: P-values for Papp values of combination 4 (Aloe vera and TMC) at concentration
0.1% w/v across Caco-2 cell monolayers comparing to the control groups
Group n Papp x10-8 SD p-value: Dunnett
(cm/s)
ANOVA Pos. Contr. Neg. Contr.
0.1% AV_TMC 10:0 3 1.5 0.09 0.78133 0.98332
0.1% AV_TMC 8:2 3 3.7 0.03 0.97400 0.78868
0.1% AV_TMC 5:5 3 61.1 0.73 0.00001* 0.00001*
0.1% AV_TMC 2:8 3 18.9 0.22
0.00819* 0.00034*
0.1% AV_TMC 0:10 3 5.2 0.01 - 0.47909
Positive control 3 5.2 0.01 0.00000*
Negative control 3 0.7 0.002 0.00000*
* Statistically significantly different at 0.05 level

188
B.5 Combination 5: Aloe ferox and TMC
Table B.13: Peak areas of in vitro transport and percentage transport of combination 5
(Aloe ferox and TMC) at concentration 0.1% w/v across Caco-2 cell monolayers
Experiment Time (min)
AP-BL (Peak area)
AP-BL (Percentage transport)
Well 1 Well 2 Well 3 Well 1
Well 2
Well 3
Mean SD
0.1% 0 0.00 0.00 0.00 0.00 0.00 0.00 0.00 0.00 Aloe ferox 20 327.08 347.07 307.08 0.07 0.08 0.07 0.08 0.01
& 40 340.56 367.77 313.36 0.08 0.10 0.08 0.09 0.01 TMC 60 911.21 930.48 891.94 0.18 0.20 0.18 0.19 0.01 10:0 80 957.71 995.12 920.31 0.20 0.23 0.20 0.21 0.01
100 1093.4 1101.8 1085 0.22 0.25 0.23 0.24 0.01 120 1157.9 1204.5 1111.3 0.24 0.27 0.24 0.25 0.01
0.1% 0 0.00 0.00 0.00 0.00 0.00 0.00 0.00 0.00 Aloe ferox 20 0.00 0.00 0.00 0.04 0.04 0.04 0.04 0.00
& 40 112.12 124.69 118.40 0.07 0.08 0.08 0.08 0.00 TMC 60 137.32 135.57 136.45 0.09 0.09 0.09 0.09 0.00 8:2 80 141.37 141.15 141.26 0.09 0.09 0.09 0.09 0.00
100 659.34 582.40 620.87 0.24 0.22 0.24 0.23 0.01 120 1140.22 1270.21 1288.82 0.41 0.45 0.46 0.44 0.02
0.1% 0 0.00 0.00 0.00 0.00 0.00 0.00 0.00 0.00 Aloe ferox 20 813.39 588.73 643.16 0.31 0.22 0.24 0.25 0.04
& 40 891.79 646.46 748.38 0.38 0.26 0.31 0.31 0.05 TMC 60 1002.44 717.30 919.62 0.42 0.29 0.36 0.36 0.05 5:5 80 1182.51 829.29 978.90 0.48 0.32 0.39 0.40 0.07
100 1356.01 970.34 1163.48 0.55 0.37 0.45 0.46 0.07 120 2007.89 1079.63 1432.97 0.77 0.41 0.54 0.57 0.15
0.1% 0 0.00 0.00 0.00 0.00 0.00 0.00 0.00 0.00 Aloe ferox 20 78.93 87.19 83.06 0.07 0.07 0.07 0.07 0.00
& 40 98.61 105.46 102.04 0.08 0.08 0.08 0.08 0.00 TMC 60 160.82 109.62 135.22 0.10 0.08 0.09 0.09 0.01 2:8 80 502.53 571.06 536.79 0.20 0.23 0.23 0.22 0.01
100 569.56 673.70 621.63 0.24 0.29 0.27 0.27 0.02 120 768.34 678.80 723.57 0.31 0.30 0.31 0.31 0.01
0.1% 0 0.00 0.00 0.00 0.00 0.00 0.00 0.00 0.00 Aloe ferox 20 383.58 322.02 285.28 0.13 0.09 0.07 0.10 0.03
& 40 531.86 376.11 434.80 0.15 0.11 0.11 0.12 0.02 TMC 60 593.53 553.00 588.53 0.16 0.15 0.14 0.15 0.01 0:10 80 604.06 603.08 735.13 0.17 0.17 0.17 0.17 0.00
100 693.94 700.14 790.60 0.19 0.19 0.18 0.19 0.00 120 867.20 701.21 809.48 0.22 0.19 0.19 0.20 0.02
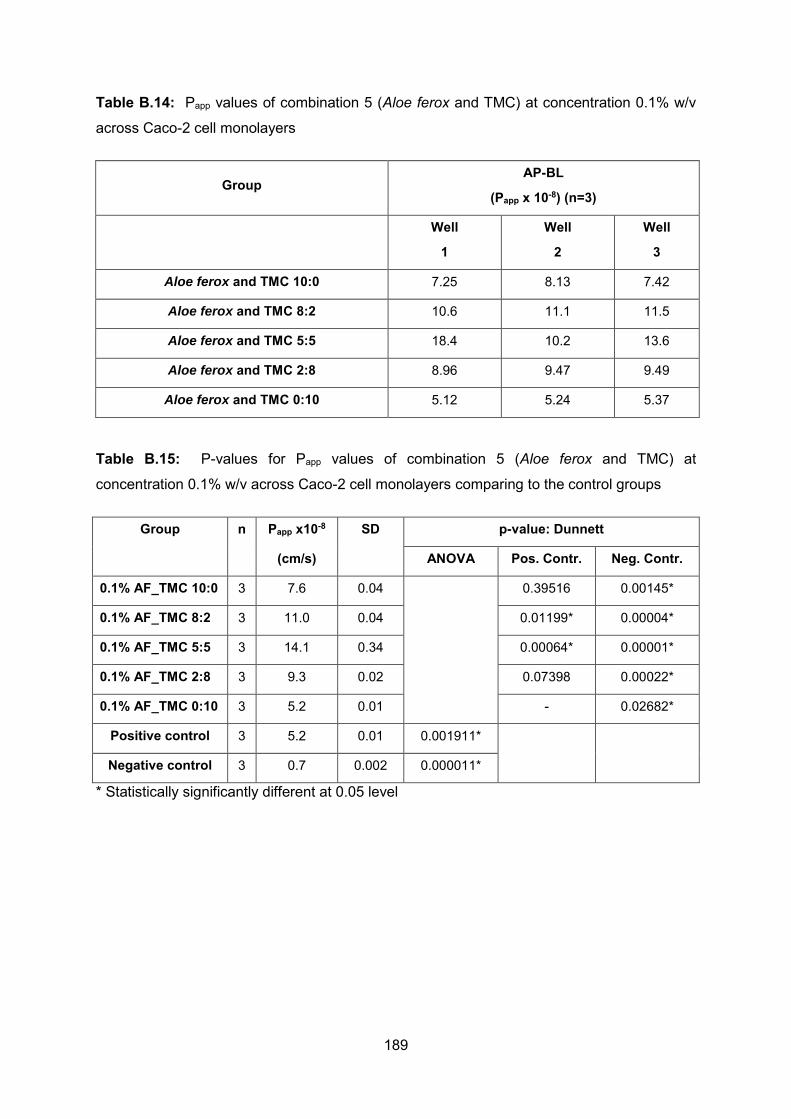
189
Table B.14: Papp values of combination 5 (Aloe ferox and TMC) at concentration 0.1% w/v
across Caco-2 cell monolayers
Group AP-BL
(Papp x 10-8) (n=3)
Well
1
Well
2
Well
3
Aloe ferox and TMC 10:0 7.25 8.13 7.42
Aloe ferox and TMC 8:2 10.6 11.1 11.5
Aloe ferox and TMC 5:5 18.4 10.2 13.6
Aloe ferox and TMC 2:8 8.96 9.47 9.49
Aloe ferox and TMC 0:10 5.12 5.24 5.37
Table B.15: P-values for Papp values of combination 5 (Aloe ferox and TMC) at
concentration 0.1% w/v across Caco-2 cell monolayers comparing to the control groups
Group n Papp x10-8 SD p-value: Dunnett
(cm/s)
ANOVA Pos. Contr. Neg. Contr.
0.1% AF_TMC 10:0 3 7.6 0.04 0.39516 0.00145*
0.1% AF_TMC 8:2 3 11.0 0.04 0.01199* 0.00004*
0.1% AF_TMC 5:5 3 14.1 0.34 0.00064* 0.00001*
0.1% AF_TMC 2:8 3 9.3 0.02 0.07398 0.00022*
0.1% AF_TMC 0:10 3 5.2 0.01 - 0.02682*
Positive control 3 5.2 0.01 0.001911*
Negative control 3 0.7 0.002 0.000011*
* Statistically significantly different at 0.05 level

190
B.6 Combination 6: Aloe marlothii and TMC
Table B.16: Peak areas of in vitro transport and percentage transport of combination 6
(Aloe marlothii and TMC) at concentration 0.1% w/v across Caco-2 cell monolayers
Experiment Time (min)
AP-BL (Peak area)
AP-BL (Percentage transport)
Well 1
Well 2
Well 3
Well 1
Well 2
Well 3
Mean SD
0.1% 0 0 0 0 0.00 0.00 0.00 0.00 0.00 Aloe 20 89.41 98.95 89.45 0.04 0.04 0.04 0.04 0.00
marlothii 40 164.22 106.95 165.33 0.06 0.05 0.06 0.06 0.01 & 60 189.02 177.99 200.05 0.07 0.06 0.07 0.07 0.00
TMC 80 196.36 157.95 234.76 0.07 0.06 0.08 0.07 0.01 10:0 100 266.88 178.99 227.62 0.08 0.06 0.08 0.08 0.01
120 351.56 195.93 318.05 0.10 0.07 0.10 0.09 0.01 0.1% 0 0.00 0.00 0.00 0.00 0.00 0.00 0.00 0.00 Aloe 20 87.823 103.06 89.34 0.06 0.06 0.06 0.06 0.00
marlothii 40 98.47 110.79 135.67 0.06 0.07 0.08 0.07 0.01 & 60 157.31 136.79 147.05 0.08 0.08 0.08 0.08 0.00
TMC 80 625.90 462.22 557.81 0.22 0.18 0.21 0.20 0.02 8:2 100 1414.70 930.90 1199.90 0.47 0.33 0.41 0.41 0.06
120 1588.10 1792.50 1633.13 0.56 0.61 0.57 0.58 0.02 0.1% 0 0.00 0.00 0.00 0.00 0.00 0.00 0.00 0.00 Aloe 20 632.59 561.65 384.95 0.20 0.18 0.14 0.17 0.03
marlothii 40 1232.70 958.00 394.51 0.39 0.32 0.16 0.29 0.10 & 60 1749.28 1214.58 490.72 0.56 0.41 0.18 0.38 0.15
TMC 80 2001.13 1484.71 575.13 0.65 0.49 0.21 0.45 0.18 5:5 100 2153.70 1590.20 1154.80 0.70 0.53 0.38 0.54 0.13
120 2425.50 1727.40 1234.80 0.78 0.57 0.42 0.59 0.15 0.1% 0 0.00 0.00 0.00 0.00 0.00 0.00 0.00 0.00 Aloe 20 0.00 0.00 0.00 0.00 0.00 0.00 0.00 0.00
marlothii 40 86.58 113.58 120.13 0.06 0.06 0.06 0.06 0.00 & 60 113.21 111.53 132.30 0.07 0.07 0.07 0.07 0.00
TMC 80 87.49 122.59 158.44 0.06 0.07 0.08 0.07 0.01 2:8 100 127.22 174.52 195.34 0.07 0.08 0.09 0.08 0.01
120 181.39 197.77 197.51 0.09 0.09 0.09 0.09 0.00 0.1% 0 0 0 0 0.00 0.00 0.00 0.00 0.00 Aloe 20 383.58 322.02 285.28 0.13 0.09 0.07 0.10 0.03
marlothii 40 531.86 376.11 434.80 0.15 0.11 0.11 0.12 0.02 & 60 593.53 553.00 588.53 0.16 0.15 0.14 0.15 0.01
TMC 80 604.06 603.08 735.13 0.17 0.17 0.17 0.17 0.00 100 693.94 700.14 790.60 0.19 0.19 0.18 0.19 0.00 120 867.20 701.21 809.48 0.22 0.19 0.19 0.20 0.02
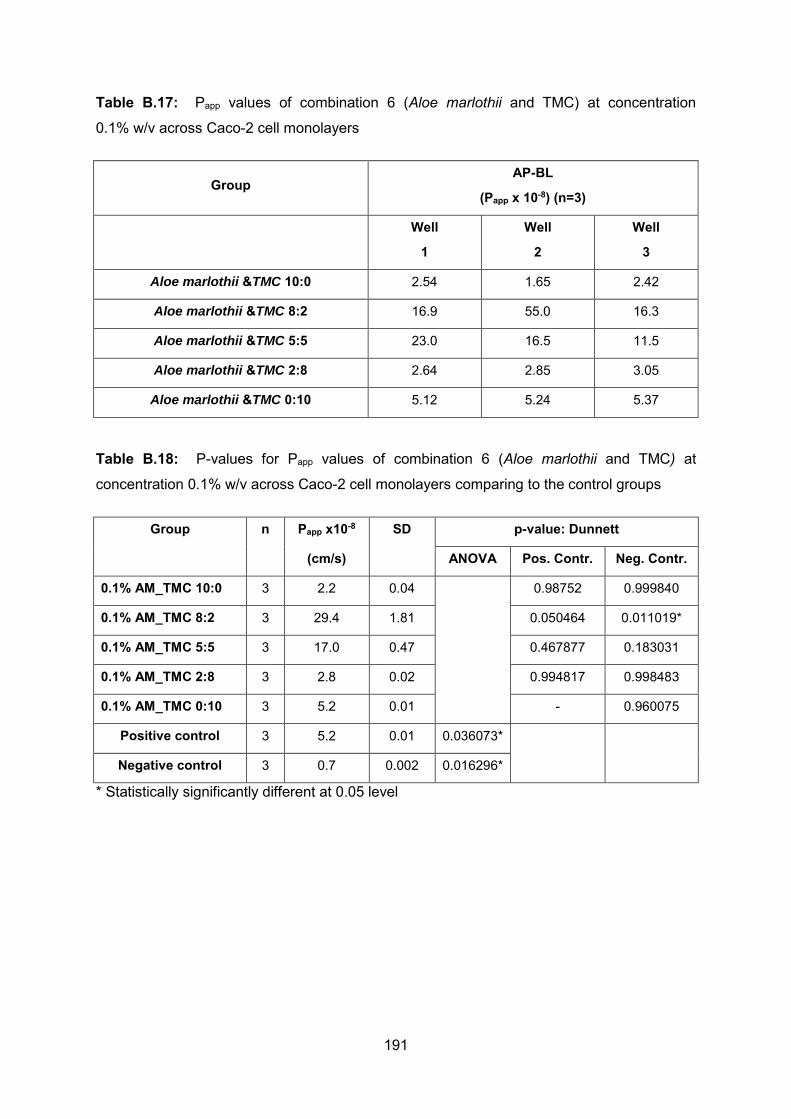
191
Table B.17: Papp values of combination 6 (Aloe marlothii and TMC) at concentration
0.1% w/v across Caco-2 cell monolayers
Group AP-BL
(Papp x 10-8) (n=3)
Well
1
Well
2
Well
3
Aloe marlothii &TMC 10:0 2.54 1.65 2.42
Aloe marlothii &TMC 8:2 16.9 55.0 16.3
Aloe marlothii &TMC 5:5 23.0 16.5 11.5
Aloe marlothii &TMC 2:8 2.64 2.85 3.05
Aloe marlothii &TMC 0:10 5.12 5.24 5.37
Table B.18: P-values for Papp values of combination 6 (Aloe marlothii and TMC) at
concentration 0.1% w/v across Caco-2 cell monolayers comparing to the control groups
Group n Papp x10-8 SD p-value: Dunnett
(cm/s)
ANOVA Pos. Contr. Neg. Contr.
0.1% AM_TMC 10:0 3 2.2 0.04 0.98752 0.999840
0.1% AM_TMC 8:2 3 29.4 1.81 0.050464 0.011019*
0.1% AM_TMC 5:5 3 17.0 0.47 0.467877 0.183031
0.1% AM_TMC 2:8 3 2.8 0.02 0.994817 0.998483
0.1% AM_TMC 0:10 3 5.2 0.01 - 0.960075
Positive control 3 5.2 0.01 0.036073*
Negative control 3 0.7 0.002 0.016296*
* Statistically significantly different at 0.05 level
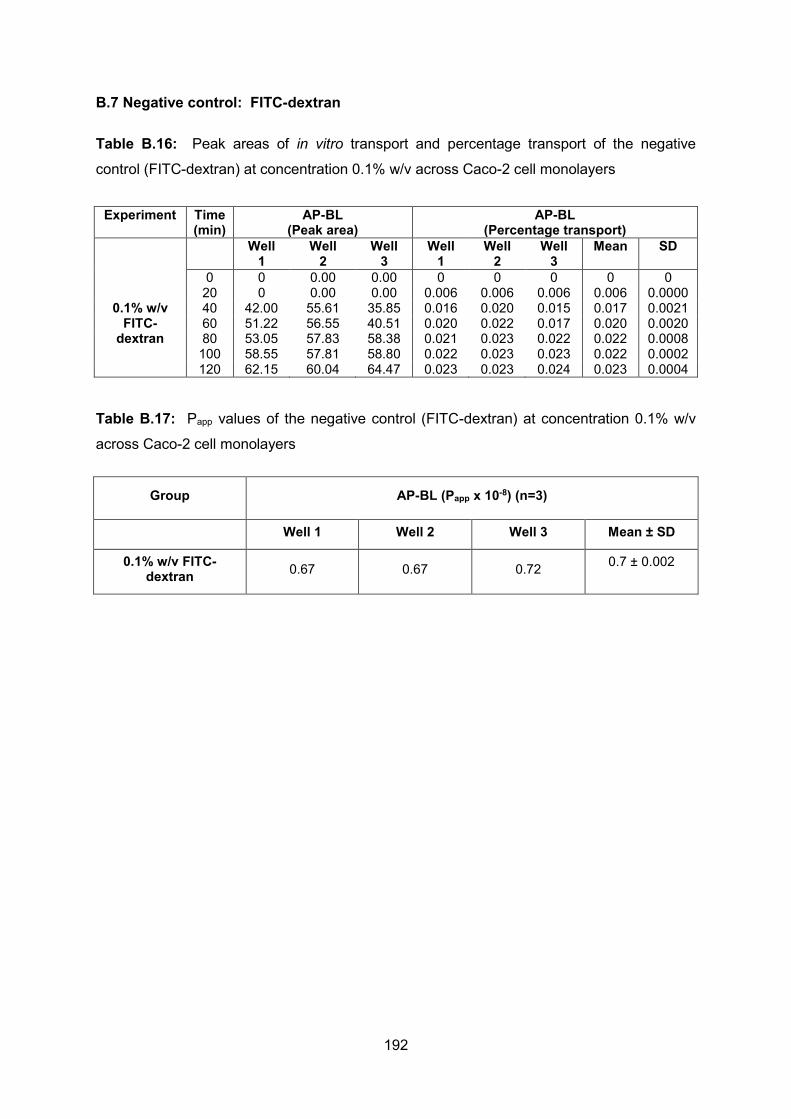
192
B.7 Negative control: FITC-dextran
Table B.16: Peak areas of in vitro transport and percentage transport of the negative
control (FITC-dextran) at concentration 0.1% w/v across Caco-2 cell monolayers
Table B.17: Papp values of the negative control (FITC-dextran) at concentration 0.1% w/v
across Caco-2 cell monolayers
Group AP-BL (Papp x 10-8) (n=3)
Well 1 Well 2 Well 3 Mean ± SD
0.1% w/v FITC-dextran 0.67 0.67 0.72 0.7 ± 0.002
Experiment Time (min)
AP-BL (Peak area)
AP-BL (Percentage transport)
Well 1
Well 2
Well 3
Well 1
Well 2
Well 3
Mean SD
0 0 0.00 0.00 0 0 0 0 0 20 0 0.00 0.00 0.006 0.006 0.006 0.006 0.0000
0.1% w/v 40 42.00 55.61 35.85 0.016 0.020 0.015 0.017 0.0021 FITC- 60 51.22 56.55 40.51 0.020 0.022 0.017 0.020 0.0020
dextran 80 53.05 57.83 58.38 0.021 0.023 0.022 0.022 0.0008 100 58.55 57.81 58.80 0.022 0.023 0.023 0.022 0.0002 120 62.15 60.04 64.47 0.023 0.023 0.024 0.023 0.0004

193
B.8 Positive control: FITC-dextran and TMC
Table B.16: Peak areas of in vitro transport and percentage transport of the positive control
(FITC-dextran and TMC) at concentration 0.1% w/v across Caco-2 cell monolayers
Table B.17: Papp values of the positive control (FITC-dextran and TMC) at concentration
0.1% w/v across Caco-2 cell monolayers
Group AP-BL (Papp x 10-8) (n=3)
Well 1 Well 2 Well 3 Mean ± SD
0.1% w/v FITC-dextran and TMC 5.12 5.24 5.37 5.2 ± 0.01
Experiment Time (min)
AP-BL (Peak area)
AP-BL (Percentage transport)
Well 1
Well 2
Well 3
Well 1
Well 2
Well 3
Mean SD
0 0 0.00 0.00 0 0 0 0 0 0.1% w/v 20 383.59 322.02 285.28 0.133 0.090 0.071 0.098 0.026
FITC- 40 531.86 376.12 434.81 0.146 0.112 0.106 0.121 0.018 dextran 60 593.53 553.00 588.53 0.163 0.150 0.137 0.150 0.012
and 80 604.06 603.09 735.14 0.168 0.166 0.168 0.167 0.000 TMC 100 693.95 700.15 790.60 0.186 0.188 0.182 0.185 0.003
120 867.20 701.21 809.49 0.224 0.191 0.187 0.201 0.017

194
ADDENDUM C CONFERENCE PROCEEDINGS AND ARTICLES

30 July 2014
CERTIFICATE OF PRESENTATION
This is to certify that
Miss. Trizel Du ToitNorth-West University, Centre of Excellence for
Pharmaceutical Sciences (Pharmacen)Presented the following Abstract Poster titled
Combining chemical permeation enhancers for improved drug delivery
On Monday 2014/07/14 12h00 - 13h30
At the 17th World Congress of Basic and Clinical Pharmacology (WCP2014)held at the Cape Town International Convention Centre (CTICC) in Cape Town,
South Africa from 13-18 July 2014
Prof Douglas W OliverPresident: WCP2014Tel: +27 (0)11 463 [email protected]
195

196
COMBINING CHEMICAL PERMEATION ENHANCERS FOR IMPROVED DRUG DELIVERY
Trizel du Toit1, Maides M Malan1, Hendrik JR Lemmer2, Wilma J Breytenbach3, Josias H Hamman2
1Dept of Pharmaceutics, School of Pharmacy, 2Centre of Excellence for Pharmaceutical Sciences, Faculty of Health Sciences, 3Statistical Consultation Service North-West University, Private Bag X6001, Potchefstroom, South Africa, 2520
BACKGROUND:
Although many oral drug absorption enhancers have been investigated for the delivery of
protein and peptide therapeutic molecules, very few are in clinical use. The search for more
effective drug absorption enhancers has led to the use of combinations. Leaf materials of
selected aloe species have previously shown potential to act as absorption enhancers for
improved delivery of peptide drugs across the intestinal epithelium.
The aim of this study is to determine whether combinations of intestinal drug absorption
enhancers would potentiate their individual effects, which will ultimately provide higher drug
transport enhancement at lower concentrations.
METHODS:
The effect of combinations of Aloe vera, Aloe ferox and Aloe marlothii leaf gel materials as
well as N-trimethyl chitosan chloride (TMC) was measured on the transepithelial electrical
resistance (TEER) of Caco-2 cell monolayers as an indication of tight junction modulation.
Each combination consisted of two materials mixed in five different ratios namely 10:0, 8:2,
5:5, 2:8, 0:10 at two concentrations namely 0,1% w/v and 0,5% w/v. The TEER data was
processed by means of the isobole method to determine the type of interaction between the
absorption enhancers in combination, namely additive, synergistic or antagonistic.
RESULTS:
The results clearly showed synergism between Aloe vera and Aloe marlothii, Aloe marlothii
and Aloe ferox as well as Aloe vera and TMC in terms of TEER reduction, which was optimal

197
at a ratio of 8:2. Interestingly, the synergism occurred only at the lower concentration of
0.1% w/v, while antagonism was detected at a concentration of 0.5% w/v. This can probably
be explained by chemical reactions such as complex formation or other interactions when a
threshold concentration is exceeded. Antagonistic effects were found between Aloe
marlothii and TMC as well as Aloe ferox and TMC at both concentrations tested.
CONCLUSION:
This study indicated that combinations of certain drug absorption enhancers resulted in
synergetic effects in terms of tight junction modulation of epithelial cell monolayers, while
others caused antagonistic effects. The interactions between the absorption enhancers in
combination were concentration dependent in some cases.

198
199
Combining chemical permeation enhancers for synergistic effects
Trizel du Toit1, Maides M Malan1, Hendrik JR Lemmer2, Wilma J Breytenbach3, Josias H Hamman2
1Dept of Pharmaceutics, School of Pharmacy, 2Centre of Excellence for Pharmaceutical Sciences, Faculty of Health Sciences, 3Statistical Consultation Service North-West University, Private Bag X6001, Potchefstroom, South Africa, 2520
Purpose: Therapeutic proteins are currently mainly administered by means of injections
because of its low intestinal epithelial permeability. The purpose of this study is to investigate
binary combinations of permeation enhancers to create synergistic drug permeation
enhancer formulations for effective oral delivery of peptide drugs.
Methods: The effect of combinations of Aloe vera, Aloe ferox and Aloe marlothii leaf gel
materials as well as N-trimethyl chitosan chloride (TMC) was measured on the transepithelial
electrical resistance (TEER) of Caco-2 cell monolayers as well as the transport of FITC-
dextran across Caco-2 cell monolayers. Each combination consisted of two materials mixed
in five different ratios namely 10:0, 8:2, 5:5, 2:8, 0:10 at concentrations of 0.1% w/v and
0.5% w/v. The data was processed by the isobole method to determine the type of
interaction between the absorption enhancers (e.g. synergistic, additive or antagonistic).
Results: The results showed synergism for the following combinations: A. vera and A.
marlothii, A. marlothii and A. ferox as well as A. vera and TMC in terms of TEER reduction.
Synergism occurred at some concentrations and at some ratios, while antagonism was
detected at other concentrations and ratios. The antagonism interactions can probably be
explained by chemical reactions between the chemical permeation enhancers such as
complex formation. Antagonistic effects were found between A. marlothii and TMC as well
as A. ferox and TMC at both concentrations.
In terms of FITC-dextran transport, synergism was found for the following combinations: A.
vera and A. marlothii, A. vera and A. ferox and A. marlothii and A. ferox at concentration
0.5% w/v, whereas antagonism was observed for these same combinations at 0.1% w/v.
From these results it is evident that the presence of FITC-dextran may have influenced the
chemical reactions between the chemical permeation enhancers.

200
Conclusion: This study indicated that combinations of certain drug absorption enhancers
resulted in synergetic effects in terms of tight junction modulation, while others caused
additive or antagonistic effects. The combinations where synergism was obtained have
potential to be used as effective drug absorption enhancers. The antagonistic interactions
can possibly be explained by chemical reactions such as complex formation between the
chemical permeation enhancers when a threshold concentration is exceeded.

201

202
203

204

205
206

207
208

209

210

211

212
213

214
215

216
COMBINING CHEMICAL PERMEATION ENHANCERS FOR SYNERGISTIC EFFECTS
Trizel du Toit1, Maides M Malan1, Hendrik JR Lemmer1, Chrisna Gouws1, Marique E
Aucamp1, Wilma J Breytenbach2, Josias H Hamman1*
1Centre of Excellence for Pharmaceutical Sciences, Faculty of Health Sciences, 2Statistical
Consultation Service North-West University, Private Bag X6001, Potchefstroom, South
Africa, 2520
* Corresponding author:
JH Hamman (PhD),
Centre of Excellence for Pharmaceutical Sciences,
North-West University,
Private Bag X6001,
Potchefstroom,
2520,
South Africa.
Tel.: +2718 299 4035; Fax: +2787 231 5432
E-mail address: [email protected]

217
ABSTRACT
Currently, therapeutic proteins are mainly administered by means of injections due to their
low intestinal epithelial permeability. The purpose of this study is to investigate binary
combinations of chemical drug absorption enhancers and to determine if synergistic drug
absorption enhancement effects exist. Aloe vera, Aloe ferox and Aloe marlothii leaf gel
materials, as well as with N-trimethyl chitosan chloride (TMC), were combined in different
ratios and their effects on the transepithelial electrical resistance (TEER), as well as the
transport of FITC-dextran across Caco-2 cell monolayers, were measured. The isobole
method was applied to determine the type of interaction that exists between the absorption
enhancers combinations. The TEER results showed synergism existed for the combinations
between A. vera and A. marlothii, A. marlothii and A. ferox as well as A. vera and TMC.
Antagonism interactions also occurred and can probably be explained by chemical reactions
between the chemical permeation enhancers, such as complex formation. In terms of FITC-
dextran transport, synergism was found for combinations between A. vera and A. marlothii,
A. marlothii and A. ferox, A. vera and TMC, A. ferox and TMC and A. marlothii and TMC,
whereas antagonism was observed for A. vera and A. ferox. The combinations where
synergism was obtained have the potential to be used as effective drug absorption
enhancers at lower concentrations compared to the single components.
Key words: absorption enhancer, Aloe vera, Aloe ferox, Aloe marlothii, synergism, isobole

218
INTRODUCTION
Due to ease of administration and patient acceptability, the oral route of administration
remains the preferred means of drug delivery (Daugherty & Mrsny, 1999:144). The term
“drug absorption,” with respect to oral administration, refers to the transport of drug
molecules from the site of administration across the intestinal epithelium and into the blood
surrounding the gastrointestinal tract (Hamman, 2007:189). Despite advances in
biotechnology and the emergence of protein and peptide based drugs as therapeutics for the
treatment of diseases such as Diabetes Mellitus (Antosova et al., 2009:628), these
therapeutic agents are mainly administered by means of the parenteral route due to their low
intestinal epithelial permeability (Crommelin et al., 2002:616). The parenteral route of
administration (e.g. subcutaneous injection) is associated with discomfort, a risk of infection,
hypertrophy of subcutaneous fatty tissue and immune response of the skin (Katzung,
2007:691-693).
One of the major challenges to achieve effective oral delivery of protein and peptide drugs is
the poor oral bioavailability due to poor penetration of the intestinal mucosa. Inclusion of
safe and effective absorptions enhancers in oral dosage forms is one approach to ensure
therapeutic levels after oral administration (Legen et al., 2004:183; Hamman et al.,
2005:165).
Absorption enhancers are compounds that temporarily disrupt or reversibly remove the
intestinal barrier with minimum tissue damage, thus allowing a drug to penetrate the
epithelial cells and enter the blood or lymph circulation (Muranishi, 1989:1). Several
compounds have shown the ability to enhance the absorption of drugs across the intestinal
epithelium. Chitosan and its derivative, N-trimethyl chitosan chloride (TMC), have shown the
ability to influence the integrity of epithelial tight junctions to increase paracellular transport
of large hydrophilic compounds (Kotzé et al., 1997:1197). Aloe vera gel enhanced the
bioavailability of co-administered vitamins when taken orally in humans (Vinson et al.,
2005:760). The gel and whole leaf materials from different aloe species as well as
precipitated polysaccharides from these materials improved insulin transport across in vitro
models such as Caco-2 cell monolayers and excised animal tissues (Beneke et al.,
2012:481; Lebitsa et al., 2012:297).
Synergism, is a concept which refers to a situation where the effect of a mixture of
compounds exceeds that expected from the effects of the individual components (Howard &
Webster, 2009:469). The use of binary combinations of permeation enhancers to create
synergistic drug absorption enhancing effects has been investigated within the Caco-2 cell

219
model. Some of the enhancer formulations (i.e. a combination of hexylamine and
chembetaine) have increased mannitol transport 15-fold and FITC-dextran transport 8-fold,
indicating the potential of achieving synergistic effects with combinations of absorption
enhancers (Whitehead et al., 2008:128). One of the most effective and practical methods, in
terms of experimental design to demonstrate synergism, is the isobole method. This method
is based on the concept of dose equivalence, which leads to the observation that if a
combination (da, db) is represented by a point in a graph, the axes of which represent doses
of A and B respectively, the point lies on the straight line joining Da and Db, thus satisfying
the equation da
Da + db
Db = 1, if and only if there are no drug interactions (Berenbaum, 1989:100).
The aim of this study is to determine if a synergistic drug absorption enhancement effect can
be obtained when combinations in different ratios of leaf gel materials of three aloe species,
namely Aloe vera, Aloe ferox and Aloe marlothii, as well as combinations with N-trimethyl
chitosan chloride (TMC), are applied to Caco-2 cell monolayers. Isobolograms were
constructed from the transport data of a model compound (FITC-dextran) to determine which
combinations of absorption enhancing agents produced synergistic effects.
I. MATERIALS AND METHODS
1. Materials
Aloe vera gel powder was sourced from Warren Chem (Johannesburg, South Africa), Aloe
ferox gel was obtained by freeze drying leaf pulp collected in the Western Cape Province of
South Africa by Organic Aloe Pty Ltd. (Albertinia, South Africa) and Aloe marlothii gel was
obtained by freeze drying leaf pulp collected in the North West Province of South Africa.
Caco-2 cells were purchased from the European Collection of Cell Cultures (ECACC by
Sigma Aldrich, South Africa), Transwell® plates (6.5 mm inserts, 24 well plates with a 0.33
cm2 membrane surface area) and Transwell® plates (24 mm inserts, 6 well plates with a 4.67
cm2 membrane surface area) were purchased from Corning Costar® Corporation (Manassas,
United States of America). Other materials for the cell culture experiments were sourced
from The Scientific Group (Randburg, South Africa), including HEPES [n-(2-hydroxyethyl),
piperazine-N-(2-ethanesulfonic acid)] buffer solution, amphotericin B, foetal bovine serum
(FBS) and Hank’s Balanced Salt Solution (HBSS) without phenol red. Dulbecco’s Modified
Eagle’s Medium (DMEM) with high glucose, 4.0 mM L-glutamine, sodium pyruvate and
penicillin/streptomycin solution were purchased from Separations (Randburg, South Africa).
L-glutamine (200 mM), non-essential amino acids (NEAA, 100x) and trypsin-versene (EDTA)
mixture (1x) were purchased from Whitehead Scientific (Cape Town, South Africa). The
following materials were purchased from Sigma-Aldrich (Johannesburg, South Africa):

220
Fluorescein isothiocyanate (FITC) dextran, trypan blue solution (0.4%) and phosphate
buffered saline (PBS). ChitoClear® (Chitosan) was purchased from Primex (Siglufjordur,
Iceland).
2. Absorption enhancer combinations
The binary combinations of the selected absorption enhancers are shown in Table 1, which
were each tested in five different ratios namely 10:0, 8:2, 5:5, 2:8, 0:10 and at two
concentrations of 0.1% w/v and 0.5% w/v for the TEER reduction studies.
Table 1: Composition of binary combinations of absorption enhancers investigated in five
different ratios
Combination Composition
1 A. vera gel and A. marlothii gel
2 A. vera gel and A. ferox gel
3 A. marlothii gel and A. ferox gel
4 A. vera gel and TMC
5 A. ferox gel and TMC
6 A. marlothii gel and TMC
3. Chemical fingerprinting of aloe leaf gel materials
All the aloe gel materials investigated in this study were chemically fingerprinted by means of
proton nuclear magnetic resonance (1H-NMR) spectroscopy to determine the presence of
marker molecules, which are commonly used to identify fresh aloe leaf gel material and to
certify aloe containing products (Chen et al., 2009:588; Jiao et al., 2010:842).
An amount of 35 mg of each gel material was dissolved separately in 2 ml of deuterium
oxide (D2O) with 5 mg 3-(trimethylsilyl)-propionic acid-D4 sodium salt (TPS) in an NMR tube
and filtered through cotton wool. The 1H-NMR spectra were recorded with an Avance III 600
Hz NMR spectrometer (Bruker BioSpin Corporation, Rheinstetlen, Germany) (Campestrini et
al., 2013:512).

221
4. Synthesis of N-trimethyl chitosan chloride
The N-trimethyl chitosan chloride (TMC) was synthesised based on the modified reductive
methylation method previously described (Polnok et al., 2004:78; Sieval et al., 1998:158).
4.1 Reaction step 1
For the first reaction step, 4 g of chitosan was dissolved in 160 ml of 1-methyl-2-
pyrrolidinone. This solution was heated in a water bath to 60°C and 9.6 g of sodium iodide,
22 ml of a 15% (w/v) aqueous sodium hydroxide (NaOH) solution and 23.5 ml of
iodomethane were added. A Liebig’s condenser was used to keep the iodomethane in
reaction. After reaching 60°C, the mixture was stirred for an hour and then removed from
the water bath. An excess of absolute ethanol was added to the mixture and it was left to
precipitate overnight.
4.2 Reaction step 2
The product obtained from reaction step 1 was washed several times with diethyl ether on a
glass filter and dried under vacuum. The polymer obtained was dissolved in 160 ml 1-
methyl-2-pyrrolidinone and 9.6 g of sodium iodide, 22 ml of a 15% (w/v) aqueous sodium
hydroxide (NaOH) solution and 23.5 ml of iodomethane were added. The reaction was
carried out in the presence of a Liebig’s condenser at 60°C, where it was stabilised for an
hour.
4.3 Prolongation of reaction step 2
At the end of reaction step 2, prior to precipitation of the product, an additional 5 ml of
iodomethane and 10 ml of a 15% (w/v) aqueous sodium hydroxide (NaOH) were added.
The reaction was then allowed to continue for another hour at 60°C. The product was
precipitated with absolute ethanol, washed with diethyl ether and dried under vacuum.
4.4 Ion-exchange step
To exchange the iodide ions on the product with chloride ions, the product obtained in the
aforementioned step was dissolved in 100 ml of 10% (w/v) sodium chloride solution and
consequently precipitated by using ethanol and diethyl ether. To remove the residual
sodium chloride, the products were repeatedly dissolved in water and precipitated with
ethanol and diethyl ether. The final product was thoroughly dried under vacuum.
222
4.5 Determination of the degree of quaternisation
The TMC polymer obtained from the synthesis reaction was chemically characterised by
means of proton nuclear magnetic resonance (1H-NMR) spectroscopy with an Avance III 600
Hz NMR spectrometer (Bruker BioSpin Corporation, Rheinstetlen, Germany). A sample of
the polymer (35 mg) was dissolved in 2 ml D2O and a spectrum obtained from the NMR
spectrometer at 80°C with suppression of the water peak. The degree of quaternisation was
calculated from the 1H-NMR spectrum using the combined integrals of the H-3, H-4, H-5, H-6
and H-6’ (6H) peaks at δ 3.6 – 4.5 and H-2 peak at 3.10 ppm. The following equation was
used to calculate the degree of quaternisation (Rúnarsson et al., 2007:2662):
% N-Trimethylation = [ [N(CH3)3][H-2, H-3, H-4, H-5, H-6, H-6’]
× 69] x 100 Eq. 1
Where [N(CH3)3] is the integral of the N-trimethyl singlet peak (3.30 ppm) and the integral H-
3, H-4, H-5, H-6 and H-6’ (6H) at δ 3.6 – 4.5 ppm and H-2 peak at δ 3.10 ppm represent six
protons. The quaternisation degree is expressed as the percentage trimethylation
(Rúnarsson et al., 2007:2662).
5. High-performance liquid chromatography analysis of FITC–dextran
Quantification of fluorescein isothiocyanate (FITC)–dextran in the transport samples was
carried out using high performance liquid chromatography (HPLC) with size exclusion
separation and fluorescence detection. The chromatographic system and conditions were
as follows: spectraphysics liquid chromatographic system equipped with a pump (model
P1000); autosampler (model AS3000); fluorescence detector (model FL2000), excitation
wavelength 494 nm and emission wavelength 518 nm; PolySep-GFC-P Linear size
exclusion column, 300 × 7.80 mm; and PolySep-GFC-P guard column, 35 × 7.80 mm
(Phenomenex, United States of America distributed by Separations, Johannesburg, South
Africa). The mobile phase consisted of acetonitrile: 0.05 M phosphate buffer (12:88)
delivered at a flow rate of 1 ml/min. The buffer component of the mobile phase was
prepared with deionised water and the pH was adjusted to 6.5.
6. Seeding and culturing of Caco-2 cell monolayers
Caco-2 cells (passages 52 – 60) were used for the TEER and in vitro transport studies. The
cells were seeded and grown into monolayers on tissue culture treated polycarbonate
permeable supports with an area of 0.33 cm² in Costar® Transwell® 24-well plates for the
TEER studies and on permeable supports (area 4.67 cm2) in Costar® Transwell® 6-well
plates at a concentration of 2 X 10⁴ cells/ml for both studies. Growth medium, consisting of

223
Dulbecco’s Modified Eagle’s Medium (DMEM, pH 7.4) supplemented with 10% v/v foetal
bovine serum (FBS), 2 mM L-glutamine, 1% v/v amphotericin B, 1% v/v non-essential amino
acids (NEAA) and 1% v/v penicillin/streptomycin solution, was added to both the donor and
acceptor chambers. The growth medium was changed every second day and the cell
monolayers were used 21-23 days after seeding. Caco-2 cells were cultured at 37 ºC in a
humidified atmosphere of 95% air and 5% CO2.
7. Transepithelial electrical resistance studies
A TEER value of the Caco-2 cell monolayers on the 24-well Transwell® plates of at least 750
Ω (or 247.5 Ω/cm2) was required prior to the commencement of the TEER experiments.
The growth medium was removed from the basolateral chambers using an aspirator (Integra
Vacusafe, Zizers, Switzerland) and replaced with 1 ml pre-warmed Hank’s Balanced Salt
Solution (HBSS) and incubated at 37°C for 30 min. The TEER of the Caco-2 cell
monolayers was measured using a Millicell ERS-2 meter (Millipore, Bedford, Massachusetts,
United States of America) connected to chopstick electrodes. The TEER was measured at
20 min intervals starting one hour prior to the addition of the test solutions on the apical
chamber of the cells and continued for two hours after the addition of the test solutions (i.e.
combinations of absorption enhancers as shown in Table 1 at concentrations of 0.1% w/v
and 0.5% w/v). TEER measurements for the control groups were recorded under the same
conditions. The normal control group consisted of the Caco-2 cells alone without addition of
any chemical permeation enhancer. The positive control group consisted of a solution of
TMC at a concentration of 0.1% w/v and 0.5% w/v, respectively, for the different
experiments, all of which were done in triplicate with the Transwell® plates kept in a CO2
incubator at 37ºC in a humidified atmosphere of 95% air and 5% CO2 (Lebitsa et al.,
2012:299).
8. In vitro transport studies
A TEER value of the Caco-2 cell monolayers on the 6-well Transwell® plates of at least 250
Ω (or 1167.5 Ω/cm2) was required prior to the commencement of the transport experiments.
Although the TEER experiments, as an initial screening for the effects of the chemical
permeation enhancer combinations, were conducted at two concentrations (i.e. 0.1 and 0.5
% w/v), the transport studies were conducted at the lowest concentration only (0.1% w/v).
The growth medium was removed from the basolateral chambers using an aspirator and
each basolateral chamber was filled with 2.5 ml pre-warmed DMEM buffered with HEPES (a
mixture of 39 ml DMEM and 1 ml HEPES) and incubated at 37°C for 30 min. The medium in

224
the apical chambers was then removed and 2.5 ml of each of the test solutions (i.e.
combinations of absorption enhancers as shown in Table 1 at a concentration of 0.1% w/v)
were applied. Samples of 400 µl were taken at 0, 20, 40, 60, 80, 100 and 120 min from the
basolateral chamber. The samples withdrawn were immediately replaced with an equal
volume of buffered DMEM. The normal control group contained a solution of FITC-dextran
without any permeation enhancer and the positive control group contained TMC (0.1% w/v)
together with FITC-dextran. Samples withdrawn were stored in HPLC vials until
quantification by HPLC.
9. Isothermal microcalorimetry
To determine whether physical and/or chemical interactions occurred between different
permeation enhancer combinations for each ratio, the method of isothermal microcalorimetry
was used. The usefulness of this method lies within its ability to detect small, low energy
interactions between compounds. A Thermal Activity Monitor (TAMIII) apparatus (TA
Instruments, New Castle, Delaware, United States of America) equipped with an oil bath with
a stability of ±100 µK over 24 h was used during this study. The temperature of the samples
(absorption enhancer combinations as shown in Table 1 at 0.1% w/v) was maintained at
60°C throughout the monitoring of the heat flow. To determine interactions between the
different materials used in the combinations studies, the heat flow was measured for the
single components as well as the combinations. The samples were run against an inert
reference (an empty sealed ampoule). The calorimetric outputs observed for the individual
samples were summed to give an additive hypothetical response. This calculated
hypothetical response represents an expected calorimetric output if the two materials do not
interact with each other. If the materials interact, the measured calorimetric response will
differ from the calculated hypothetical response. A heat flow difference of more than 100
µW/g was considered a significant difference indicative of a physical and/or chemical
interaction between two compounds. Correlation of the interaction data obtained by
microcalorimetry with the transport data enabled us to relate such interactions with either
synergistic or antagonistic effects. The physical and/or chemical interactions between
absorption enhancers in the different combinations, at each ratio, were therefore used to
help interpret or explain the effects obtained on the transport of FITC-dextran.
10. Data and statistics analysis
10.1 Percentage TEER reduction

225
The percentage TEER reduction was obtained by subtracting the percentage TEER values
at times 60 and 120 min from the TEER value at time 0 (i.e. 100%), which quantitatively
expresses the extent to which each experimental group opened the tight junctions between
Caco-2 cells in the monolayers.
10.2 Apparent permeability (Papp) coefficient values
Apparent permeability is defined as the initial flux of a compound across the membrane
normalised by membrane surface area and donor concentration. This index is widely used
as part of a general screening process to study drug absorption with in vitro and ex vivo
experiments and is calculated by means of the following equation (Palumbo et al.,
2008:235):
Papp = dQdt
1(A.60.C0)
Eq.2
Where Papp is the apparent permeability coefficient (cm.s-1), dQ/dt is the permeability rate
(amount permeated per minute), A is the diffusion area of the monolayer (cm²) and C0 is the
initial concentration of the model drug.
10.3 Isobole method
According to Berenbaum (1989:98), the zero-interaction or additive effect relies on the
mechanism that the combined effect of two components is a pure summation effect
(Equation 3). This means the components do not interact and the line connecting the point
is representative of the single doses with the same effect as the combinations, will be a
straight line (Williamson, 2001:403; Berenbaum, 1989: 98). If synergism occurs, the total
effect of two components that are applied together as a mixture must be greater than it
would be expected by the summation of the component’s separate effects (Wagner & Ulrich-
Mezenich, 2009:99; Breitinger, 2012:158). This will result in a concave curve and are
defined by Equation 4. The opposite applies for antagonism, in which case an overall effect
of two components is less than expected from the summation of the effects obtained from
the individual components (Williamson, 2001:403; Berenbaum, 1989:98; Breitinger,
2012:158). Antagonistic interactions will result in a convex curve and can be defined by
Equation 5.
E(da, db) = E(da) + E(db) Eq. 3
E(da, db) > E(da) + E(db) Eq. 4

226
E(da, db) < E(da) + E(db) Eq. 5
Where E is the observed effect, and da and db are the doses of components a and b.
Since the isobole method was originally designed to use the doses of two or more drugs,
with constant potency ratios needed to achieve a specific therapeutic effect, it had to be
modified to accommodate components of unknown molecular weight. The need for this
modification arises from the difficulty in isolating the individual components of a complex
mixture such as the aloe gel and whole leaf materials used in this study. To achieve this, the
isobole method was extended to a higher dimensional multivariable problem in which the
isobologram is seen as the n-dimensional reflection from an (n+1)-dimensional hyperspace
containing the drug ratios and observed effects, where n is the number of drugs being
tested. This (n+1)-dimensional isobologram depends explicitly on the observed effects and
relates the ratios of the therapeutic agents to its corresponding effects in such a way that all
the information usually found in the classic n-dimensional isobologram is maintained. This
enables the researcher to obtain the desired drug interaction information directly from the
ratios and its corresponding effects. Although mathematical proof is not presented in this
paper, it can be shown mathematically that the drug ratio-effect data can be expressed as
vectors in ℝn+1 which all extend from the origin to an n-dimensional plane that is normal to
the ratio axes. This (n+1)-dimensional isobologram can be related to the classic n-
dimensional isobologram by the matrix T, in that T: V → W is a linear transformation, where
V is the basis drug ratio-effect vectors and W is the basis drug dose vectors of the
isobologram. If a polynomial is fitted to the points on the isobologram, a similar polynomial
can be fitted to the drug ratio-effect points, containing the same maxima, minima and
inflection points. The method used to draw the (n+1)-dimensional isobolograms and the
procedure can easily be adapted to any computer software package.
The procedure (presented here for n = 2):
Express the ratios and corresponding effects as vectors in matrix form, e.g.
A =
[
1 0 Eda
0.8 0.2 E(da,db)0.5 0.5 E(da,db)0.2 0.8 E(da,db)0 1 Edb ]
Find the equation of a plane that extends from the origin through the points (1, 0, Eda) and
(0, 1, Edb) to the point (1, 1, Eda + Edb). Let p be a point on the plane and let n be a vector
orthogonal to the plane, which can be found by:

227
𝑑𝑒𝑡 |i j k1 0 Eda
0 1 Edb
|
The Cartesian equation of the plane through the origin can therefore be found from the point
products
(𝑥, 𝑦, 𝑧) ∙ (𝑛) = (𝑝) ∙ (𝑛) Eq 6
Calculate the values of z (the effect axis) which correspond to the different ratios. These z-
values represent the expected additive effect values. Express the ratios and corresponding
additive effects as vectors in matrix form, e.g.:
B =
[
1 0 Eda
0.8 0.2 Eda+Edb
0.5 0.5 Eda+Edb0.2 0.8 Eda+Edb
0 1 Edb ]
The matrices A and B were plotted to obtain a 3D graph containing the experimental and
expected additive values associated with each drug ratio.
10.4 Statistical analysis of results
The following statistical tests were done using Statistica software (StatSoft, Inc. 2012, Tulsa,
Oklahoma, United States of America) to determine if the mean effects obtained from the
combinations of permeation enhancers differed from those of the control group by a
statistically significant amount. All tests were performed at the 0.05 level of significance.
One-way analyses of variance (ANOVA) were done to determine if statistical significant
differences exist between the mean percentage TEER reduction values of the experimental
groups and each of the control groups in general. These procedures were also done when
analysing the mean Papp values to determine significant differences between the
experimental groups and each of the control groups. These were done for TEER data on
concentrations 0.1% w/v and 0.5% w/v and for transport data on concentration 0.1% w/v.
Levenes’ tests were performed in each ANOVA’s case to assure equality of variances. In
cases of inequality of variances, Welch tests were performed. Normal probability plots on
the residuals were done in each analysis to ensure the data was fairly normally distributed
(Tabachnick & Fidell, 2001). Dunnett’s post-hoc tests were finally done in each ANOVA’s
case to determine which of the test compounds’ means differed statistically significantly from
the means of each of the control compounds.

228
II. RESULTS AND DISCUSSION
1. Chemical fingerprinting of aloe leaf gel materials
The 1H-NMR spectra obtained for A. vera, A. marlothii and A. ferox are respectively
illustrated in Figure 1. It is evident, from the 1H-NMR spectrum of A. vera leaf gel material,
that the marker molecules for fresh A. vera gel material namely aloverose (partly acetylated
polymannan or acemannan), glucose and malic acid are present together with low levels of
lactic acid and formic acid. In general, high amounts of lactic acid can indicate bacterial
degradation due to Lactobacillus, while acetic acid and formic acid are present due to
hydrolysis of aloverose and thermal degradation of glucose during storage.
According to the 1H-NMR spectra of the A. marlothii and A. ferox leaf gel materials, glucose
and small amounts of lactic acid are present. Other phytochemicals such as malic acid,
acetic acid, formic acid, citric acid and benzoic acid are also identifiable on the spectra, but
aloverose is absent. These findings are in accordance with previously published data, which
showed aloe species indigenous to South Africa (e.g. A. ferox) do not contain aloverose
(O’Brien 2011).

229
Figure 1: 1H-NMR spectra of the (a) Aloe vera leaf gel material, (b) Aloe marlothii leaf gel
material and (c) Aloe ferox leaf gel material investigated in this study

230
2. Degree of quaternisation of N-trimethyl chitosan chloride
The 1H-NMR spectrum obtained for the synthesised TMC is shown in Figure 2, followed by
the calculation of the degree of quaternisation.
Figure 2: 1H-NMR spectrum of N-trimethyl chitosan chloride (TMC)
% N-Trimethylation = [[N(CH3)3]
[H-2, H-3, H-4, H-5, H-6, H-6’]x 6
9] x 100
= [ [22.21][28.78+0.36]
x 69] x 100
= 50.81 %
Where [N(CH3)3], [N(CH3)2], [N(CH3)] are the integrals of the N-trimethylamino (3.30 ppm),
N,-dimethylamino (δ 2.87 ppm or 3.00 ppm) and N-monomethylamino (δ 2.77 ppm or 2.80
ppm) singlet peaks, respectively.
3. Transepithelial electrical resistance (TEER) studies
The percentage TEER reduction values after 120 min exposure to the different absorption
enhancer combinations at concentrations of 0.1% w/v and 0.5% w/v, respectively, are shown

231
in Figure 3 (a) and (b). The TEER of the negative control group (i.e. Caco-2 cell monolayers
without chemical enhancer addition) remained constant at, or slightly above, the initial TEER
value, which indicated the cell monolayers stayed intact and therefore a 0% reduction was
recorded for this group.
Figure 3: Percentage TEER reduction of Caco-2 cell monolayers at 120 min for all
combinations at (a) concentration 0.1% w/v and (b) concentration 0.5% w/v. Bars on the
graph marked with * indicates statistically significant differences with the negative control
group (p ≤ 0.05)
0
10
20
30
40
50
60
70
80
90
100
AV/AM AV/AF AM/AF AV/TMC AF/TMC AM/TMC
% T
EER
Red
uctio
n
10:0 8:2
5:5
2:8
0:10
AV / AMCombination 1
*
*
AV / AFCombination 2
AM / AFCombination 3
AV / TMCCombination 4
AF / TMCCombination 5
AM / TMCCombination 6
5:5
2:8
0:10
*
*
* **
* *
*
*
*
*
*
*
*
*
*
*
*
*
2:8
0:10
10:0 8:2
5:5
2:8
0:10
10:0 8:2
5:5
2:8
0:10
10:0 8:2
5:5
2:8
0:10
10:0 8:2
0
10
20
30
40
50
60
70
80
90
100
1 2 3 4 5 6
% T
EER
redu
ctio
n
5:5
2:8
0:1
10:0
10:0
10:0
10:0
10:0
8:2
8:2
8:2
8:2
8:2
5:5
5:5
5:5
5:5
5:5
2:8
2:8
2:8
2:8
2:8
0:1
0:1
0:10
0:10
0:10
*
* **
*
*
*
*
*
*
*
AV / AMCombination 1
AV / AFCombination 2
AM / AFCombination 3
AV / TMCCombination 4
AF / TMCCombination 5
AM / TMCCombination 6
a
b

232
It is clear from Figure 3 (a) that some of the single absorption enhancers as well as some of
the combinations between the different aloe species gel materials had a statistically
significant (p ≤ 0.05) reduction effect on the TEER of the Caco-2 cell monolayers when
compared to the negative control group. A reduction in TEER is associated with opening of
tight junctions between epithelial cells to allow for paracellular transport of macromolecules.
Some of the aloe material combinations with TMC showed a higher TEER reduction effect
compared to those of the positive control group (i.e. TMC alone which is a well-known tight
junction modulator and absorption enhancer). In general, the TEER reduction effect of all
combination ratios at concentration 0.5% w/v was higher than at concentration 0.1% w/v.
Some of the combinations between different aloe species showed enhanced TEER
reduction effects when compared to the single components, especially the combinations
between A. vera and A. marlothii at 0.1% w/v, as well as between A. vera and A. ferox at
0.5% w/v. Almost all ratios of TMC and aloe gel combinations (i.e. combination 4, 5 and 6)
had a statistically significantly higher reduction effect (p ≤ 0.05) on the TEER compared to
those of the negative control group. Furthermore, many of the combinations between aloe
gel material and TMC resulted in increased TEER reduction effects compared to those of the
single components.
The results from the TEER studies therefore indicate potential interactions between the
components of some of the combinations, which may result in improved drug absorption
enhancement effects. In order to determine whether these combinations of absorption
enhancers produce additive, synergistic or antagonistic effects in terms of drug absorption,
their effects on FITC-dextran transport across Caco-2 cell monolayers were measured.
4. In vitro transport studies
The FITC-dextran transport results (i.e. % transport plotted as a function of time) were
processed to calculate the apparent permeability coefficient (Papp) values, which are shown
in Table 2.
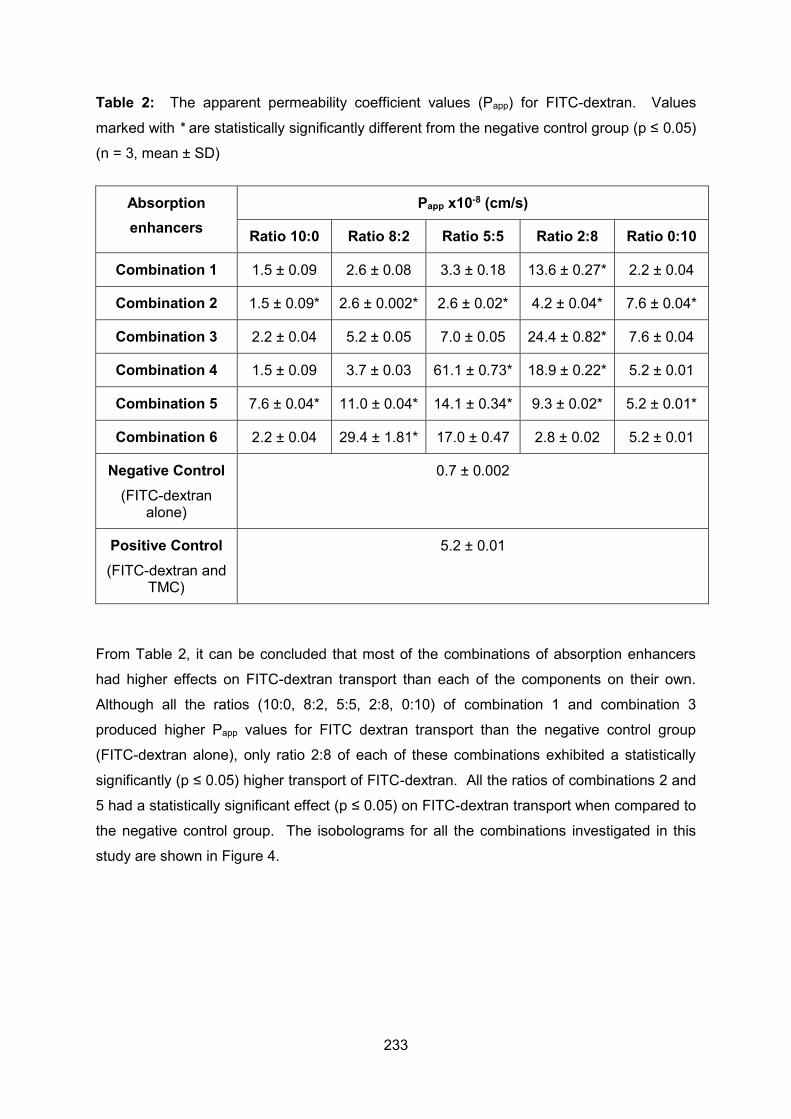
233
Table 2: The apparent permeability coefficient values (Papp) for FITC-dextran. Values
marked with * are statistically significantly different from the negative control group (p ≤ 0.05)
(n = 3, mean ± SD)
Absorption enhancers
Papp x10-8 (cm/s)
Ratio 10:0 Ratio 8:2 Ratio 5:5 Ratio 2:8 Ratio 0:10
Combination 1 1.5 ± 0.09 2.6 ± 0.08 3.3 ± 0.18 13.6 ± 0.27* 2.2 ± 0.04
Combination 2 1.5 ± 0.09* 2.6 ± 0.002* 2.6 ± 0.02* 4.2 ± 0.04* 7.6 ± 0.04*
Combination 3 2.2 ± 0.04 5.2 ± 0.05 7.0 ± 0.05 24.4 ± 0.82* 7.6 ± 0.04
Combination 4 1.5 ± 0.09 3.7 ± 0.03 61.1 ± 0.73* 18.9 ± 0.22* 5.2 ± 0.01
Combination 5 7.6 ± 0.04* 11.0 ± 0.04* 14.1 ± 0.34* 9.3 ± 0.02* 5.2 ± 0.01*
Combination 6 2.2 ± 0.04 29.4 ± 1.81* 17.0 ± 0.47 2.8 ± 0.02 5.2 ± 0.01
Negative Control (FITC-dextran
alone)
0.7 ± 0.002
Positive Control (FITC-dextran and
TMC)
5.2 ± 0.01
From Table 2, it can be concluded that most of the combinations of absorption enhancers
had higher effects on FITC-dextran transport than each of the components on their own.
Although all the ratios (10:0, 8:2, 5:5, 2:8, 0:10) of combination 1 and combination 3
produced higher Papp values for FITC dextran transport than the negative control group
(FITC-dextran alone), only ratio 2:8 of each of these combinations exhibited a statistically
significantly (p ≤ 0.05) higher transport of FITC-dextran. All the ratios of combinations 2 and
5 had a statistically significant effect (p ≤ 0.05) on FITC-dextran transport when compared to
the negative control group. The isobolograms for all the combinations investigated in this
study are shown in Figure 4.
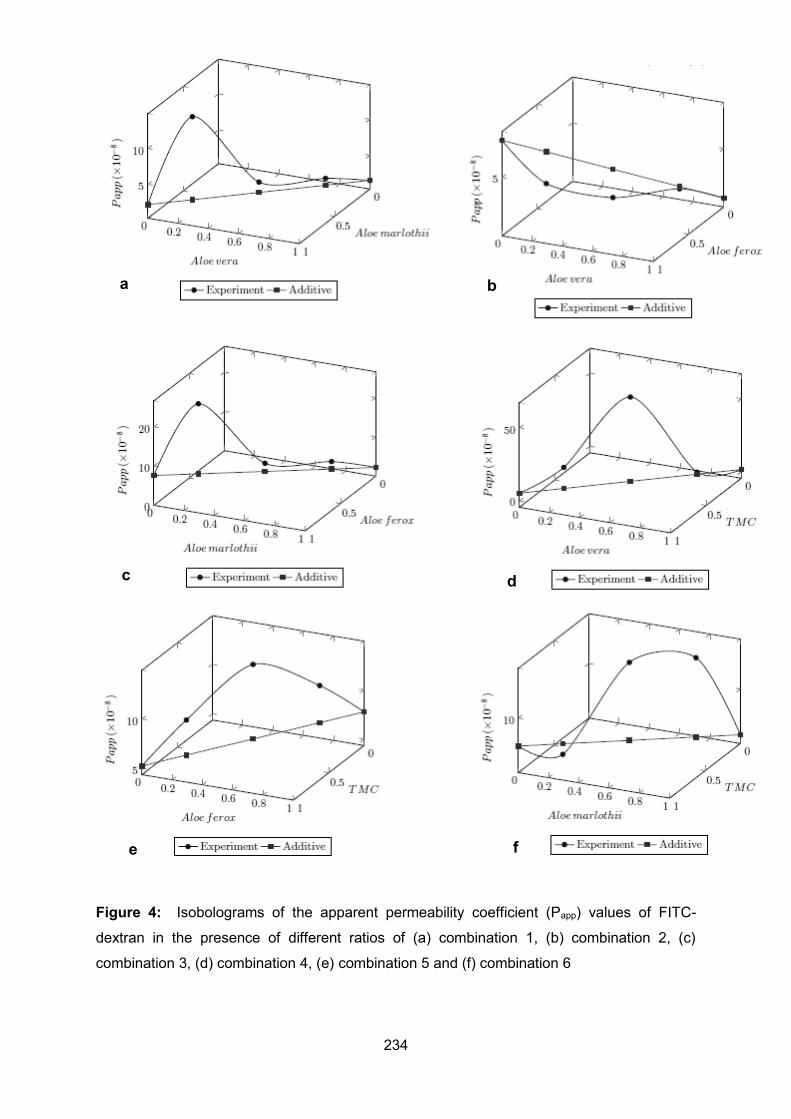
234
Figure 4: Isobolograms of the apparent permeability coefficient (Papp) values of FITC-
dextran in the presence of different ratios of (a) combination 1, (b) combination 2, (c)
combination 3, (d) combination 4, (e) combination 5 and (f) combination 6
a b
c d
e f

235
Figure 4(a) suggests that synergism, in terms of FITC-dextran transport enhancement
across Caco-2 cell monolayers, was obtained at all ratios of combination 1 (i.e. A. vera gel
combined with A. marlothii gel). This is in line with the TEER reduction results obtained for
combination 1 at a concentration of 0.1% w/v, which indicated improved TEER reduction
effects at most of the ratios compared to those of the single components. Microcalorimetric
data didn’t indicate any interactions occurring between the A. vera and A marlothii gel
materials. Therefore it can be deduced that the two compounds contribute individually to the
synergistic effect observed with the enhanced transport of FITC-dextran across the Caco-2
cell monolayers. Conversely, combination 2 (i.e. A. vera gel combined with A. ferox gel as
shown in Figure 4(b)) resulted in an additive effect (or zero interaction) at ratio 8:2, whilst the
other two ratios (i.e. 5:5 and 2:8) resulted in antagonism. This is in line with the TEER
reduction results obtained for combination 2 at a concentration of 0.1% w/v. A possible
explanation for this negative interaction between A. vera gel and A. ferox gel, in terms of
FITC-dextran transport, may be a physical or chemical interaction between the
phytochemicals of these two gel materials. The microcalorimetric results indicated that
interactions did occur at ratios 8:2, 5:5 and 2:8 of combination 2.
Combining A. marlothii gel with A. ferox gel (combination 3), as well as combining A. ferox
and TMC (combination 5), resulted in synergistic effects on FITC-dextran transport as
evident from Figures 4(c) and 4(e). A combination of A. vera with TMC (combination 4 as
shown in Figure 4(d)), resulted in synergism at ratios 5:5 and 2:8 in terms of FITC-dextran
transport enhancement, whilst an additive effect was obtained at ratio 8:2. The isothermal
microcalorimetry results indicated no interaction between A. vera and TMC in ratios 5:5 and
2:8, therefore showing the synergistic effect on the FITC-dextran transport is not effected
through an interaction, but rather through the combined effect of each separate compound
results in enhanced FITC-dextran transport. However, microcalorimetric evaluation of the
8:2 ratio of combination 4 showed an interaction between A. vera and TMC. This interaction
influenced the FITC-dextran transport detrimentally.
For combination 6 (i.e. TMC and A. marlothii), synergism was observed at ratios 8:2 and 5:5,
whilst antagonism was observed at ratio 2:8, where TMC was in majority. From the results
of the isothermal heat-conduction calorimetry, it was evident that an interaction between A.
marlothii and TMC occurred at ratio 2:8 which can explain the antagonistic effect at this
specific combination ratio.
236
CONCLUSION
The results from this study indicated that combinations of certain drug absorption enhancers
can produce synergetic effects in terms of tight junction modulation of epithelial cell
monolayers, whilst others cause additive or antagonistic effects. Furthermore, the type of
effect is dependent on the concentration and ratio of the binary mixture. Contradictory
effects between ratios of the same combination could be explained by physical or chemical
interactions between the components of the materials at that specific ratio combination as
indicated by microcalorimetry.
ACKNOWLEDGEMENTS
This work was carried out with the financial support of the National Research Foundation of
South Africa.
Any opinion, findings and conclusions or recommendations expressed in this material are
those of the authors and therefore the NRF do not accept any liability with regard thereto.
REFERENCES
Antosova, Z., Mackova, M., Kral, V. & Macek, T. 2009. Therapeutic application of peptides
and proteins: parenteral forever? Trends in Biotechnology, 27(11):628-635.
Beneke, C., Viljoen, A. & Hamman, J. 2012. In vitro absoption enhancement effects of Aloe
vera and Aloe ferox. Scientia Pharmaceutica, 80(2):475-486.
Berenbaum, M.C. 1989. What is synergy? Pharmacological Reviews, 41(3):93-129.
Breitinger, H.G. 2012. Drug synergy–mechanisms and methods of analysis.
http://www.intechopen.com/books/toxicity-and-drug-test Date of access: 2 Jul. 2014.
Campestrini, L.H., Silveira, J.L.M., Duarte, M.E.R., Koop, H.S. & Noseda, M.D. 2013. NMR
and rheological study of Aloe barbadensis partially acetylated glucomannan. Carbohydrate
Polymers, 94(1):511– 519.
Chen, W., Lu, Z., Viljoen, A. & Hamman, J. 2009. Intestinal drug transport enhancement by
Aloe vera. Planta Medica, 76(12):587–595.
Crommelin, D., Van Winden, E. & Mekking, A. 2002. Delivery of pharmaceutical proteins.
(In: Aulton, M.E., ed. Aulton's pharmaceutics: the design and manufacture of
medicines, 3rd ed. New York: Churchill Livingstone. p. 616-625).

237
Daugherty, A.L. & Mrsny, R.J. 1999. Transcellular uptake mechanisms of the intestinal
epithelial barrier: part one. Pharmaceutical Science and Technology Today, 2(4):144-151.
Enslin, G.M., Hamman, J.H. & Kotzé, A.F. 2008. Intestinal drug absorption enhancers:
synergistic effects of combinations. Drug Development and Industrial Pharmacy,
34(12):1343-1349.
Hamman, J.H. 2007. Drug absorption enhancement. (In: Oral drug delivery,
biopharmaceutical principles, evaluation and optimization. Pretoria: Content Solutions. p.
184-208).
Hamman, J.H., Enslin, G.M. & Kotzé, A.F. 2005. Oral delivery of peptide drugs.
Biodrugs, 19(3):165-177.
Howard, G.J. & Webster, T.F. 2009. Generalized concentration addition: a method for
examining mixtures containing partial agonists. Journal of Theoretical Biology, 259(3):469-
477.
Kotzé, A.F., Lueßen, H.L., De Leeuw, B.J., De Boer, A.G., Verhoef, J.C. & Junginger,
H.E. 1999. Effect of the degree of quaternization of N-trimethyl chitosan chloride on the
permeability of intestinal epithelial cells (Caco-2). European Journal of Pharmaceutics and
Biopharmaceutics, 47(3):269-274.
Lebitsa, T., Viljoen, A., Lu, Z. & Hamman, J.H. 2012. In vitro drug permeation enhancement
potential of aloe gel materials. Current Drug Delivery, 9(3):297-304.
Legen, I., Salobir, M. & Kerč, J. 2005. Comparison of different intestinal epithelia as models
for absorption enhancement studies. International Journal of Pharmaceutics, 291(1):183-
188.
Muranishi, S. 1990. Absorption enhancers. Critical Reviews in Therapeutic Drug Carrier
Systems, 7(1):1-33.
Nolte, M.S., Karam, M.D. & Karam, J.H. 2003. Pancreatic hormones and antidiabetic
drugs. (In: Weitz, M. & Lebowitz, H., ed. Basic and clinical pharmacology, 9th ed. San
Francisco: McGraw-Hill. p. 693-714).
O'Brien, C., Van Wyk, B.-E. & Van Heerden, F.R. 2011. Physical and chemical
characteristics of Aloe ferox leaf gel. South African Journal of Botany, 77(4):988-995.

238
Palumbo, P., Picchini, U., Beck, B., Van Gelder, J., Delbar, N. & Degaetano, A. 2008. A
general approach to the apparent permeability index. Journal of Pharmacokinetics and
Pharmacodynamics, 35(2):235-248.
Polnok, A., Borchard, G., Verhoef, J.C., Sarisuta, N. & Junginger, H.E. 2004. Influence of
methylation process on the degree of quaternization of N-trimethyl chitosan
chloride. European Journal of Pharmaceutics and Biopharmaceutics, 57(1):77-83.
Rúnarsson, O.V., Holappa, J., Nevalainen, T., Hjálmarsdóttir, M., Järvinen, T., Loftsson, T.,
Einarsson, J.M., Jónsdóttir, S., Valdimarsdóttir, M. & Másson, M. 2007. Antibacterial activity
of methylated chitosan and chitooligomer derivatives: synthesis and structure activity
relationships. European Polymer Journal, 43(6):2660-2671.
Sieval, A.B., Thanou, M., Kotzé, A.F., Verhoef, J.C., Brussee, J. & Junginger,
H.E. 1998. Preparation and NMR characterization of highly substituted N-trimethyl chitosan
chloride. Carbohydrate Polymers, 36(3):157-165.
Tabachnick, B.G. & Fidell, L.S. 2001. Using multivariate statistics. 4th ed. Boston: Allyn &
Bacon.
Vinson, J.A., Al Kharrat, H. & Andreoli, L. 2005. Effect of Aloe vera preparations on the
human bioavailability of vitamins C and E. Phytomedicine, 12(10):760-765.
Wagner, H. & Ulrich-Mezenich, G. 2009. Synergy research: approaching a new generation
of phytopharmaceuticals. Phytomedicine, 16(2):97-110.
Whitehead, K., Karr, N. & Mitragotri, S. 2008. Discovery of synergistic permeation
enhancers for oral drug delivery. Journal of Controlled Release, 128(2):128-133.
Williamson, E.M. 2001. Synergy and other interactions in phytomedicines.
Phytomedicine, 8(5):401-409.
239
ADDENDUM D CERTIFICATES OF ANALYSIS

3050 Spruce Street, Saint Louis, MO 63103 USA Email USA: [email protected] Outside USA: [email protected]
Certificate of Analysis
Product Name: FLUORESCEIN ISOTHIOCYANATE−DEXTRANaverage mol wt 4,000, FITC:Glucose = 1:250
Product Number: 46944Batch Number: BCBK1623VBrand: SigmaCAS Number:Formula:Formula Weight:Storage Temperature: +4 CQuality Release Date: 22 NOV 2012
TEST SPECIFICATION RESULT
APPEARANCE (COLOR) YELLOW TO DARK YELLOW AND
ORANGE TO DARK ORANGE
DARK YELLOW
APPEARANCE (FORM) POWDER POWDER
SOLUBILITY (COLOR) YELLOW TO VERY DARK BROWN-
-YELLOW, ORANGE
VERY DARK BROWN-YELLOW
SOLUBILITY (TURBIDITY) CLEAR TO FAINTLY TURBID (< 29.0
NTU)
CLEAR (< 3.5 NTU)
SOLUBILITY (METHOD) 50MG/ML WATER 50MG/ML WATER
INFRARED SPECTRUM CONFORMS TO STRUCTURE CONFORMS
MISCELLANEOUS TESTS DEGREE OF SUBSTITUTION 0.002-
-0.020 MOL FITC/MOL OF
GLUCOSE
DEGREE OF SUBSTITUTION 0.005 MOL
FITC/MOL OF GLUCOSE
Dr. Claudia Geitner
Manager Quality Control
Buchs, Switzerland
Sigma-Aldrich warrants that at the time of the quality release or subsequent retest date this product conformed to the information contained in this publication. The current
specification sheet may be available at Sigma-Aldrich.com. For further inquiries, please contact Technical Service. Purchaser must determine the suitability of the product
for its particular use. See reverse side of invoice or packing slip for additional terms and conditions of sale.
Sigma-Aldrich Certificate of Analysis - Product 46944 Lot BCBK1623V Page 1 of 1
240

241

242

243
ADDENDUM E LANGUAGE EDITING CERTIFICATE

244
Gill Smithies
Proofreading & Language Editing Services
59, Lewis Drive, Amanzimtoti, 4126, Kwazulu Natal
Cell: 071 352 5410 E-mail: [email protected]
Work Certificate
To Trizel du Toit
Address Dept of Pharmaceuticals, North West University, Potchefstroom
Date 10/11/2014
Subject Masters: Chapters 1 to 6, Abstract and Acknowledgement
Ref GS/TdT/01
I, Gill Smithies, certify that I have proofed and language edited:
Masters: Chapters 1 to 6, Abstract and Acknowledgement for Trizel du Toit,
to the standard as required by NWU, Potchefstroom.
Gill Smithies
10/11/2014
Top Related