


Languages
Pages
Legal


2016
FACT BOOKCOASTAL CAROLINA UNIVERSITY
College of Science
RECREATION AND SPORT MANAGEMENT

250
RECREATION AND SPORT MANAGEMENT
TABLE OF CONTENTS
Fall and Spring Enrollment Trends .................................................................. 251 Summer Enrollment Trends ............................................................................. 252 Fall Enrollment Trends by Race ...................................................................... 253 Fall Enrollment Trends by Gender ................................................................... 254 Fall Enrollment Trends by Class Level ............................................................ 255 Residency Classification of Students for Fee Payment Purposes .................... 256 Geographic Distribution by State ..................................................................... 257 Geographic Distribution by Country ................................................................. 258 Migration of Transfer Students to Coastal Carolina University ......................... 259 First-Time Full-Time Freshmen SAT Scores ................................................... 260 First-Time Full-Time Freshmen ACT Scores ................................................... 261 First-Time Full-Time Freshmen High School GPA ........................................... 262 First-Time Full-Time Freshmen Retention ....................................................... 263 First-Time Full-Time Transfer Retention .......................................................... 264

251
Year Headcount Year Headcount2010 312 2011 3172011 323 2012 3152012 328 2013 3242013 326 2014 3132014 341 2015 3232015 362 2016 3232016 327
Fall Semester Spring Semester
College of ScienceFall and Spring
Enrollment Trends2010-2016
Recreation and Sport Management
280
290
300
310
320
330
340
350
360
370
10-11 11-12 12-13 13-14 14-15 15-16 16-17
Hea
dco
un
t
Fall Semester Spring Semester

252
May Summer I Summer IISemester Semester Semester Total
Year # Students # Students # Students # Students2010 47 60 27 1342011 62 58 34 1542012 60 31 19 1102013 38 33 35 1062014 53 41 42 1362015 30 46 63 1392016 40 48 75 163
2010-2016Summer Enrollment Trends
College of Science
Recreation and Sport Management
0
10
20
30
40
50
60
70
80
2010 2011 2012 2013 2014 2015 2016
Head
coun
t
May Summer I Summer II

# % # % # % # % # % # % # %ETHNICITYHispanic/Latino 6 1.9% 4 1.2% 10 3.0% 9 2.8% 8 2.3% 14 3.9% 15 4.6%RACEAmerican Indian/ Alaskan Native 0 0.0% 1 0.3% 2 0.6% 3 0.9% 1 0.3% 0 0.0% 0 0.0%Asian 2 0.6% 1 0.3% 1 0.3% 1 0.3% 2 0.6% 2 0.6% 1 0.3%Black/ African American 71 22.8% 78 24.1% 82 25.0% 78 23.9% 93 27.3% 94 26.0% 90 27.5%
253
Native Hawaiian/ Pacific Islander 0 0.0% 0 0.0% 1 0.3% 1 0.3% 1 0.3% 0 0.0% 0 0.0%White 225 72.1% 228 70.6% 221 67.4% 223 68.4% 222 65.1% 230 63.5% 202 61.8%Two or More Races 6 1.9% 10 3.1% 10 3.0% 7 2.1% 8 2.3% 15 4.1% 14 4.3%Non-Resident Alien 2 0.6% 1 0.3% 1 0.3% 2 0.6% 3 0.9% 6 1.7% 4 1.2%Unknown 0 0.0% 0 0.0% 0 0.0% 2 0.6% 3 0.9% 1 0.3% 1 0.3%
TOTAL 312 100.0% 323 100.0% 328 100.0% 326 100.0% 341 100.0% 362 100.0% 327 100.0%
College of Science
2016
Recreation and Sport Management
2010-2016by Race
Fall Enrollment Trends
20152010 2011 2012 2013 2014

254
2010 241 77.2% 71 22.8% 3122011 255 78.9% 68 21.1% 3232012 252 76.8% 76 23.2% 3282013 267 81.9% 59 18.1% 3262014 278 81.5% 63 18.5% 3412015 291 80.4% 71 19.6% 3622016 253 77.4% 74 22.6% 327
College of ScienceFall Enrollment Trends by Gender
2010-2016
Recreation and Sport Management
% # %#Male Female
TotalYear
0.0%
10.0%
20.0%
30.0%
40.0%
50.0%
60.0%
70.0%
80.0%
90.0%
100.0%
2010 2011 2012 2013 2014 2015 2016
Per
cen
t of
Stu
den
ts
Male Female
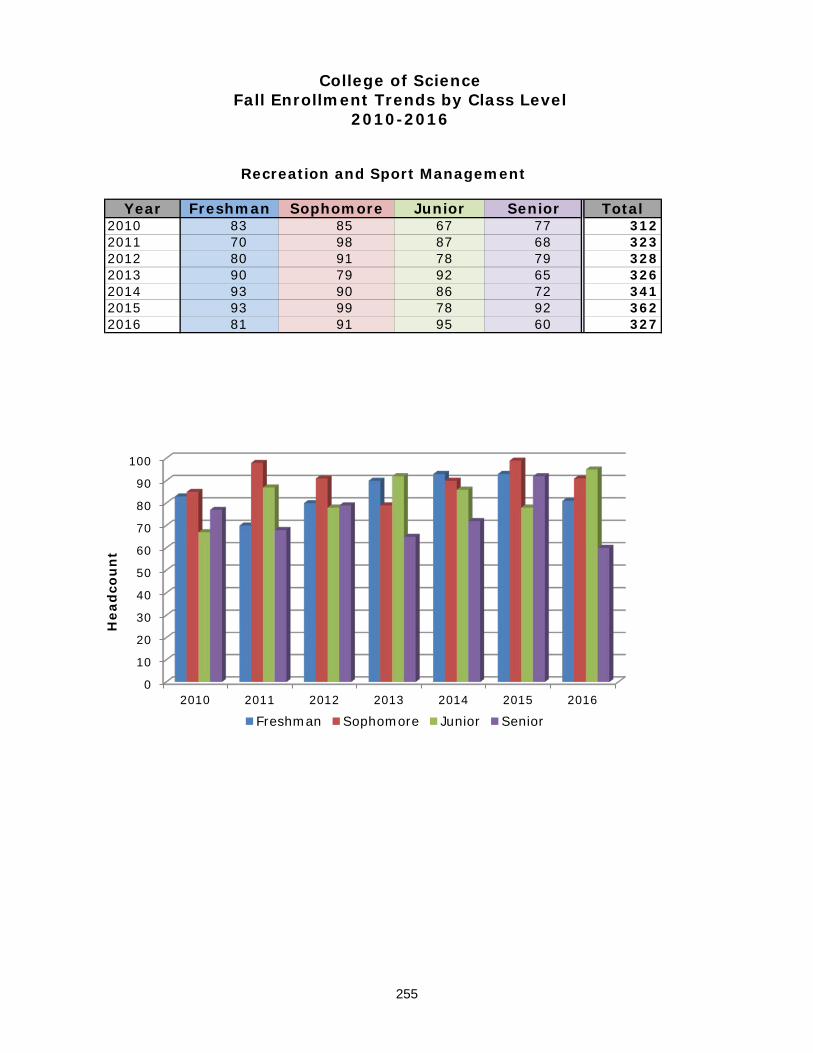
255
Year Total2010 83 85 67 77 3122011 70 98 87 68 3232012 80 91 78 79 3282013 90 79 92 65 3262014 93 90 86 72 3412015 93 99 78 92 3622016 81 91 95 60 327
Freshman Sophomore Junior Senior
College of ScienceFall Enrollment Trends by Class Level
2010-2016
Recreation and Sport Management
0
10
20
30
40
50
60
70
80
90
100
2010 2011 2012 2013 2014 2015 2016
Hea
dco
un
t
Freshman Sophomore Junior Senior
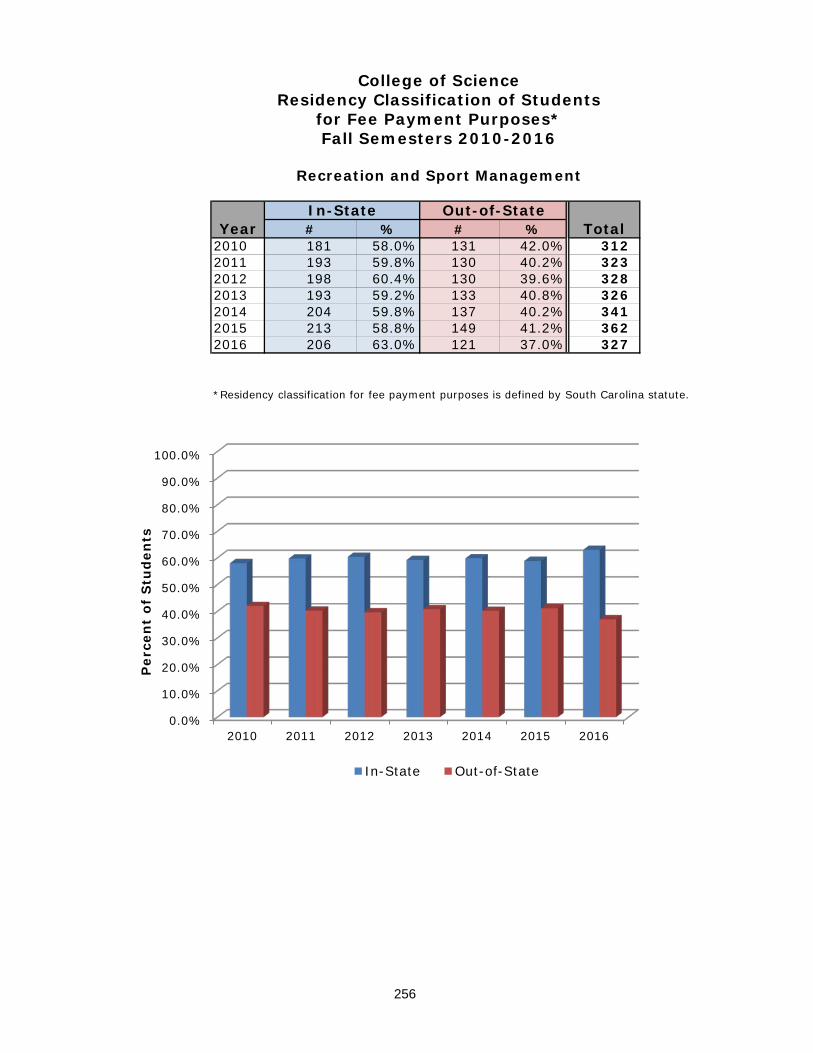
256
Year % % Total2010 181 58.0% 131 42.0% 312 2011 193 59.8% 130 40.2% 323 2012 198 60.4% 130 39.6% 328 2013 193 59.2% 133 40.8% 326 2014 204 59.8% 137 40.2% 341 2015 213 58.8% 149 41.2% 362 2016 206 63.0% 121 37.0% 327
*Residency classification for fee payment purposes is defined by South Carolina statute.
College of ScienceResidency Classification of Students
for Fee Payment Purposes*Fall Semesters 2010-2016
#In-State Out-of-State#
Recreation and Sport Management
0.0%
10.0%
20.0%
30.0%
40.0%
50.0%
60.0%
70.0%
80.0%
90.0%
100.0%
2010 2011 2012 2013 2014 2015 2016
Per
cen
t of
Stu
den
ts
In-State Out-of-State

257
StateSouth Carolina 143 135 142 144 133New York 30 40 37 35 28New Jersey 36 34 35 41 27Virginia 17 19 16 23 20Connecticut 11 10 16 16 16Massachusetts 13 9 16 16 16North Carolina 10 16 10 16 16Maryland 18 14 9 11 15Pennsylvania 13 13 17 17 15Ohio 2 4 3 4 5Other States 34 30 37 33 32
College of Science
2016
Recreation and Sport Management
Fall Semesters 2012-2016Enrollment by State
Geographic Distribution of
2012 2013 2014 2015
0
20
40
60
80
100
120
140
SC NY NJ VA NC MA CT PA MD OH
133
28 2720 16 16 16 15 15
5
Hea
dco
un
t
Fall 2016

258
CountryCanada 0 0 0 1 1Russian Federation 0 0 0 0 1Serbia 0 0 1 1 1United Kingdom 0 0 0 1 1France 0 0 0 1 0Germany 0 1 1 1 0Jamaica 1 0 0 0 0Sweden 0 1 0 0 0United Arab Emirates 0 0 1 1 0Other Countries 0 0 0 0 0
Total 1 0.3% 2 0.6% 3 0.9% 6 1.7% 4 1.2%
College of Science
2016
Recreation and Sport Management
Fall Semesters 2012-2016Enrollment by Country
Geographic Distribution of
2012 2013 2014 2015
259
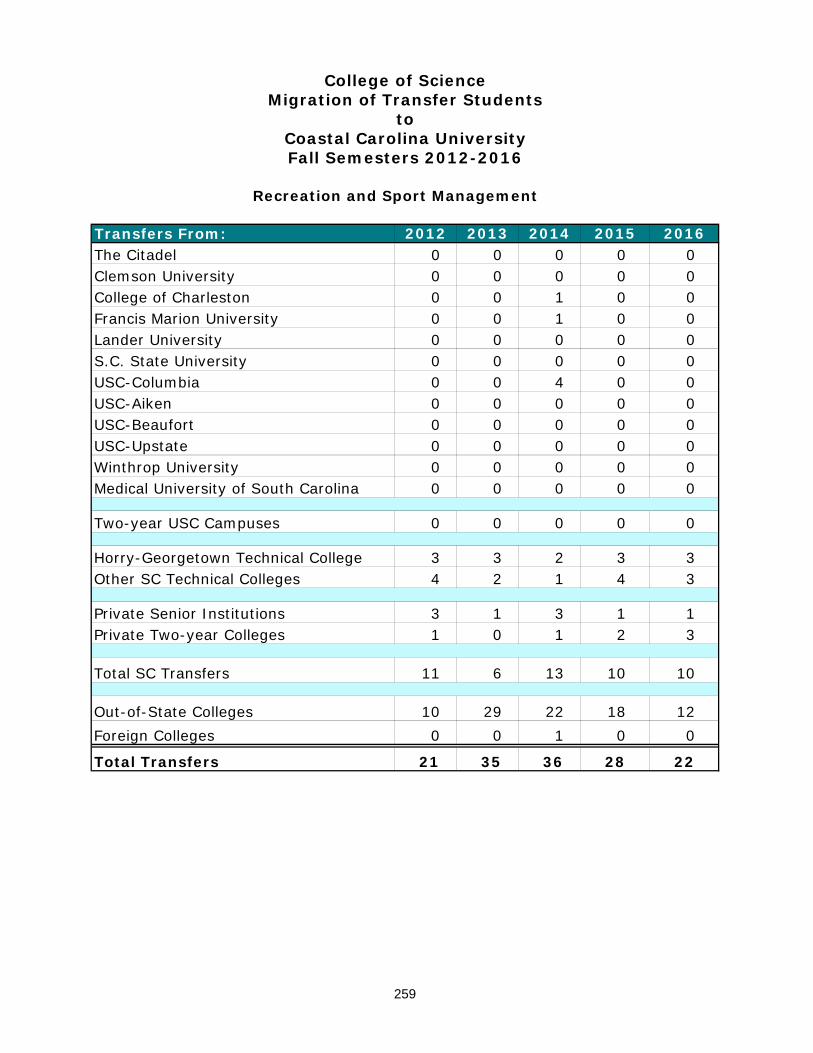
Transfers From:The Citadel 0 0 0 0 0Clemson University 0 0 0 0 0College of Charleston 0 0 1 0 0Francis Marion University 0 0 1 0 0Lander University 0 0 0 0 0S.C. State University 0 0 0 0 0USC-Columbia 0 0 4 0 0USC-Aiken 0 0 0 0 0USC-Beaufort 0 0 0 0 0USC-Upstate 0 0 0 0 0Winthrop University 0 0 0 0 0Medical University of South Carolina 0 0 0 0 0
Two-year USC Campuses 0 0 0 0 0
Horry-Georgetown Technical College 3 3 2 3 3Other SC Technical Colleges 4 2 1 4 3
Private Senior Institutions 3 1 3 1 1Private Two-year Colleges 1 0 1 2 3
Total SC Transfers 11 6 13 10 10
Out-of-State Colleges 10 29 22 18 12Foreign Colleges 0 0 1 0 0
Total Transfers 21 35 36 28 22
toMigration of Transfer Students
College of Science
20162012
Fall Semesters 2012-2016Coastal Carolina University
Recreation and Sport Management
2013 2014 2015

260
Year N N2011 6 962 820 1210 13 1034 870 12802012 14 949 870 1000 18 1009 860 13202013 14 928 810 1080 25 976 810 12402014 13 930 770 1070 32 984 850 12902015 11 976 860 1160 35 989 850 12202016 11 985 840 1150 15 1038 910 1270
SAT Total Score0 01 06 73 41 30 10 0
11 15
Fall 2016
In-State
College of ScienceFirst-Time Full-Time Freshmen
SAT ScoresFall Semesters 2011-2016
Mean Min MaxOut-of-State
Mean Min Max
Recreation and Sport Management
Out-of-State
1200-1299>1299
Total
<800800-899900-9991000-10991100-1199
In-State
0
100
200
300
400
500
600
700
800
900
1000
1100
1200
2011 2012 2013 2014 2015 2016
962 949 928 930976 985
1034 1009976 984 989
1038
Ave
rag
e S
AT
Sco
re
In-State Out-of-State

261
Year N N2011 14 18.9 17 22 9 21.2 18 272012 8 22.3 17 27 11 21.6 17 302013 7 20.6 18 24 7 21.3 18 252014 8 18.6 16 21 8 22.0 19 262015 12 21.3 18 27 13 21.3 18 242016 12 21.0 19 26 10 21.1 18 25
0 00 23 14 22 00 13 4
12 10
< 1818
Total
ACT Total Score
19202122> 22
College of ScienceFirst-Time Full-Time Freshmen
ACT ScoresFall Semesters 2011-2016
In-State Out-of-StateFall 2016
Mean Min MaxIn-State Out-of-State
Mean Min Max
Recreation and Sport Management
123456789
10111213141516171819202122232425
2011 2012 2013 2014 2015 2016
18.9
22.320.6
18.6
21.3 21.021.2 21.6 21.3 22.021.3 21.1
Ave
rag
e A
CT
Sco
res
In-State Out-of-State

262
Year N N2011 20 3.45 2.67 4.64 22 3.09 2.12 4.002012 22 3.27 2.50 4.50 29 3.12 2.00 4.252013 21 3.44 2.77 4.21 30 3.03 2.00 3.752014 21 3.27 2.62 4.22 39 3.03 2.10 4.062015 24 3.32 2.32 4.29 48 3.08 2.12 3.872016 24 3.51 2.84 4.38 31 3.09 2.28 4.01
0 00 00 12 11
12 1210 724 31
College of Science
Min MaxOut-of-State
Mean Min Max
First-Time Full-Time FreshmenHigh School GPA
Fall Semesters 2011-2016
In-StateMean
Recreation and Sport Management
Total
High School GPA
2.00 - 2.492.50 - 2.993.00 - 3.49>= 3.50
Fall 2016In-State Out-of-State
< 1.751.75 - 1.99
0.000.250.500.751.001.251.501.752.002.252.502.753.003.253.503.754.00
2011 2012 2013 2014 2015 2016
3.453.27
3.443.27 3.32 3.51
3.09 3.12 3.03 3.03 3.08 3.09
Ave
rag
e H
igh
Sch
ool
GP
A
In-State Out-of-State
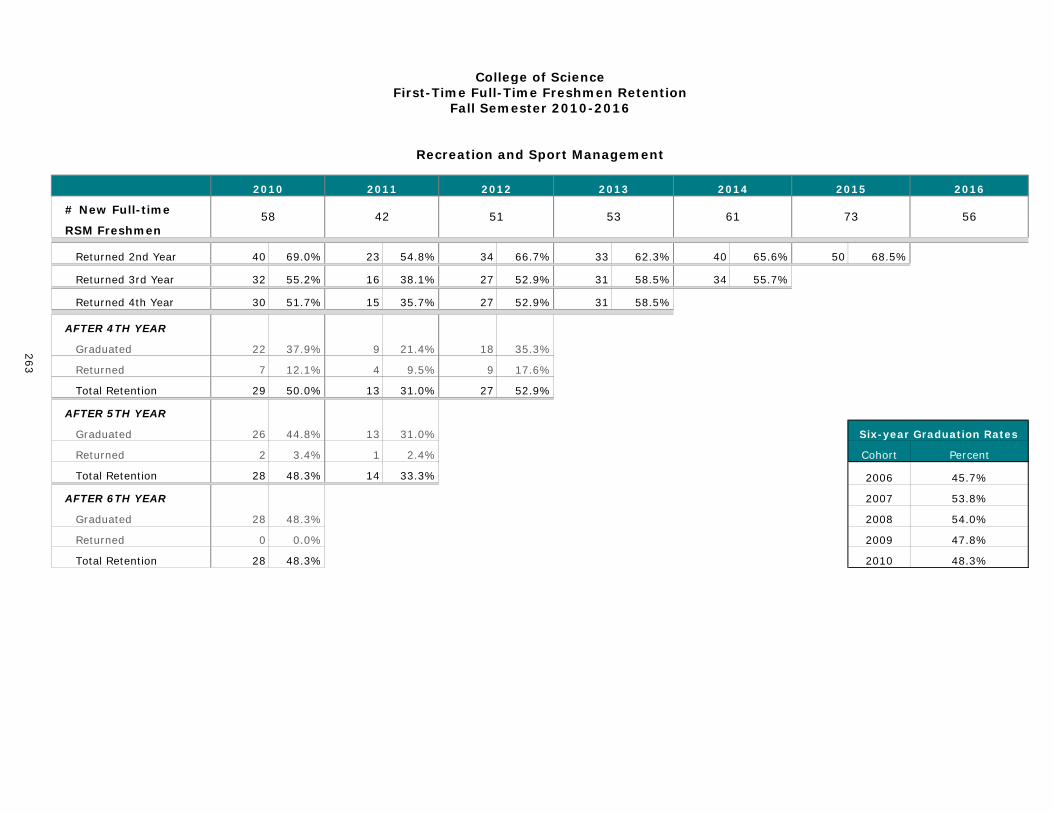
# New Full-time
RSM Freshmen
Returned 2nd Year 40 23 34 33 40 50
Returned 3rd Year 32 16 27 31 34
Returned 4th Year 30 15 27 31
AFTER 4TH YEAR
Graduated 22 9 18
Returned 7 4 9
Total Retention 29 13 27
AFTER 5TH YEAR
Graduated 26 13
Returned 2 1
Total Retention 28 14
AFTER 6TH YEAR
Graduated 28
Returned 0
Total Retention 28 2010 48.3%
2007 53.8%
2008 54.0%
2009 47.8%
55.7%
Six-year Graduation Rates
Cohort Percent
2006 45.7%
2.4%
33.3%
35.3%
17.6%
52.9%
73
68.5%
2014
61
65.6%
College of Science
58 42 51 53 56
First-Time Full-Time Freshmen RetentionFall Semester 2010-2016
2013201220112010 20162015
31.0%
51.7%
55.2% 38.1%
35.7%
9.5%
21.4%
50.0%
44.8% 31.0%
48.3%
3.4%
48.3%
0.0%
48.3%
263
Recreation and Sport Management
12.1%
37.9%
58.5%
62.3%
52.9%
52.9%
66.7%
58.5%
54.8%69.0%

# New Full-time
RSM Transfers
AFTER 1ST YEAR
Graduated 0 0 0 0 0 1
Returned 21 29 17 28 26 23
Total Retention 21 29 17 28 26 24
AFTER 2ND YEAR
Graduated 3 7 3 5 8
Returned 16 16 12 20 16
Total Retention 19 23 15 25 24
AFTER 3RD YEAR
Graduated 14 20 9 21
Returned 4 1 6 3
Total Retention 18 21 15 24
AFTER 4TH YEAR
Graduated 18 21 15
Returned 1 0 0
Total Retention 19 21 15
AFTER 5TH YEAR
Graduated 18 21
Returned 0 0
Total Retention 18 21
AFTER 6TH YEAR
Graduated 18
Returned 0
Total Retention 18
34
264
College of ScienceFirst-Time Full-Time Transfer Retention
Fall Semester 2010-2016
2010 2011 2012 2013 2016
Recreation and Sport Management
0.0%
81.0%
13.3%
42.9%
28.6%
30 36 21 34
70.0% 80.6%
0.0%
82.4%
81.0% 82.4%
0.0% 0.0%
70.0% 80.6%
3.3%
60.0%
46.7%
58.8%
14.3%
57.1%
71.4% 73.5%
53.3% 44.4%
63.3% 63.9%
10.0% 19.4% 14.7%
60.0%
71.4%
22.2%
44.4%
66.7%
Six-year Graduation Rates
0.0%
60.0%
60.0%
0.0%
60.0%
63.3%
60.0%
55.6%
2.8%
58.3%
58.3%
0.0%
58.3%
58.3%
0.0%
58.3%
71.4%
0.0%
71.4%
61.8%
8.8%
70.6%
2014
36
0.0%
72.2%
72.2%
2015
28
3.6%
82.1%
85.7%
2008 51.6%
2009 56.7%
2010 60.0%
Cohort Percent
2006 65.0%
2007 43.8%
Top Related