


Languages
Pages
Legal

Dr. M Valdelievre Politechnika - Warszaw - May 2015
Coal: A Global Fuel
Challenges & Perspectives

Programme
Day 1- Monday 20 April
Coal: A Global Fuel1- Coal: a Fossil Fuel 1H
Primary Energy Fuel Geology -Origin – Ranking - AnalysisWorld Reserves & Production: Hard Coal-Lignite-Peat
2- The Coal chain: 2HMining TechniquesHealth, Safety & Environment ConcernsCoal Preparation & Beneficiation Process Bulk Transportation International Coal Flow - The Seaborne Market
Day 2 –Tuesday
3- Industrial Process 1H30Methane from Coal : CBM - CMMCoal Conversion: to Gas & Liquid CTL/CTO Industry kiln: Steel mills & Cement Plants Coal & Power: a sustainable Binomial
4-Tutorial Work Session 1H 30
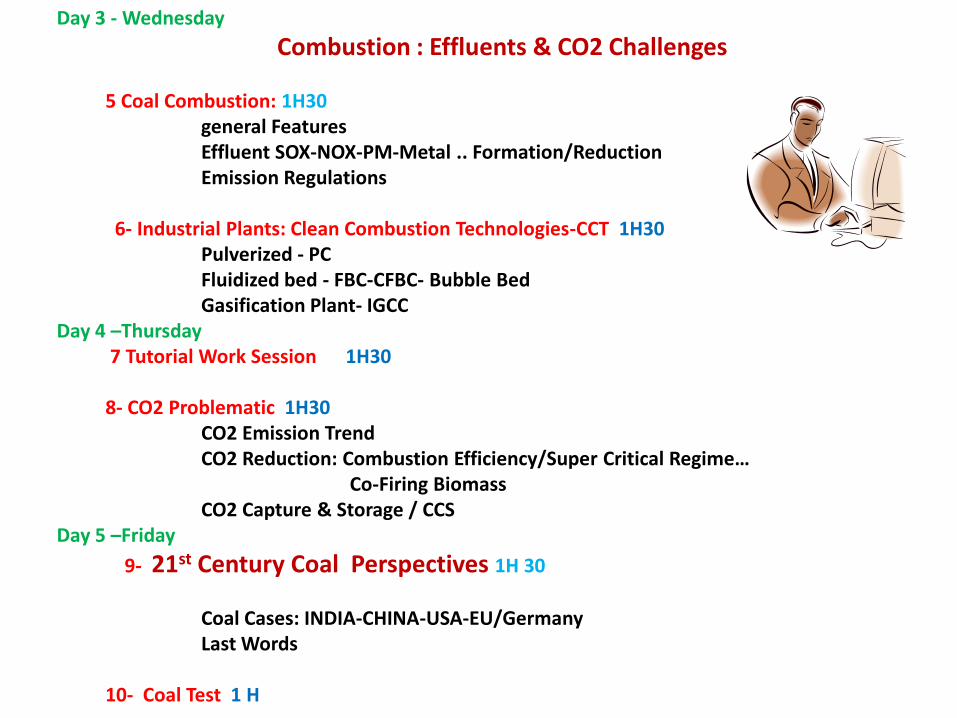
Day 3 - Wednesday
Combustion : Effluents & CO2 Challenges
5 Coal Combustion: 1H30general FeaturesEffluent SOX-NOX-PM-Metal .. Formation/ReductionEmission Regulations
6- Industrial Plants: Clean Combustion Technologies-CCT 1H30Pulverized - PCFluidized bed - FBC-CFBC- Bubble BedGasification Plant- IGCC
Day 4 –Thursday 7 Tutorial Work Session 1H30
8- CO2 Problematic 1H30CO2 Emission TrendCO2 Reduction: Combustion Efficiency/Super Critical Regime…
Co-Firing BiomassCO2 Capture & Storage / CCS
Day 5 –Friday
9- 21st Century Coal Perspectives 1H 30
Coal Cases: INDIA-CHINA-USA-EU/GermanyLast Words
10- Coal Test 1 H

1- Coal: A Primary Fuel 2013/2012 Facts ( WCA.est.)
Coal World Consumption + 3 %
30.1 % of Primary Energy
41% of Electricity Generation
+/- 68% Coal used for Electricity Generation
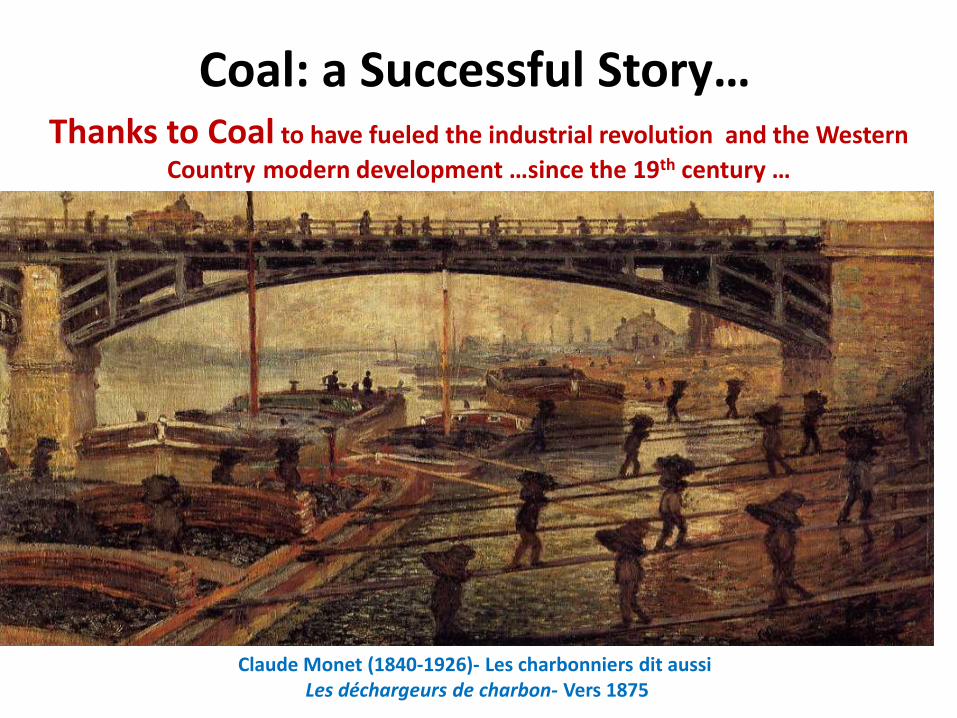
Thanks to Coal to have fueled the industrial revolution and the Western
Country modern development …since the 19th century …
Coal: a Successful Story…
Claude Monet (1840-1926)- Les charbonniers dit aussiLes déchargeurs de charbon- Vers 1875
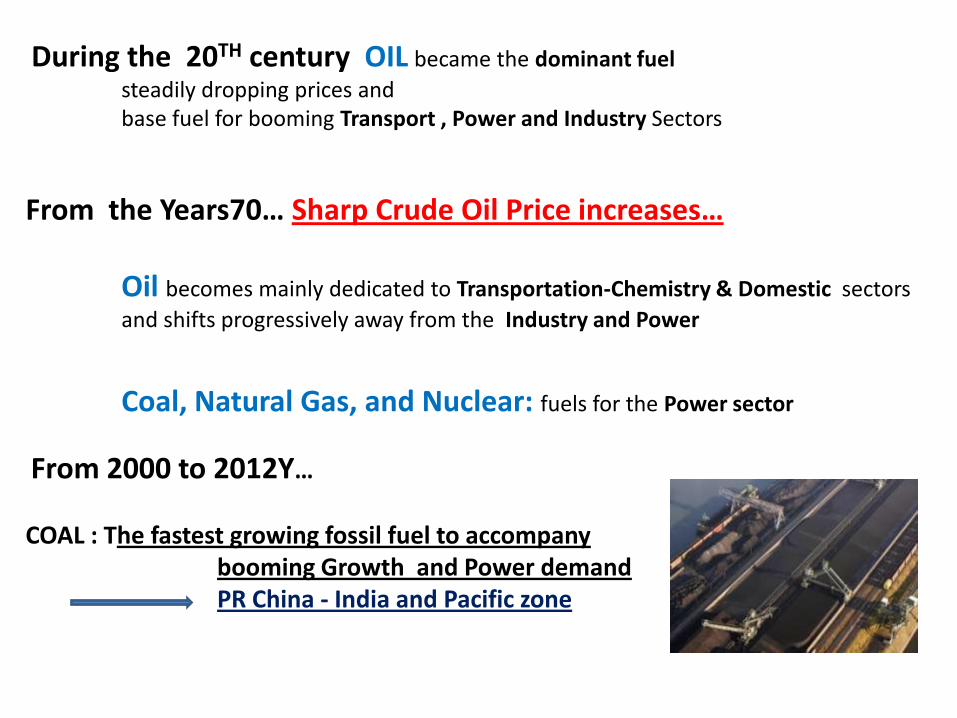
During the 20TH century OIL became the dominant fuel
steadily dropping prices and base fuel for booming Transport , Power and Industry Sectors
From the Years70… Sharp Crude Oil Price increases…
Oil becomes mainly dedicated to Transportation-Chemistry & Domestic sectors
and shifts progressively away from the Industry and Power
Coal, Natural Gas, and Nuclear: fuels for the Power sector
From 2000 to 2012Y…
COAL : The fastest growing fossil fuel to accompany booming Growth and Power demand PR China - India and Pacific zone
BP Statistical Review of World Energy 2013 © BP 2014
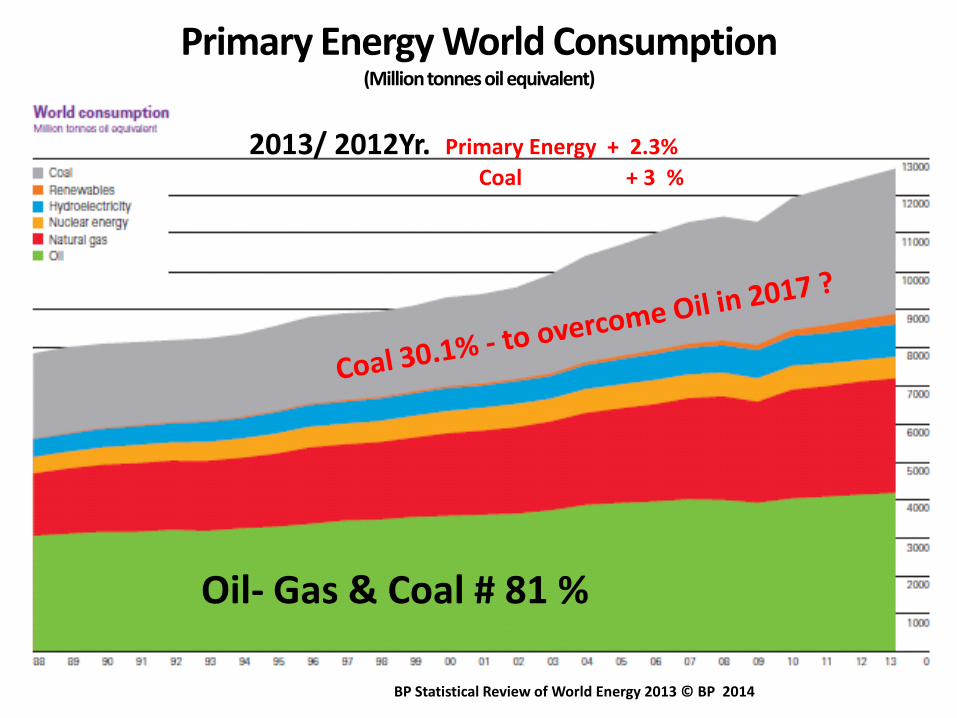
Primary Energy World Consumption(Million tonnes oil equivalent)
2013/ 2012Yr. Primary Energy + 2.3%
Coal + 3 %
Oil- Gas & Coal # 81 %

Coal: still a dominant Fuel
+5% growth in average ….
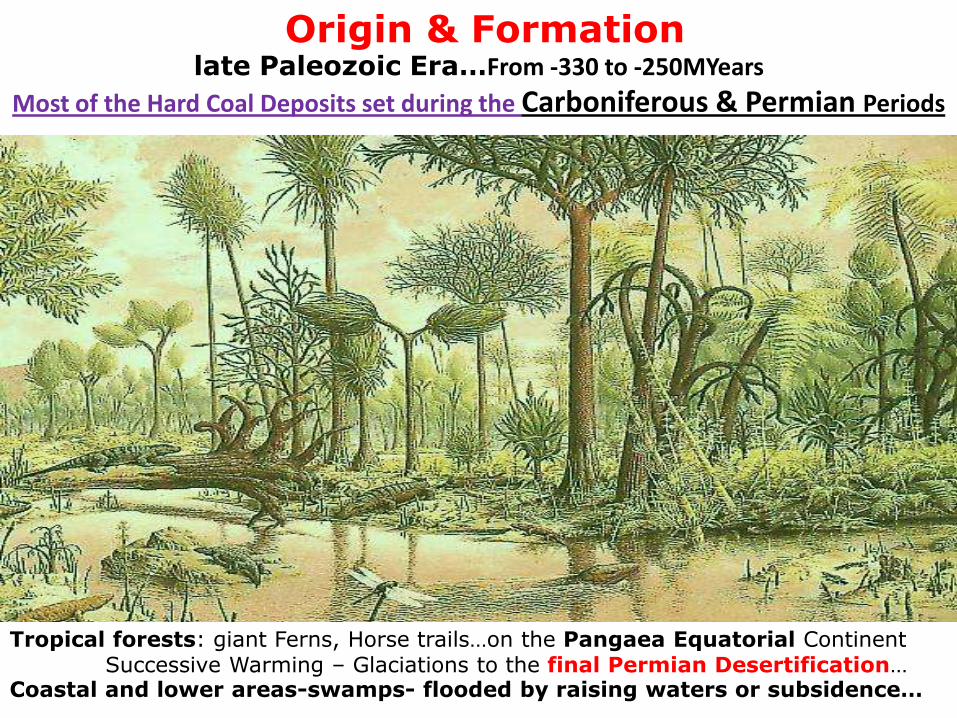
Origin & Formationlate Paleozoic Era…From -330 to -250MYears
Most of the Hard Coal Deposits set during the Carboniferous & Permian Periods
Tropical forests: giant Ferns, Horse trails…on the Pangaea Equatorial ContinentSuccessive Warming – Glaciations to the final Permian Desertification…
Coastal and lower areas-swamps- flooded by raising waters or subsidence…
-
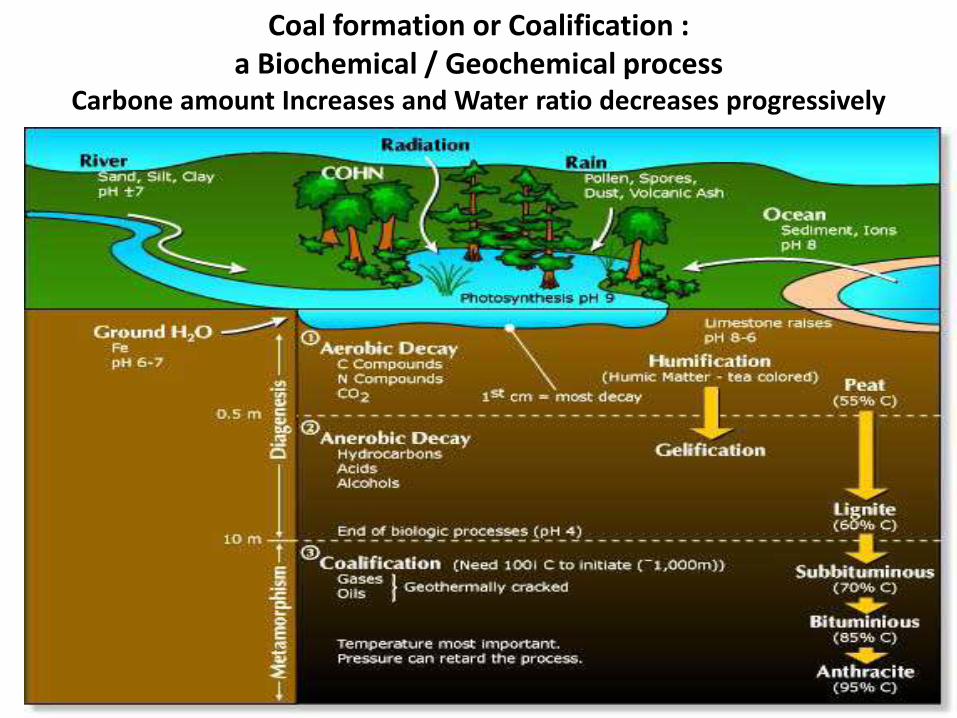
Coal formation or Coalification : a Biochemical / Geochemical process
Carbone amount Increases and Water ratio decreases progressively
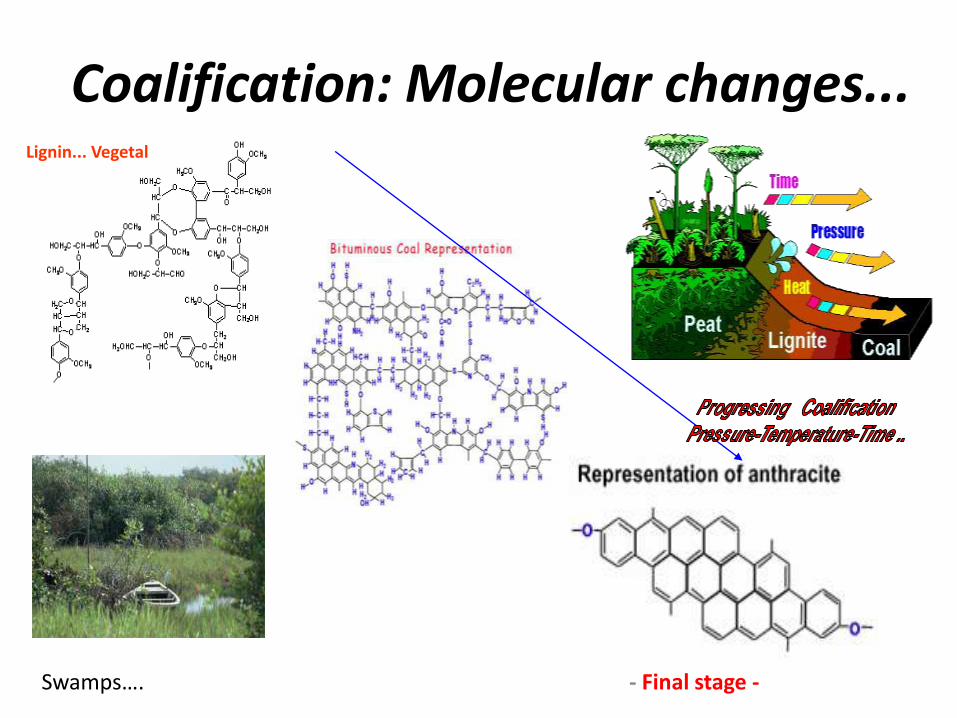
- Final stage -
Coalification: Molecular changes...Lignin... Vegetal
Swamps….
-
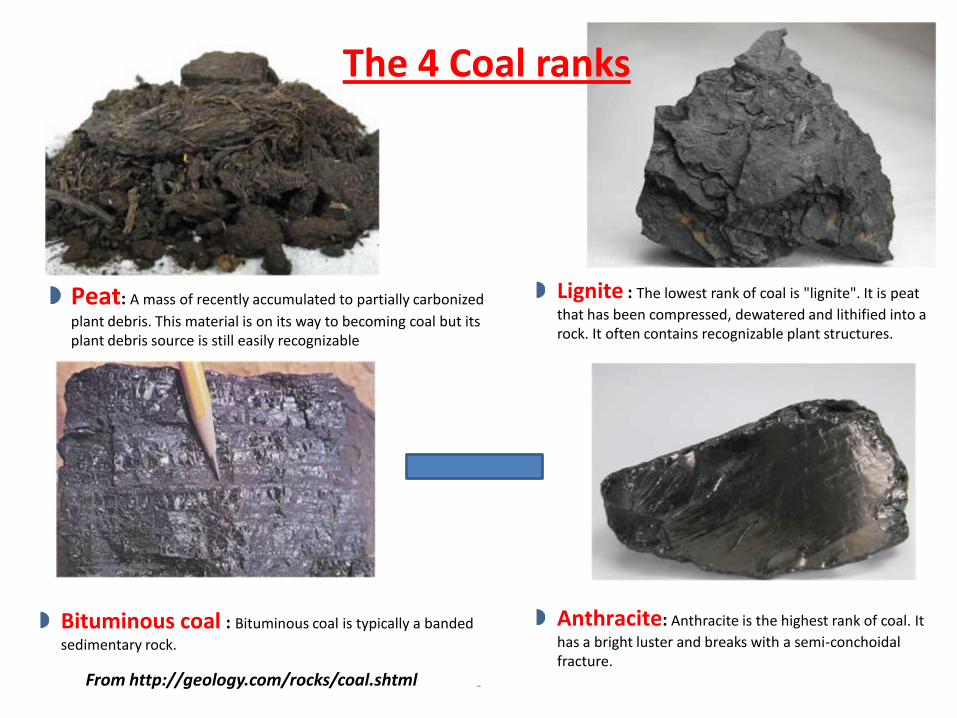
Peat: A mass of recently accumulated to partially carbonized
plant debris. This material is on its way to becoming coal but its plant debris source is still easily recognizable
Bituminous coal : Bituminous coal is typically a banded
sedimentary rock.
Lignite : The lowest rank of coal is "lignite". It is peat
that has been compressed, dewatered and lithified into a rock. It often contains recognizable plant structures.
Anthracite: Anthracite is the highest rank of coal. It
has a bright luster and breaks with a semi-conchoidalfracture.
From http://geology.com/rocks/coal.shtml
The 4 Coal ranks

COAL ANALYSIS
ASH – MINERALS
VOLATILE MATTER - VM
FIXED CARBON FC
1- PROXIMATE ANALYSIS:
H20 + VM+ Ash + FC = 100%
COAL
Moisture H2O
ASHMineral Matters
TOTAL Carbon…
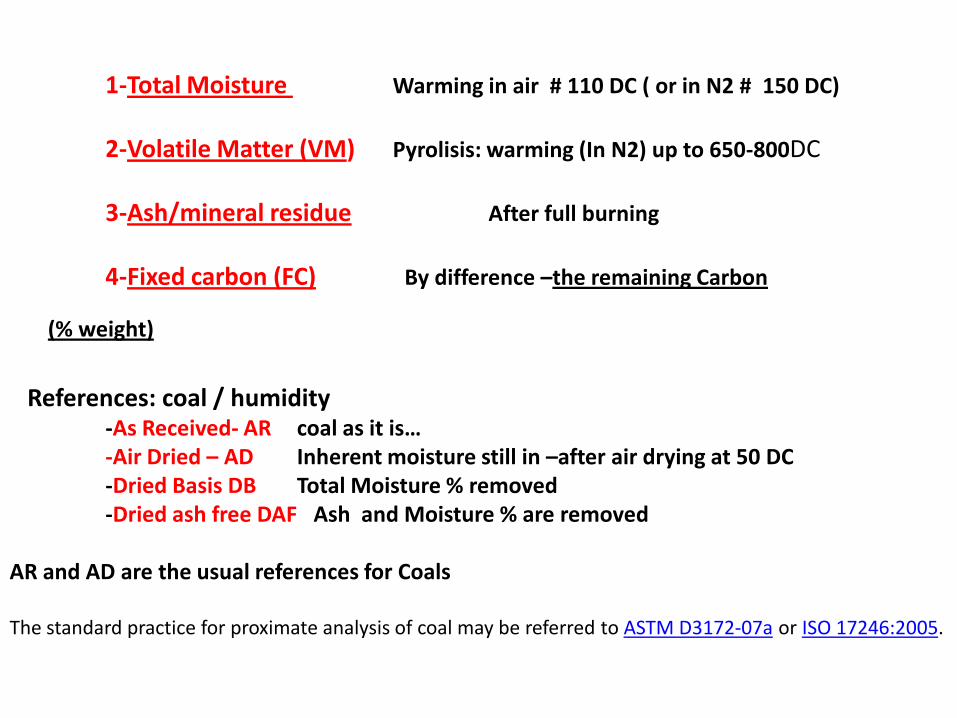
1-Total Moisture Warming in air # 110 DC ( or in N2 # 150 DC)
2-Volatile Matter (VM) Pyrolisis: warming (In N2) up to 650-800DC
3-Ash/mineral residue After full burning
4-Fixed carbon (FC) By difference –the remaining Carbon
(% weight)
References: coal / humidity-As Received- AR coal as it is… -Air Dried – AD Inherent moisture still in –after air drying at 50 DC -Dried Basis DB Total Moisture % removed -Dried ash free DAF Ash and Moisture % are removed
AR and AD are the usual references for Coals
The standard practice for proximate analysis of coal may be referred to ASTM D3172-07a or ISO 17246:2005.

International Coal Classifications & Uses… Main Uses:
-Steam coal
Boilers Power Gen.-
Cements-
Metallurgical
-Domestic
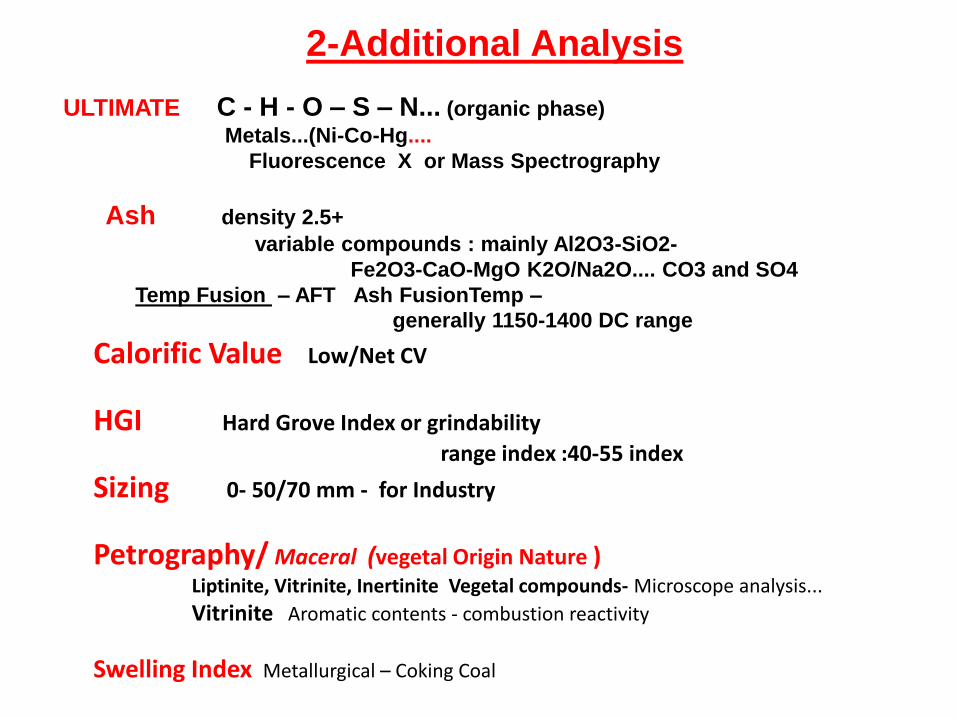
2-Additional Analysis
ULTIMATE C - H - O – S – N... (organic phase)
Metals...(Ni-Co-Hg....
Fluorescence X or Mass Spectrography
Ash density 2.5+
variable compounds : mainly Al2O3-SiO2-
Fe2O3-CaO-MgO K2O/Na2O.... CO3 and SO4
Temp Fusion – AFT Ash FusionTemp –
generally 1150-1400 DC range
Calorific Value Low/Net CV
HGI Hard Grove Index or grindability
range index :40-55 index
Sizing 0- 50/70 mm - for Industry
Petrography/ Maceral (vegetal Origin Nature )Liptinite, Vitrinite, Inertinite Vegetal compounds- Microscope analysis...
Vitrinite Aromatic contents - combustion reactivity
Swelling Index Metallurgical – Coking Coal

FUEL: Calorific Value-CV
The amount of heat released during the full Combustion of a fuel
Gross CV is measured in a laboratory on a representative sample AD …
Low or Net CV: for Plant Efficiency *Water always liquid in the gas
Coal CV fluctuates with Geology history Coal rankingC & H content Mineral & Humidity contents
sourcing / mines
relation GCV/NCV annexed-l1 TOE = 41.8 GJ1 TEC = 27.8GJ
Net CV from local Markets
•Steam Coal or coal for combustion in a vapor generator
• -----from IEA statistics reference

Hard Coal, Lignite, Peat & BiomassIndicative Analysis Range….
LCV Humidity C MV AshesMJ/kg % % % %
Coal ADAnthracite 34-36 2-3 95-98 5-10 0-1Sub & Bituminous 20-28 3-12 60-80 15-30 10-20Lignite 13-17 15-25 50-65 30-40 1-8Peat 10-15 20-30 55-60 55-70 1-5
Wood AD 16-20 15-25** 50* 70-75 0-1.5
Vegetation/ ADStraw 14-15 8 45-50* 60 2-4
Bagasse Sugar cane 15-19 20-50 45-55 45 2-3
** Humidity up to 60-80% on As Received AR *** Oxygen 40 - 45 %
LCV : Low Calorific Value – MV :volatile content A D : Dried by Air 50DC
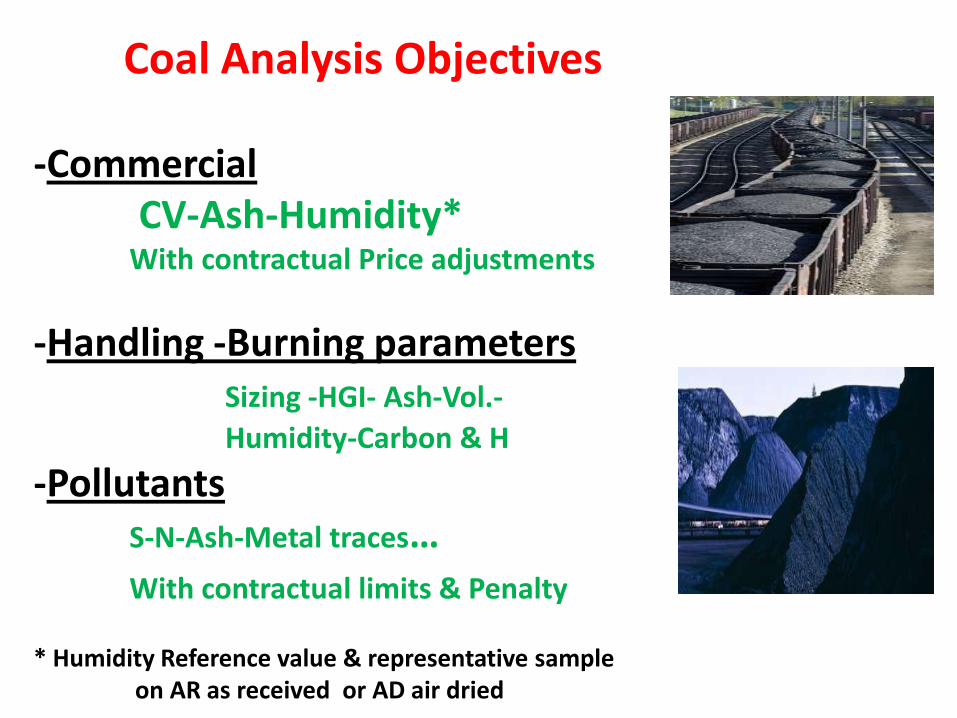
Coal Analysis Objectives
-CommercialCV-Ash-Humidity*
With contractual Price adjustments
-Handling -Burning parameters Sizing -HGI- Ash-Vol.-
Humidity-Carbon & H
-Pollutants S-N-Ash-Metal traces…With contractual limits & Penalty
* Humidity Reference value & representative sample on AR as received or AD air dried
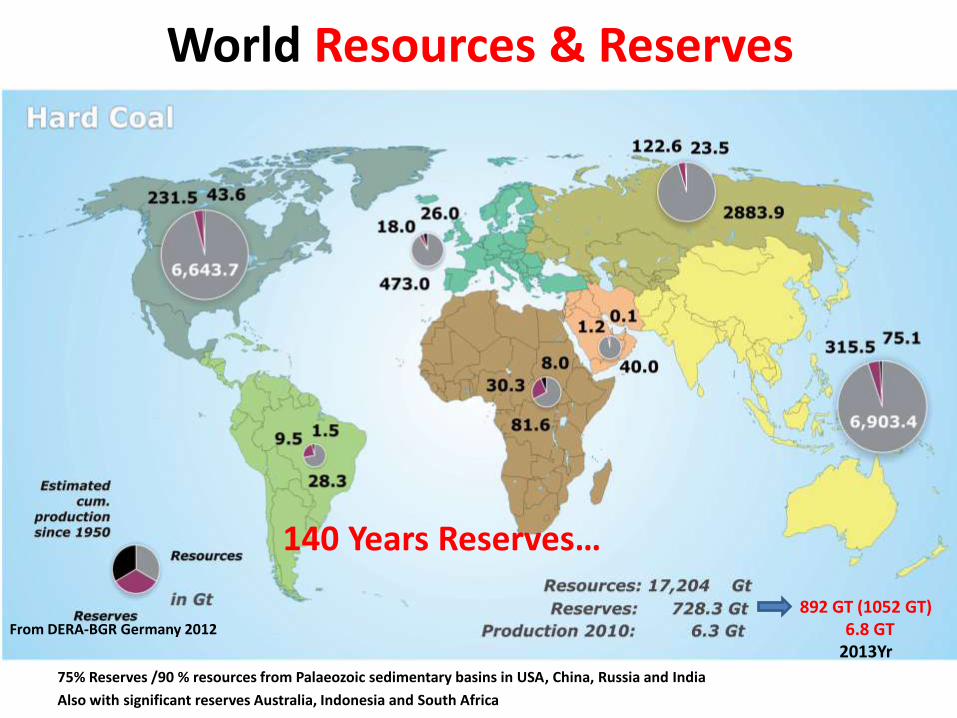
World Resources & Reserves
75% Reserves /90 % resources from Palaeozoic sedimentary basins in USA, China, Russia and India
Also with significant reserves Australia, Indonesia and South Africa
From DERA-BGR Germany 2012
140 Years Reserves…
892 GT (1052 GT)6.8 GT
2013Yr

BP Statistical Review of World Energy 2014
Coal Production/Consumption by regionMillion tonnes oil equivalent Mtoe
Production by region Consumption by region
Production + 0.4% Consumption +3%
Consumption: +5% during the 2000Yrs
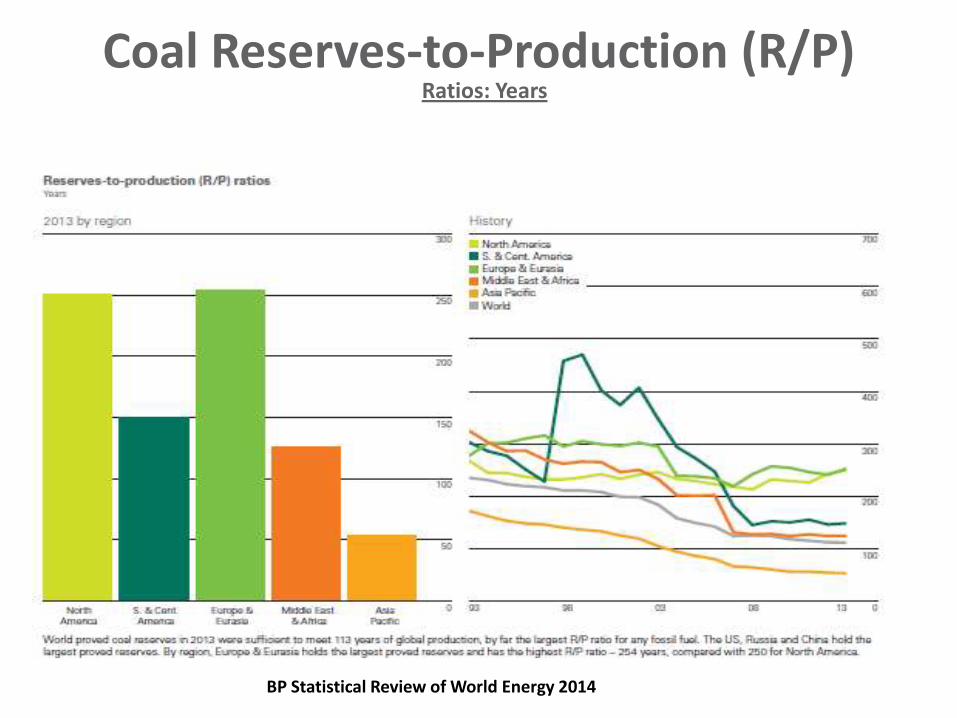
Coal Reserves-to-Production (R/P)Ratios: Years
BP Statistical Review of World Energy 2014
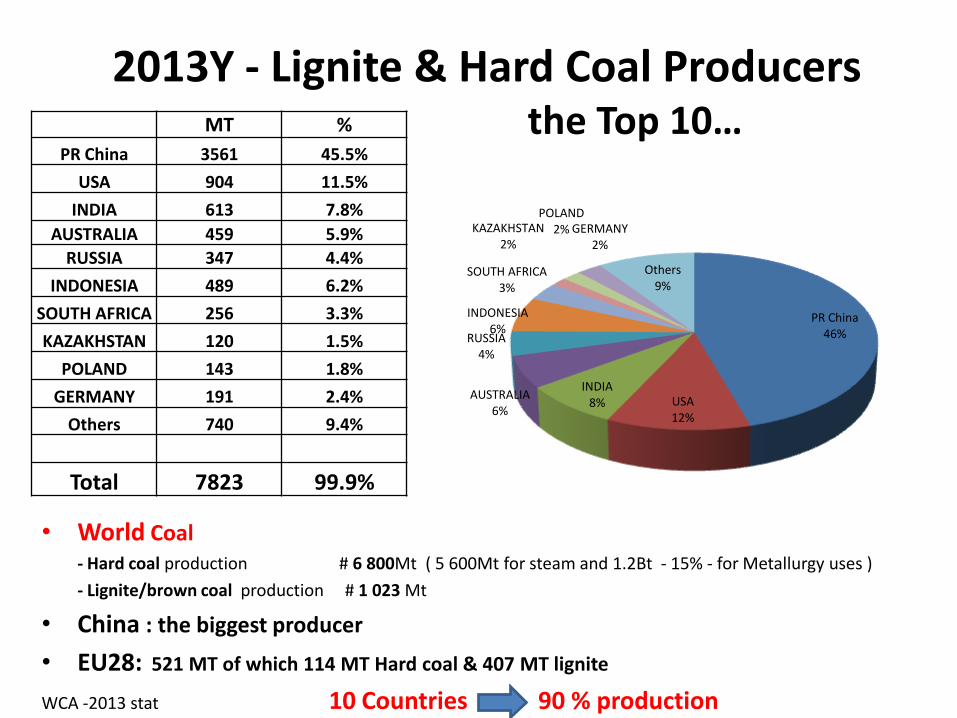
2013Y - Lignite & Hard Coal Producersthe Top 10…
• World Coal - Hard coal production # 6 800Mt ( 5 600Mt for steam and 1.2Bt - 15% - for Metallurgy uses )
- Lignite/brown coal production # 1 023 Mt
• China : the biggest producer
• EU28: 521 MT of which 114 MT Hard coal & 407 MT lignite
WCA -2013 stat 10 Countries 90 % production
PR China46%
USA12%
INDIA8%
AUSTRALIA6%
RUSSIA4%
INDONESIA6%
SOUTH AFRICA3%
KAZAKHSTAN2%
POLAND2% GERMANY
2%
Others 9%
MT %
PR China 3561 45.5%
USA 904 11.5%
INDIA 613 7.8%
AUSTRALIA 459 5.9%
RUSSIA 347 4.4%
INDONESIA 489 6.2%
SOUTH AFRICA 256 3.3%
KAZAKHSTAN 120 1.5%
POLAND 143 1.8%
GERMANY 191 2.4%
Others 740 9.4%
Total 7823 99.9%

GEN/TM/Charbon – GB – Journée Charbon – 22 janvier 2010
CHINA 1st World Coal Producer • Proven reserves of 114,5 Gt (BP stats) or 180 GT ? 25 to 45 Yrs Production...• Reserves widely distributed, mostly in the far Northern and Eastern • Defined Resources # 1000 Gt - Total estimated Resources 5000 Gt...
North West /North provinces mainly ....
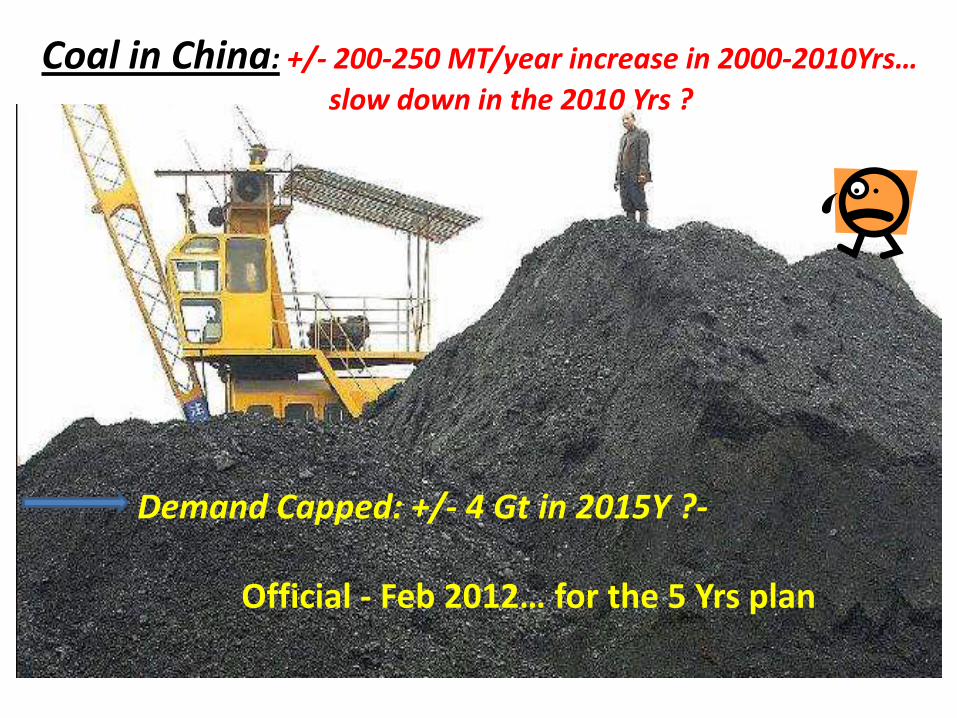
Coal in China: +/- 200-250 MT/year increase in 2000-2010Yrs…
slow down in the 2010 Yrs ?
Demand Capped: +/- 4 Gt in 2015Y ?-
Official - Feb 2012… for the 5 Yrs plan
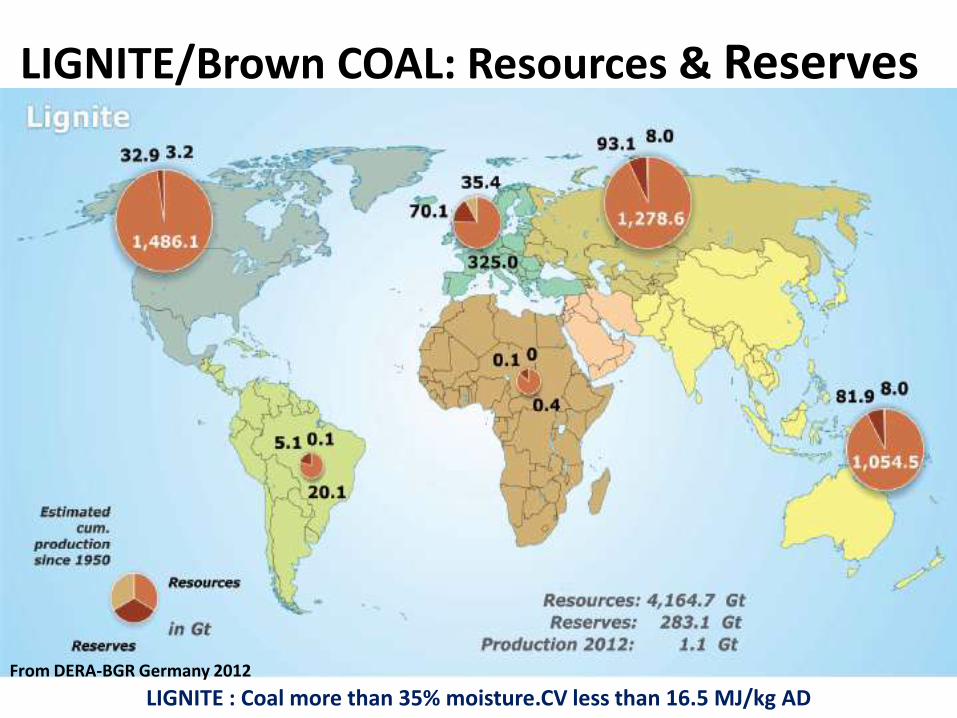
LIGNITE : Coal more than 35% moisture.CV less than 16.5 MJ/kg AD
LIGNITE/Brown COAL: Resources & Reserves
From DERA-BGR Germany 2012
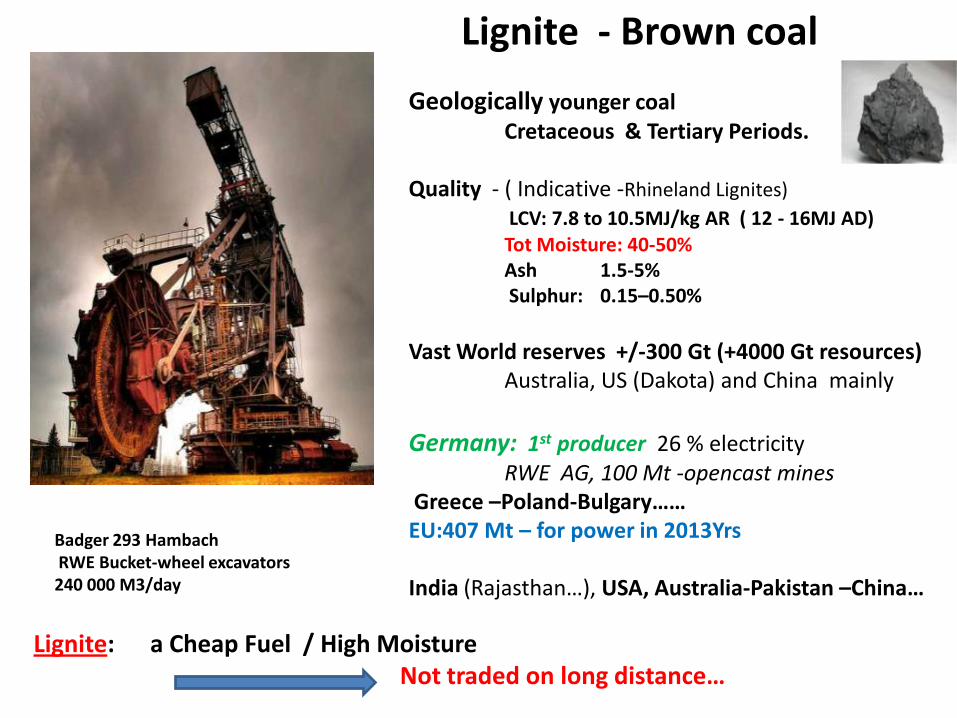
Lignite - Brown coal
Geologically younger coalCretaceous & Tertiary Periods.
Quality - ( Indicative -Rhineland Lignites)
LCV: 7.8 to 10.5MJ/kg AR ( 12 - 16MJ AD)Tot Moisture: 40-50%Ash 1.5-5%Sulphur: 0.15–0.50%
Vast World reserves +/-300 Gt (+4000 Gt resources) Australia, US (Dakota) and China mainly
Germany: 1st producer 26 % electricity RWE AG, 100 Mt -opencast mines
Greece –Poland-Bulgary……EU:407 Mt – for power in 2013Yrs
India (Rajasthan…), USA, Australia-Pakistan –China…
Lignite: a Cheap Fuel / High Moisture Not traded on long distance…
Badger 293 HambachRWE Bucket-wheel excavators 240 000 M3/day

EUROPE 28: Coal & Lignite Production

Peat: A Biomass Fuel ?Peat bog : 3% of the world’s land –mainly in former glacier areas (northern Europe/ Siberia- Ireland Peat also found in tropical areas (Indonesia-Cameroun…
As partially & aerobic decay of accumulated vegetation / biomass from wetland- Peat holds a lot of water
Moisture 50-60 %+ AR 15-20% AD
CV 10-15 MJ/kg AD
Peat is soft and easily compressed to force water outUpon drying, fuel for PP (Ireland (10%power) – Finland
Russia …) or cement plant
Peat: Cheap fuel/ high Humidity nearby use
Lütt-Witt Moor, a bog in Henstedt-UzburgNorthern Germany
Grasslands Cameroun
GLEN Malt whisky distilleries: Peat fumes to dry malted barley…
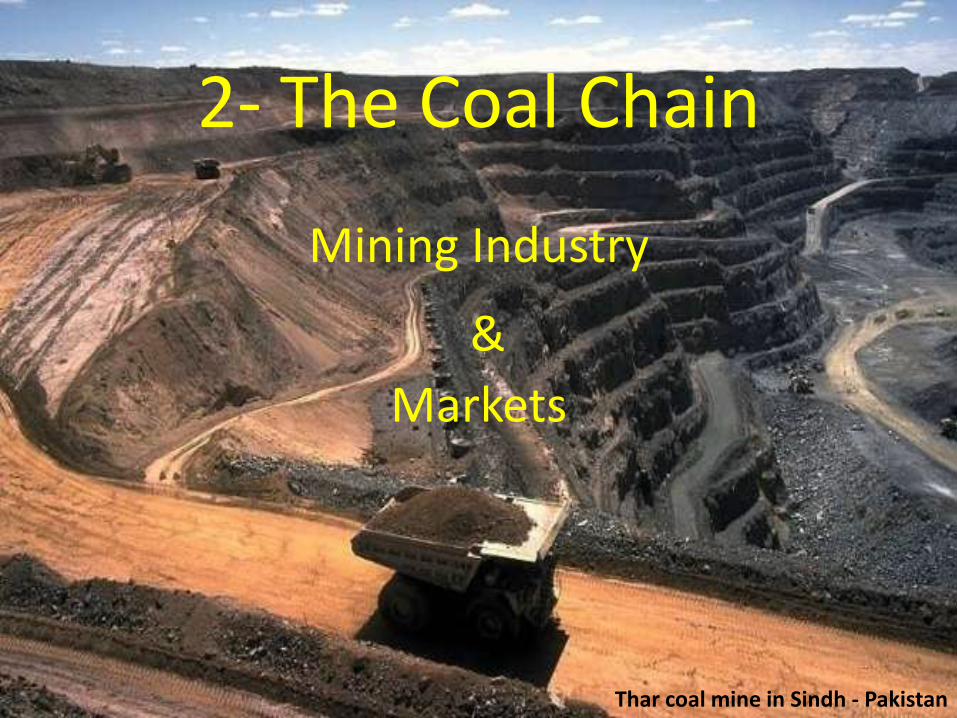
2- The Coal Chain
Mining Industry
&
Markets
Thar coal mine in Sindh - Pakistan

From the Mine to the User :
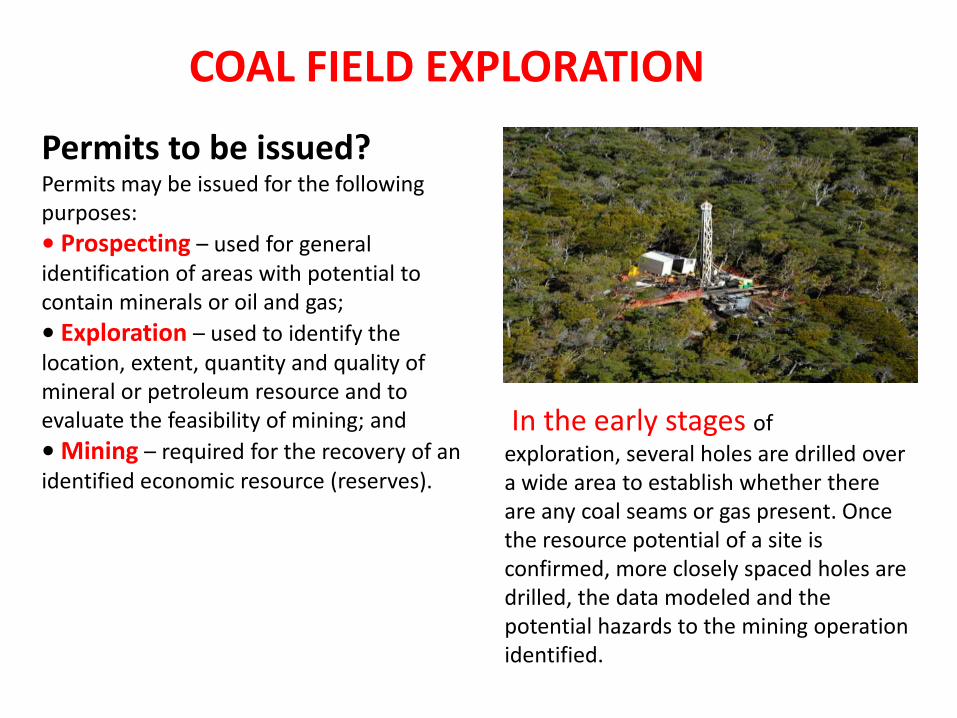
Permits to be issued?Permits may be issued for the following purposes:
• Prospecting – used for general identification of areas with potential to contain minerals or oil and gas;
• Exploration – used to identify the location, extent, quantity and quality of mineral or petroleum resource and to evaluate the feasibility of mining; and
• Mining – required for the recovery of an identified economic resource (reserves).
In the early stages of
exploration, several holes are drilled over a wide area to establish whether there are any coal seams or gas present. Once the resource potential of a site is confirmed, more closely spaced holes are drilled, the data modeled and the potential hazards to the mining operation identified.
COAL FIELD EXPLORATION

Drilling and Core Sampling Technical tests in the hole,Sampling analysisGeophysical logging
- log log geology profile- 3D coal field scheme
Exploration drilling & core sampling
Solid Energy
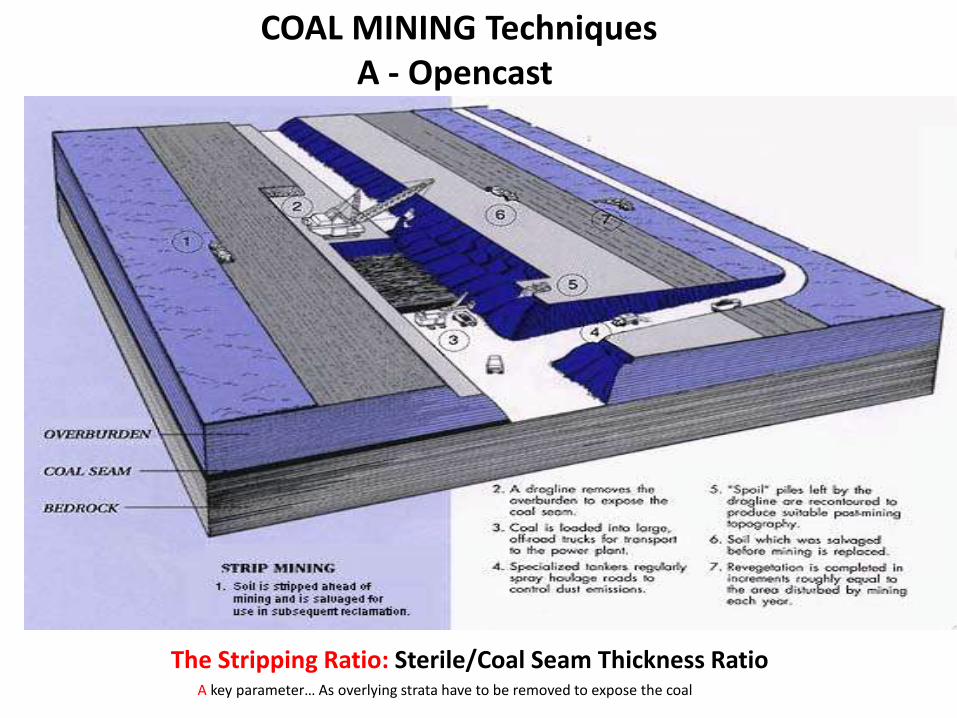
The Stripping Ratio: Sterile/Coal Seam Thickness RatioA key parameter… As overlying strata have to be removed to expose the coal
COAL MINING TechniquesA - Opencast
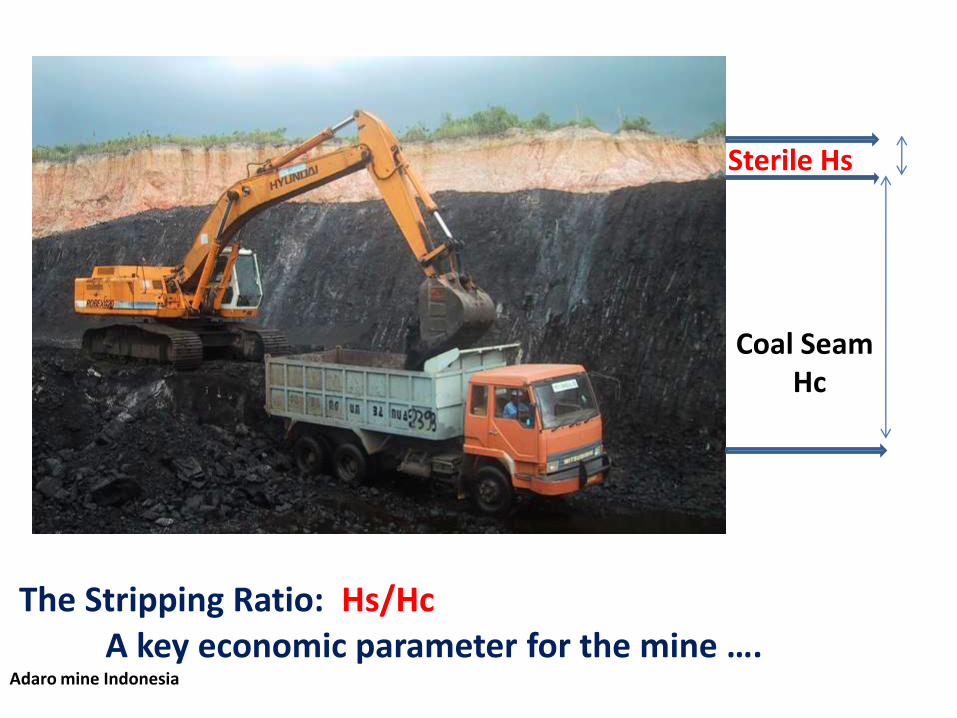
Coal SeamHc
Sterile Hs
The Stripping Ratio: Hs/HcA key economic parameter for the mine ….
Adaro mine Indonesia

-
• Truck and Shovel :massive loaders and trucks
• low capital intensive (Contractors)
• High operating costs (Fuel-Tyres..)
• Low Capex & Flexible Methodology
to adapt various geological conditions
with small to massive deposits
• Stripping ratio is the key economic parameter
• High Mechanisation & Productivity
10/20 000t/man.Yr
Truck and Shovel: Civil Worksto load and remove the uncovered Coal
Hunter valley Australia
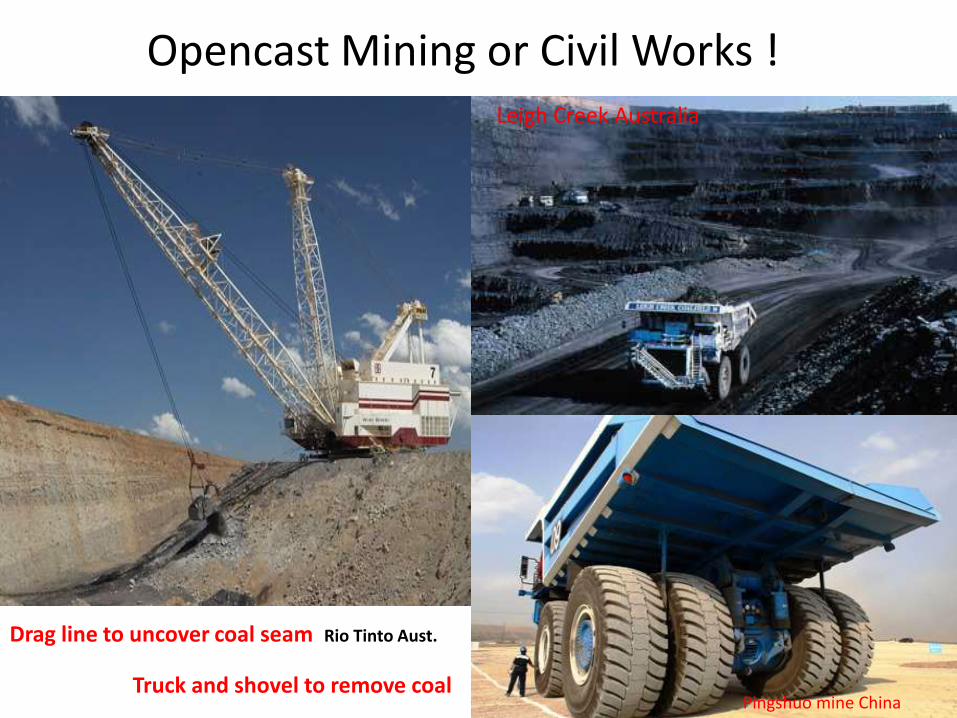
Drag line to uncover coal seam Rio Tinto Aust.
Truck and shovel to remove coal
Opencast Mining or Civil Works !
Pingshuo mine China
Leigh Creek Australia
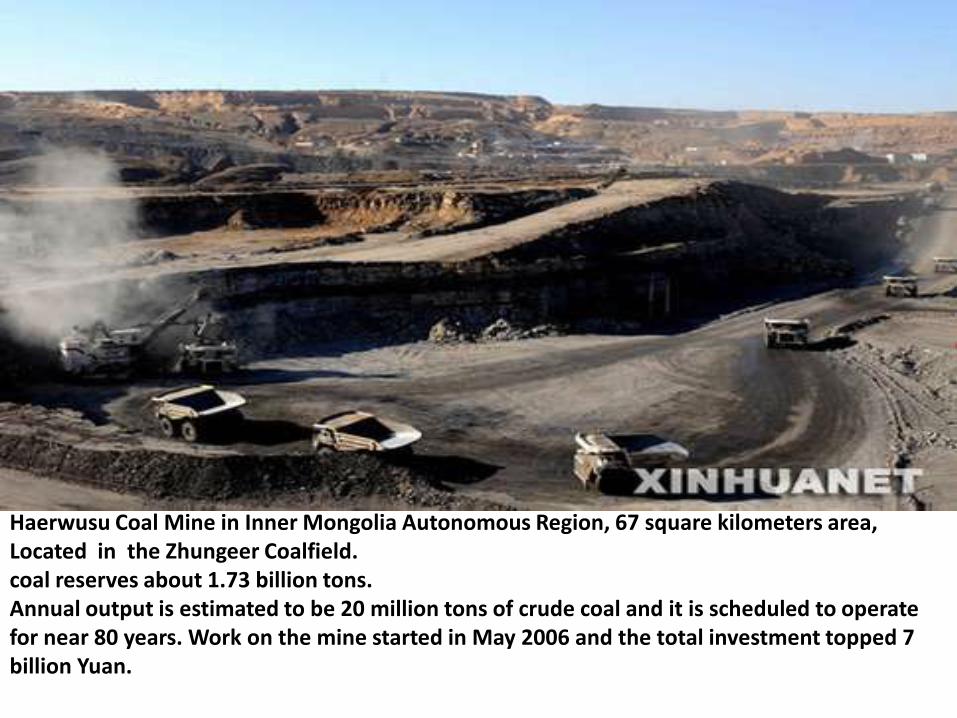
Haerwusu Coal Mine in Inner Mongolia Autonomous Region, 67 square kilometers area, Located in the Zhungeer Coalfield. coal reserves about 1.73 billion tons. Annual output is estimated to be 20 million tons of crude coal and it is scheduled to operate for near 80 years. Work on the mine started in May 2006 and the total investment topped 7 billion Yuan.
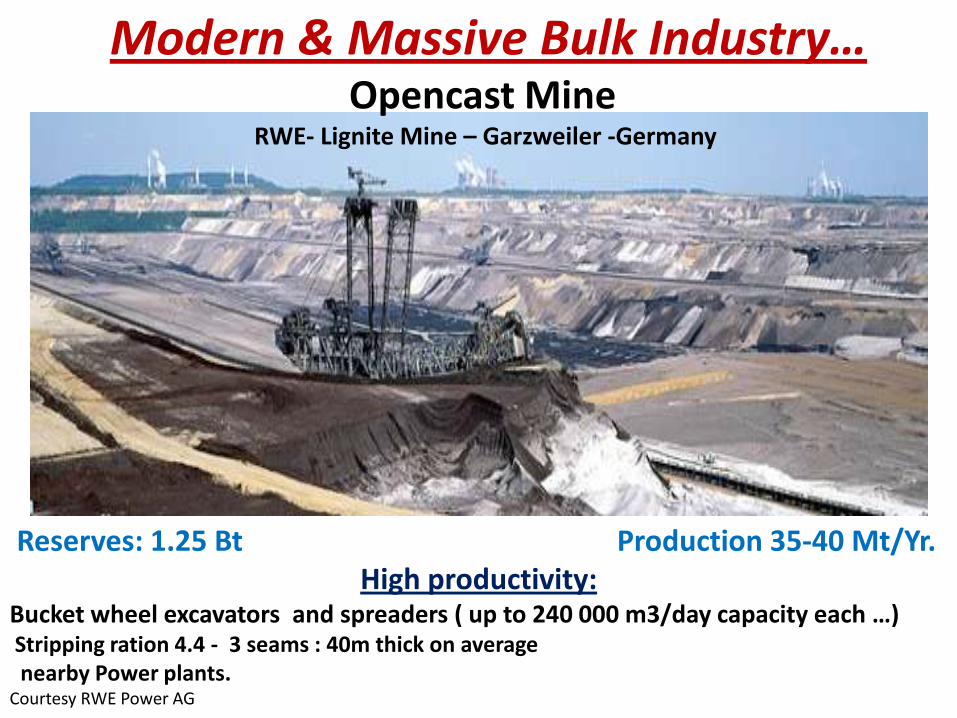
Modern & Massive Bulk Industry…Opencast Mine
RWE- Lignite Mine – Garzweiler -Germany
Reserves: 1.25 Bt Production 35-40 Mt/Yr.High productivity:
Bucket wheel excavators and spreaders ( up to 240 000 m3/day capacity each …) Stripping ration 4.4 - 3 seams : 40m thick on average nearby Power plants.
Courtesy RWE Power AG
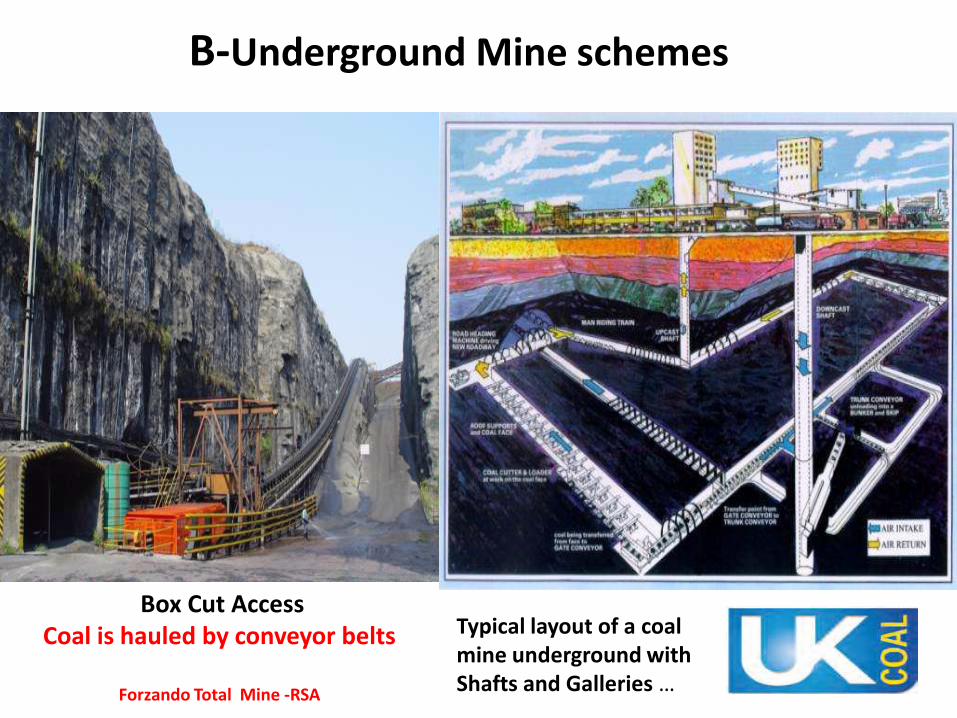
B-Underground Mine schemes
Box Cut Access Coal is hauled by conveyor belts
Forzando Total Mine -RSA
Typical layout of a coal mine underground with Shafts and Galleries …
-
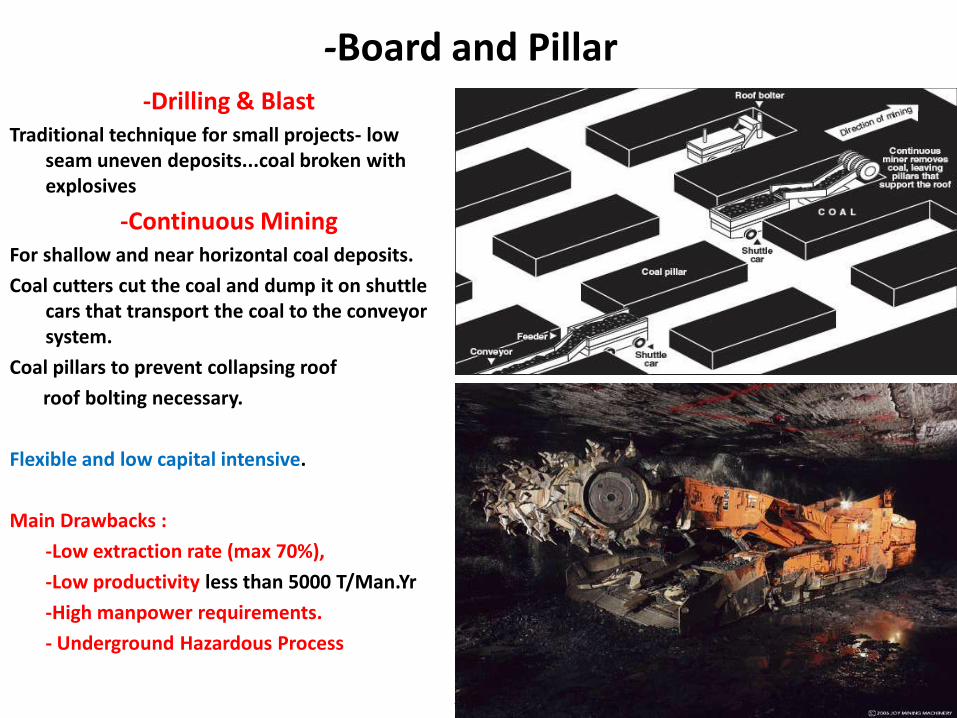
-Board and Pillar -Drilling & Blast
Traditional technique for small projects- low seam uneven deposits...coal broken with explosives
-Continuous Mining For shallow and near horizontal coal deposits.
Coal cutters cut the coal and dump it on shuttle cars that transport the coal to the conveyor system.
Coal pillars to prevent collapsing roof
roof bolting necessary.
Flexible and low capital intensive.
Main Drawbacks :
-Low extraction rate (max 70%),
-Low productivity less than 5000 T/Man.Yr
-High manpower requirements.
- Underground Hazardous Process

Continuous Miner & Continuous Haulage
Forzando Mine -TOTAL South Africa
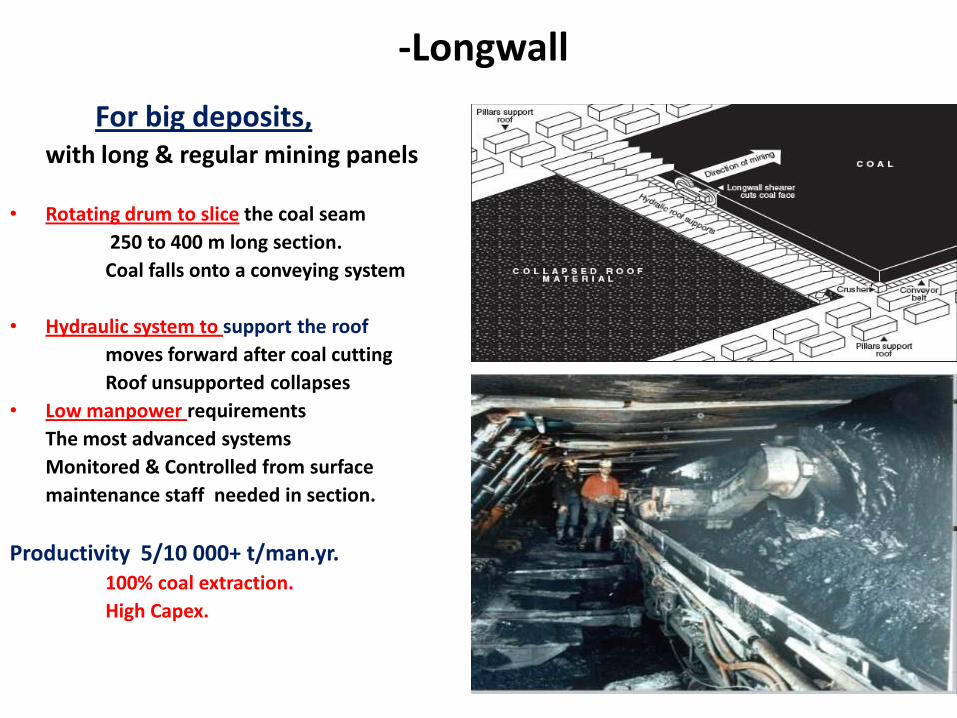
-Longwall
For big deposits, with long & regular mining panels
• Rotating drum to slice the coal seam
250 to 400 m long section.
Coal falls onto a conveying system
• Hydraulic system to support the roof
moves forward after coal cutting
Roof unsupported collapses
• Low manpower requirements
The most advanced systems
Monitored & Controlled from surface
maintenance staff needed in section.
Productivity 5/10 000+ t/man.yr.100% coal extraction.
High Capex.
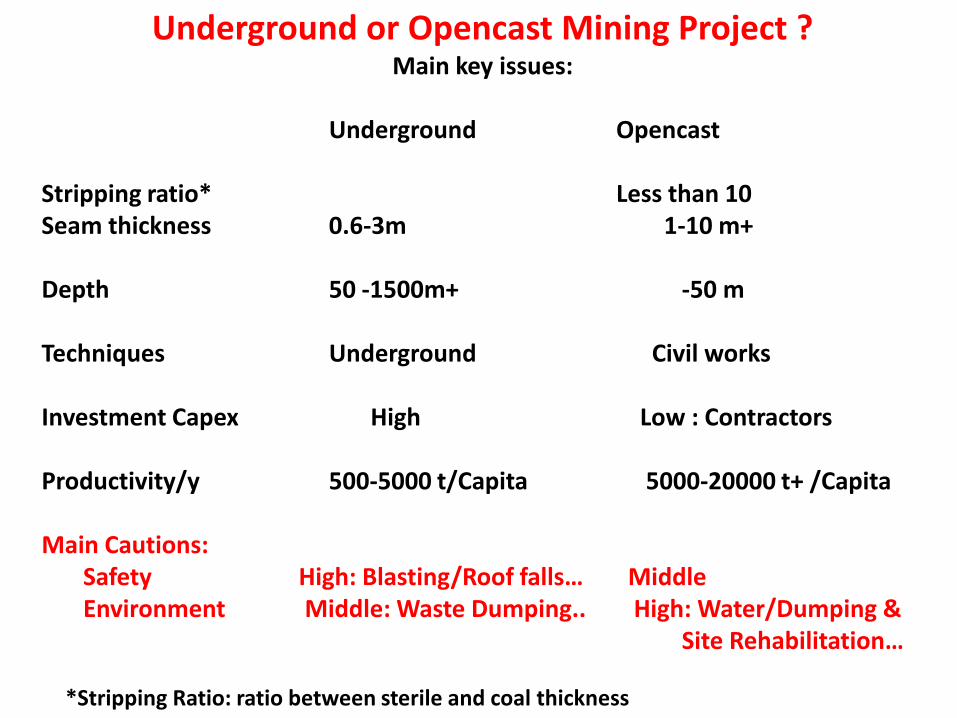
Underground or Opencast Mining Project ?Main key issues:
Underground Opencast
Stripping ratio* Less than 10Seam thickness 0.6-3m 1-10 m+
Depth 50 -1500m+ -50 m
Techniques Underground Civil works
Investment Capex High Low : Contractors
Productivity/y 500-5000 t/Capita 5000-20000 t+ /Capita
Main Cautions: Safety High: Blasting/Roof falls… MiddleEnvironment Middle: Waste Dumping.. High: Water/Dumping &
Site Rehabilitation…
*Stripping Ratio: ratio between sterile and coal thickness
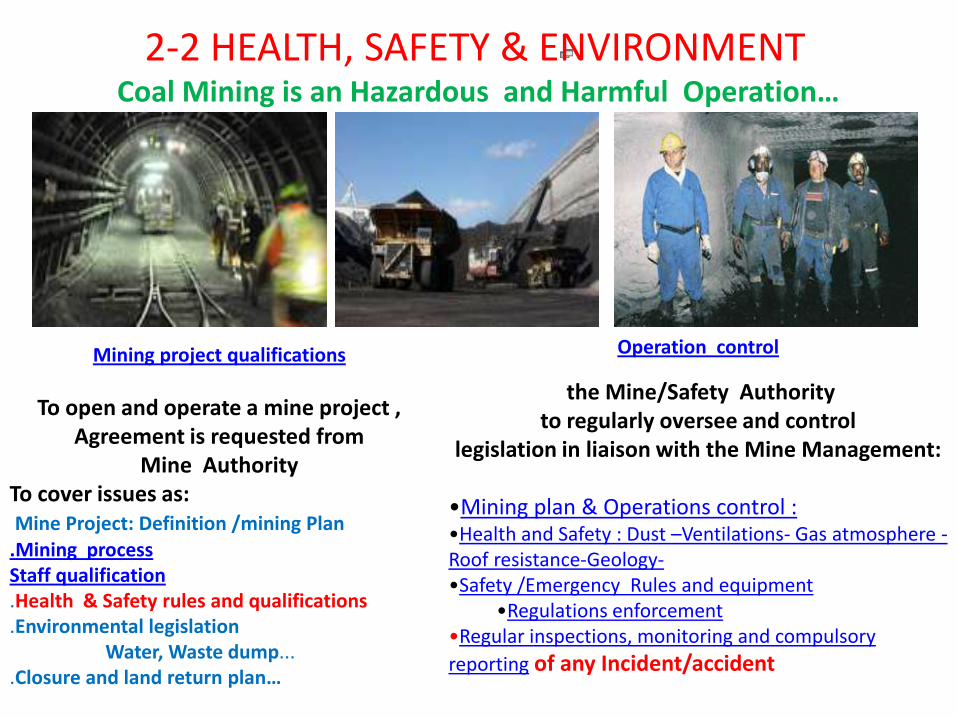
Mining project qualifications
To open and operate a mine project , Agreement is requested from
Mine Authority To cover issues as: Mine Project: Definition /mining Plan
.Mining process Staff qualification .Health & Safety rules and qualifications.Environmental legislation
Water, Waste dump... .Closure and land return plan…
Operation control
the Mine/Safety Authority to regularly oversee and control
legislation in liaison with the Mine Management:
•Mining plan & Operations control :•Health and Safety : Dust –Ventilations- Gas atmosphere -Roof resistance-Geology-•Safety /Emergency Rules and equipment
•Regulations enforcement •Regular inspections, monitoring and compulsory
reporting of any Incident/accident
2-2 HEALTH, SAFETY & ENVIRONMENTCoal Mining is an Hazardous and Harmful Operation…

A-Major Underground Mining Risks Usual Preventive Measures:
Gas Blast from Methane Atmosphere continuous monitoring 5-10% : Spontaneous blast! Continuous ventilation
Anti-deflagration and electrical class equipments
Dust Blast Watering and dust captureLime on walls and roof
Roof Fall Roof bolting - wood pillars…
Water flood Pumping equipment
Work is performed within a confined Environment with slippery Soil – regular Blasting -Coal Haulage and Equipment moves …with darkness, humidity, warmth …constraints
Medical follow up and first emergency Cares
Health,Safety & Environment –HSE Concerns
-
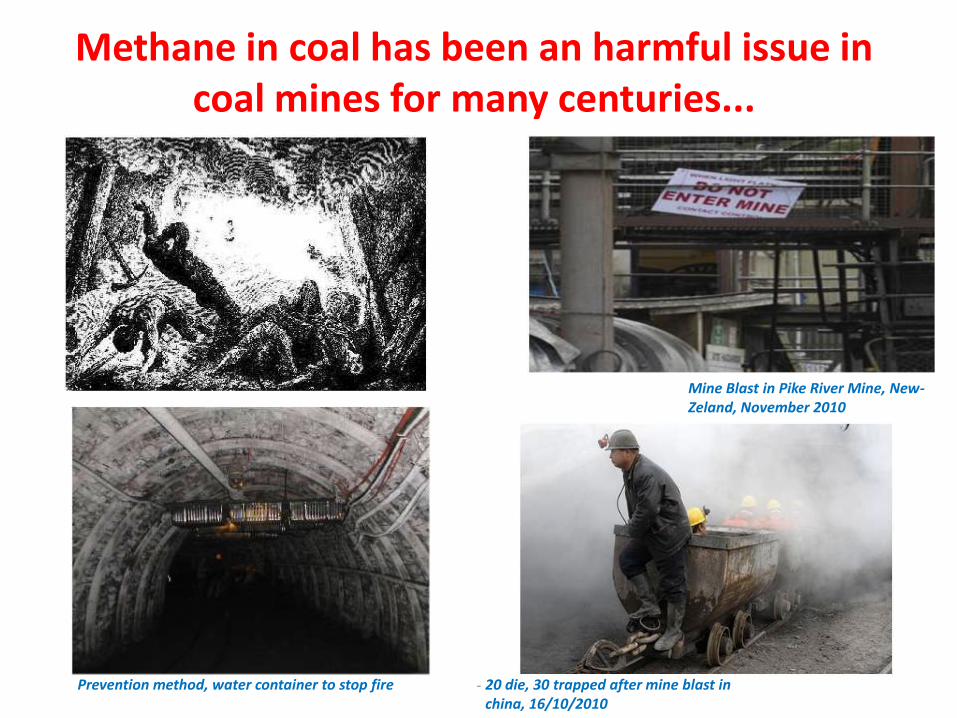
Methane in coal has been an harmful issue in coal mines for many centuries...
Mine Blast in Pike River Mine, New-Zeland, November 2010
Prevention method, water container to stop fire 20 die, 30 trapped after mine blast in china, 16/10/2010

Coal dust is a fine powdered form of coal, which is created because of the brittle
nature of coal, during mining, transportation, or by mechanically handling coal…
-Risks Explosions
Coal dust in air is explosive -- dust has far more surface area per unit weight than lumps of
coal, and is more susceptible to spontaneous combustion.
Gallery Coal wall to be covered by lime/limestone solution
The worst mining accidents have been caused by coal dust explosions,
Senghenydd in South Wales in 1913 -- 439 miners died,
Courrières mine disaster in Northern France which killed 1,099 miners in 1906Y
- Harmful for workers: pneumoconiosis, or black lung disease …
Le Petit Journal illustration of the Courrières mine disaster
Pit head of the Senghenydd Colliery in October 1913 after the coal dust explosion
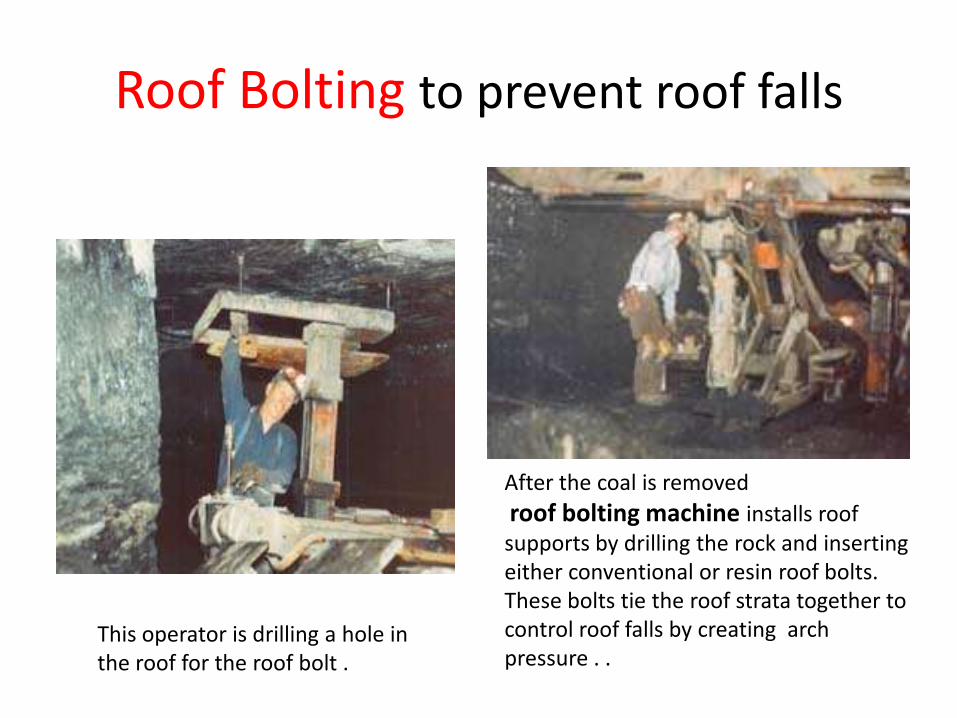
Roof Bolting to prevent roof falls
This operator is drilling a hole in the roof for the roof bolt .
After the coal is removed
roof bolting machine installs roof supports by drilling the rock and inserting either conventional or resin roof bolts.These bolts tie the roof strata together to control roof falls by creating arch pressure . .
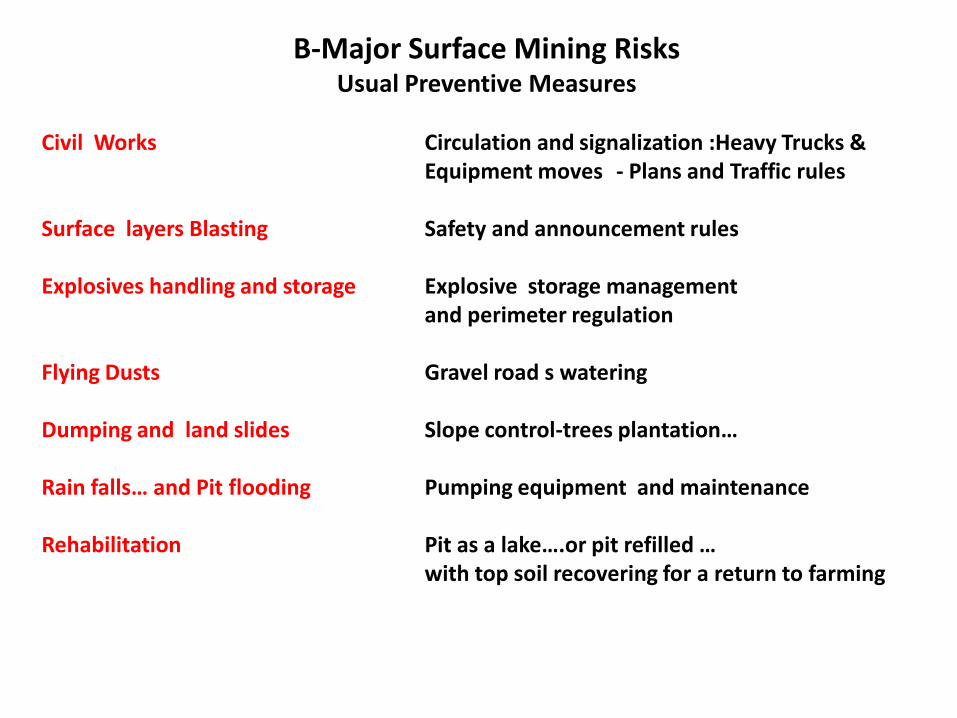
B-Major Surface Mining Risks Usual Preventive Measures
Civil Works Circulation and signalization :Heavy Trucks & Equipment moves - Plans and Traffic rules
Surface layers Blasting Safety and announcement rules
Explosives handling and storage Explosive storage management and perimeter regulation
Flying Dusts Gravel road s watering
Dumping and land slides Slope control-trees plantation…
Rain falls… and Pit flooding Pumping equipment and maintenance
Rehabilitation Pit as a lake….or pit refilled …with top soil recovering for a return to farming
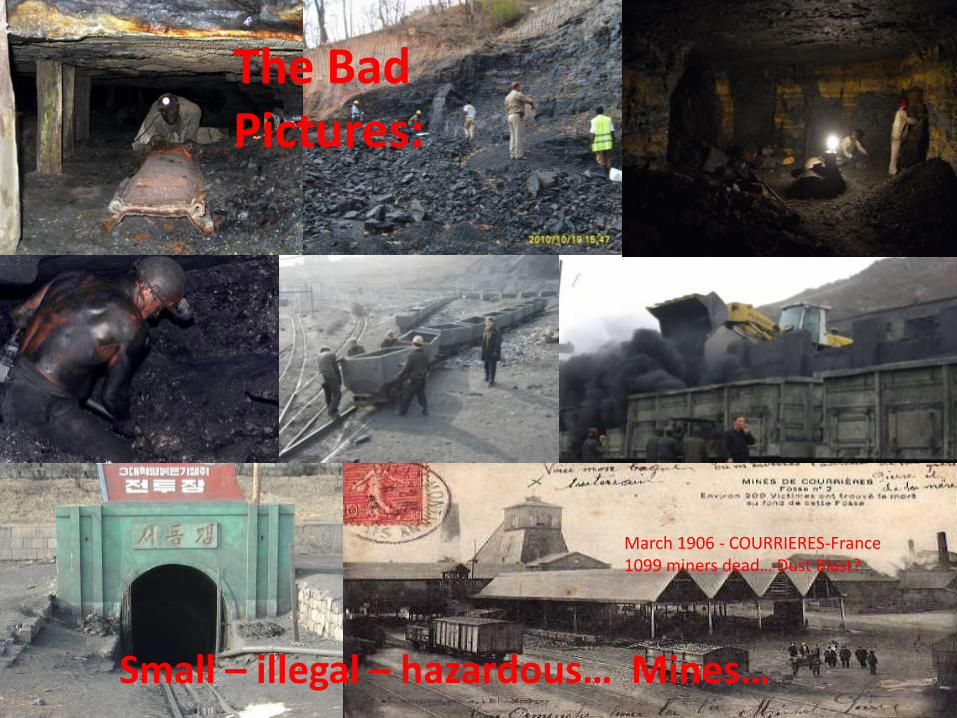
The Bad
March 1906 - COURRIERES-France1099 miners dead… Dust Blast?
Small – illegal – hazardous… Mines…
The Bad Pictures:
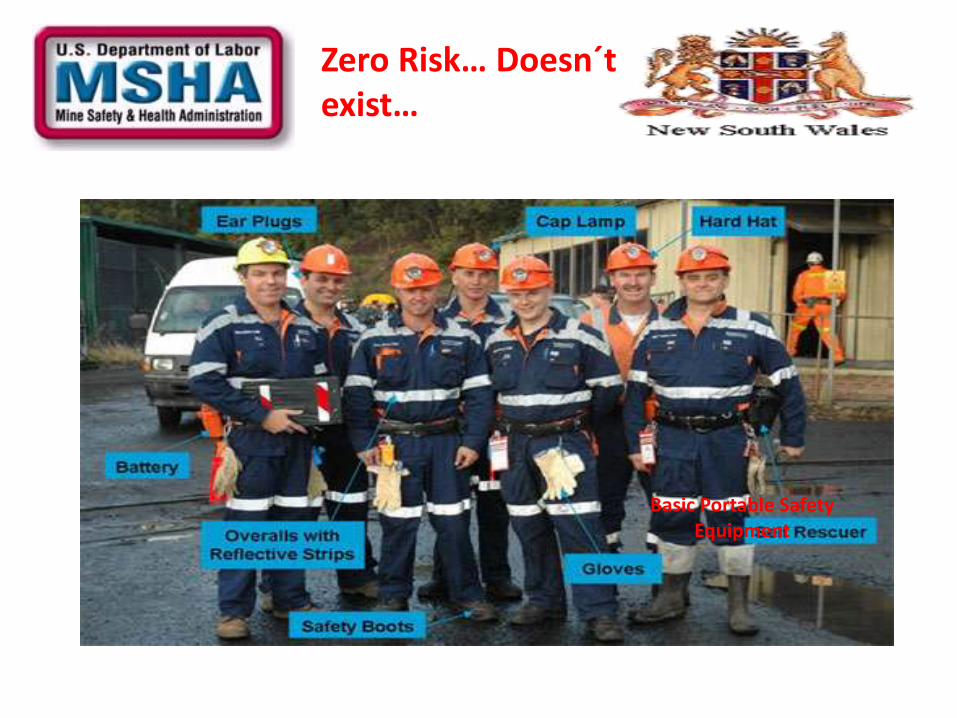
Basic Portable Safety Equipment
Zero Risk… Doesn´t exist…
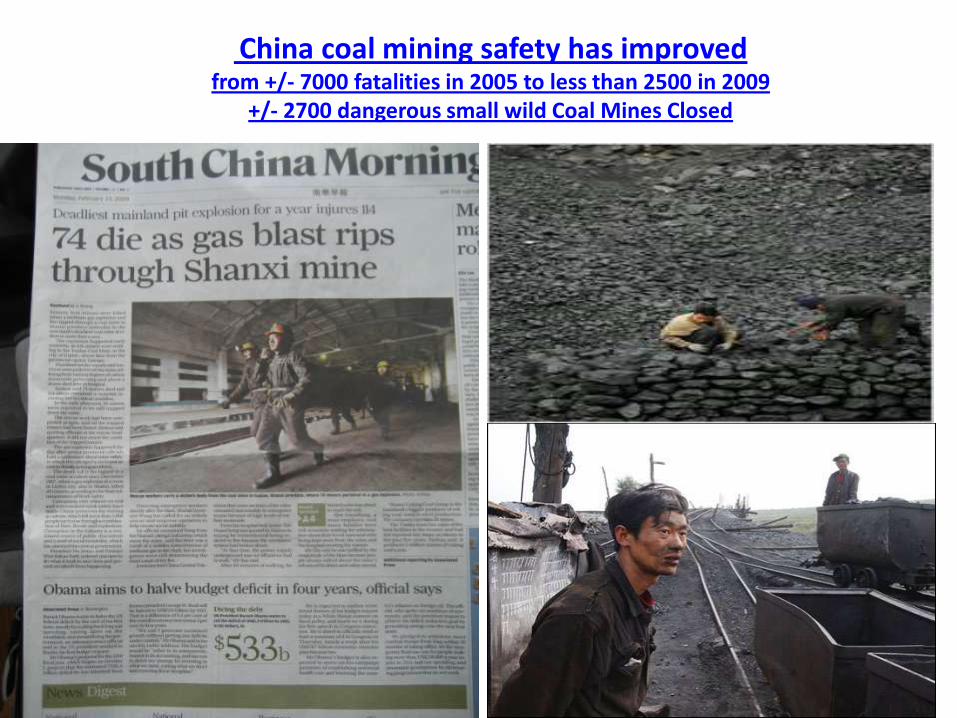
China coal mining safety has improvedfrom +/- 7000 fatalities in 2005 to less than 2500 in 2009
+/- 2700 dangerous small wild Coal Mines Closed

Coal Preparation /Beneficiation to deliver a Commercial & Consistent Quality
Run of mine (RoM)Coal : Heterogeneous material with high mineral matter contents ..... 5-50% with variations within the seam and/or the coalfield
1-Preparation: Sizing & Crushing RoM lumps to split organic from mineral
2-BeneficiationDense Medium Separation *based on gravimetric split between
Coal - density #1/ 1.2 andMineral matters (Shale/carbonate..)density 2.6+
Usual Commercial Coal density 1.5/1.6 max
Ash content 10-15% CV 22-27 MJ/kgSizing 0-50/70 mm
+ most usual process
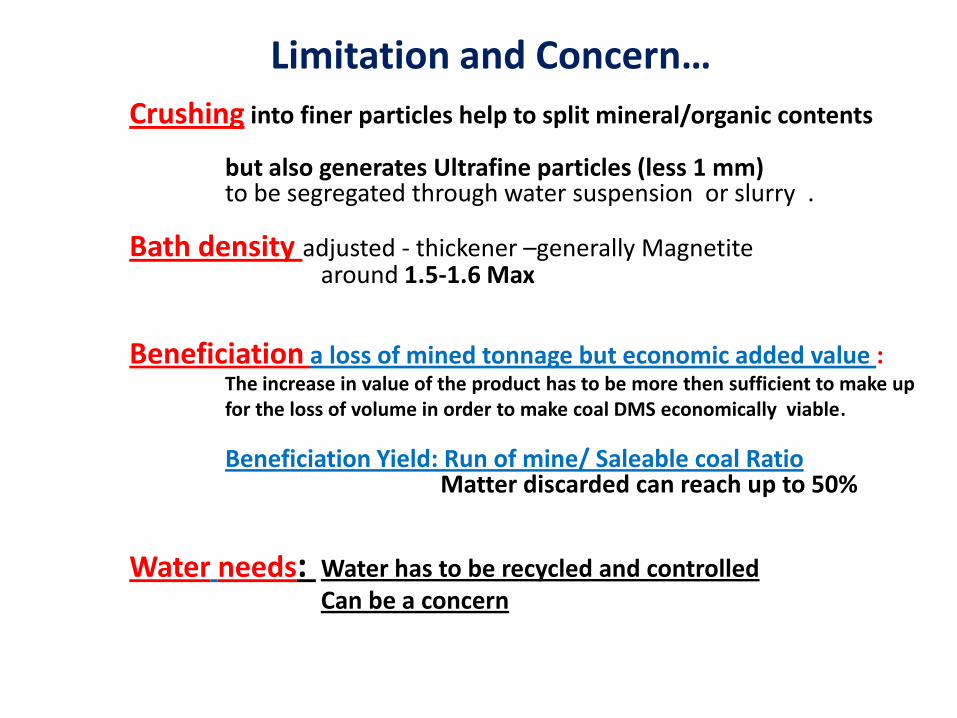
Crushing into finer particles help to split mineral/organic contents
but also generates Ultrafine particles (less 1 mm) to be segregated through water suspension or slurry .
Bath density adjusted - thickener –generally Magnetite around 1.5-1.6 Max
Beneficiation a loss of mined tonnage but economic added value :The increase in value of the product has to be more then sufficient to make up for the loss of volume in order to make coal DMS economically viable.
Beneficiation Yield: Run of mine/ Saleable coal Ratio Matter discarded can reach up to 50%
Water needs: Water has to be recycled and controlled Can be a concern
Limitation and Concern…

The Needs for Coal Beneficiation ?High Ash content impacts
on Combustion processing and transport costs
+/- 1/3 of worldwide coal production Coals hauled on long distances have ash content reduced ( +/- 15% max generally )
India is a point in case:Most of the coal for power generation Is ROM with ash content up to 40%.
Beneficiation difficult due to fine mineral particulates in coal Government of India has mandated that coal shipped to power plants more than 1 000 km from the mine should be washed -so that ash content is limited to 32% ± 2% Max!!
R&D : needs for coal beneficiation progress ?New technologies needed to increase the yield of low‐ash coal andto reduce water consumption
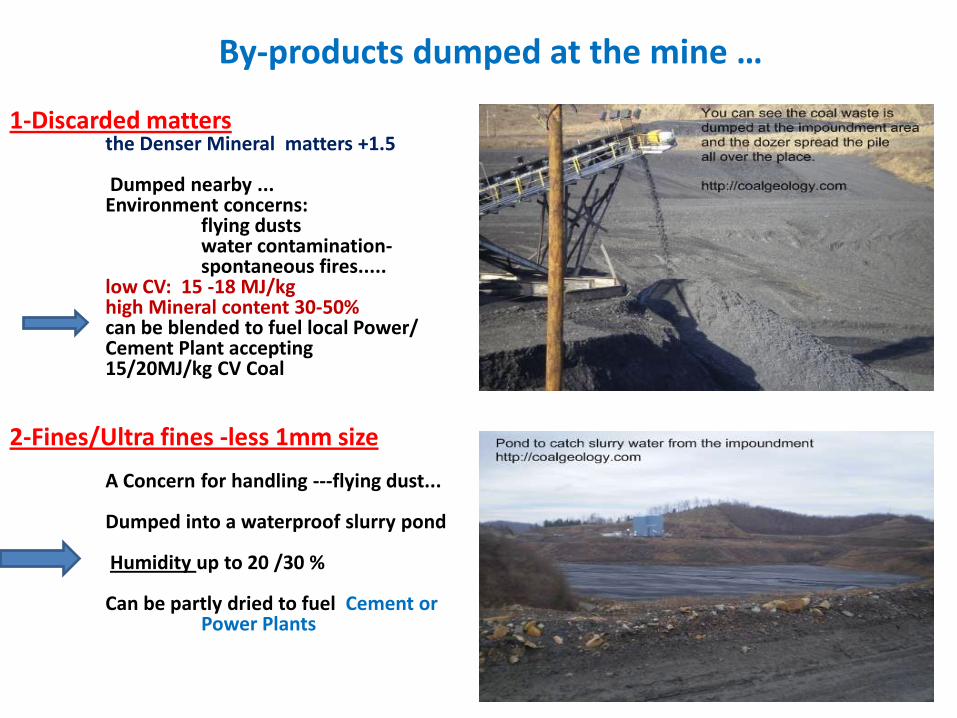
1-Discarded matters the Denser Mineral matters +1.5
Dumped nearby ... Environment concerns:
flying dusts water contamination-spontaneous fires.....
low CV: 15 -18 MJ/kghigh Mineral content 30-50% can be blended to fuel local Power/ Cement Plant accepting 15/20MJ/kg CV Coal
2-Fines/Ultra fines -less 1mm size
A Concern for handling ---flying dust...
Dumped into a waterproof slurry pond
Humidity up to 20 /30 %
Can be partly dried to fuel Cement or Power Plants
By-products dumped at the mine …
High Moisture Coal: Lignite - Peat…
• +/- 45% of the World’s coal resources are LigniteMoisture content - up to 50% on AR basis…
Still a cheap source of fuel for Power generation in many Countries:
Drying Coal at the mine ?
Not economic Coal a Hydrophilic Material and recaptures humidity quickly
dried coal can be inflammable…
Therefore
High moisture coals burnt at Mine Mouth Power Plant-
Pre-drying units to cut Humidity down to +/-10 % max
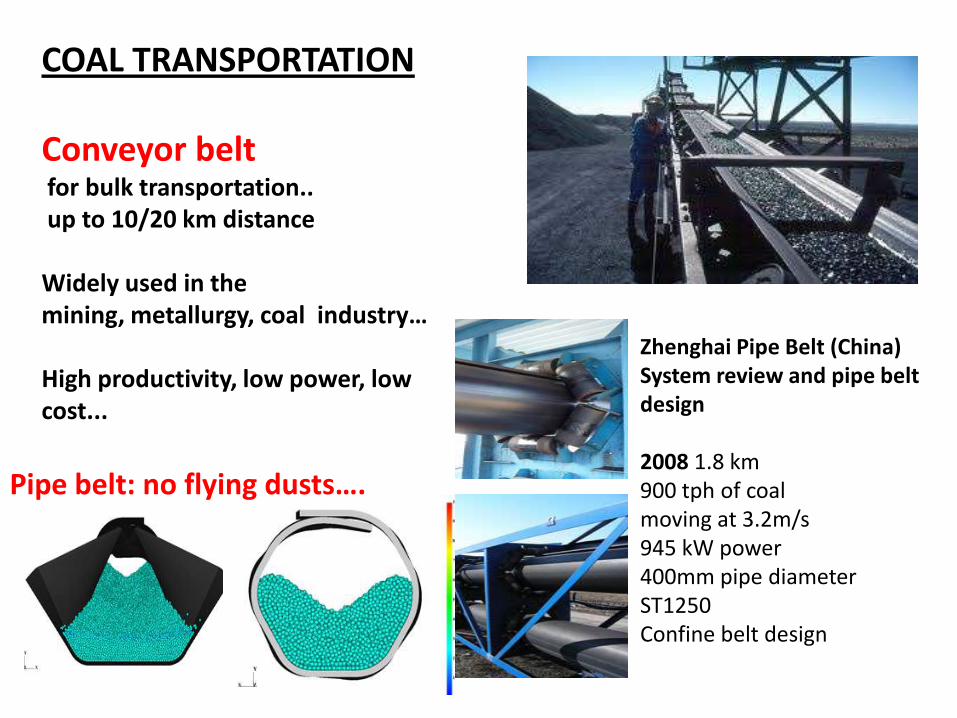
COAL TRANSPORTATION
Conveyor beltfor bulk transportation..up to 10/20 km distance
Widely used in the mining, metallurgy, coal industry…
High productivity, low power, low cost...
Zhenghai Pipe Belt (China)System review and pipe belt design
2008 1.8 km900 tph of coal moving at 3.2m/s 945 kW power400mm pipe diameter ST1250Confine belt design
Pipe belt: no flying dusts….

Krupp coal stacker featuring tripper conveyor and
non-slewing, luffing boom at RTCA Kestrel MineKrupp bridge reclaimer at RTCA Kestrel Mine
Coal Stockpile Management
Coal storage silos at Laramie Basic Electric Station, and a vista of Platte County, Wyoming
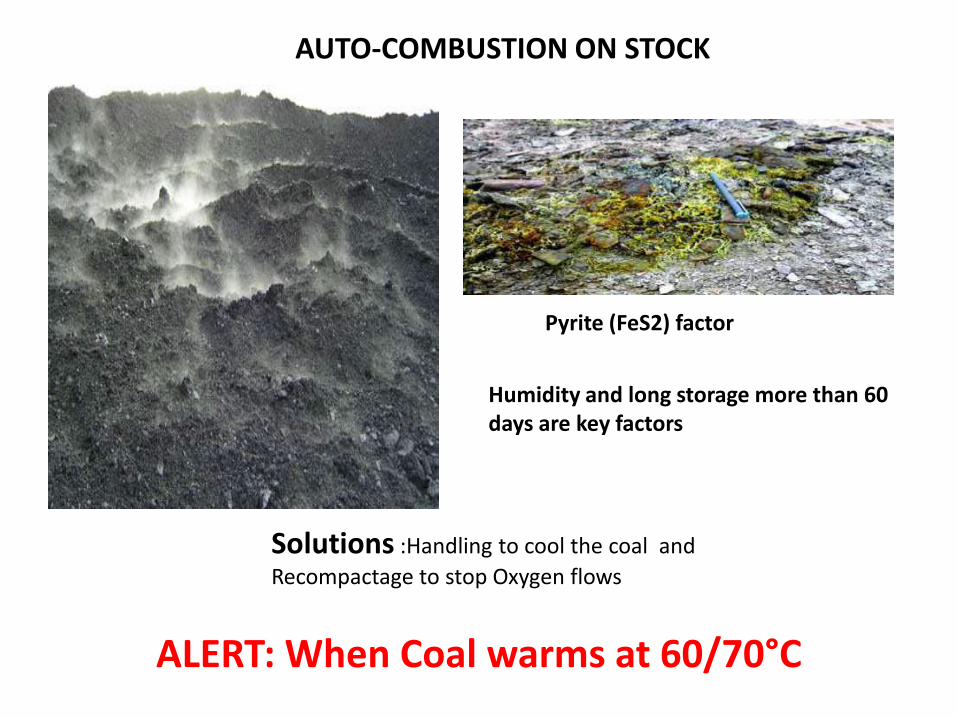
ALERT: When Coal warms at 60/70°C
AUTO-COMBUSTION ON STOCK
Pyrite (FeS2) factor
Humidity and long storage more than 60 days are key factors
Solutions :Handling to cool the coal and
Recompactage to stop Oxygen flows
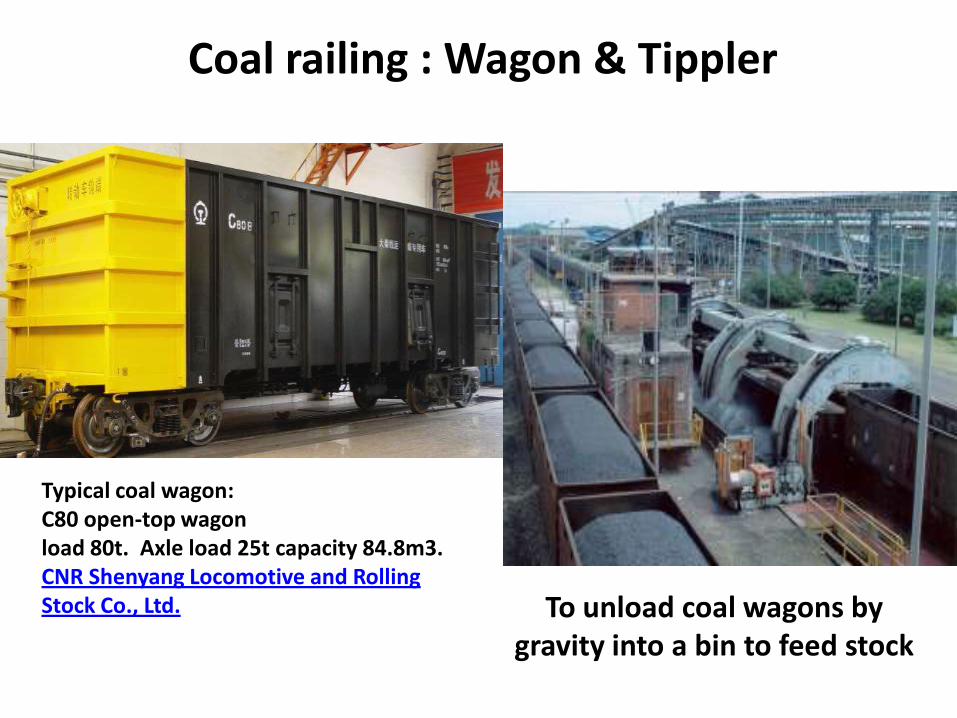
Coal railing : Wagon & Tippler
To unload coal wagons by gravity into a bin to feed stock
Typical coal wagon: C80 open-top wagon load 80t. Axle load 25t capacity 84.8m3. CNR Shenyang Locomotive and Rolling Stock Co., Ltd.
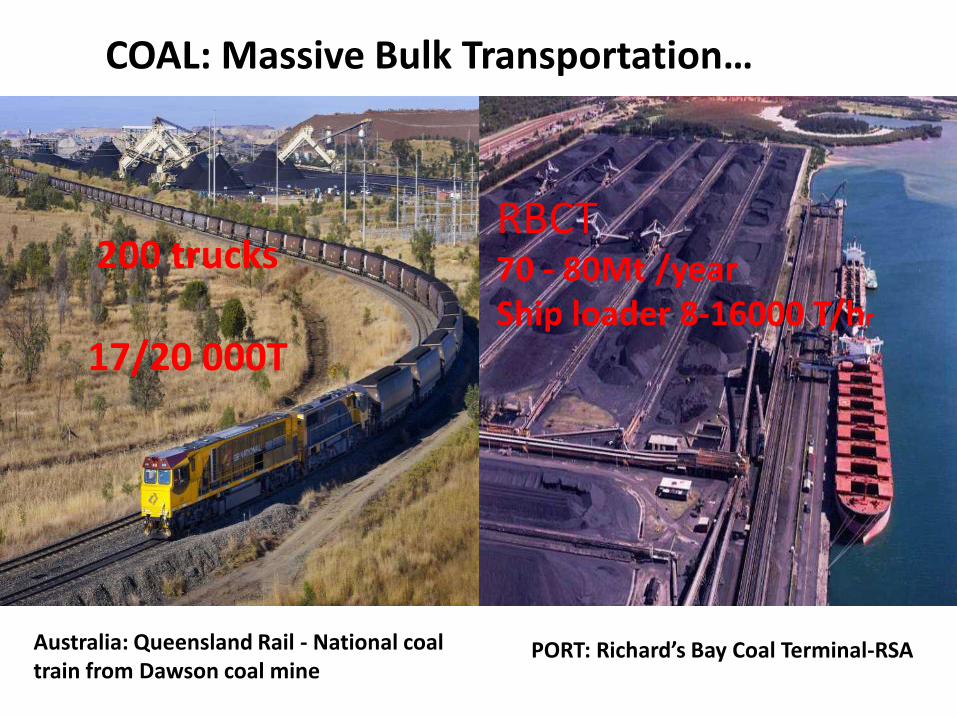
Australia: Queensland Rail - National coal train from Dawson coal mine
PORT: Richard’s Bay Coal Terminal-RSA
RBCT70 - 80Mt /yearShip loader 8-16000 T/hr
COAL: Massive Bulk Transportation…
200 trucks
17/20 000T
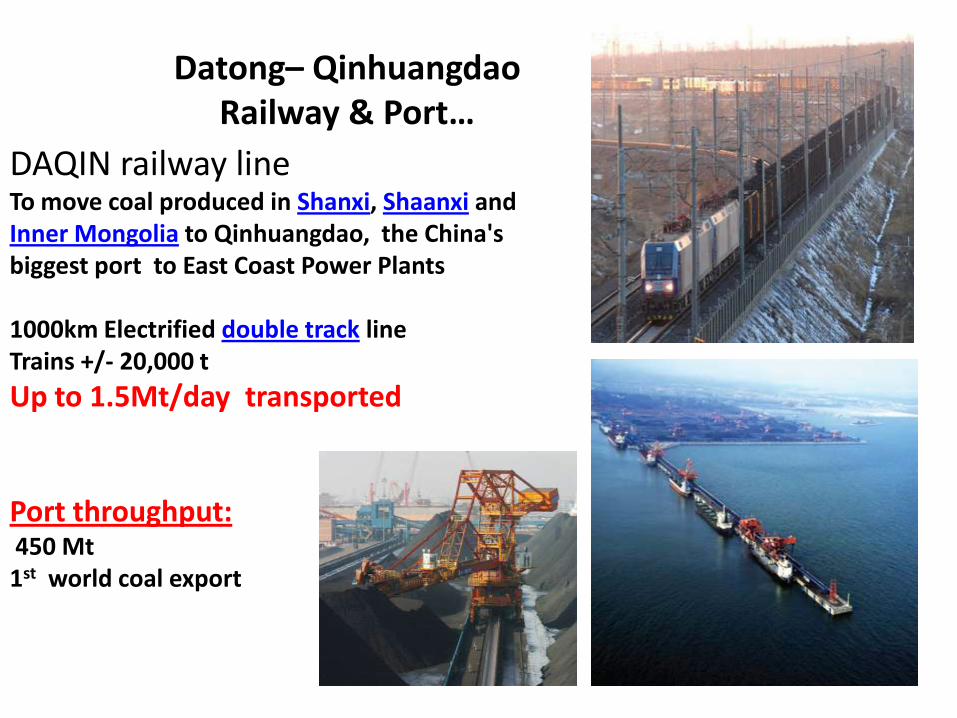
Datong– Qinhuangdao Railway & Port…
DAQIN railway lineTo move coal produced in Shanxi, Shaanxi and Inner Mongolia to Qinhuangdao, the China's biggest port to East Coast Power Plants
1000km Electrified double track lineTrains +/- 20,000 t
Up to 1.5Mt/day transported
Port throughput:450 Mt 1st world coal export

A ship loader: to load vessels Using a belt conveyor to move continuously bulk product from coalyard onto the vessels and
limiting Coal breaking in small lumps/fines The LAXT 8000 M TPH ship loader
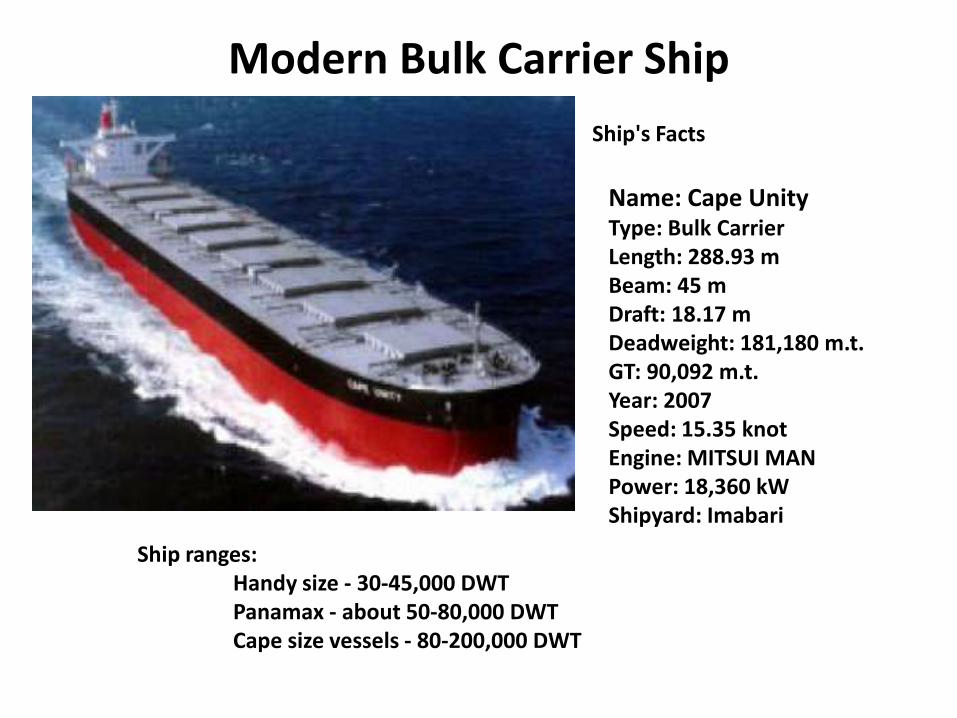
Ship ranges:Handy size - 30-45,000 DWTPanamax - about 50-80,000 DWTCape size vessels - 80-200,000 DWT
Ship's Facts
Name: Cape UnityType: Bulk CarrierLength: 288.93 m Beam: 45 mDraft: 18.17 mDeadweight: 181,180 m.t.GT: 90,092 m.t.Year: 2007Speed: 15.35 knotEngine: MITSUI MANPower: 18,360 kWShipyard: Imabari
Modern Bulk Carrier Ship
Global Coal Flow & Seaborne Markets
Coal is a global industry, coal mined commercially in over 50 countries and used in over 70.
A large number of International operators to insure competitive and efficient market & trading .
80% of produced coal is used locally

TOP COAL EXPORTERS 2013 MT+/-12 Countries
Steam* Total Coal
Indonesia 423 +11% 426
Australia 182 +18% 336 Met Coal
Russia 118 141
USA 47 -8% 107 Met Coal
South Africa 72 72
Colombia 73 74
Canada 4 37 Met Coal
Others** 109 141
Total… 1028 + 6.4% 1334 +6.2% / 2012Y +10.5%
•* also Kazakhstan-Venezuela-Poland- Ukrainia -New Zealand….•Steam Coal: coal for Boiler /Heat Plant
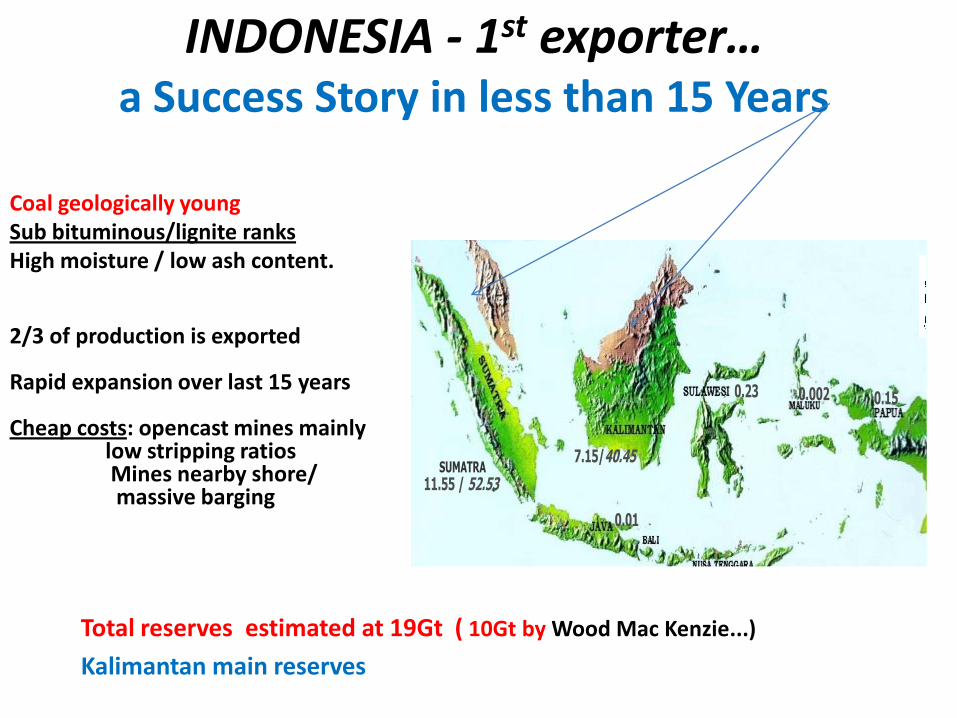
INDONESIA - 1st exporter… a Success Story in less than 15 Years
Total reserves estimated at 19Gt ( 10Gt by Wood Mac Kenzie...)
Kalimantan main reserves
SUMATRA
Reserves/Resources(In billion metric tons)
11.55 / 52.53
0.01
7.15/40.45
0.23 0.002 0.15
Total Reserves: 18.7 Bt
Total Resources: 93.4 Bt
Source : Geological Resources Centre (+ Joint Study with NEDO) 2007
SUMATRA
Reserves/Resources(In billion metric tons)
11.55 / 52.53
0.01
7.15/40.45
0.23 0.002 0.15
Total Reserves: 18.7 Bt
Total Resources: 93.4 Bt
Source : Geological Resources Centre (+ Joint Study with NEDO) 2007
Coal geologically youngSub bituminous/lignite ranksHigh moisture / low ash content.
2/3 of production is exported
Rapid expansion over last 15 years
Cheap costs: opencast mines mainlylow stripping ratios Mines nearby shore/massive barging

Floating barge on the Barito river +/- 200 Kt
Low sulphur & ash
content
PT Kaltim Prima mine BP/ Rio Tinto
40 MT in 2010
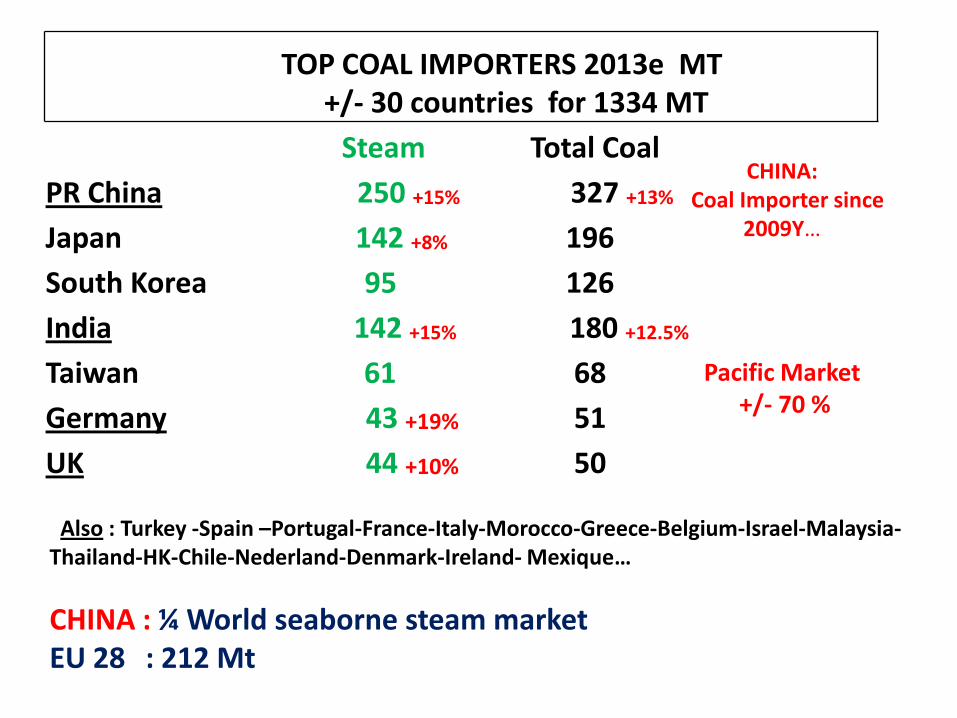
TOP COAL IMPORTERS 2013e MT+/- 30 countries for 1334 MT
Steam Total Coal
PR China 250 +15% 327 +13%
Japan 142 +8% 196
South Korea 95 126
India 142 +15% 180 +12.5%
Taiwan 61 68
Germany 43 +19% 51
UK 44 +10% 50
CHINA:Coal Importer since
2009Y…
Pacific Market+/- 70 %
Also : Turkey -Spain –Portugal-France-Italy-Morocco-Greece-Belgium-Israel-Malaysia-Thailand-HK-Chile-Nederland-Denmark-Ireland- Mexique…
CHINA : ¼ World seaborne steam marketEU 28 : 212 Mt
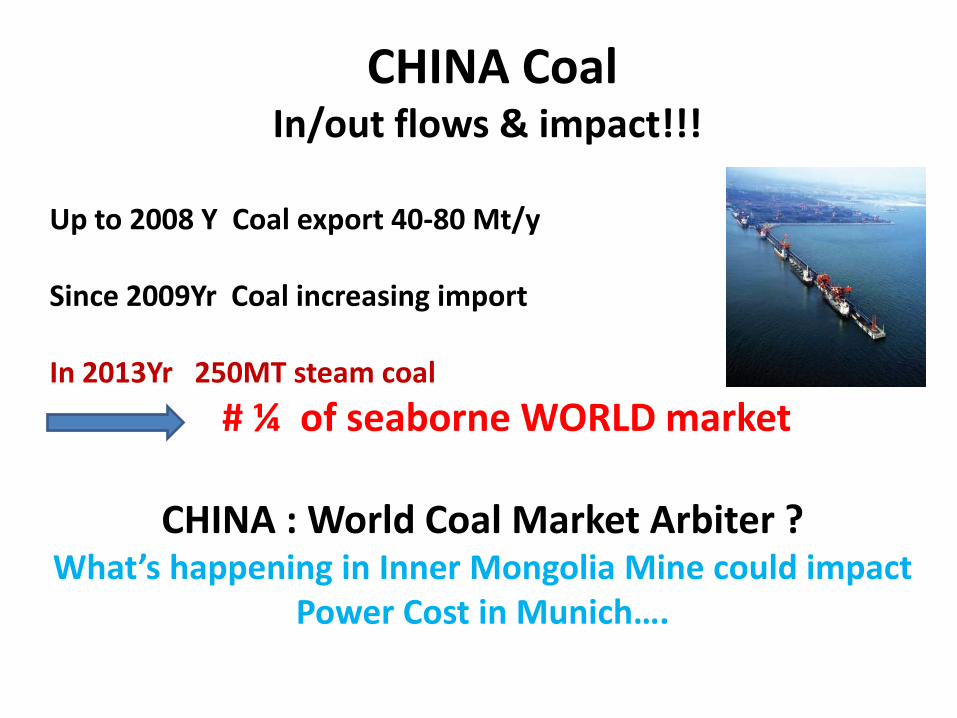
CHINA CoalIn/out flows & impact!!!
Up to 2008 Y Coal export 40-80 Mt/y
Since 2009Yr Coal increasing import
In 2013Yr 250MT steam coal
# ¼ of seaborne WORLD market
CHINA : World Coal Market Arbiter ?What’s happening in Inner Mongolia Mine could impact
Power Cost in Munich….

World Coal Seaborne Trade Boom…
International trade: +/- 20 % Hard Coal
Mined in 50 countries and used in 70+ countries .
Seaborne market to balance demand …
1334MT2013Y of which 1028 MT steam coal
0
200
400
600
800
1000
1200
1400
1600
1985 1990 1995 2000 2005 2010 2015
MT
MT
Cape-size 100/200 000 DWT

Coal Market & Freight Trend USD/T Euracoal / Platts MKloskey. Stats
0
20
40
60
80
100
120
140
160
20
09
20
10
20
11
20
12
20
13
20
14
USD/T FOB NewCASTLE- AU
USD/T NC- Rotterdam
USD/T RBCT-Rotterdam
55 USD Jan 2015

Bulk Freight :The Baltic Dry Index (BDI)
BDI (in USD) issued daily by the London-based Baltic Exchange. the index provides "an assessment of the price of moving the major raw materials by sea. Taking in 23 shipping routes measured on a time charter basis, the index covers Handysize, Supramax, Panamax, and Capesize dry bulk carriers With a range of commodities including coal, iron ore and grain
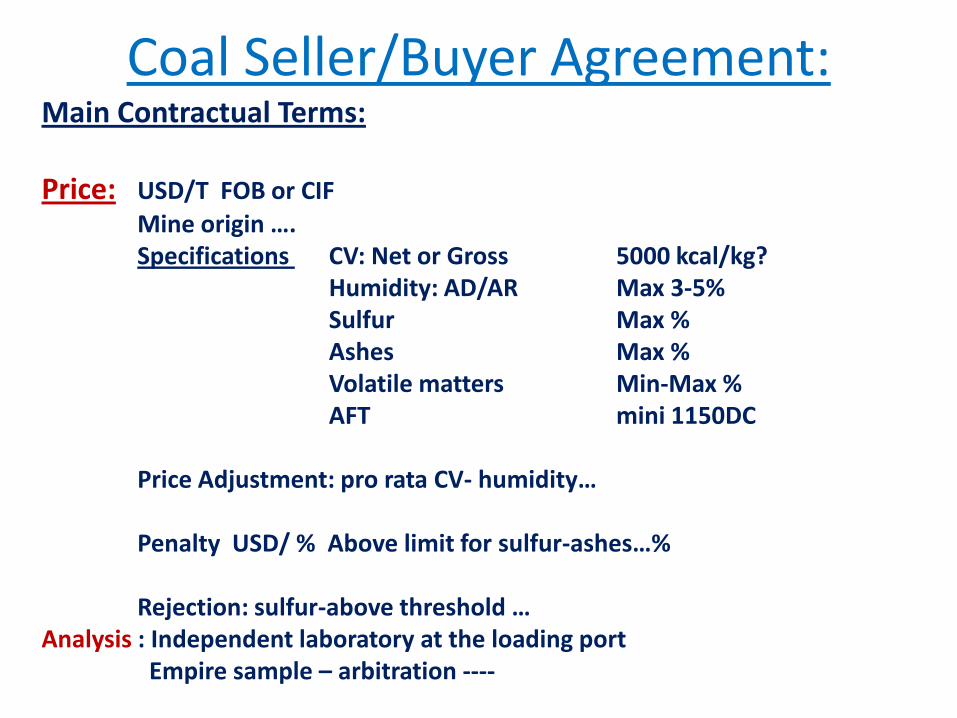
Coal Seller/Buyer Agreement:Main Contractual Terms:
Price: USD/T FOB or CIFMine origin ….Specifications CV: Net or Gross 5000 kcal/kg?
Humidity: AD/AR Max 3-5%Sulfur Max %Ashes Max %Volatile matters Min-Max %AFT mini 1150DC
Price Adjustment: pro rata CV- humidity…
Penalty USD/ % Above limit for sulfur-ashes…%
Rejection: sulfur-above threshold …Analysis : Independent laboratory at the loading port
Empire sample – arbitration ----

FOB – Free on Board (named port of shipment)The seller pays for transportation of goods to the port of shipment, loading cost.The buyer pays cost of marine freight transportation, insurance, unloading and transportation cost from the arrival port to destination. The passing of risk occurs when the goods are in buyer account. the buyer arranges for the vessel and the shipper has to load the goods and the named vessel at the named port of shipment with the dates stipulated in the contract of sale as informed by the buyer .
CFR – Cost and Freight (named port of destination)Seller must pay the costs and freight to bring the goods to the port of destination. However, risk is transferred to the buyer once the goods are loaded on the vessel. Insurance for the goods is NOT included. This term is formerly known as CNF (C&F, or C+F).
CIF – Cost, Insurance and Freight (named port of destination)Exactly the same as CFR except that the seller must in addition procure and pay for the insurance. Maritime transport only.
*International commercial terms International Chamber of Commerce
INCOTERMS *: International Seaborne trade
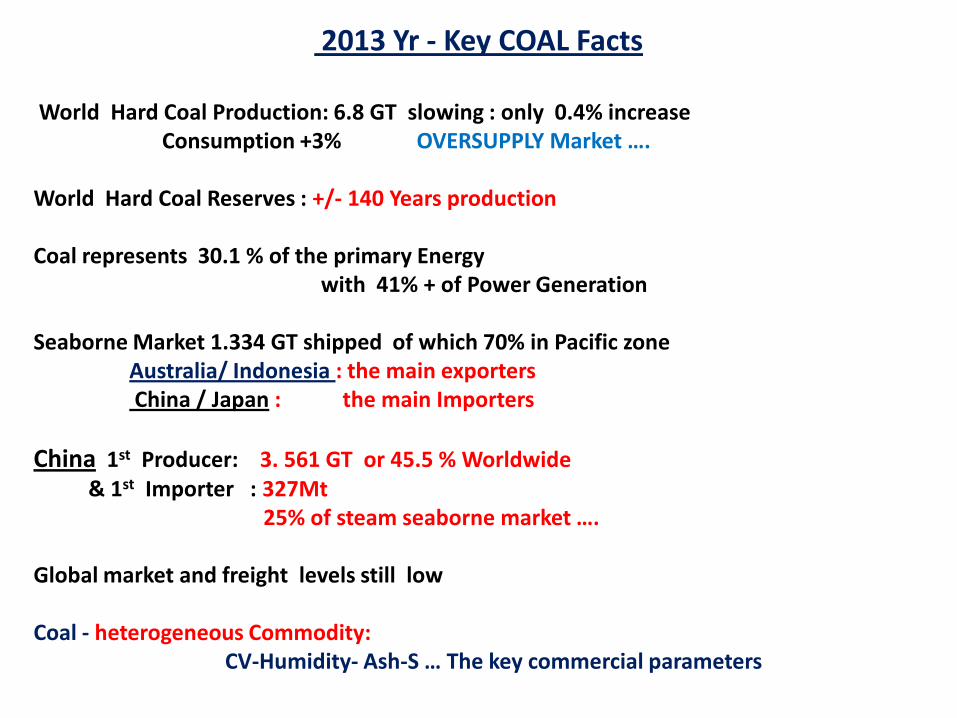
2013 Yr - Key COAL Facts
World Hard Coal Production: 6.8 GT slowing : only 0.4% increaseConsumption +3% OVERSUPPLY Market ….
World Hard Coal Reserves : +/- 140 Years production
Coal represents 30.1 % of the primary Energy with 41% + of Power Generation
Seaborne Market 1.334 GT shipped of which 70% in Pacific zone Australia/ Indonesia : the main exportersChina / Japan : the main Importers
China 1st Producer: 3. 561 GT or 45.5 % Worldwide& 1st Importer : 327Mt
25% of steam seaborne market ….
Global market and freight levels still low
Coal - heterogeneous Commodity: CV-Humidity- Ash-S … The key commercial parameters

BP pictures
3 Industrial Coal Process
- Gas Methane from Coal: CBM/CMM
- Coal conversion to Gas & Liquid CTL/CTO
- Industry kiln : Steel Mills & Cement plant
- Coal to Power/heat

-Gas/Methane from COAL
CBM/CMM- Methane-CH4
Coal contents usually a lot of Gas CH415m3 - 30m3 /T - Bituminous Rank
-Wellbores drilled into coal seamto extract natural gas (Coal Bed Methane)no mining plant
-Wellbores drilled into coal seam and into surrounding rock layers to extract & save gas before Mining
(Coal Mine Methane)
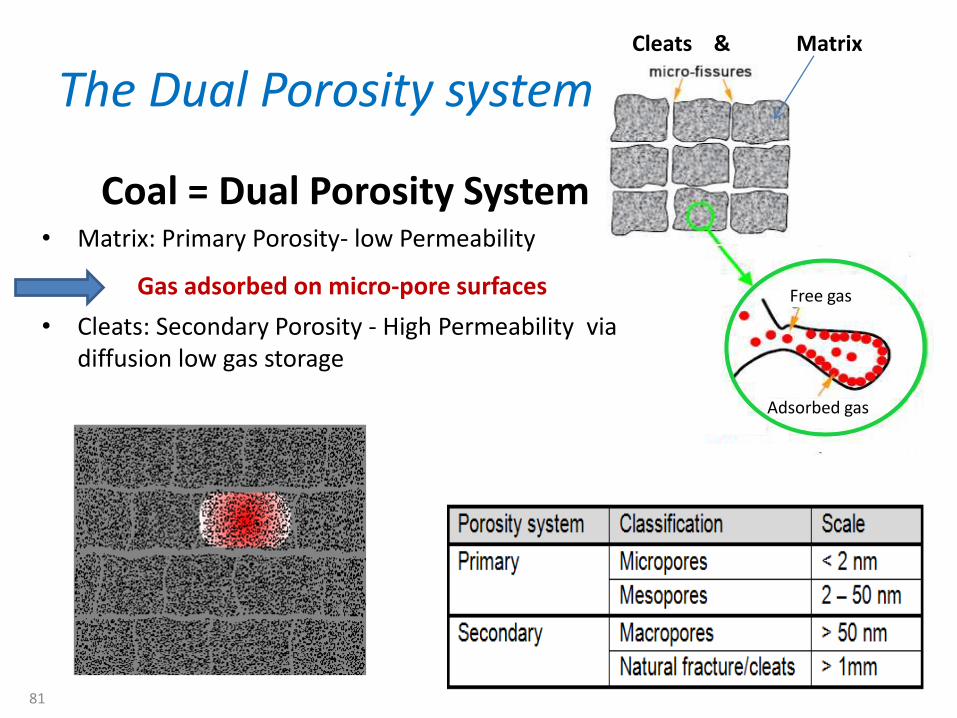
The Dual Porosity system…
Coal = Dual Porosity System• Matrix: Primary Porosity- low Permeability
Gas adsorbed on micro-pore surfaces
• Cleats: Secondary Porosity - High Permeability via diffusion low gas storage
81
Cleats & Matrix
Free gas
Adsorbed gas

Storage mechanismsAs coal maturity from bituminous to anthracite, the sorptive capacity
of coal increases- Langmuir function .
82
Source: Schlumberger, 2009
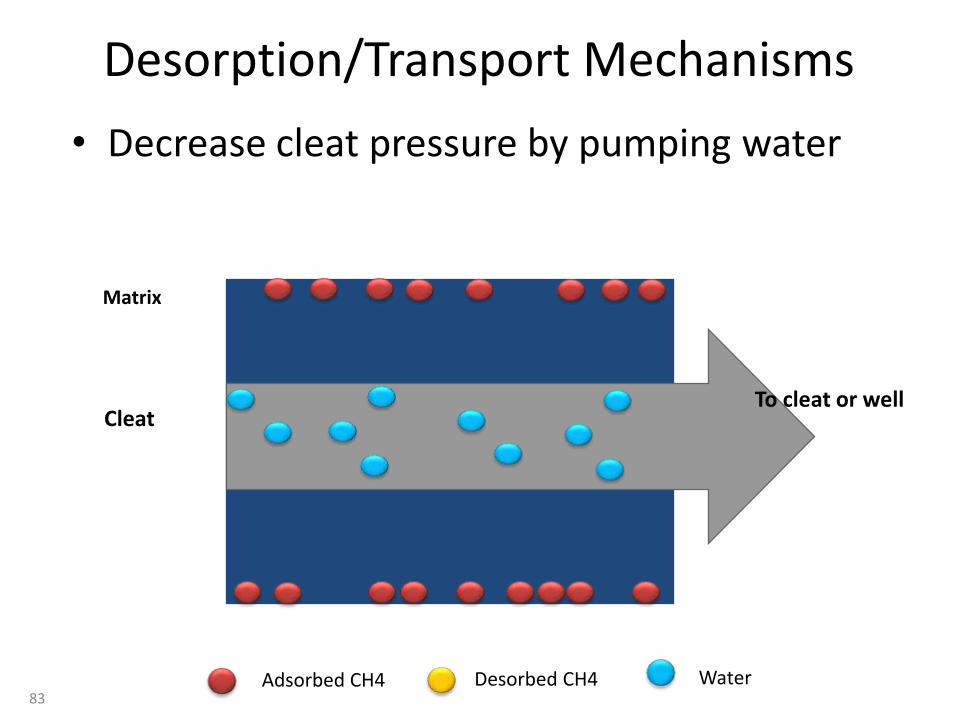
Desorption/Transport Mechanisms
83
• Decrease cleat pressure by pumping water
Adsorbed CH4 Desorbed CH4 Water
Matrix
CleatTo cleat or well
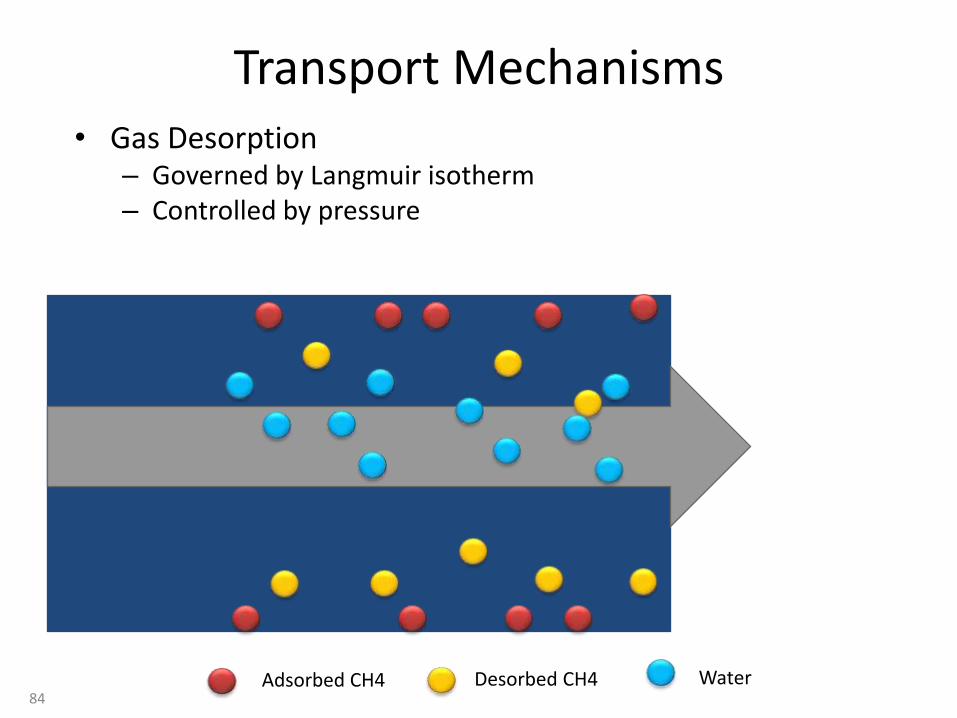
Transport Mechanisms
84
• Gas Desorption– Governed by Langmuir isotherm– Controlled by pressure
Adsorbed CH4 Desorbed CH4 Water
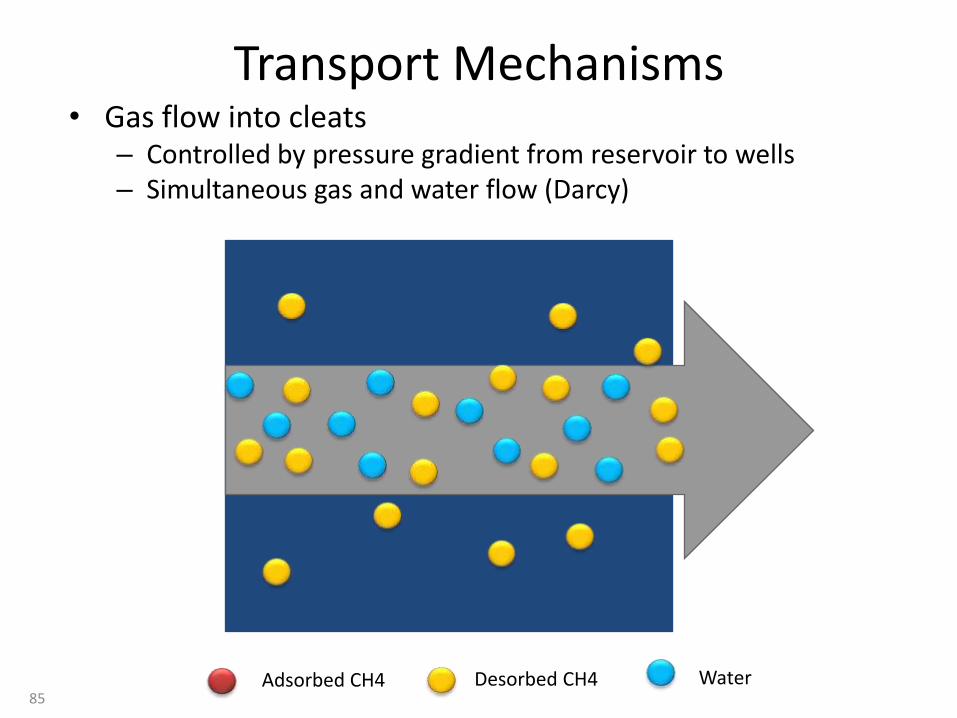
Transport Mechanisms
85
• Gas flow into cleats– Controlled by pressure gradient from reservoir to wells– Simultaneous gas and water flow (Darcy)
Desorbed CH4 WaterAdsorbed CH4
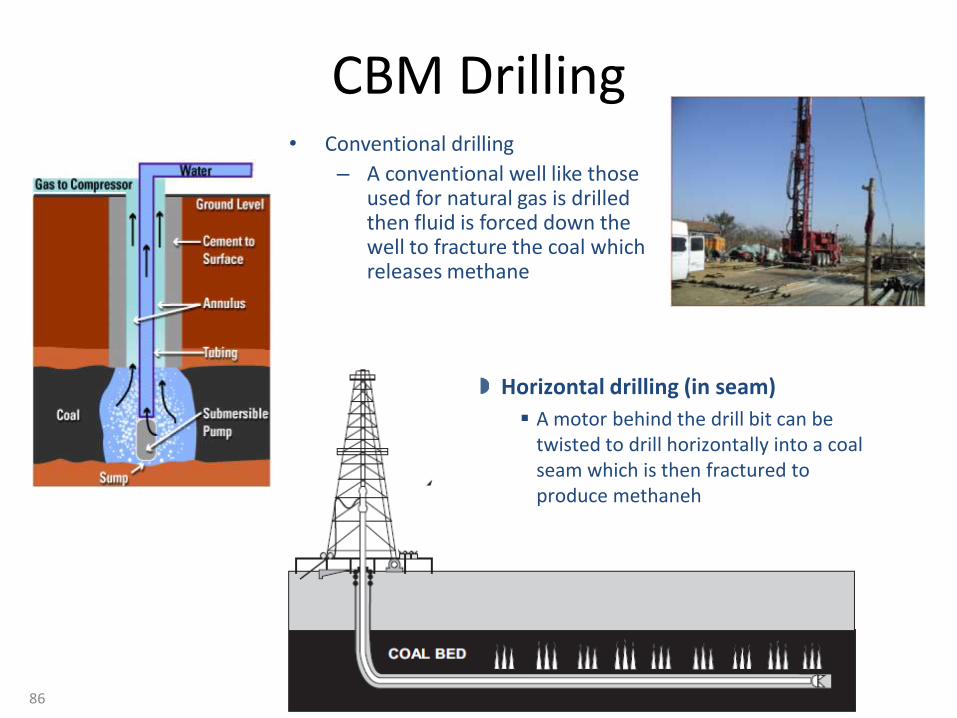
CBM Drilling
86
• Conventional drilling
– A conventional well like those used for natural gas is drilled then fluid is forced down the well to fracture the coal which releases methane
Horizontal drilling (in seam)
A motor behind the drill bit can be twisted to drill horizontally into a coal seam which is then fractured to produce methaneh
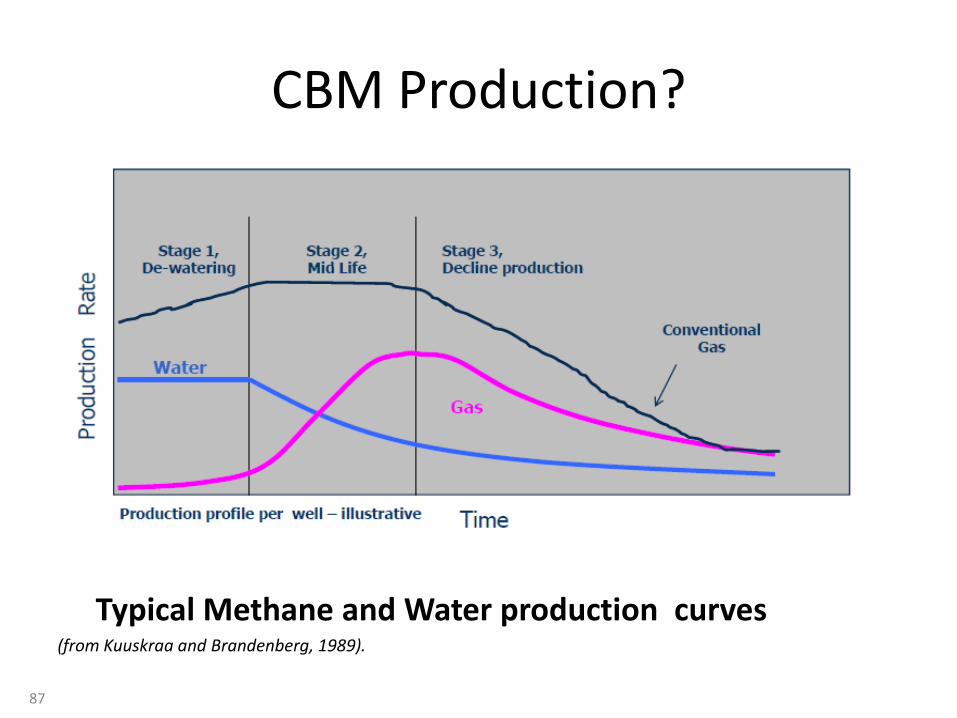
CBM Production?
87
Typical Methane and Water production curves (from Kuuskraa and Brandenberg, 1989).
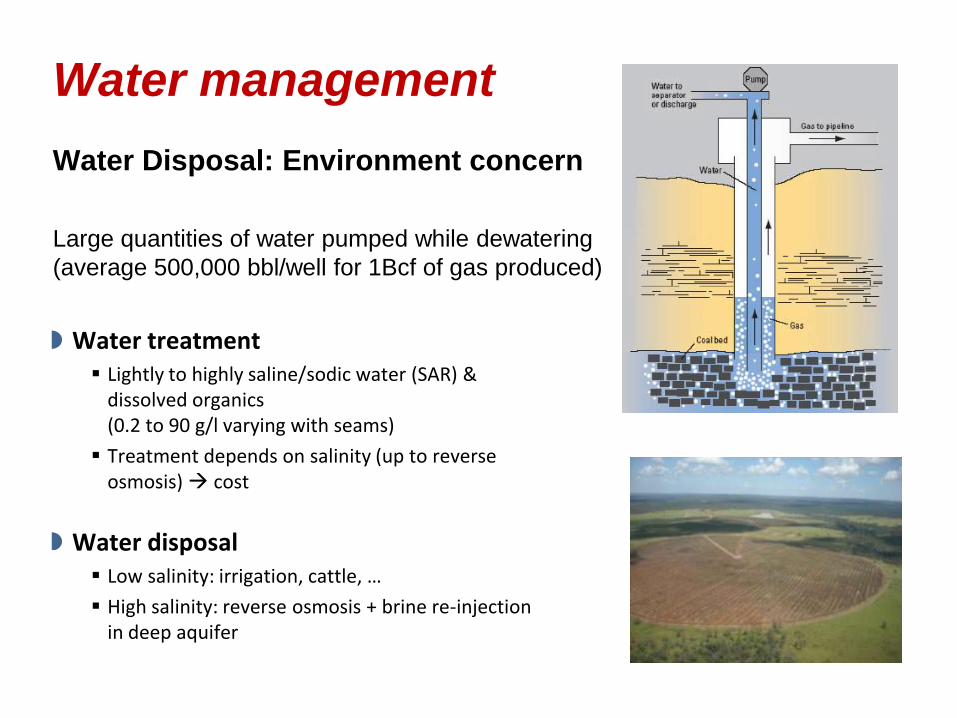
Water treatment Lightly to highly saline/sodic water (SAR) &
dissolved organics(0.2 to 90 g/l varying with seams)
Treatment depends on salinity (up to reverse osmosis) cost
Water disposal Low salinity: irrigation, cattle, …
High salinity: reverse osmosis + brine re-injection in deep aquifer
Water management
Water Disposal: Environment concern
Large quantities of water pumped while dewatering
(average 500,000 bbl/well for 1Bcf of gas produced)
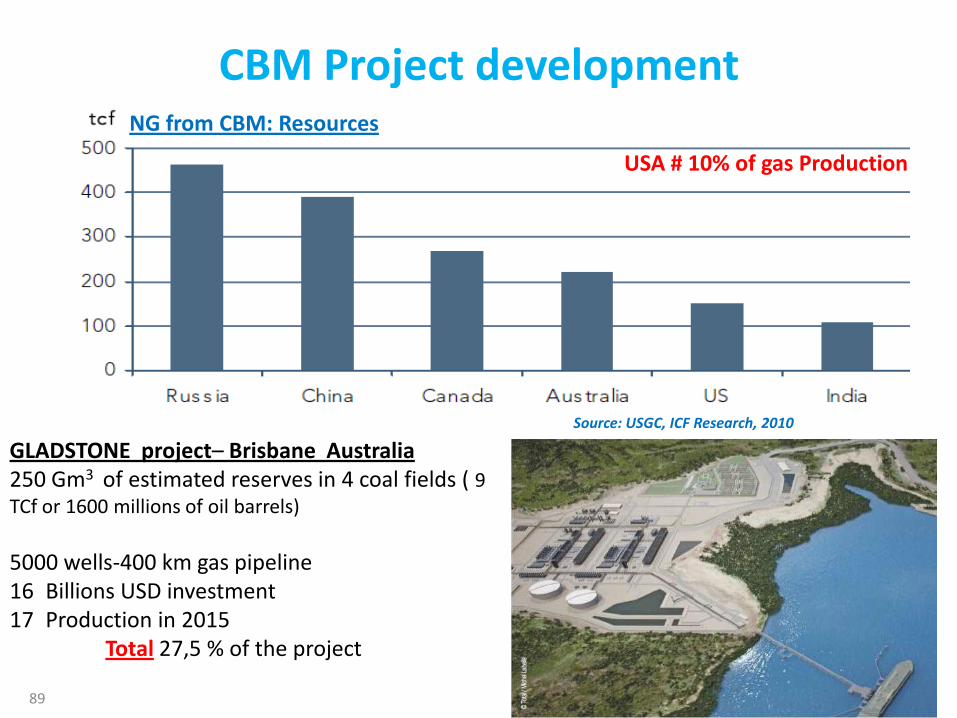
CBM Project development
89
Source: USGC, ICF Research, 2010
GLADSTONE project– Brisbane Australia250 Gm3 of estimated reserves in 4 coal fields ( 9 TCf or 1600 millions of oil barrels)
5000 wells-400 km gas pipeline16 Billions USD investment17 Production in 2015
Total 27,5 % of the project
USA # 10% of gas Production
NG from CBM: Resources
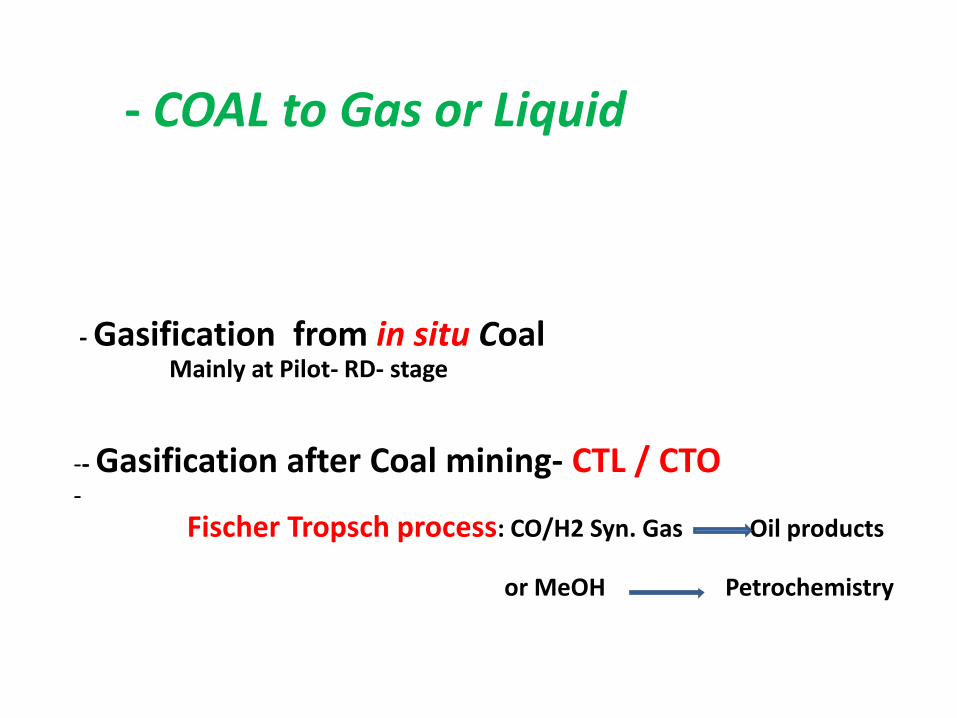
- COAL to Gas or Liquid
- Gasification from in situ Coal Mainly at Pilot- RD- stage
-- Gasification after Coal mining- CTL / CTO-
Fischer Tropsch process: CO/H2 Syn. Gas Oil products
or MeOH Petrochemistry
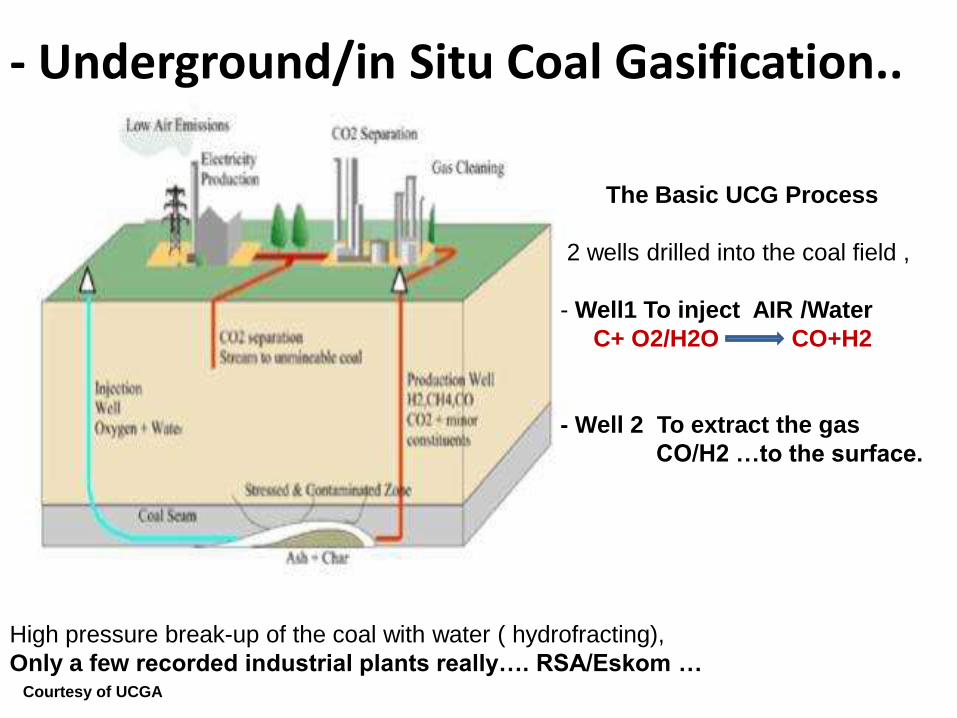
High pressure break-up of the coal with water ( hydrofracting),
Only a few recorded industrial plants really…. RSA/Eskom …Courtesy of UCGA
- Underground/in Situ Coal Gasification..
The Basic UCG Process
2 wells drilled into the coal field ,
- Well1 To inject AIR /Water
C+ O2/H2O CO+H2
- Well 2 To extract the gas
CO/H2 …to the surface.
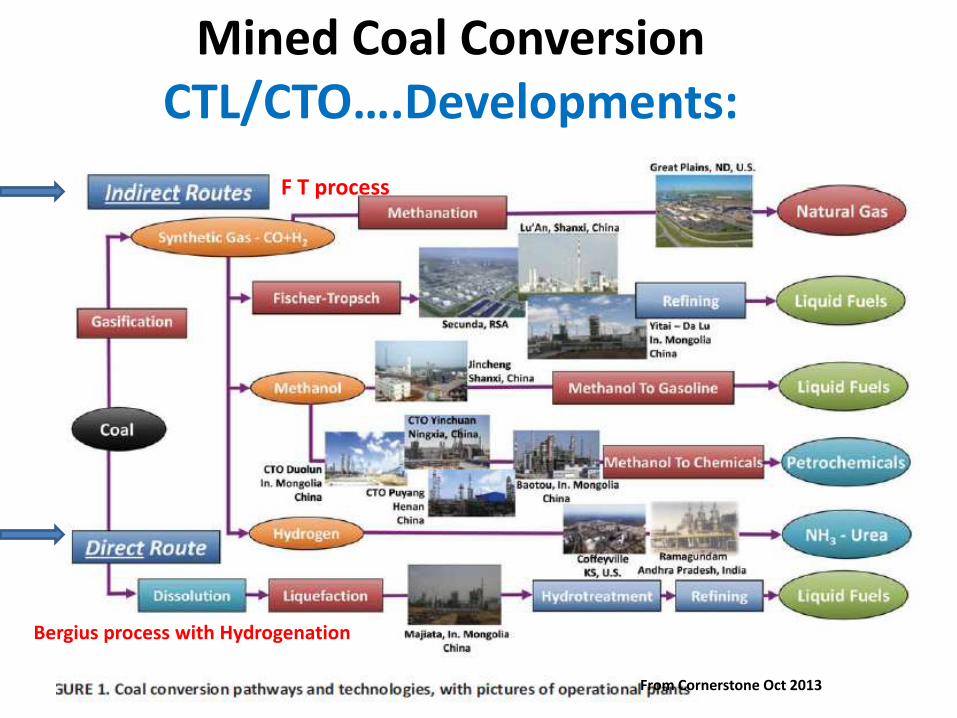
Mined Coal Conversion CTL/CTO….Developments:
From Cornerstone Oct 2013
Bergius process with Hydrogenation
F T process
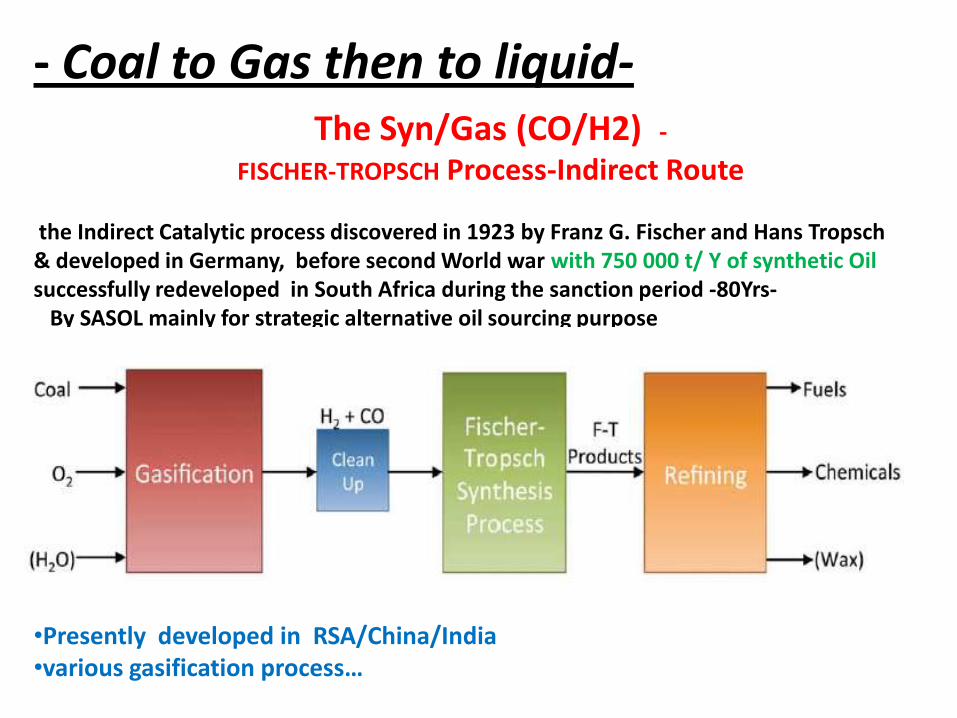
The Syn/Gas (CO/H2) -FISCHER-TROPSCH Process-Indirect Route
the Indirect Catalytic process discovered in 1923 by Franz G. Fischer and Hans Tropsch& developed in Germany, before second World war with 750 000 t/ Y of synthetic Oilsuccessfully redeveloped in South Africa during the sanction period -80Yrs-
By SASOL mainly for strategic alternative oil sourcing purpose
•Presently developed in RSA/China/India •various gasification process…
- Coal to Gas then to liquid-
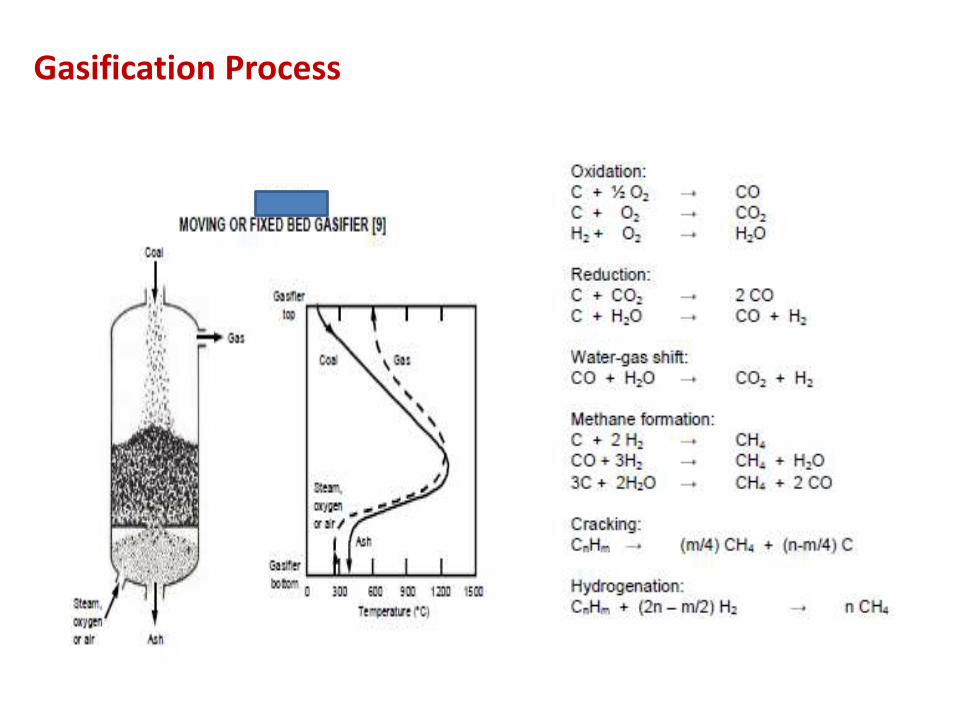
Gasification Process

Coal Gasification and FT:a complex Process
Sasol RSA : lurgi Fixed Bed
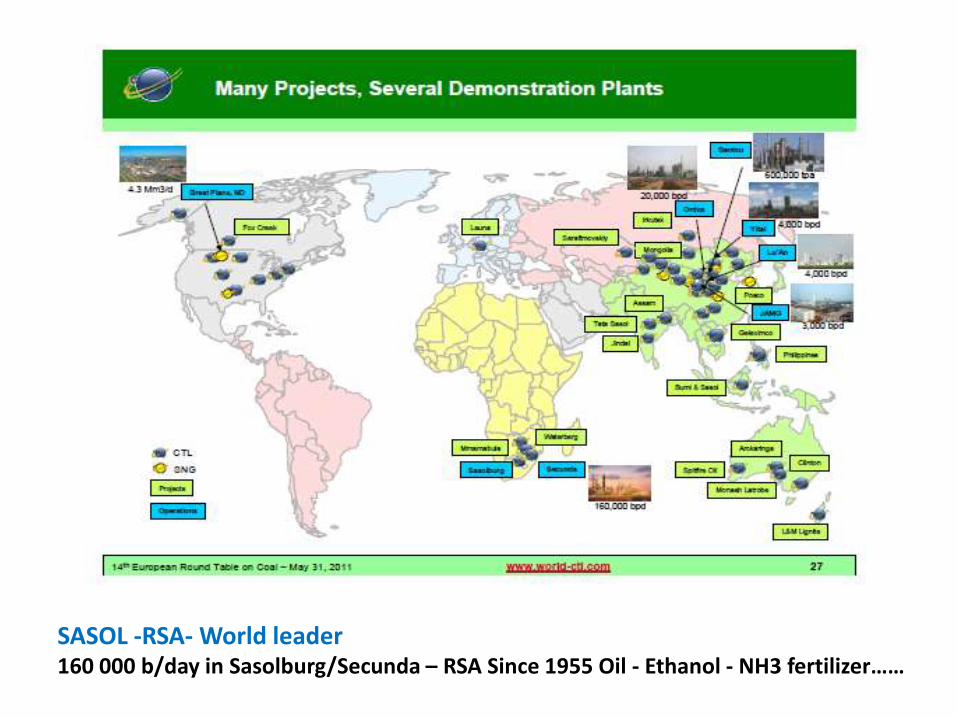
SASOL -RSA- World leader 160 000 b/day in Sasolburg/Secunda – RSA Since 1955 Oil - Ethanol - NH3 fertilizer……
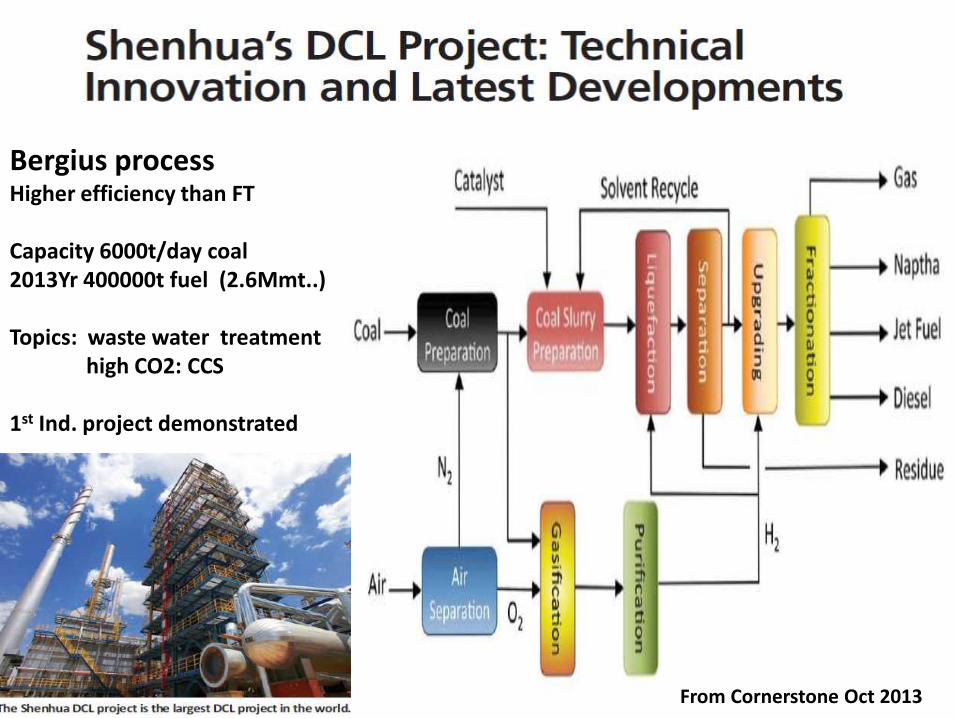
Bergius processHigher efficiency than FT
Capacity 6000t/day coal 2013Yr 400000t fuel (2.6Mmt..)
Topics: waste water treatmenthigh CO2: CCS
1st Ind. project demonstrated
From Cornerstone Oct 2013
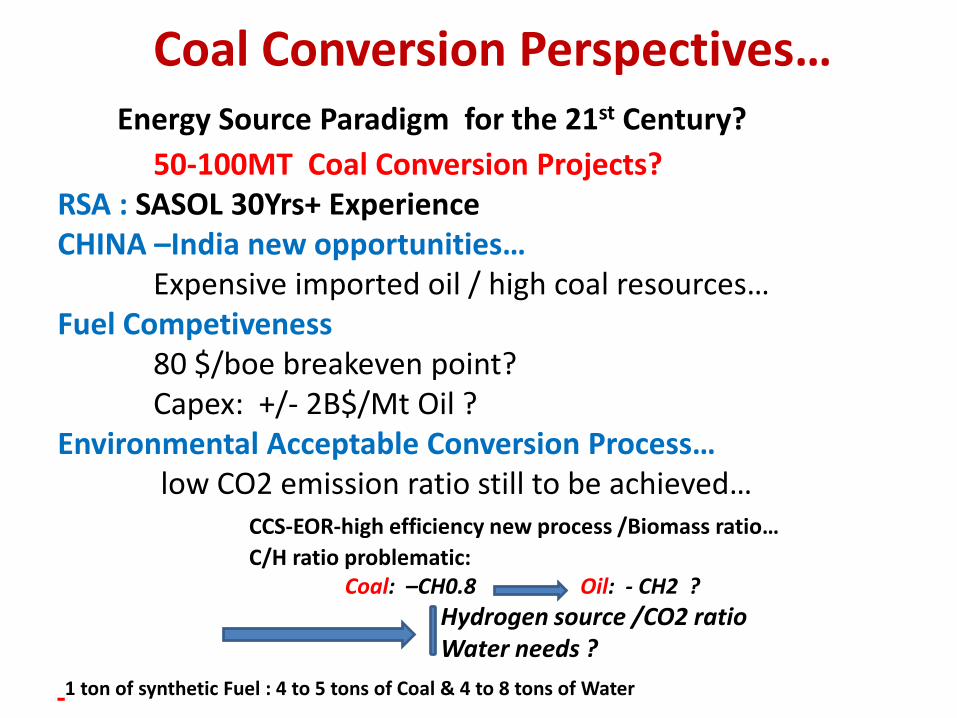
Coal Conversion Perspectives…Energy Source Paradigm for the 21st Century?
50-100MT Coal Conversion Projects? RSA : SASOL 30Yrs+ Experience CHINA –India new opportunities…
Expensive imported oil / high coal resources… Fuel Competiveness
80 $/boe breakeven point?Capex: +/- 2B$/Mt Oil ?
Environmental Acceptable Conversion Process…low CO2 emission ratio still to be achieved…
CCS-EOR-high efficiency new process /Biomass ratio…
C/H ratio problematic: Coal: –CH0.8 Oil: - CH2 ?
Hydrogen source /CO2 ratio Water needs ?
1 ton of synthetic Fuel : 4 to 5 tons of Coal & 4 to 8 tons of Water
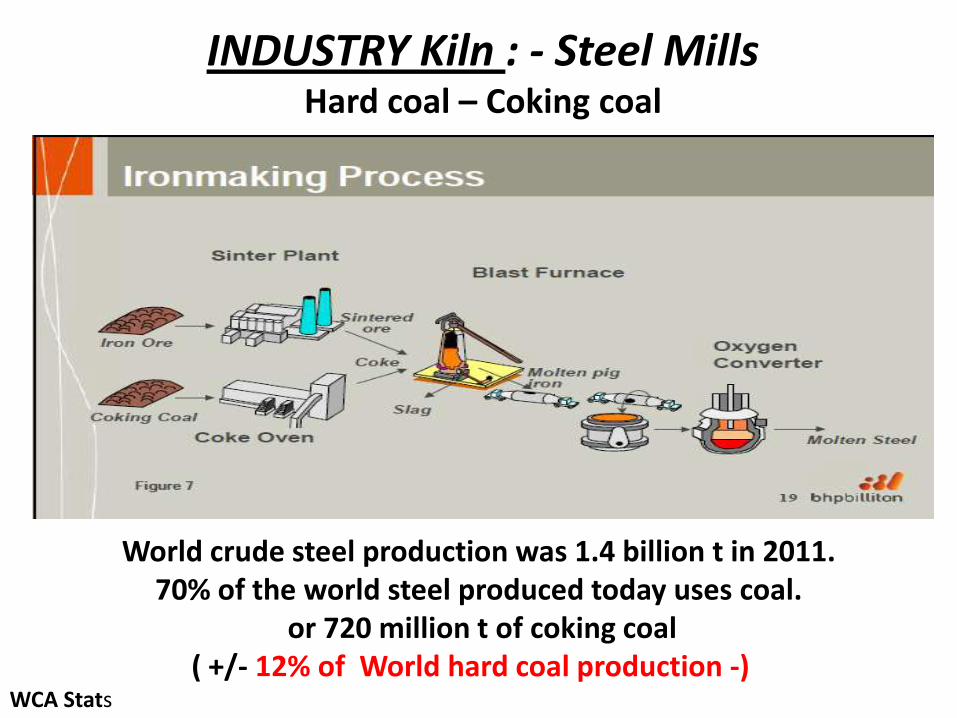
INDUSTRY Kiln : - Steel MillsHard coal – Coking coal
World crude steel production was 1.4 billion t in 2011.70% of the world steel produced today uses coal.
or 720 million t of coking coal ( +/- 12% of World hard coal production -)
WCA Stats
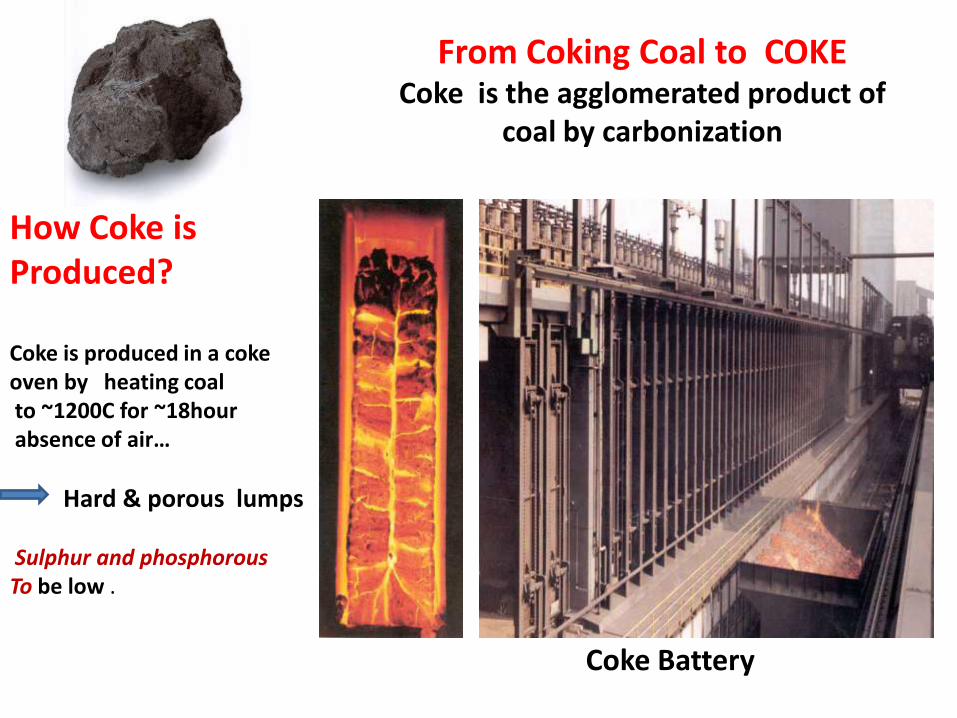
How Coke is Produced?
Coke is produced in a coke oven by heating coalto ~1200C for ~18hourabsence of air…
Hard & porous lumps
Sulphur and phosphorous To be low .
From Coking Coal to COKECoke is the agglomerated product of
coal by carbonization
Coke Battery
Bhp billiton courtesy
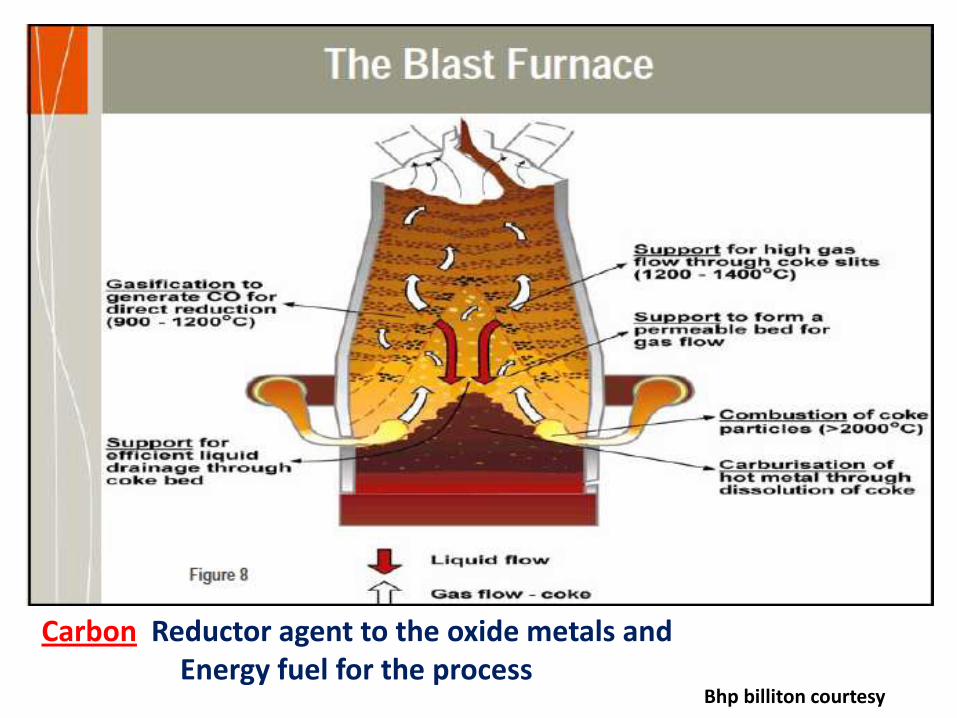
Carbon Reductor agent to the oxide metals and Energy fuel for the process
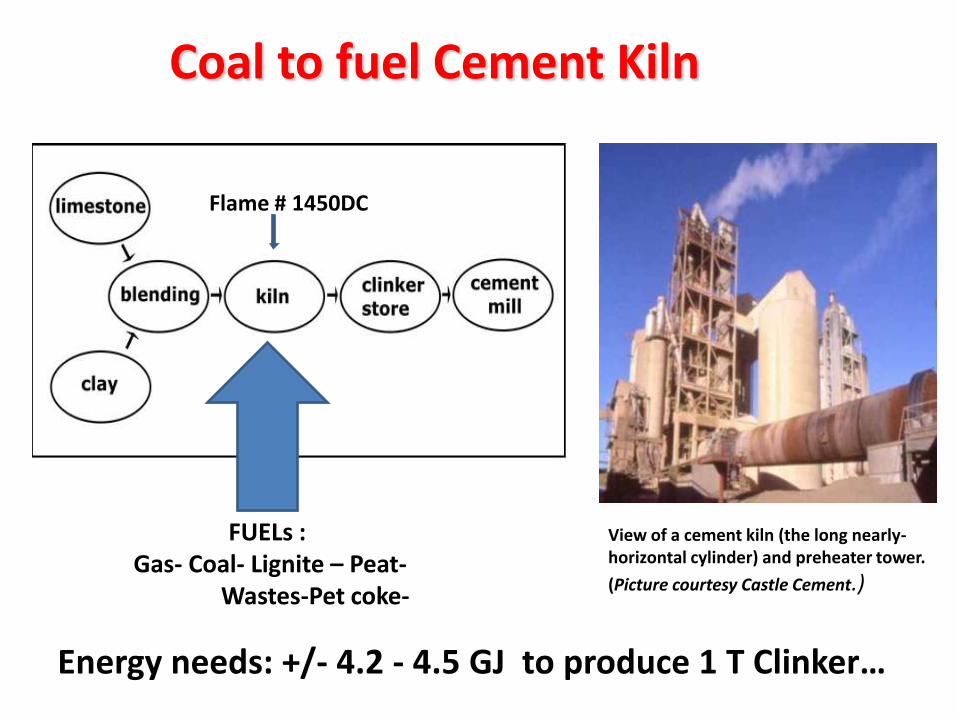
FUELs :Gas- Coal- Lignite – Peat-
Wastes-Pet coke-
Energy needs: +/- 4.2 - 4.5 GJ to produce 1 T Clinker…
Coal to fuel Cement Kiln
View of a cement kiln (the long nearly-horizontal cylinder) and preheater tower.
(Picture courtesy Castle Cement.)
Flame # 1450DC
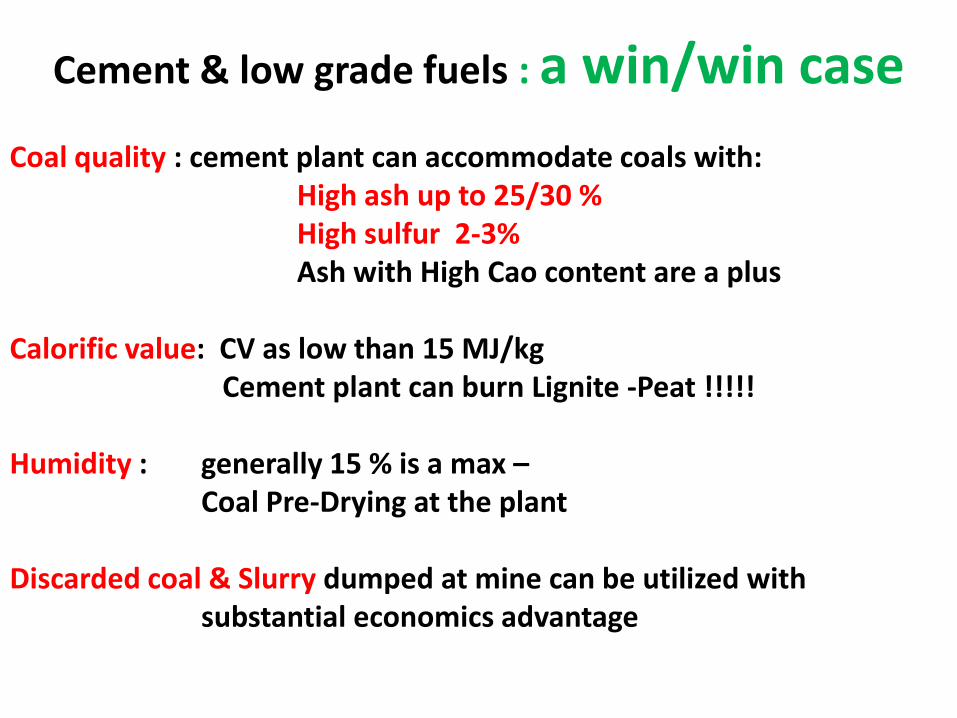
Cement & low grade fuels : a win/win case
Coal quality : cement plant can accommodate coals with: High ash up to 25/30 %High sulfur 2-3%Ash with High Cao content are a plus
Calorific value: CV as low than 15 MJ/kgCement plant can burn Lignite -Peat !!!!!
Humidity : generally 15 % is a max –Coal Pre-Drying at the plant
Discarded coal & Slurry dumped at mine can be utilized with substantial economics advantage

- Coal to Power…
A Sustainable Binomial… ?
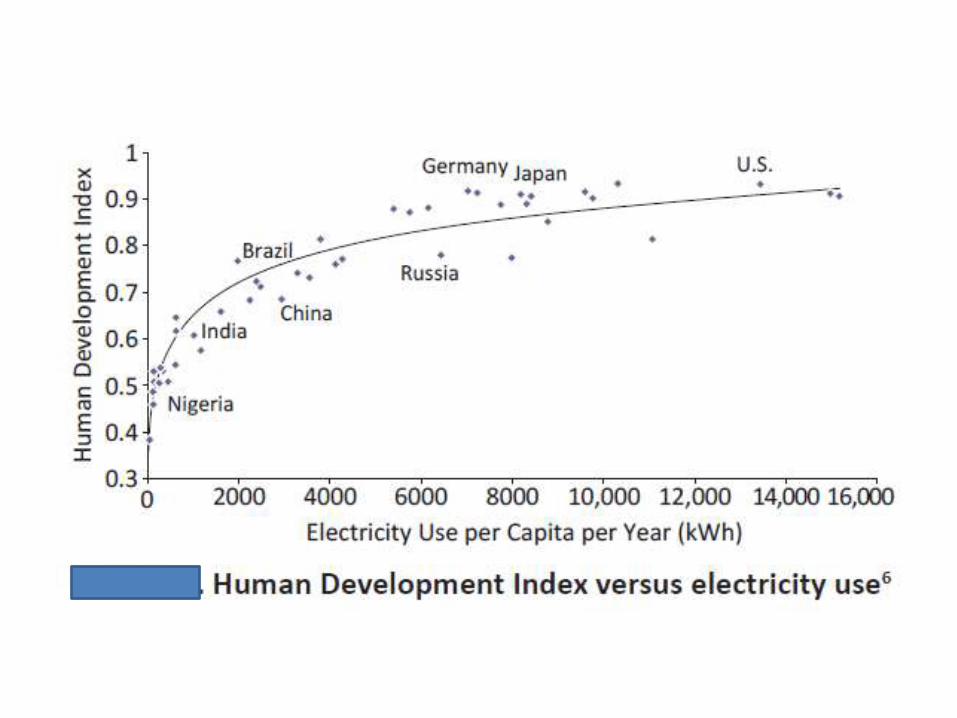

Population & Power..?
-World Population
2030: 8.3 Billion
2050: 9.6
-Urbanisation
Electricity /Year.cap. 2012India 760 kWh (+13%) Africa 592Nigeria 150CHINA 3475 OCDE 8090 Germany 7138WORLD 2973RSA 4400
RURAL Min 250 - 5 hrs/day

The Dark Continent….
Improving access to electricity worldwide
is critical to alleviate poverty...
1,3 -1.5 B people without Power
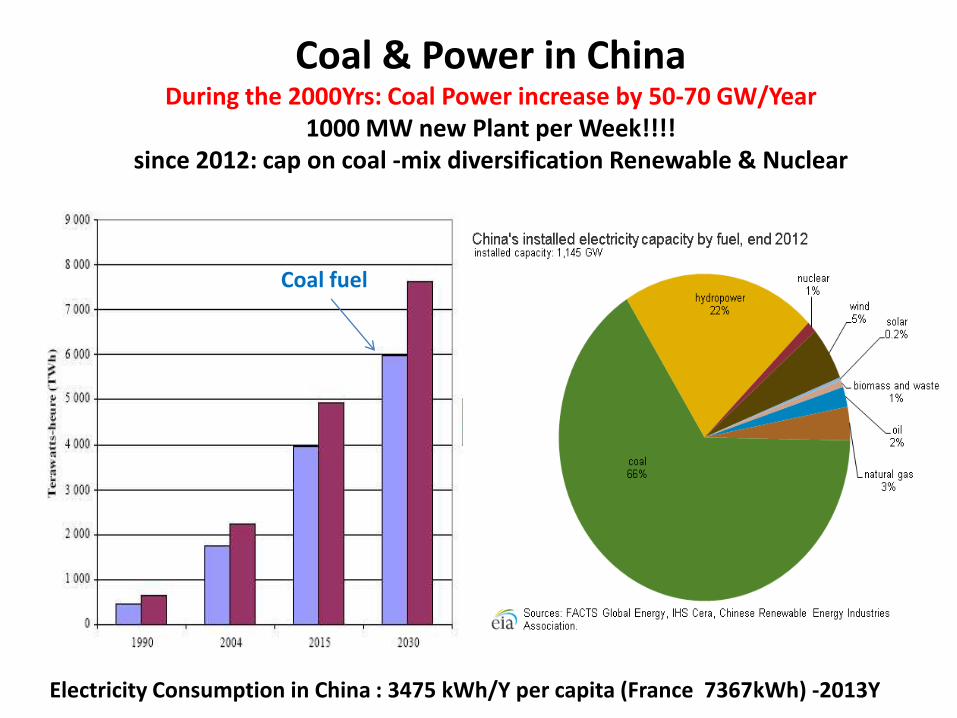
Electricity Consumption in China : 3475 kWh/Y per capita (France 7367kWh) -2013Y
Coal & Power in ChinaDuring the 2000Yrs: Coal Power increase by 50-70 GW/Year
1000 MW new Plant per Week!!!!since 2012: cap on coal -mix diversification Renewable & Nuclear
Coal fuel
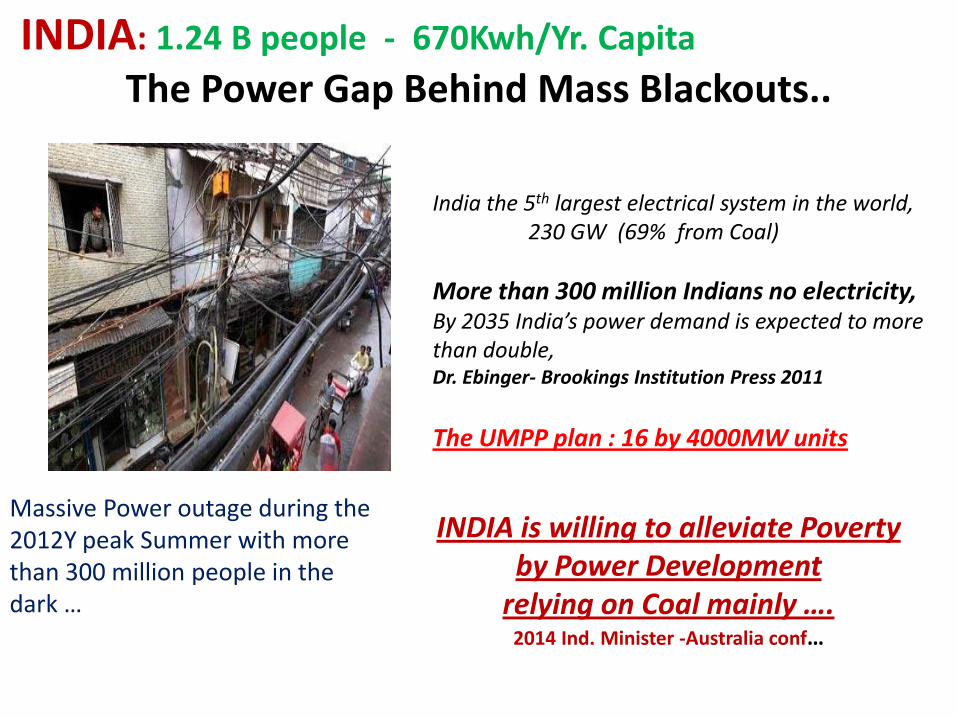
India the 5th largest electrical system in the world, 230 GW (69% from Coal)
More than 300 million Indians no electricity,By 2035 India’s power demand is expected to more than double, Dr. Ebinger- Brookings Institution Press 2011
The UMPP plan : 16 by 4000MW units
INDIA: 1.24 B people - 670Kwh/Yr. Capita
The Power Gap Behind Mass Blackouts..
Massive Power outage during the 2012Y peak Summer with more than 300 million people in the dark …
INDIA is willing to alleviate Poverty by Power Development
relying on Coal mainly …. 2014 Ind. Minister -Australia conf…

PAKISTAN: Population176M - 470kWh/capita…
Power Outage Sparks… Violent Protest
5000 MW electricity shortfall ….Power cut -around 12 H everyday in major cities- 2012-07-30 Xinhua
2500 MW project from Thar coal mine reserves ? Sindh Engro Coal Mining Co. $3 billion project…
Not enough…
by 2030 Power from 10GW to 162,6GW ?45% NG, 19% coal, 18.5% oil, 2.5% renewable, 10.8% hydropower and 4.2% nuclear…..Pakistan bets on Underground Coal Gasification to Help Relieve Power Shortages…

The Dark Continent….
Improving access to electricity worldwide
is critical to alleviate poverty...
1,3 -1.5 B people without Power
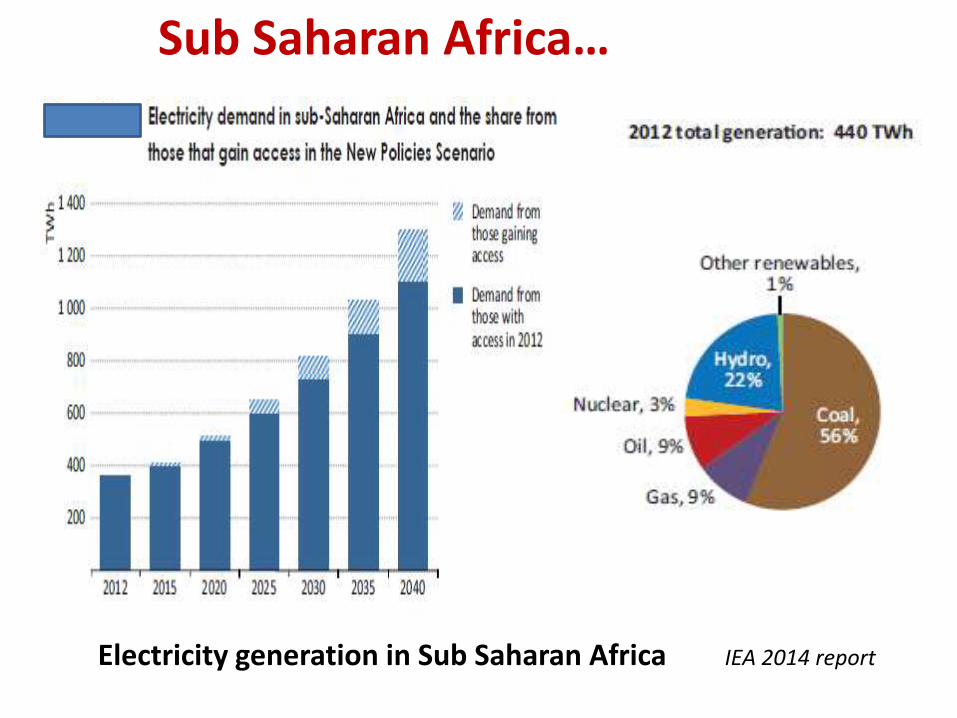
Electricity generation in Sub Saharan Africa IEA 2014 report
Sub Saharan Africa…
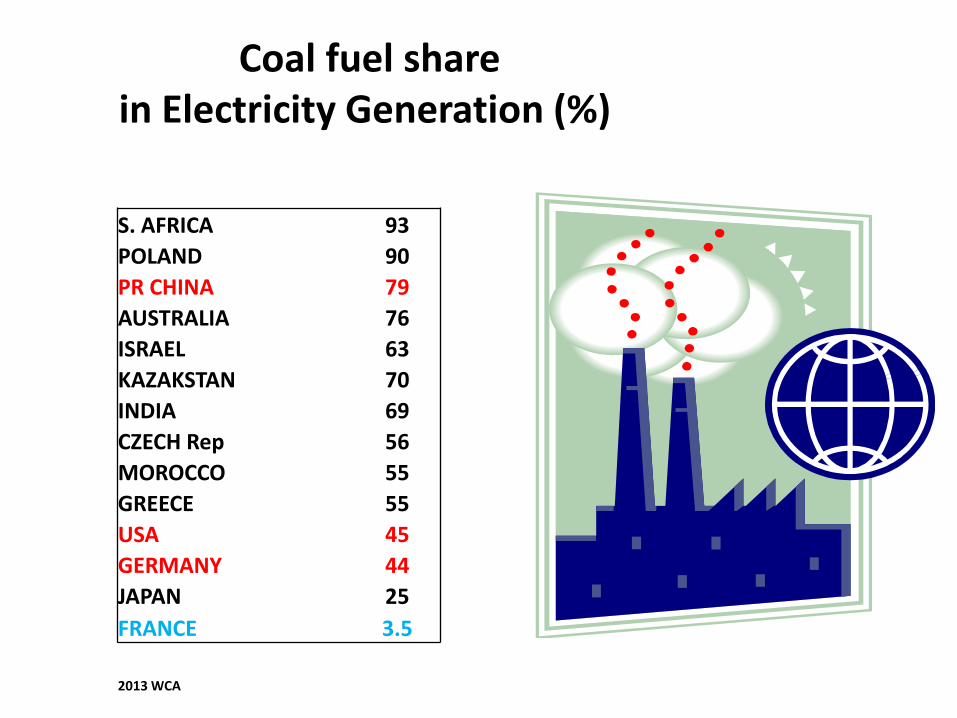
Coal fuel sharein Electricity Generation (%)
S. AFRICA 93
POLAND 90
PR CHINA 79
AUSTRALIA 76
ISRAEL 63
KAZAKSTAN 70
INDIA 69
CZECH Rep 56
MOROCCO 55
GREECE 55
USA 45
GERMANY 44
JAPAN 25
FRANCE 3.5
2013 WCA
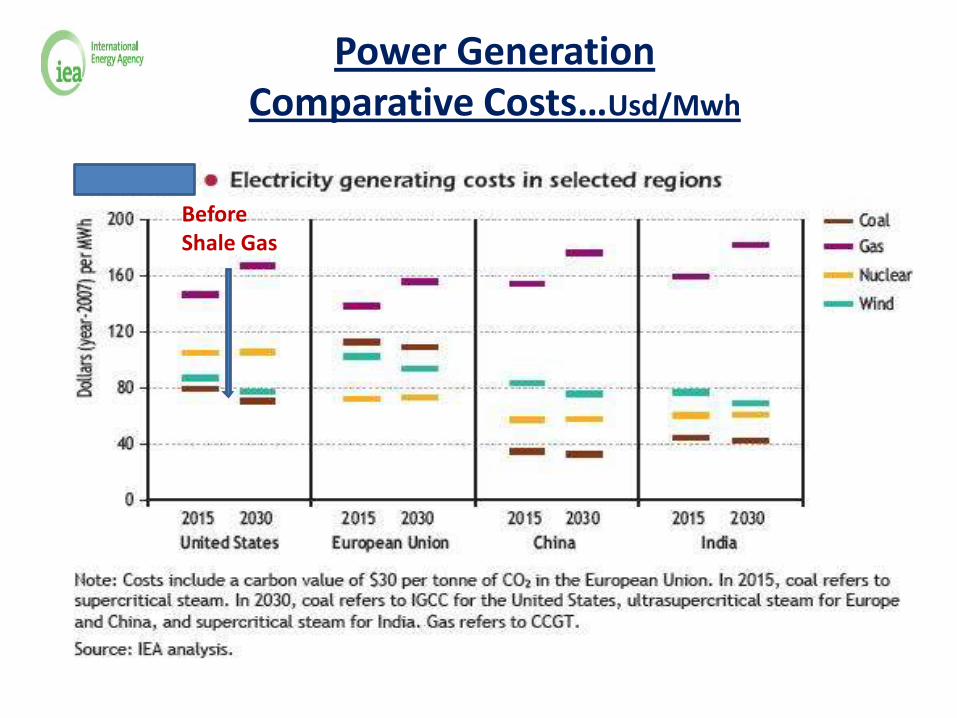
Power GenerationComparative Costs…Usd/Mwh
Before Shale Gas
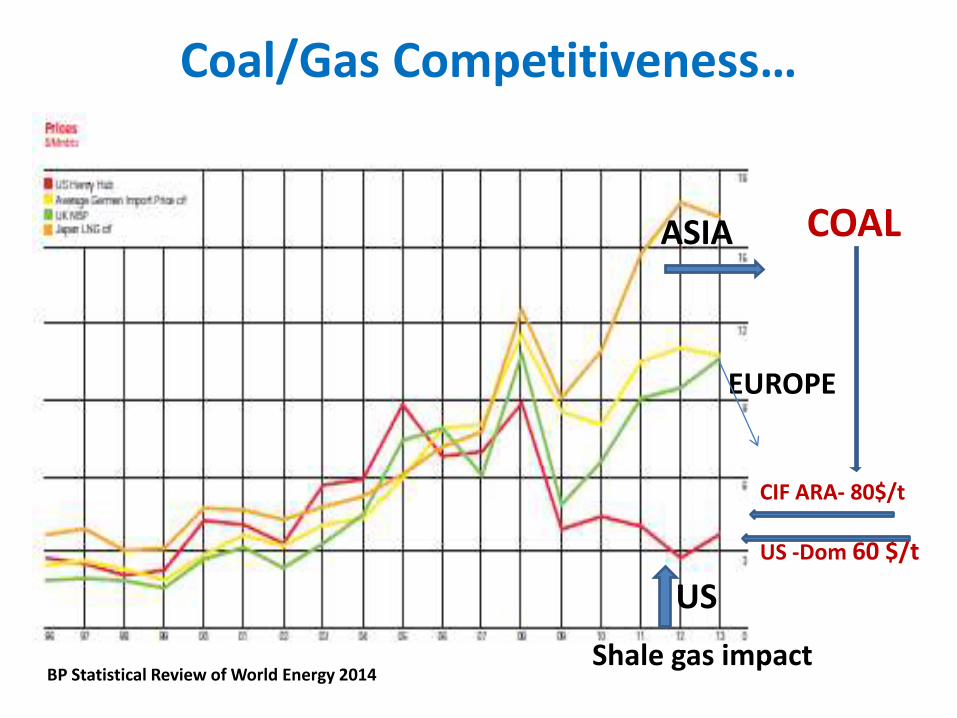
Coal/Gas Competitiveness…
BP Statistical Review of World Energy 2014
ASIA
US
EUROPE
Shale gas impact
COAL
CIF ARA- 80$/t
US -Dom 60 $/t

Coal Uses(Indicative ratio)
Power/Heat Gen. 68%
Metallurgical 12%
Cement Industry 4%
Gas-Liquid conversion CTL 1-2 % ?
Domestic: Heating/Cooking 10-15 %

The Good … The Bad and the Ugly( London smog 1952)
Coal Combustion Emissions & CO2 Challenges…
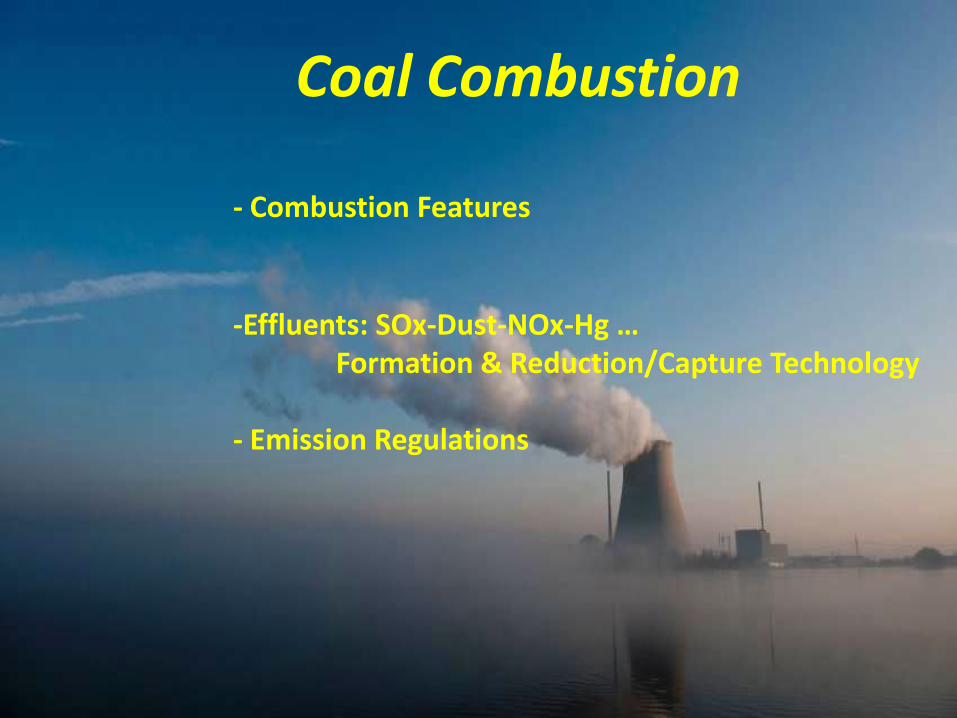
Coal Combustion
- Combustion Features
-Effluents: SOx-Dust-NOx-Hg …Formation & Reduction/Capture Technology
- Emission Regulations

Main features
Objective to efficiently burn coal - C &H Oxidation-and transfer Heat generated…
• Air Needed : 8-9 Nm3*/kg Coal
• Effluents:– CO2 - H2O
– NOx- SOx
– Mineral Matters/Dust
• Bottom /Slagging/Fouling
• Flying Particulates/PM
– Metal Oxide traces: Hg …
• Nm3 gas at 20dc /1atm
• Depending on air excess
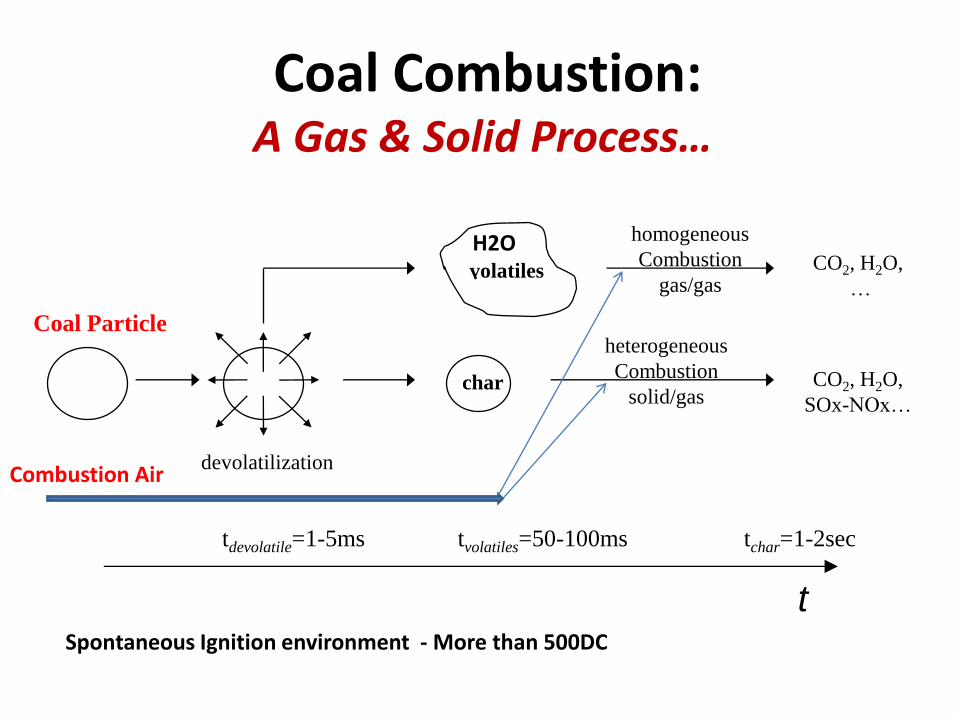
Coal Combustion:A Gas & Solid Process…
Coal Particle
devolatilization
volatiles
char
homogeneous
Combustion
gas/gas
heterogeneous
Combustion
solid/gas
CO2, H2O,
…
CO2, H2O,
SOx-NOx…
tchar=1-2sectvolatiles=50-100mstdevolatile=1-5ms
tSpontaneous Ignition environment - More than 500DC
Combustion Air
H2O.

To achieve an efficient combustion…The Triple T Rule…
TemperatureA sufficient temperature environment to achieve full & complete combustion –
mainly for char particles
Turbulence/TransferTo insure a good mix of Air (O2) with Solid particles and
diffusion of O2 to solid surface to maximize Surface Volume by reducing size particlesRatio : Surface /Volume particles # 1/R
Time to Char Burn out Char Combustion kinetic is 10/20 times slower than for Gas

6%O2 : 40%excess Air - 9.63 Nm3 Exhaust gas/kg Coal
Stoechiometric - Air excess ratio ?
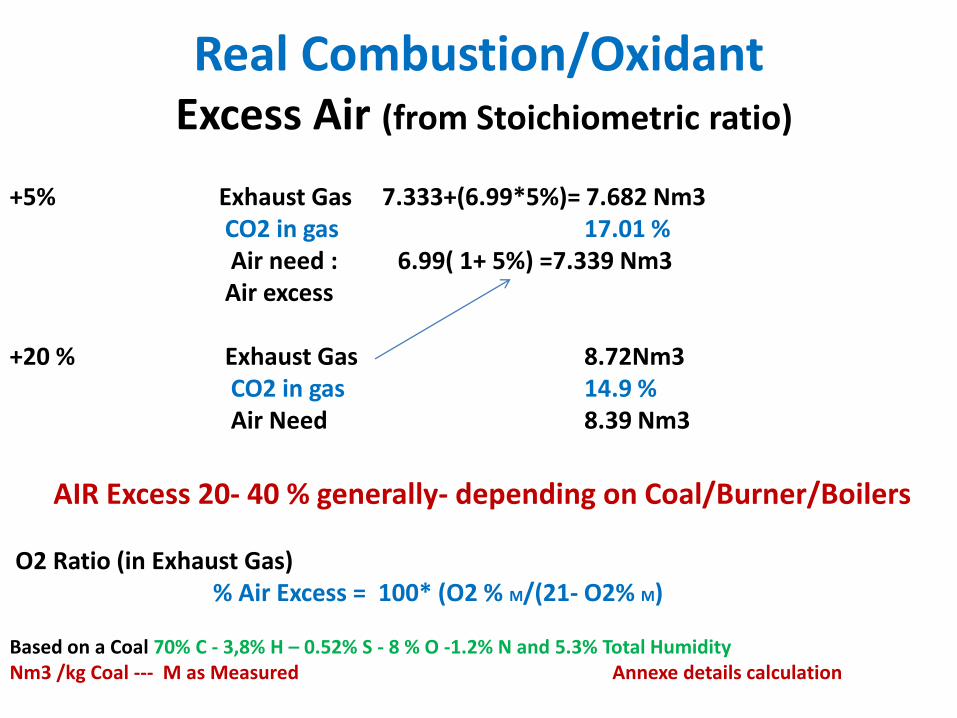
Real Combustion/Oxidant Excess Air (from Stoichiometric ratio)
+5% Exhaust Gas 7.333+(6.99*5%)= 7.682 Nm3 CO2 in gas 17.01 %Air need : 6.99( 1+ 5%) =7.339 Nm3Air excess
+20 % Exhaust Gas 8.72Nm3CO2 in gas 14.9 %Air Need 8.39 Nm3
AIR Excess 20- 40 % generally- depending on Coal/Burner/Boilers
O2 Ratio (in Exhaust Gas)% Air Excess = 100* (O2 % M/(21- O2% M)
Based on a Coal 70% C - 3,8% H – 0.52% S - 8 % O -1.2% N and 5.3% Total Humidity Nm3 /kg Coal --- M as Measured Annexe details calculation
Harmful Effluents & Aerosols
Origin - Gas Treatments …&
Emission Regulation
- NOx
- Solid Particles: Ashes/Dusts-Aerosol Fog/Smog…-Metal Traces- SOx
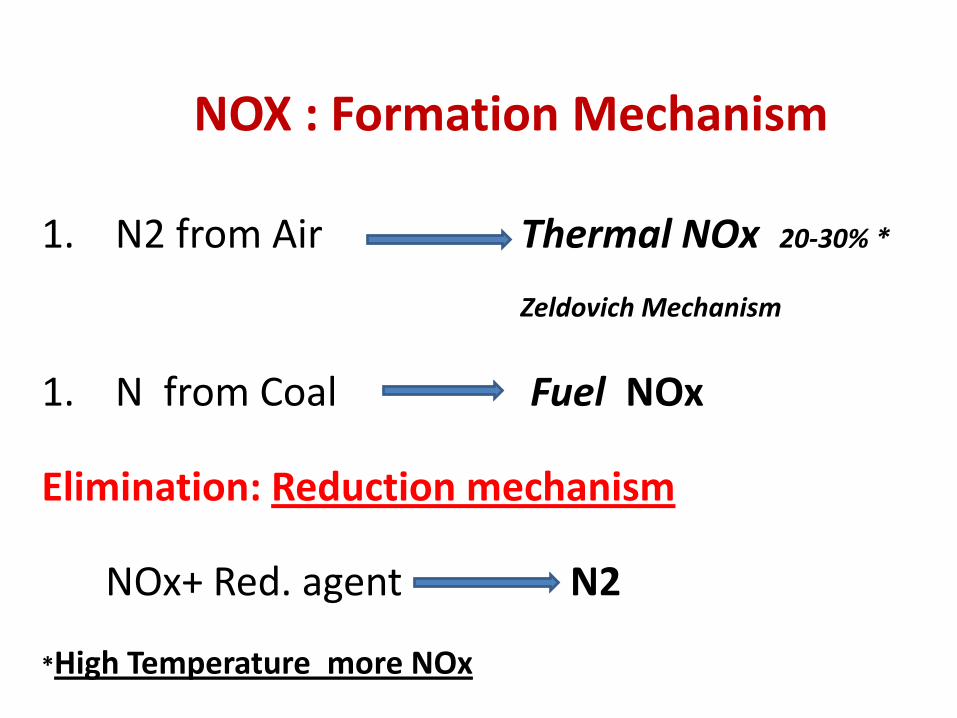
NOX : Formation Mechanism
1. N2 from Air Thermal NOx 20-30% *
Zeldovich Mechanism
1. N from Coal Fuel NOx
Elimination: Reduction mechanism
NOx+ Red. agent N2
*High Temperature more NOx
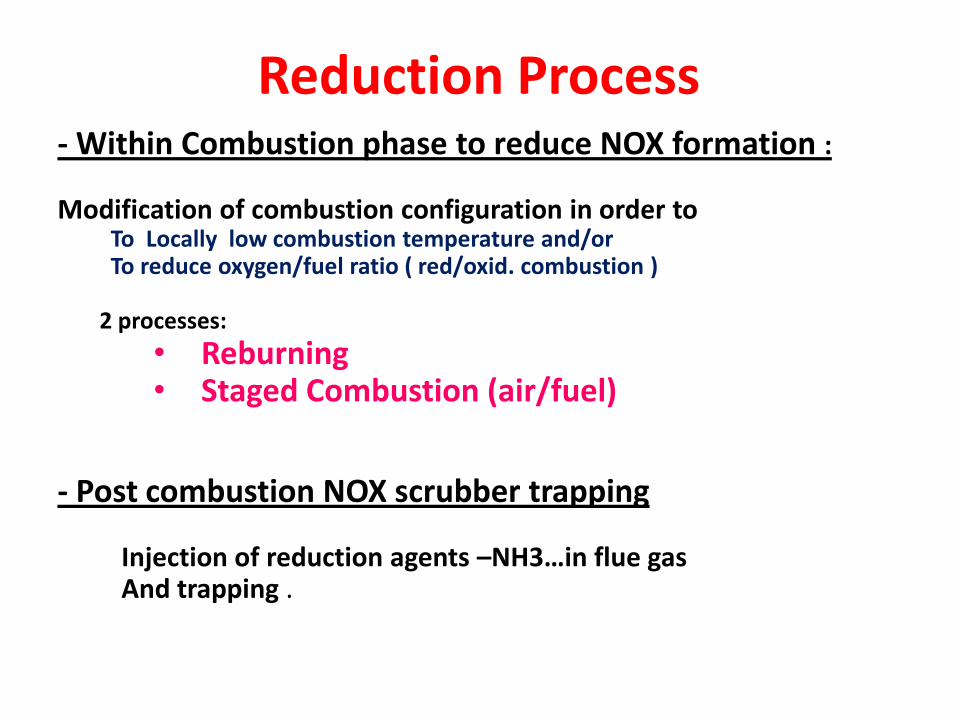
Reduction Process - Within Combustion phase to reduce NOX formation :
Modification of combustion configuration in order to To Locally low combustion temperature and/orTo reduce oxygen/fuel ratio ( red/oxid. combustion )
2 processes:
• Reburning• Staged Combustion (air/fuel)
- Post combustion NOX scrubber trapping
Injection of reduction agents –NH3…in flue gasAnd trapping .
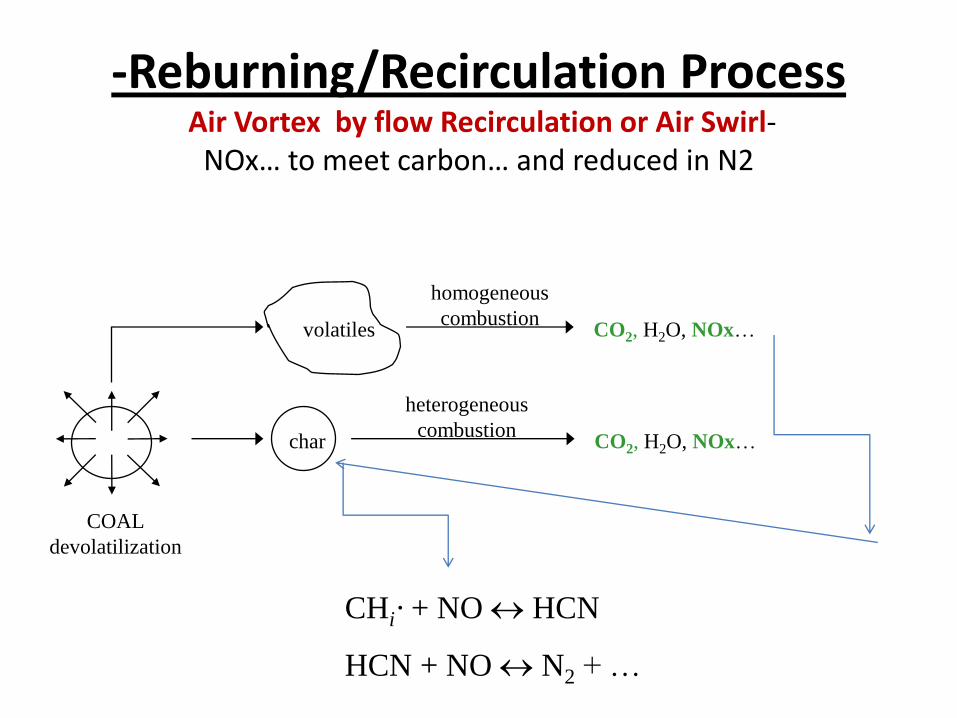
-Reburning/Recirculation ProcessAir Vortex by flow Recirculation or Air Swirl-
NOx… to meet carbon… and reduced in N2
COAL
devolatilization
volatiles
char
homogeneous
combustion
heterogeneous
combustion
CO2, H2O, NOx…
CO2, H2O, NOx…
CHi· + NO HCN
HCN + NO N2 + …
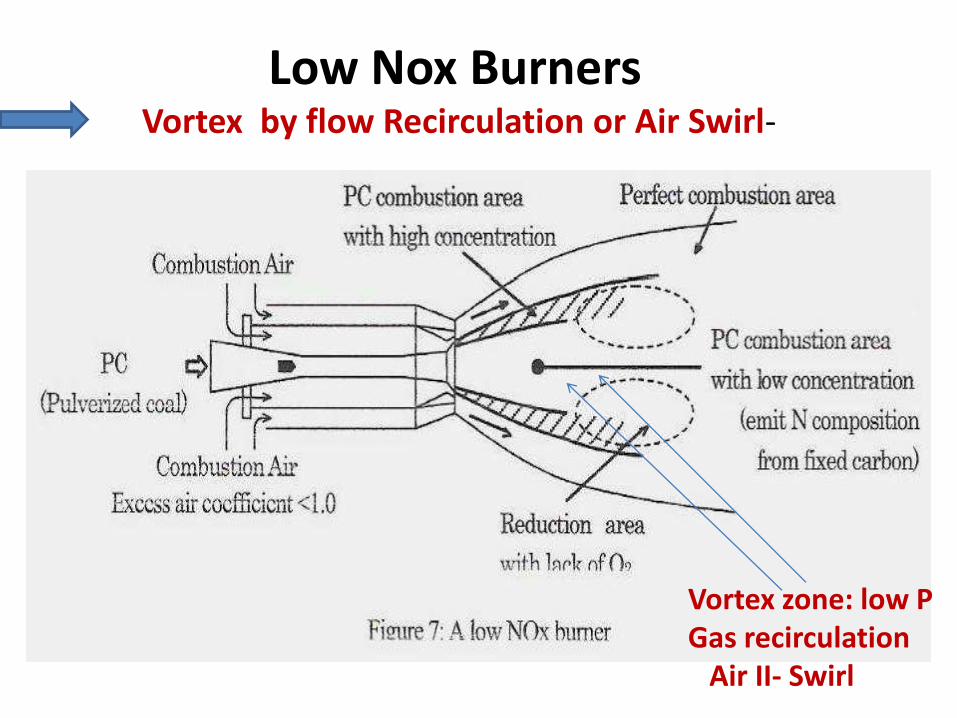
Low Nox Burners Vortex by flow Recirculation or Air Swirl-
Vortex zone: low PGas recirculation
Air II- Swirl

Staged Combustion ProcessAir default combustion: local reduction zone
to low temperature and air excessAdditional air injected to complete full combustion
devolatilization
volatiles
char
homogeneous
combustion
heterogeneous
combustion
CO, CO2, H2O, N2…
Fuel Rich
CO, CO2, H2O, N2…
CO2, H2O, N2…
O2
Air I ( coal fluidization) Air II AIR III

Air Share
30/10 %Air Total
70/90% Air TotalFuel Rich zone Lower temperature
Low NOx
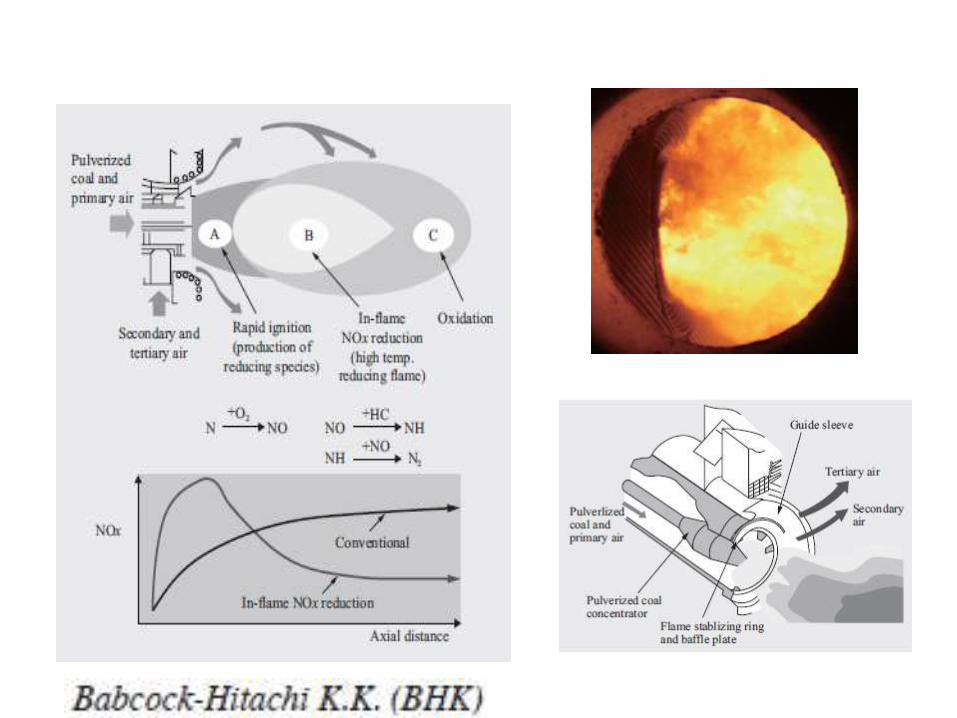
Babcock Hitachi Publication
Two Stages Combustion / TSC
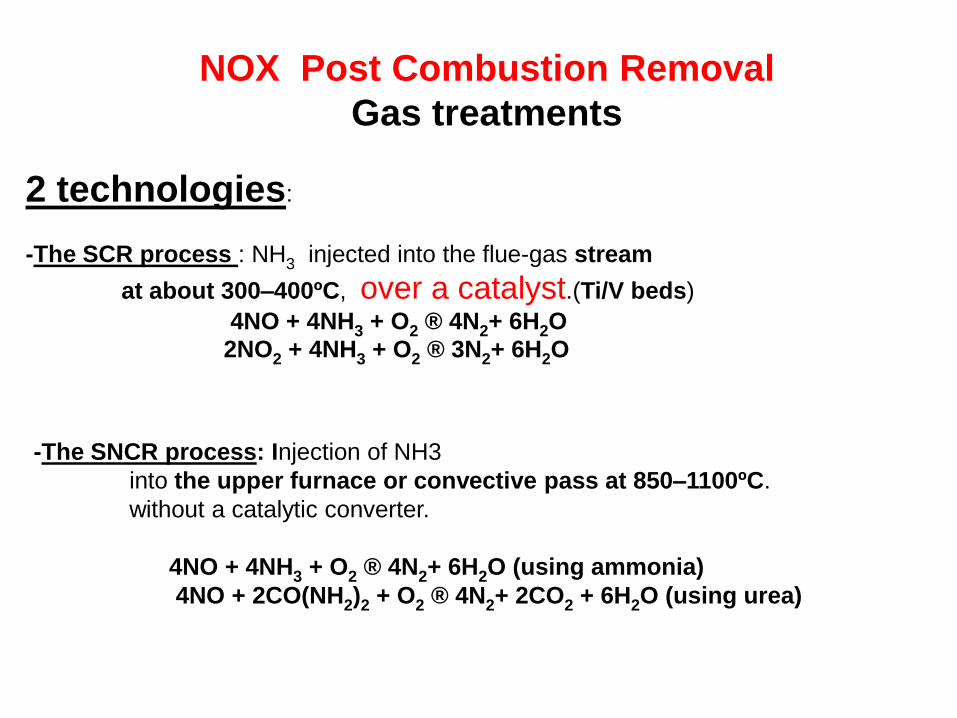
2 technologies:
-The SCR process : NH3 injected into the flue-gas stream
at about 300–400ºC, over a catalyst.(Ti/V beds)
4NO + 4NH3 + O2 ® 4N2+ 6H2O
2NO2 + 4NH3 + O2 ® 3N2+ 6H2O
-The SNCR process: Injection of NH3
into the upper furnace or convective pass at 850–1100ºC.
without a catalytic converter.
4NO + 4NH3 + O2 ® 4N2+ 6H2O (using ammonia)
4NO + 2CO(NH2)2 + O2 ® 4N2+ 2CO2 + 6H2O (using urea)
NOX Post Combustion Removal
Gas treatments
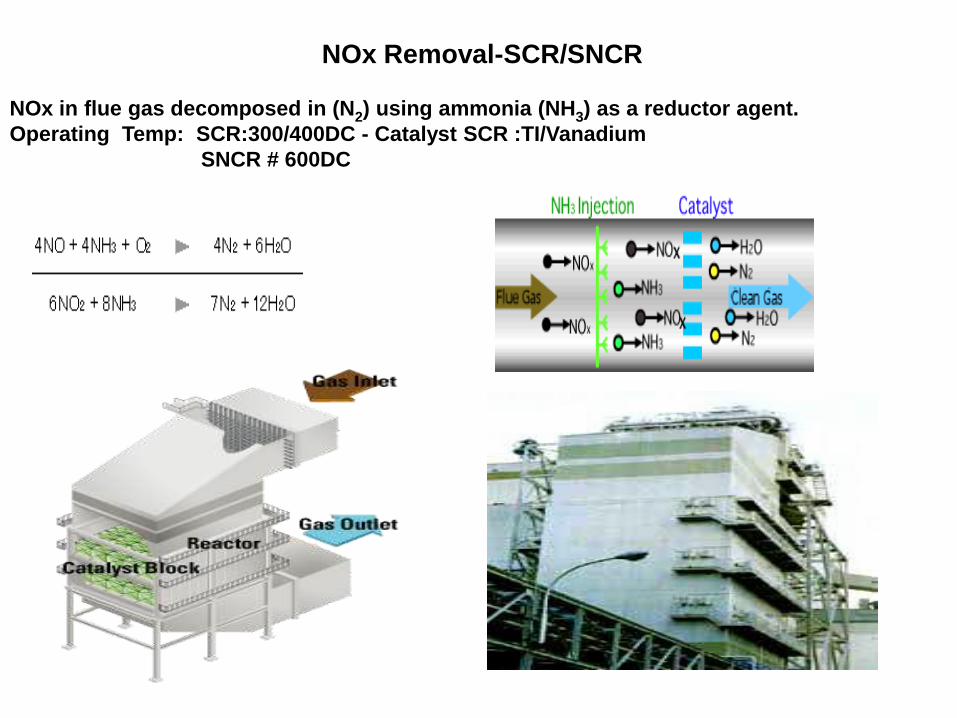
NOx Removal-SCR/SNCR
NOx in flue gas decomposed in (N2) using ammonia (NH3) as a reductor agent.
Operating Temp: SCR:300/400DC - Catalyst SCR :TI/Vanadium
SNCR # 600DC
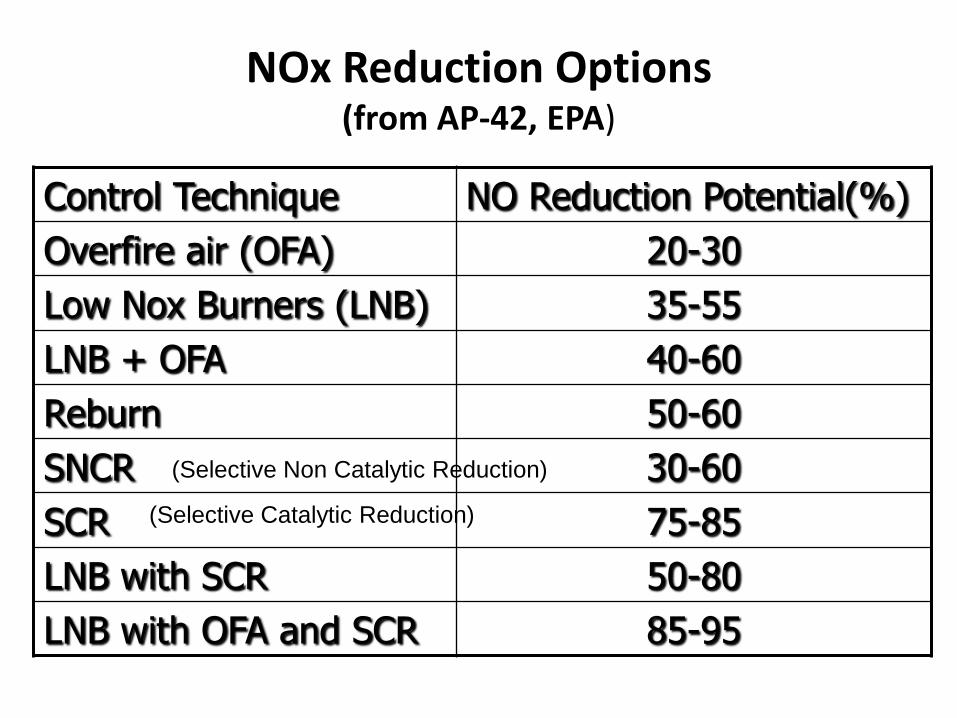
NOx Reduction Options(from AP-42, EPA)
Control Technique NO Reduction Potential(%)
Overfire air (OFA) 20-30
Low Nox Burners (LNB) 35-55
LNB + OFA 40-60
Reburn 50-60
SNCR 30-60
SCR 75-85
LNB with SCR 50-80
LNB with OFA and SCR 85-95
(Selective Non Catalytic Reduction)
(Selective Catalytic Reduction)
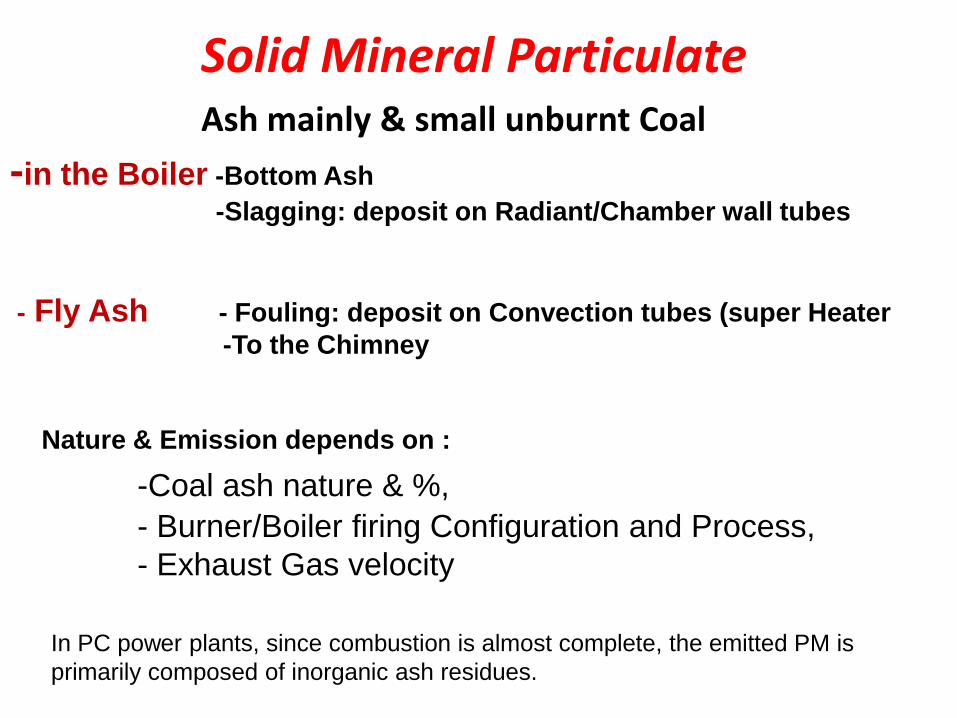
Solid Mineral ParticulateAsh mainly & small unburnt Coal
-in the Boiler -Bottom Ash
-Slagging: deposit on Radiant/Chamber wall tubes
- Fly Ash - Fouling: deposit on Convection tubes (super Heater
-To the Chimney
Nature & Emission depends on :
-Coal ash nature & %,
- Burner/Boiler firing Configuration and Process,
- Exhaust Gas velocity
In PC power plants, since combustion is almost complete, the emitted PM is
primarily composed of inorganic ash residues.
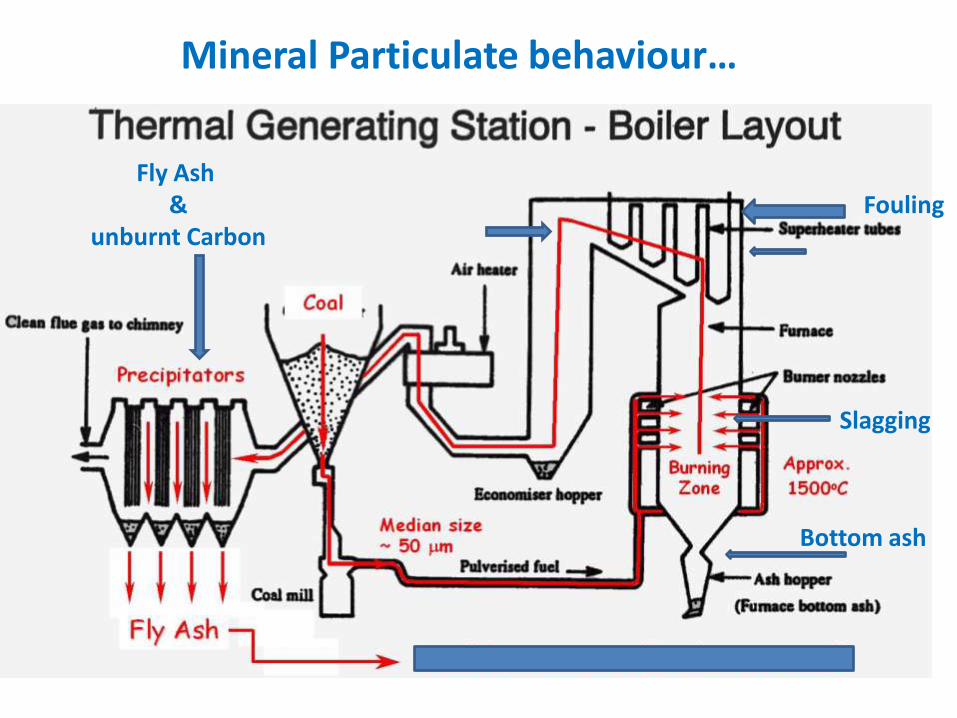
Mineral Particulate behaviour…
Slagging
FoulingFly Ash
&unburnt Carbon
Bottom ash
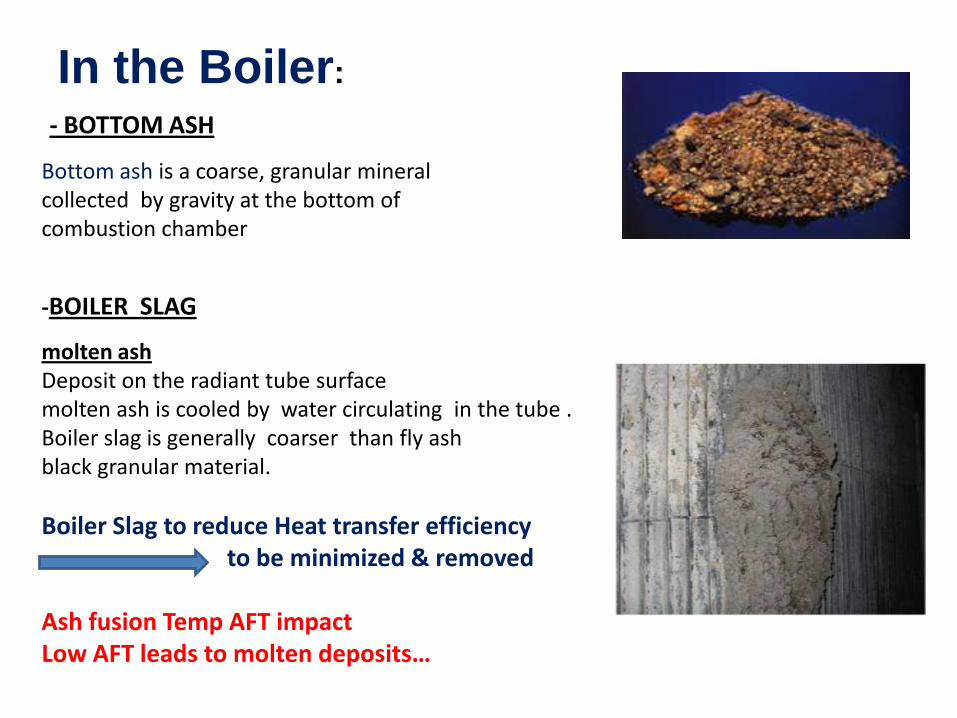
- BOTTOM ASH
Bottom ash is a coarse, granular mineral collected by gravity at the bottom of combustion chamber
In the Boiler:
-BOILER SLAG
molten ashDeposit on the radiant tube surface molten ash is cooled by water circulating in the tube . Boiler slag is generally coarser than fly ash black granular material.
Boiler Slag to reduce Heat transfer efficiency to be minimized & removed
Ash fusion Temp AFT impactLow AFT leads to molten deposits…
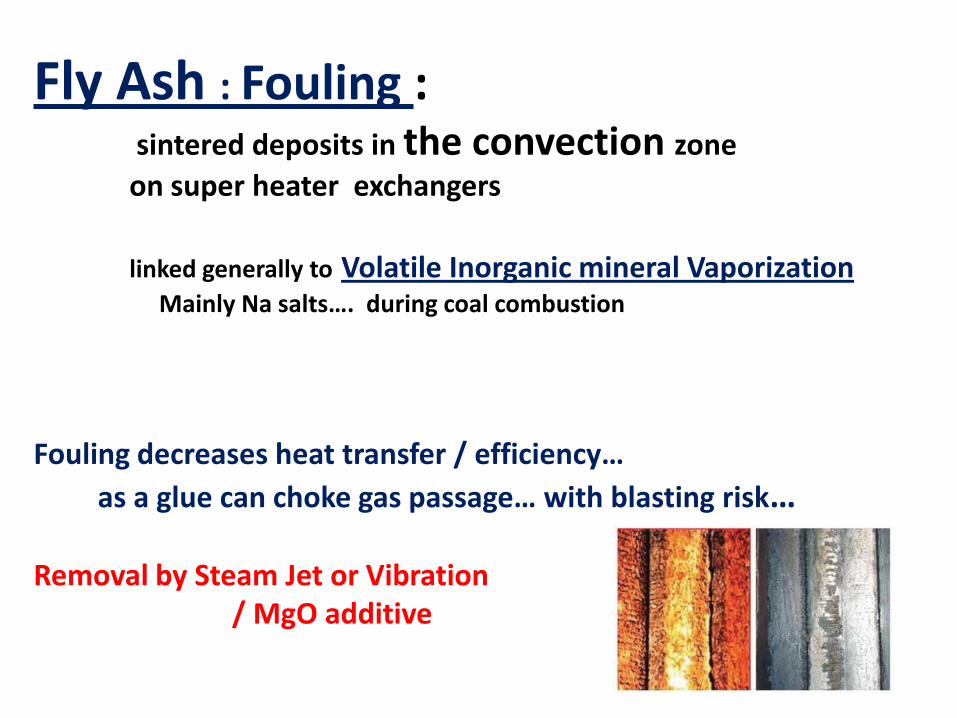
Fly Ash : Fouling : sintered deposits in the convection zone
on super heater exchangers
linked generally to Volatile Inorganic mineral Vaporization Mainly Na salts…. during coal combustion
Fouling decreases heat transfer / efficiency…
as a glue can choke gas passage… with blasting risk…
Removal by Steam Jet or Vibration/ MgO additive

Fly Ash: towards the Chimney…
Fly ash is generally light tan in color and consists mostly of silt-sized and clay-sized glassy spheres. Fly ash can be referred to as either cementitious or pozzolanicCf-fouling IndexContains also some unburnt Carbone
Cenospheres shape due too devolatilization
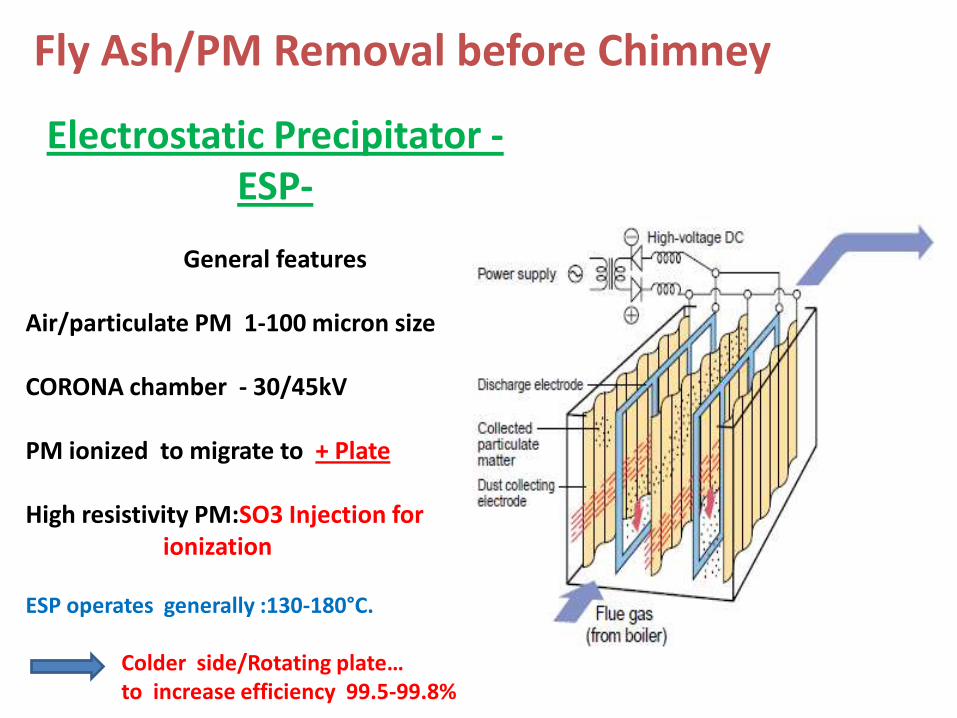
Electrostatic Precipitator -ESP-
General features
Air/particulate PM 1-100 micron size
CORONA chamber - 30/45kV
PM ionized to migrate to + Plate
High resistivity PM:SO3 Injection for ionization
ESP operates generally :130-180°C.
Colder side/Rotating plate…to increase efficiency 99.5-99.8%
Fly Ash/PM Removal before Chimney

Cyclone / Multi Cyclone
Cheap Process…Based on gravity
centrifugation
Low Efficiencyto stop smaller particles
Less than 10 micro.m

Frequent bag chocking –.
Higher pressure drops across bag filter –
Bag chocking resulting in reduced airflow rate & therefore reduction in
plant capacity.
low resistance to: temperature , abrasion acidity gas
To stop very fines particulates
Bag Filtersthe most efficient filtration but…
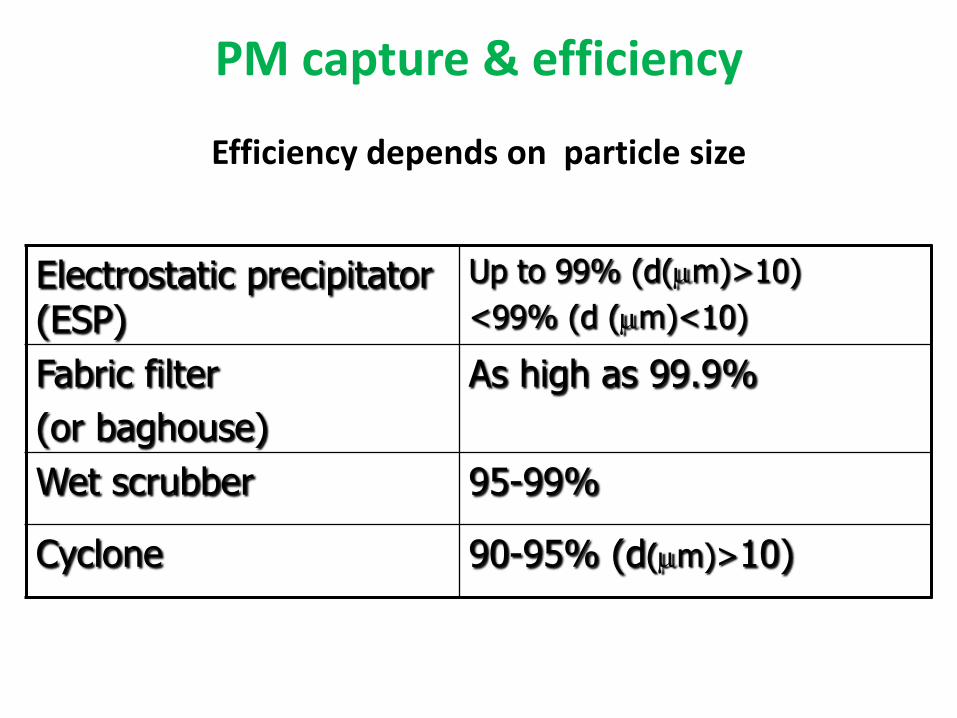
PM capture & efficiency
Efficiency depends on particle size
Electrostatic precipitator (ESP)
Up to 99% (d(m)>10)
<99% (d (m)<10)
Fabric filter
(or baghouse)
As high as 99.9%
Wet scrubber 95-99%
Cyclone 90-95% (d(m)>10)

PM Mineral-Carbon Soot-Aerosols-Origin
Main origin local sources … Diesel Car – Coal/Wood burning (Domestic stove -PP)
Industrial kiln – Flying Dust…sea salt PM from Coal burning «estimate at 10 % from total ? »
carbon soot
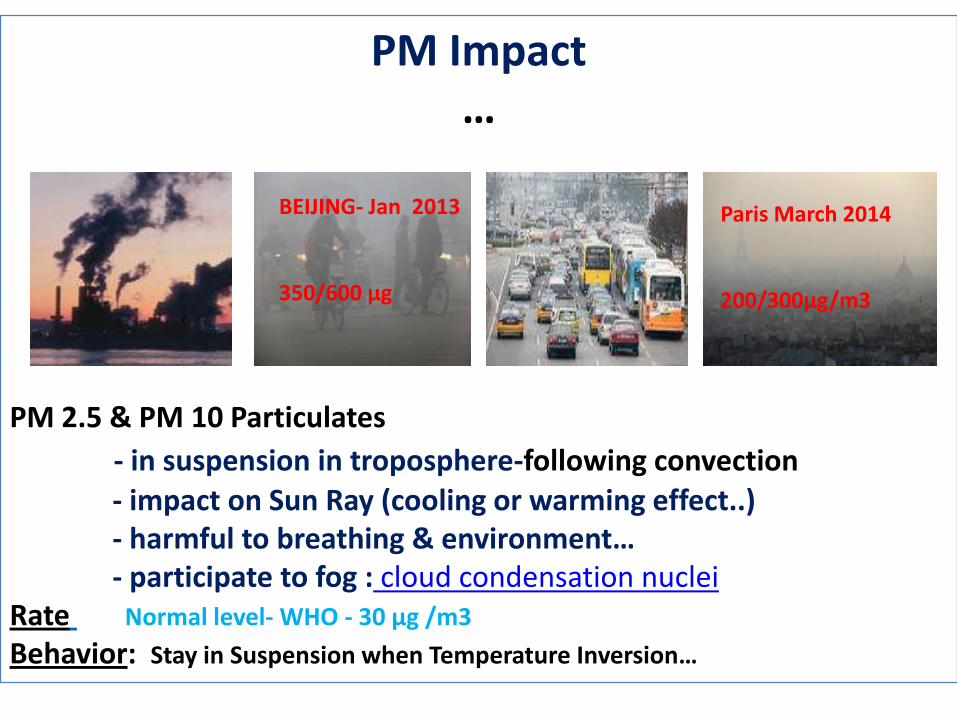
PM Impact …
PM 2.5 & PM 10 Particulates
- in suspension in troposphere-following convection- impact on Sun Ray (cooling or warming effect..)- harmful to breathing & environment… - participate to fog : cloud condensation nuclei
Rate Normal level- WHO - 30 µg /m3
Behavior: Stay in Suspension when Temperature Inversion…
Paris March 2014
200/300µg/m3
BEIJING- Jan 2013
350/600 µg
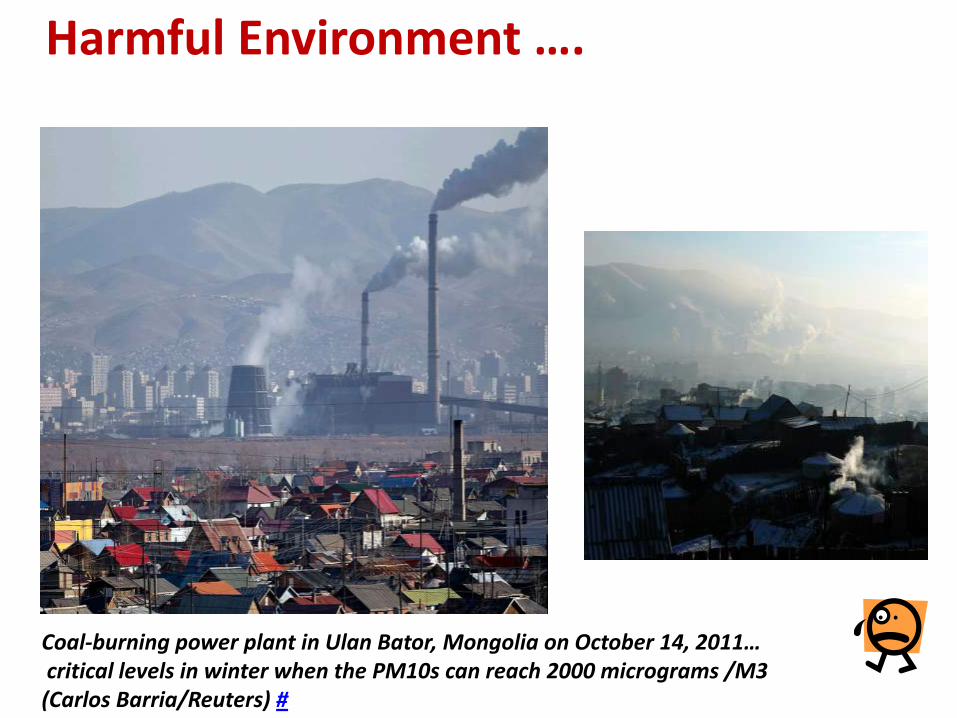
Coal-burning power plant in Ulan Bator, Mongolia on October 14, 2011…critical levels in winter when the PM10s can reach 2000 micrograms /M3(Carlos Barria/Reuters) #
Harmful Environment ….

Harmful Friendly Domestic Wood / Coal Burning...
PM2.5 & CO EmissionsIndoor Measurements*
Household PM µg /m3 CO mg/m·India study – 110-2100 5-216Mexico 890 10-22Nepal 1700-1500 14-360
China Countryside 96-144
Uncontrolled emissions and low Efficiency 15-20% …
* Cornerstone publication Winter 2014

Metal & Mercury trace in Coal Ash
Some Coal can retain Metal traces emissions –as Oxides generally –As cadmium, lead, mercury, nickel, cobalt…. Or Chlorine
Mercury -HgO great concern : 3-12 PPB
USA-EU.. –Emission Control Exhaust gas removal
Concentration of mercury in:
mg/kg-ppm
Australian export coals
0.01 - 0.08 (0.02) #
Other traded coals
0.01 - 0.19 (0.06) #
Earth's crust 0.08
Earth's shales 0.50
# values in parentheses are averages
From CSIRO AUSTRALIA-Ken.Riley
Mercury Trace Removal
-Activated Carbon Injection (ACI)Activated carbon adsorbs gaseous HgO, converting to particle
captured in downstream PM control devices: EPS/ Wet FGD…
-Halogen (bromine) addition to flue gas

Coal-S O2 SO2g SO3g
Organic SOx
-SO3 formation is low - linked to air excess
-SO3g + H2O liq. Sulfuric acid H2SO4 the worst pollutantH2SO4 agglomerate flying dusts to give acid soot/smog
-Gas Temp. at the chimney above the dew point 120/140 DC to avoid any condensation and corrosion..
1kg S needs 0.7 Nm3 O2 and generates 0.7 Nm3 SO2 or 2 Kg SO2
+ O2
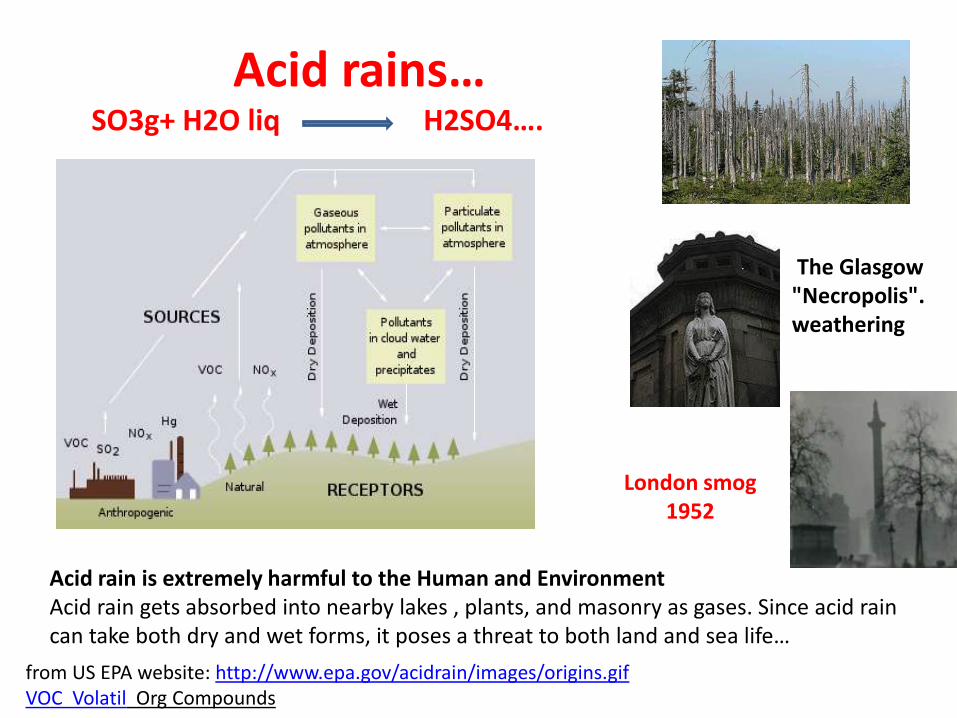
from US EPA website: http://www.epa.gov/acidrain/images/origins.gif VOC Volatil Org Compounds
Acid rains…SO3g+ H2O liq H2SO4….
Acid rain is extremely harmful to the Human and EnvironmentAcid rain gets absorbed into nearby lakes , plants, and masonry as gases. Since acid rain can take both dry and wet forms, it poses a threat to both land and sea life…
The Glasgow "Necropolis". weathering
London smog 1952

FOG or SMOG ?
FOG : an anticyclone in a windless day… causing a temperature inversion with cold
stagnant air trapped under a layer of warm air.
Aerosols PM-– from cars - combustion PP/domestic / biomass… salt-dusts…
can’t diffuse and stay at the level of the ground creating hazardous and stagnant high air pollution
Air Humidity condensates on cold solid nuclei: PM ….?
as micro droplet 0.02mm creating a static fog (rain droplet are 2mm)
SMOG: above fog with other pollutants
SO2/SO3+ H20liq - H2SO4 Sulphuric Acid…
to agglomerate PM ….tarry particles of soot gave the smog its yellow-black color, the nickname "peasoupe” London Dec. 1952: 5/10 000 Deaths ? By Respiratory tract infections - Bronchopneumonia bronchitis – Cancereous….
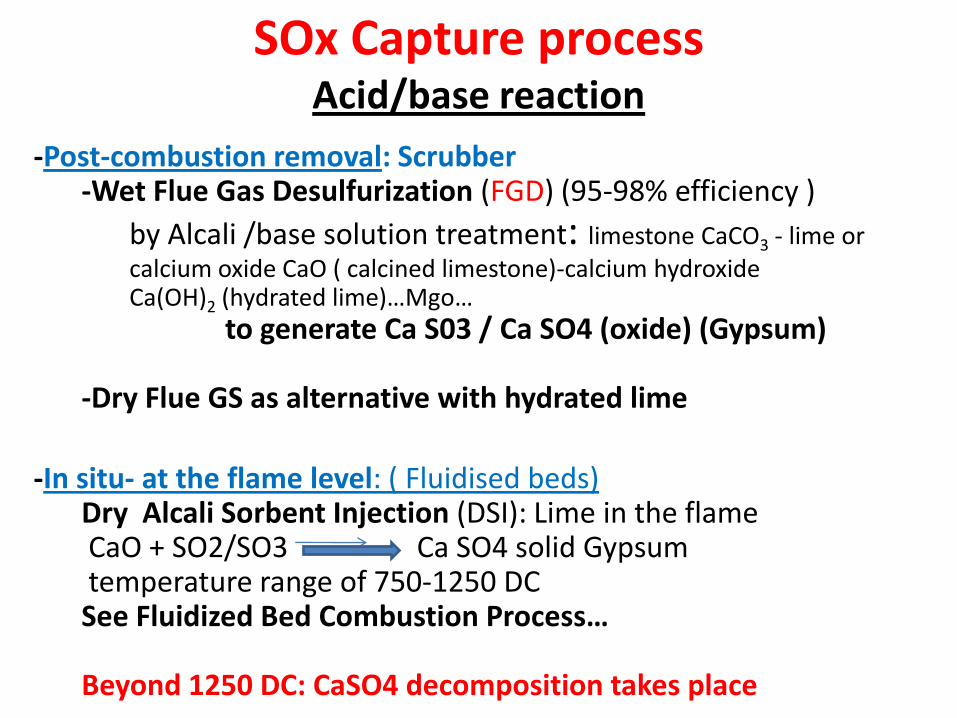
SOx Capture processAcid/base reaction
-Post-combustion removal: Scrubber-Wet Flue Gas Desulfurization (FGD) (95-98% efficiency )
by Alcali /base solution treatment: limestone CaCO3 - lime or calcium oxide CaO ( calcined limestone)-calcium hydroxide Ca(OH)2 (hydrated lime)…Mgo…
to generate Ca S03 / Ca SO4 (oxide) (Gypsum)
-Dry Flue GS as alternative with hydrated lime
-In situ- at the flame level: ( Fluidised beds)Dry Alcali Sorbent Injection (DSI): Lime in the flameCaO + SO2/SO3 Ca SO4 solid Gypsum temperature range of 750-1250 DCSee Fluidized Bed Combustion Process…
Beyond 1250 DC: CaSO4 decomposition takes place
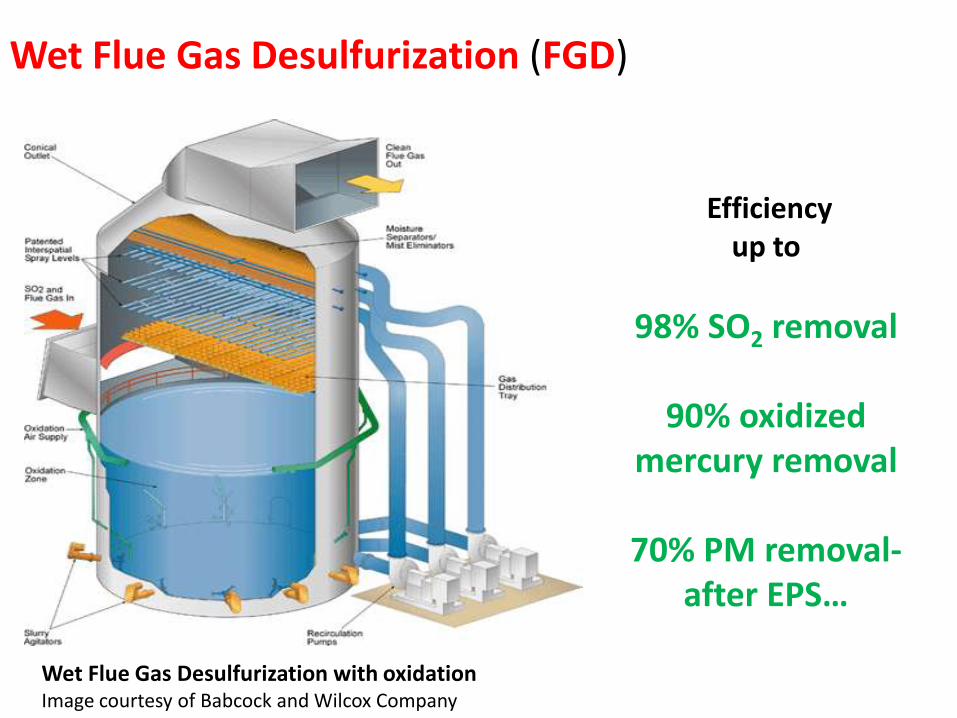
Wet Flue Gas Desulfurization (FGD)
Wet Flue Gas Desulfurization with oxidation Image courtesy of Babcock and Wilcox Company
Efficiency up to
98% SO2 removal
90% oxidized mercury removal
70% PM removal-after EPS…
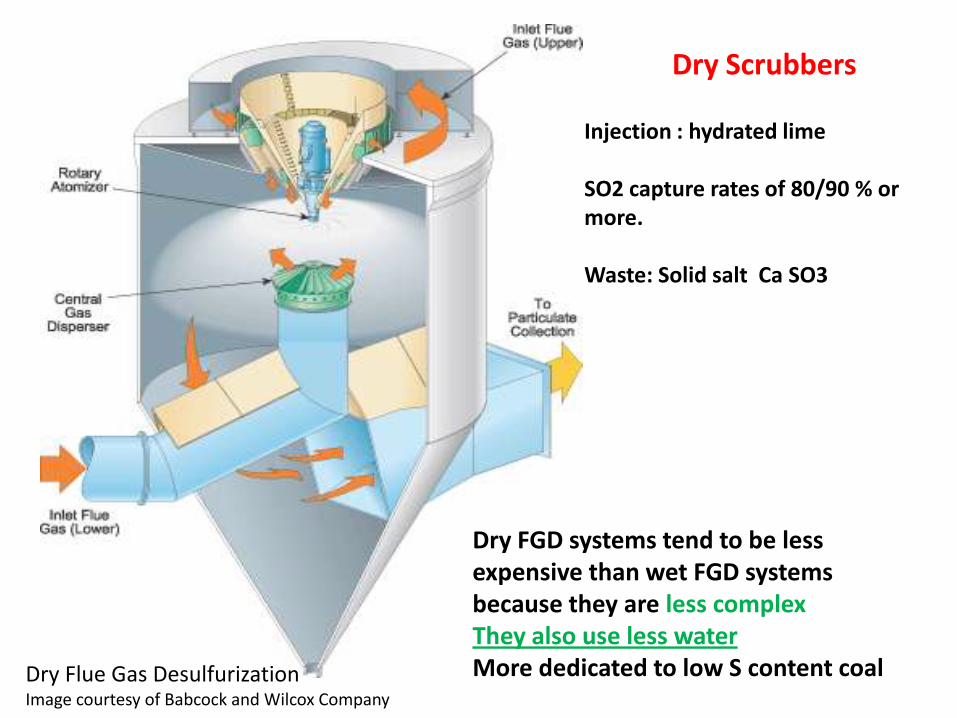
Dry Flue Gas DesulfurizationImage courtesy of Babcock and Wilcox Company
Dry Scrubbers
Injection : hydrated lime
SO2 capture rates of 80/90 % or more.
Waste: Solid salt Ca SO3
Dry FGD systems tend to be less expensive than wet FGD systems because they are less complexThey also use less waterMore dedicated to low S content coal
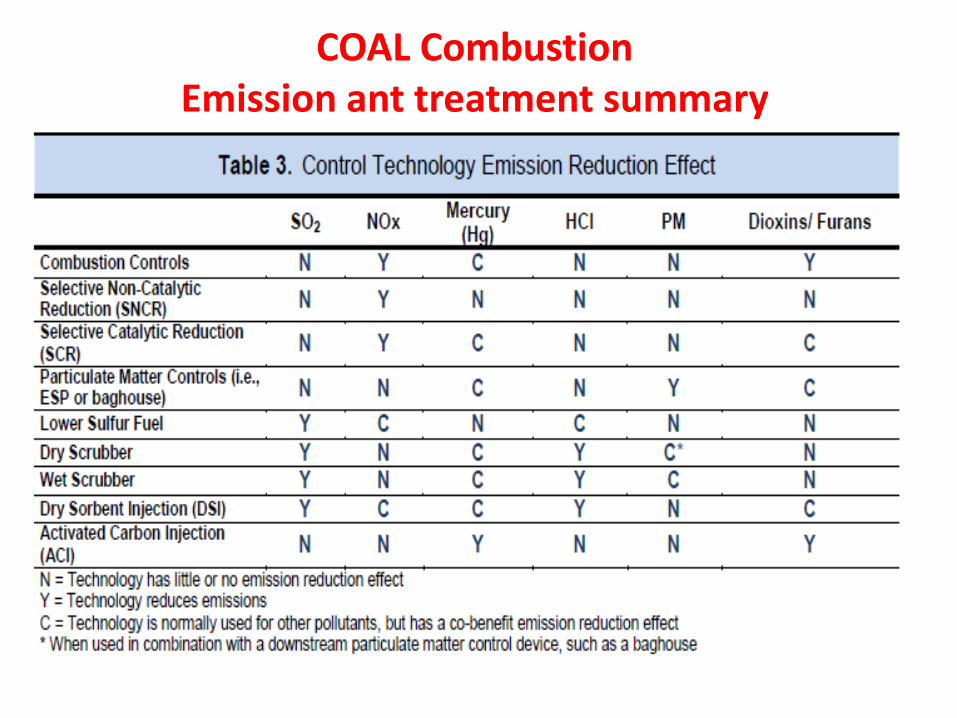
COAL Combustion Emission ant treatment summary
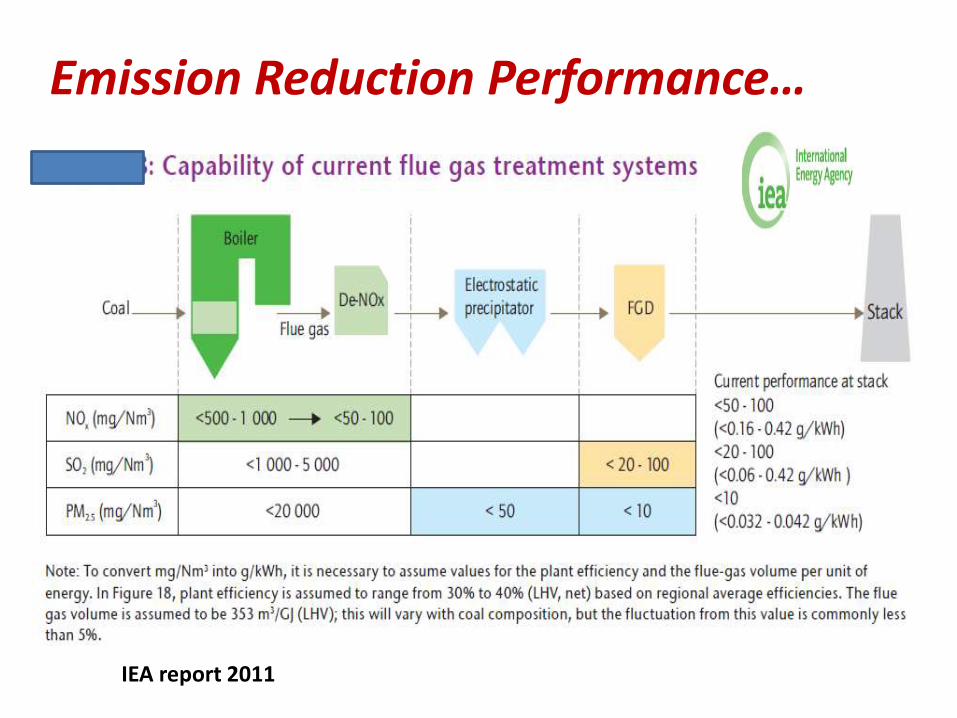
Emission Reduction Performance…
IEA report 2011

Coal PP Combustion - Emission Regulation EU & PR CHINA (mg/Nm3 ) 6%O2
EU EU China Dec 2003 Yr+ 300MWt 2012Yr+300MWt 2012 Yr
PM 30 (50)** 10 20/30*(50)
SOx 200 (400) 150 50/100* (200)
NOx 200 (500) 150 100 (200)
With continuous monitoring …
EU Directive 2001/80/ & 2008/50/EC on Air Quality: to monitor air quality… P 2.5 and P 10 (µ.m.)
2012 CHINA Atmospheric Pollution Prevention Act * non key areas ** ( )before 2003 Yr
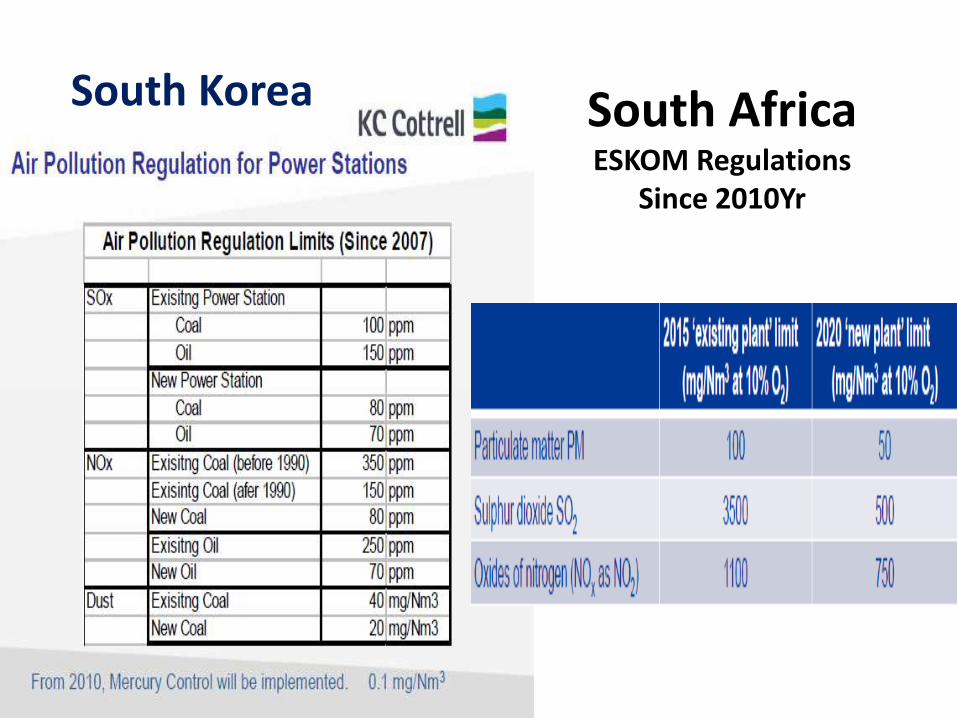
South Korea South AfricaESKOM Regulations
Since 2010Yr
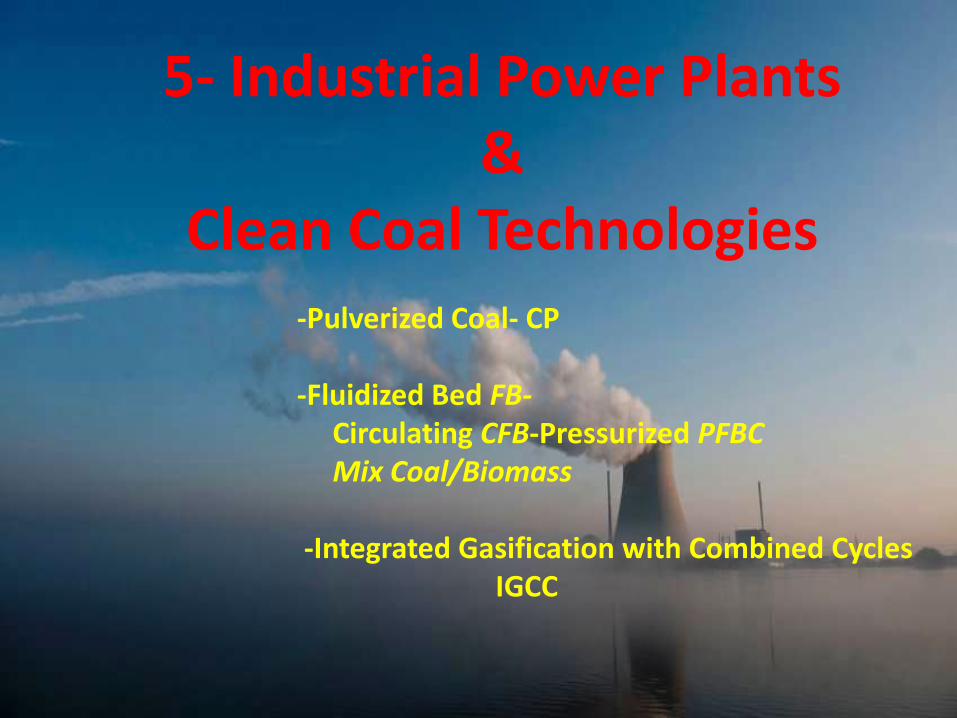
5- Industrial Power Plants &
Clean Coal Technologies -Pulverized Coal- CP
-Fluidized Bed FB-Circulating CFB-Pressurized PFBCMix Coal/Biomass
-Integrated Gasification with Combined Cycles IGCC
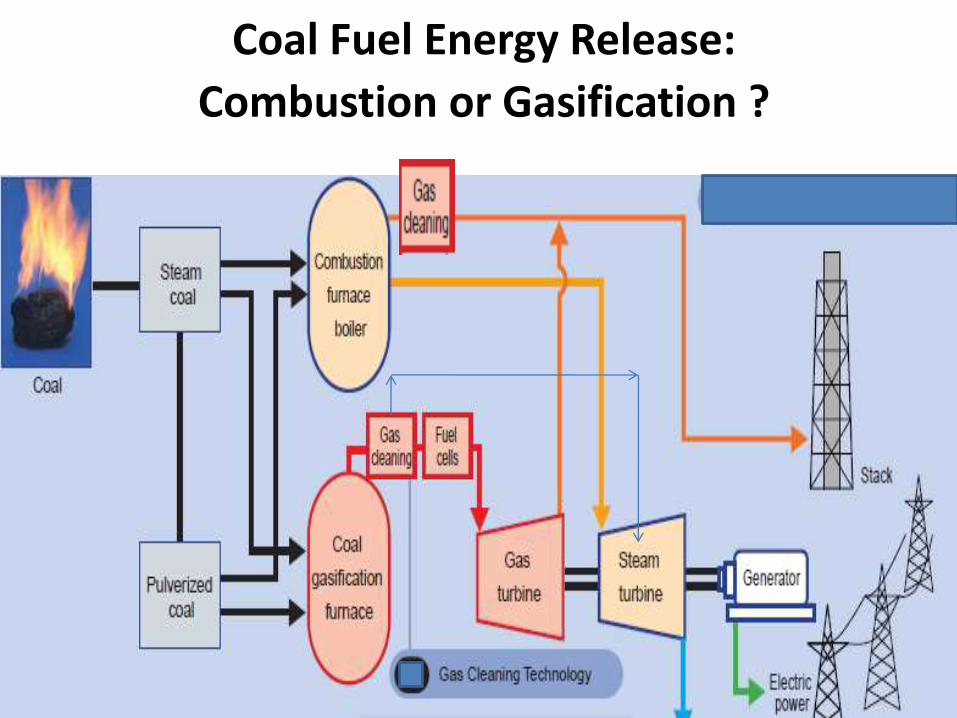
Coal Fuel Energy Release:
Combustion or Gasification ?
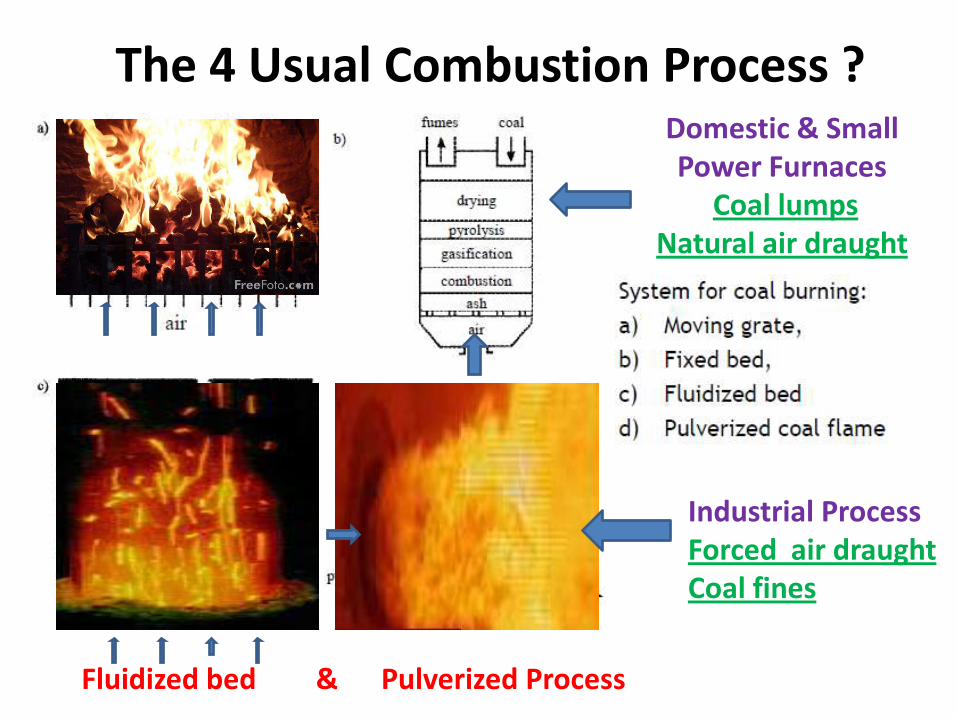
The 4 Usual Combustion Process ? Domestic & Small Power Furnaces
Coal lumpsNatural air draught
Industrial ProcessForced air draughtCoal fines
Fluidized bed & Pulverized Process
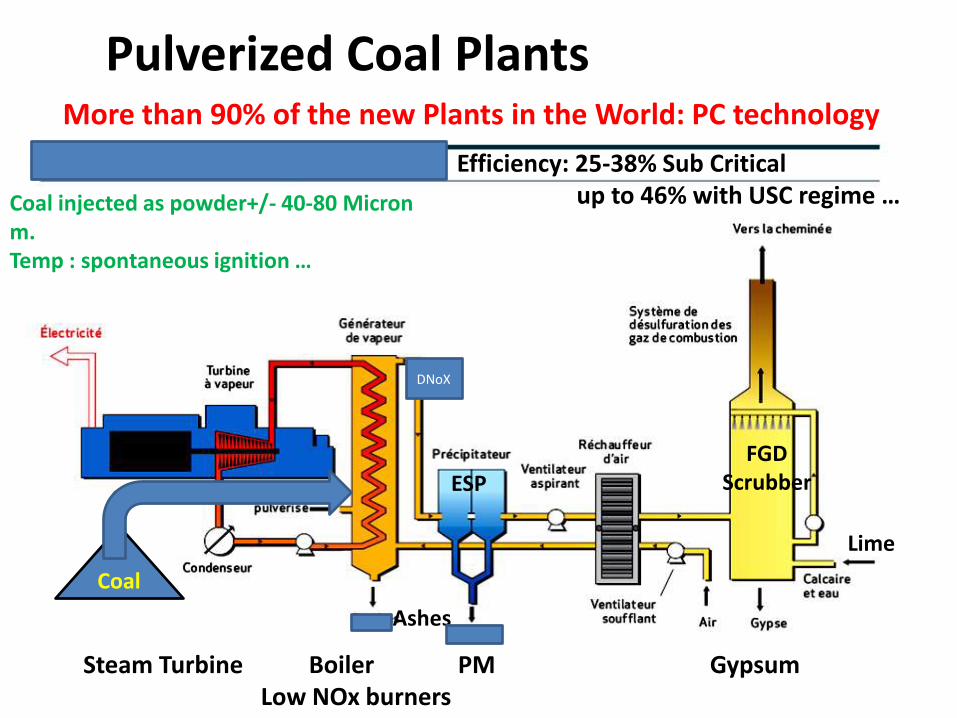
Pulverized Coal Plants
Steam Turbine Boiler PM GypsumLow NOx burners
DNoX
More than 90% of the new Plants in the World: PC technology
Coal injected as powder+/- 40-80 Micron m.Temp : spontaneous ignition …
Coal
Ashes
Efficiency: 25-38% Sub Critical up to 46% with USC regime …
ESP
FGD Scrubber
Lime

Vertical Mill Coal Grinder
General ball grinding mill is the first coal milling machine,Coal powder generated is in the range 30-120 Micron-m. sizing (average 60-80)
Coal fine powder is quite unstable with spontaneous inflammation/blasting risksTherefore coal powder is not stored generally-only with inert gas
Coal Powder is transported in suspension within drying primary air – around 100DC -to the burner
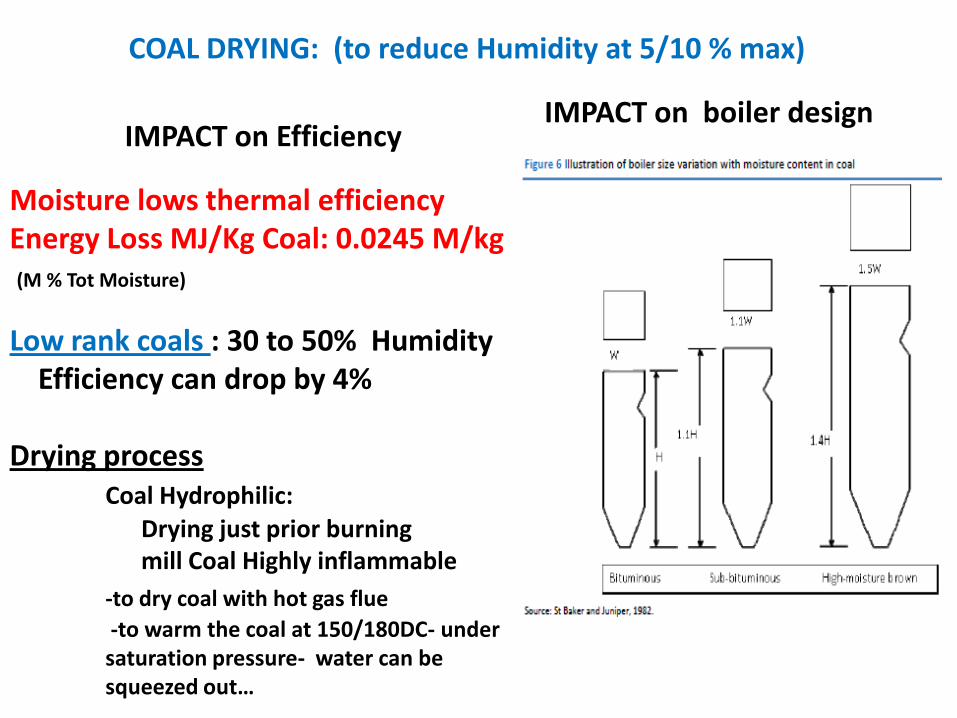
IMPACT on Efficiency
Moisture lows thermal efficiencyEnergy Loss MJ/Kg Coal: 0.0245 M/kg(M % Tot Moisture)
Low rank coals : 30 to 50% HumidityEfficiency can drop by 4%
Drying processCoal Hydrophilic:
Drying just prior burningmill Coal Highly inflammable
-to dry coal with hot gas flue
-to warm the coal at 150/180DC- under saturation pressure- water can be squeezed out…
IMPACT on boiler design
COAL DRYING: (to reduce Humidity at 5/10 % max)

Coal Burner/Injector low NOX …

Coal Burners for Wall-Fired Boilers with swirl and low Nox - in a pressurized chamber
Burner/injector : Natural and Pressure flamesTo improve Combustion and to reduce NOX formation
Coal flames on a domestic basic stoker
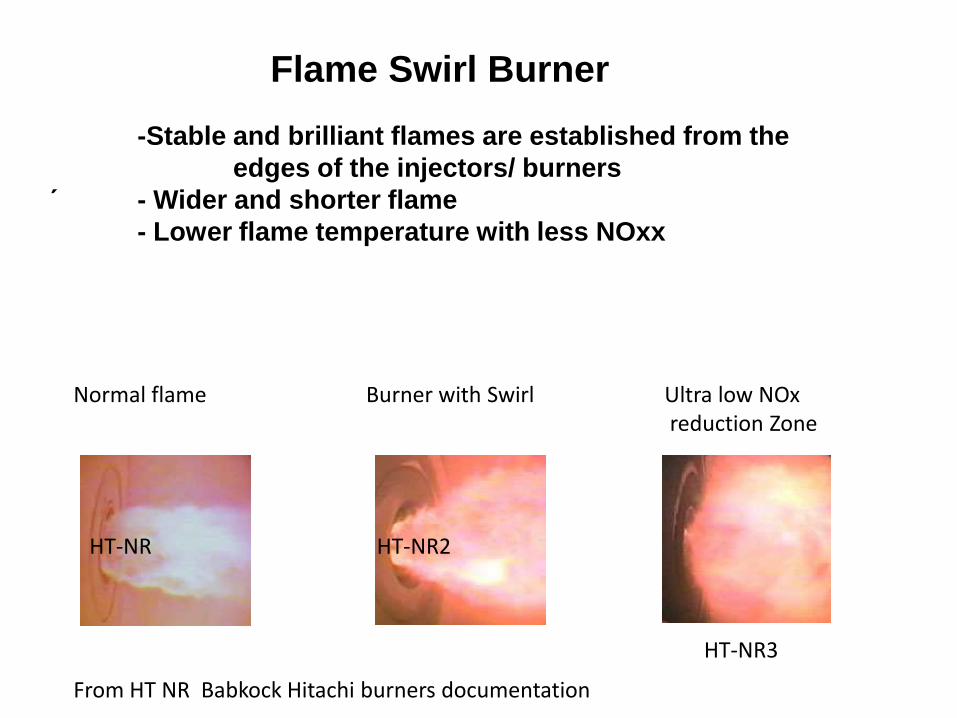
Flame Swirl Burner
-Stable and brilliant flames are established from the
edges of the injectors/ burners
´ - Wider and shorter flame
- Lower flame temperature with less NOxx
HT-NR HT-NR2
HT-NR3
From HT NR Babkock Hitachi burners documentation
Normal flame Burner with Swirl Ultra low NOx reduction Zone
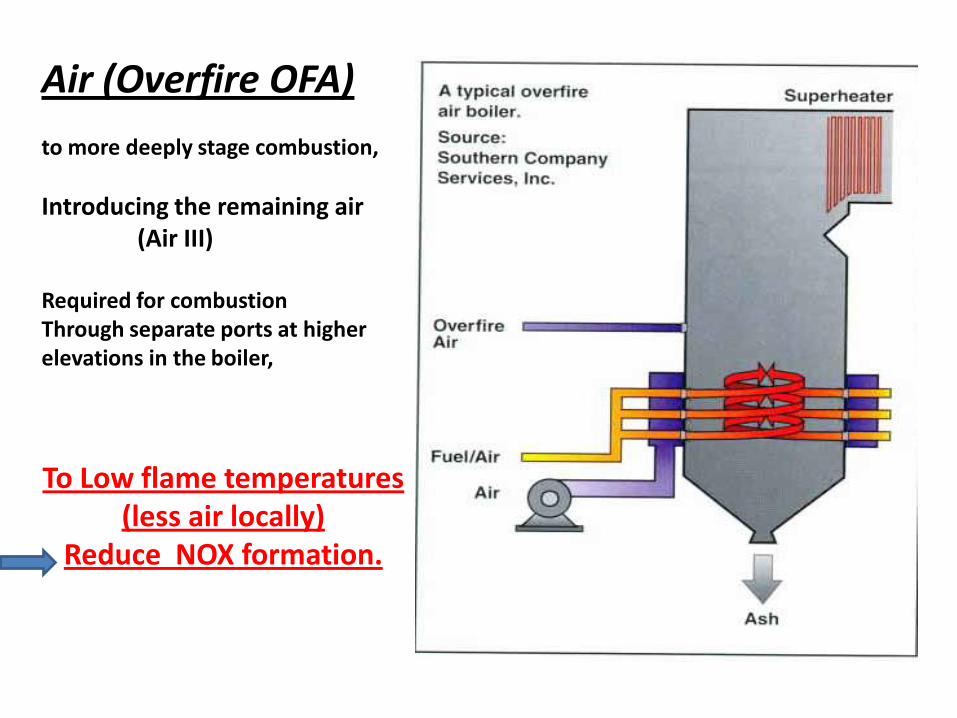
Air (Overfire OFA)
to more deeply stage combustion,
Introducing the remaining air (Air III)
Required for combustion Through separate ports at higherelevations in the boiler,
To Low flame temperatures(less air locally)
Reduce NOX formation.
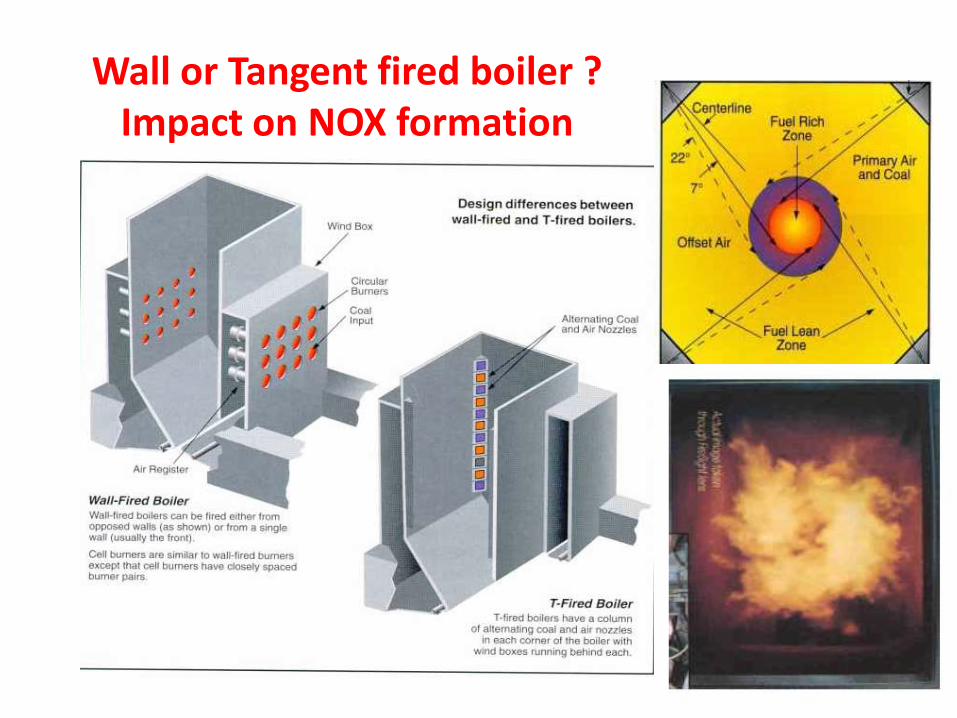
Wall or Tangent fired boiler ?Impact on NOX formation
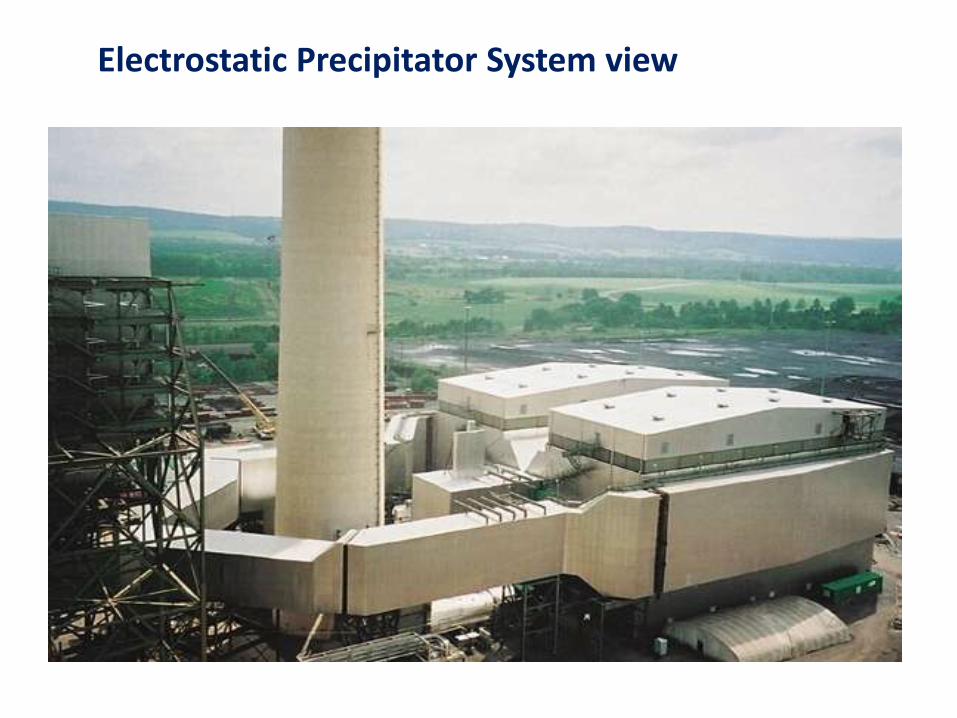
Electrostatic Precipitator System view
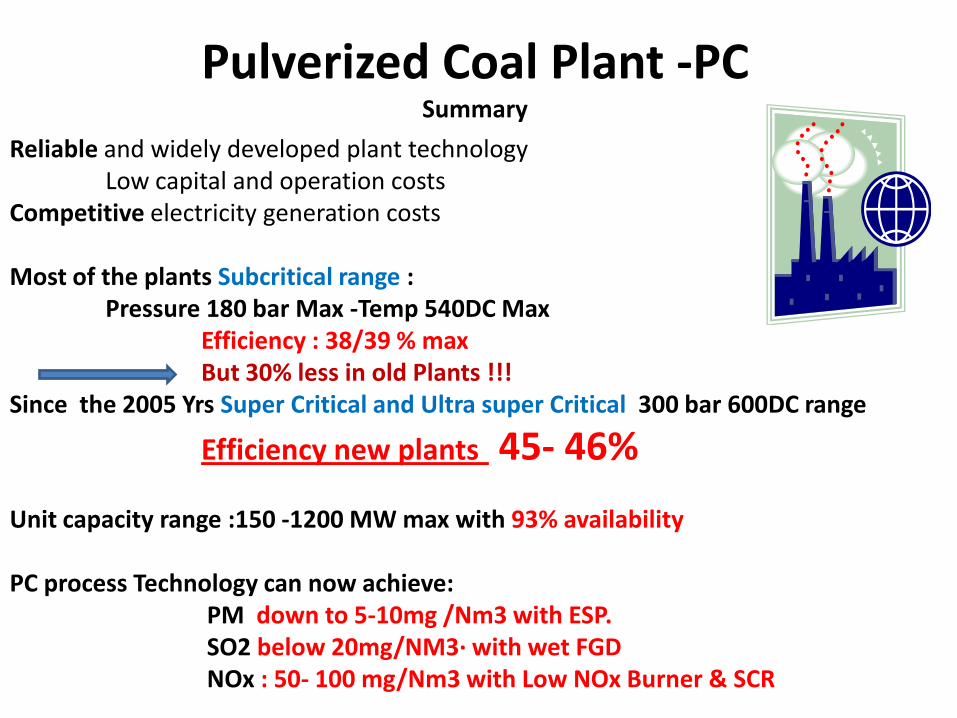
Reliable and widely developed plant technologyLow capital and operation costs
Competitive electricity generation costs
Most of the plants Subcritical range :Pressure 180 bar Max -Temp 540DC Max
Efficiency : 38/39 % maxBut 30% less in old Plants !!!
Since the 2005 Yrs Super Critical and Ultra super Critical 300 bar 600DC range
Efficiency new plants 45- 46%
Unit capacity range :150 -1200 MW max with 93% availability
PC process Technology can now achieve:PM down to 5-10mg /Nm3 with ESP.SO2 below 20mg/NM3· with wet FGDNOx : 50- 100 mg/Nm3 with Low NOx Burner & SCR
Pulverized Coal Plant -PC Summary
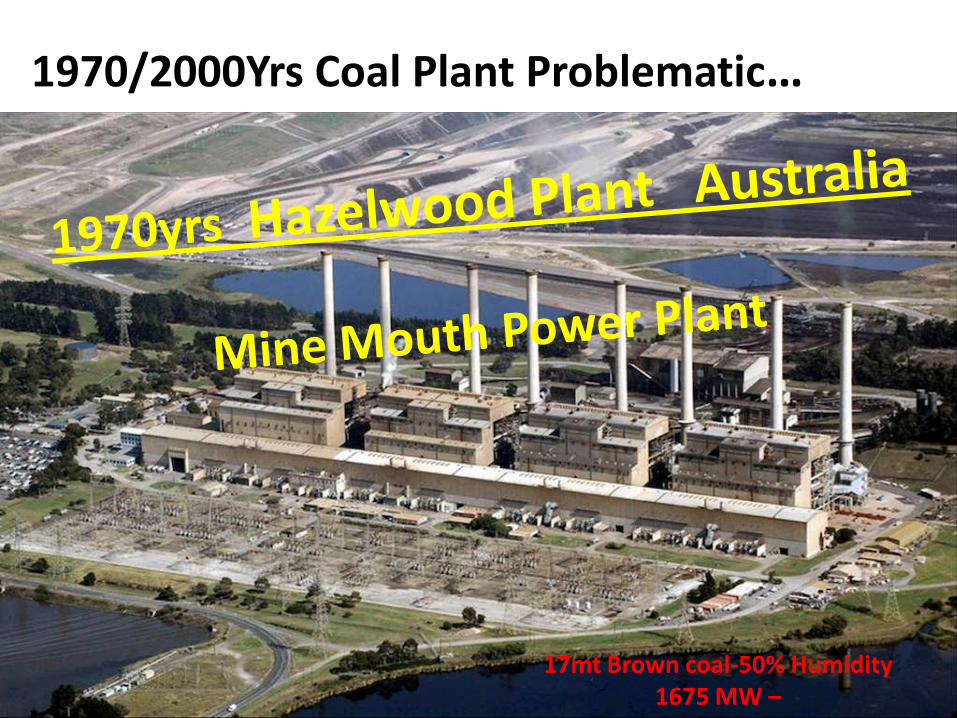
17mt Brown coal-50% Humidity1675 MW –
1970/2000Yrs Coal Plant Problematic…
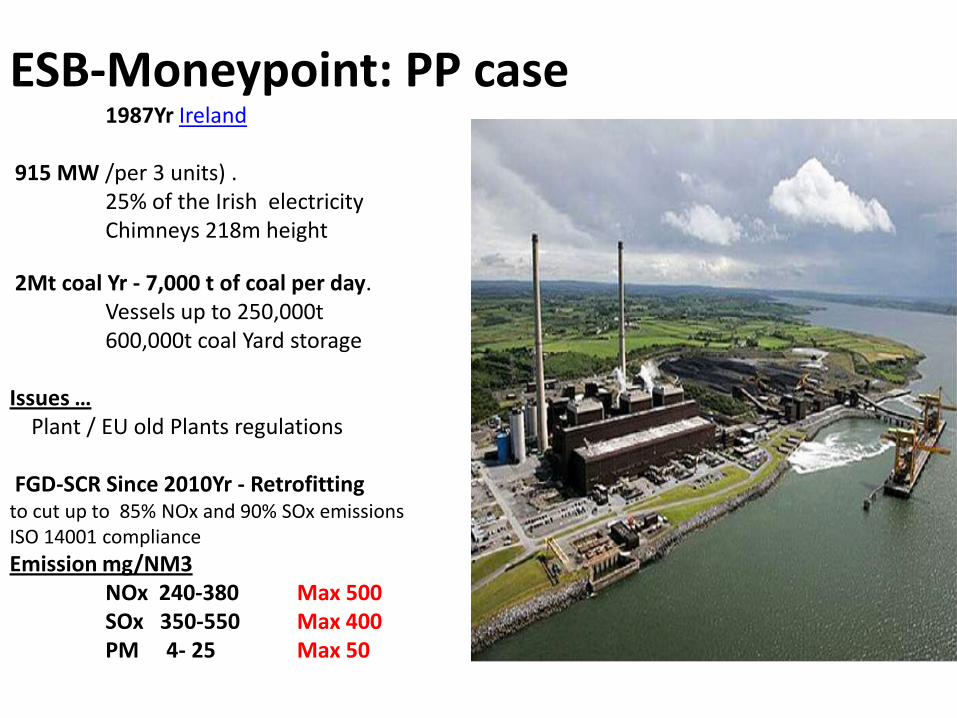
ESB-Moneypoint: PP case 1987Yr Ireland
915 MW /per 3 units) . 25% of the Irish electricityChimneys 218m height
2Mt coal Yr - 7,000 t of coal per day. Vessels up to 250,000t 600,000t coal Yard storage
Issues …Plant / EU old Plants regulations
FGD-SCR Since 2010Yr - Retrofittingto cut up to 85% NOx and 90% SOx emissions ISO 14001 compliance
Emission mg/NM3 NOx 240-380 Max 500SOx 350-550 Max 400PM 4- 25 Max 50

Old and Inefficient Coal Plant Problematic…
Usual life timedesigned 25/35 Yrs
Up to 40Yrs ….
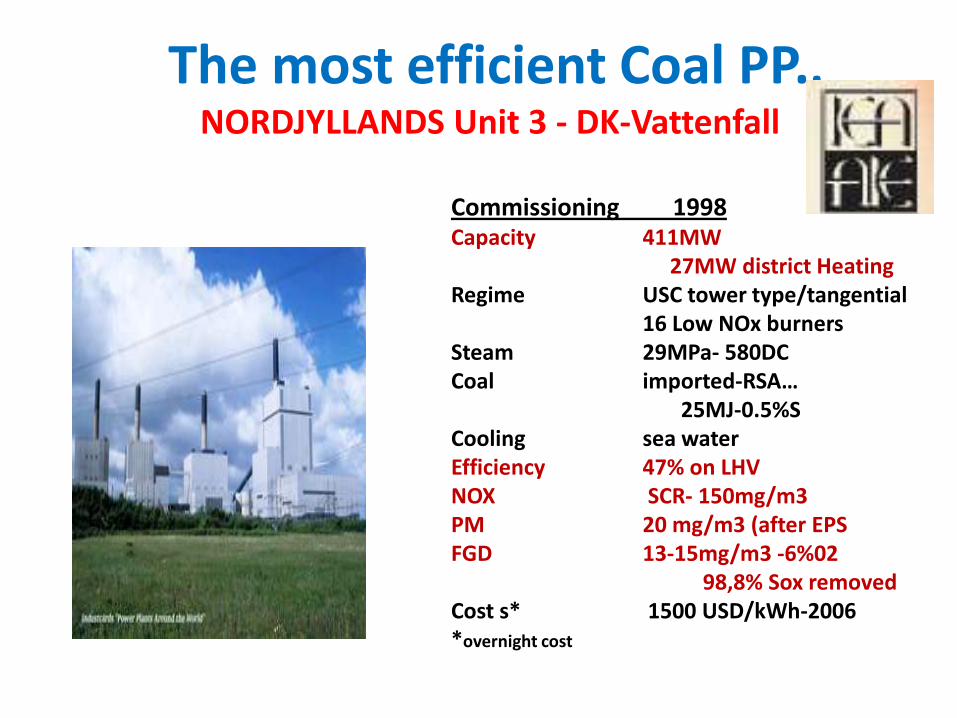
The most efficient Coal PP.. NORDJYLLANDS Unit 3 - DK-Vattenfall
Commissioning 1998Capacity 411MW
27MW district HeatingRegime USC tower type/tangential
16 Low NOx burnersSteam 29MPa- 580DCCoal imported-RSA…
25MJ-0.5%SCooling sea waterEfficiency 47% on LHVNOX SCR- 150mg/m3PM 20 mg/m3 (after EPSFGD 13-15mg/m3 -6%02
98,8% Sox removedCost s* 1500 USD/kWh-2006*overnight cost
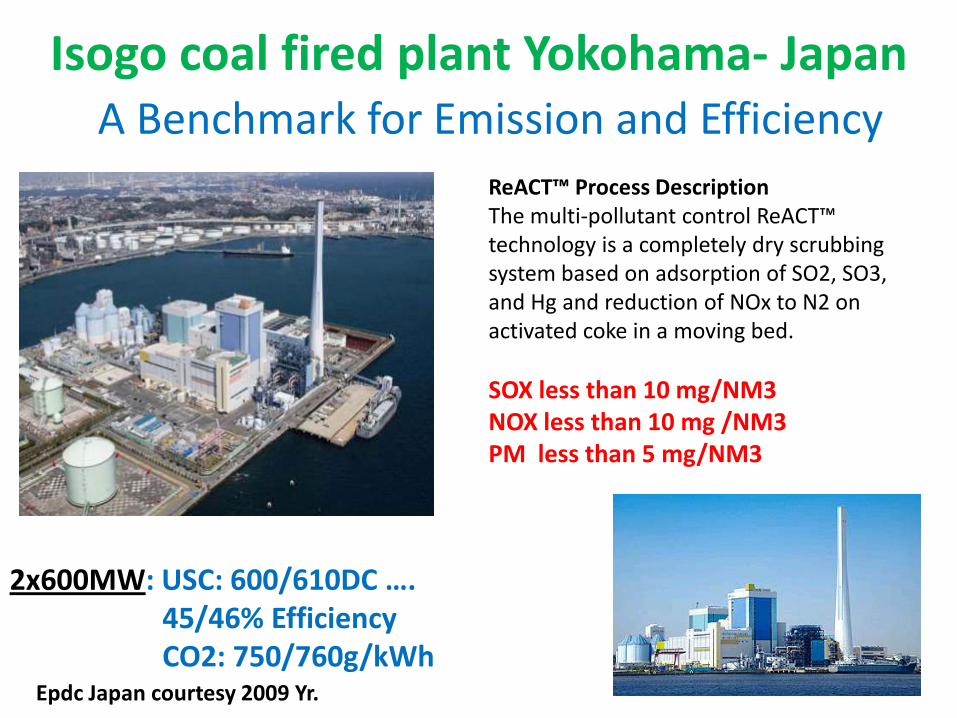
Isogo coal fired plant Yokohama- Japan A Benchmark for Emission and Efficiency
2x600MW: USC: 600/610DC …. 45/46% EfficiencyCO2: 750/760g/kWh
ReACT™ Process Description The multi-pollutant control ReACT™ technology is a completely dry scrubbing system based on adsorption of SO2, SO3, and Hg and reduction of NOx to N2 on activated coke in a moving bed.
SOX less than 10 mg/NM3NOX less than 10 mg /NM3PM less than 5 mg/NM3
Epdc Japan courtesy 2009 Yr.
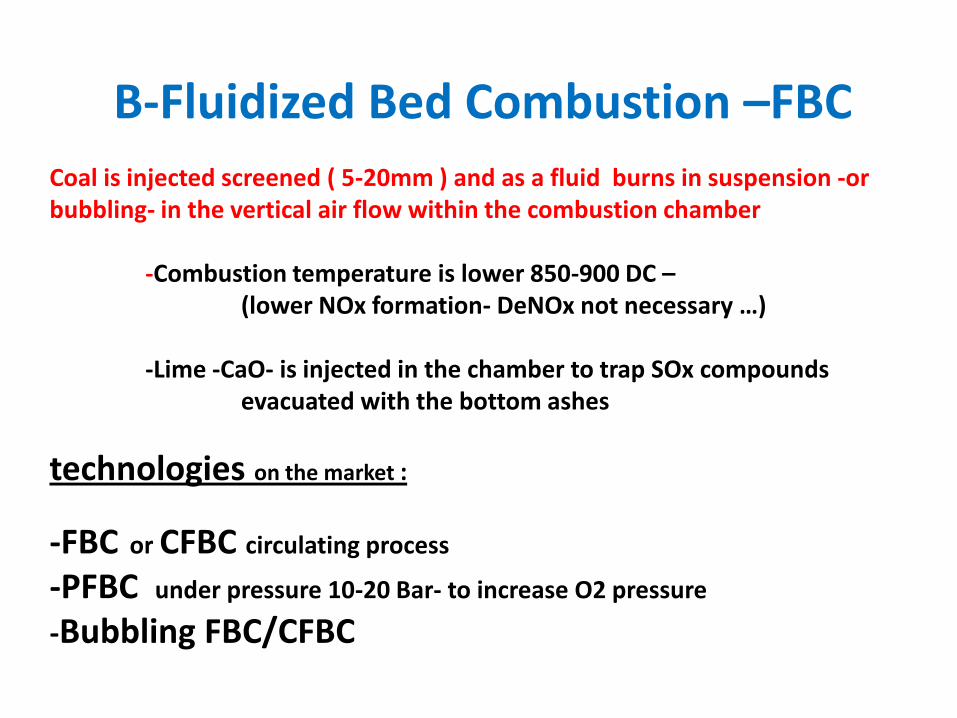
B-Fluidized Bed Combustion –FBC
Coal is injected screened ( 5-20mm ) and as a fluid burns in suspension -or bubbling- in the vertical air flow within the combustion chamber
-Combustion temperature is lower 850-900 DC –(lower NOx formation- DeNOx not necessary …)
-Lime -CaO- is injected in the chamber to trap SOx compounds evacuated with the bottom ashes
technologies on the market :
-FBC or CFBC circulating process
-PFBC under pressure 10-20 Bar- to increase O2 pressure
-Bubbling FBC/CFBC
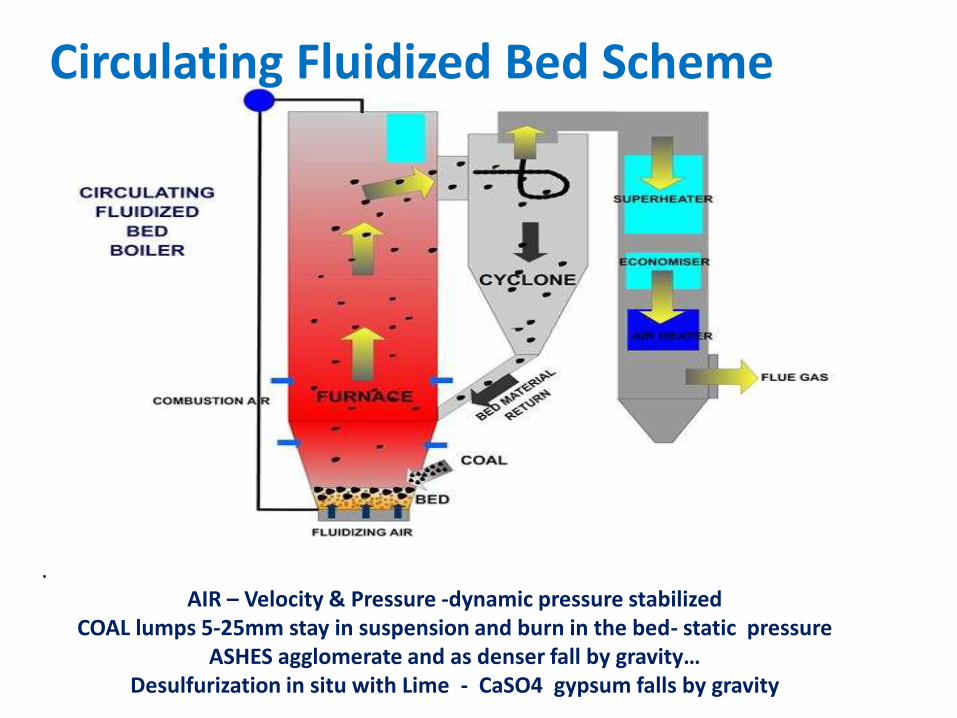
. AIR – Velocity & Pressure -dynamic pressure stabilized
COAL lumps 5-25mm stay in suspension and burn in the bed- static pressureASHES agglomerate and as denser fall by gravity…
Desulfurization in situ with Lime - CaSO4 gypsum falls by gravity
Circulating Fluidized Bed Scheme

Combustion in Fluidized bed
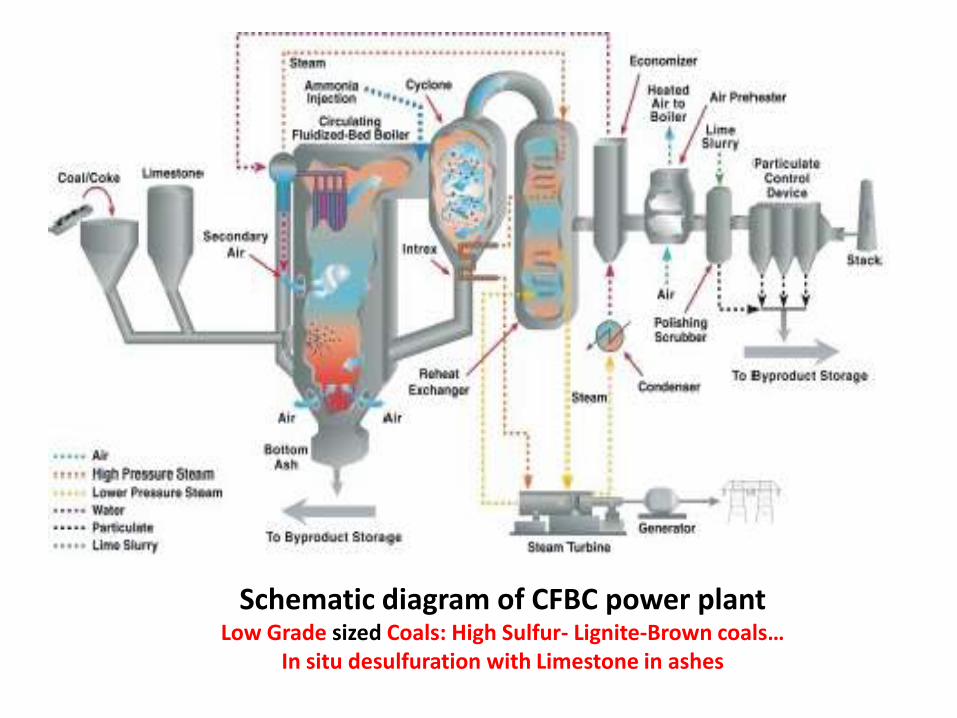
Schematic diagram of CFBC power plantLow Grade sized Coals: High Sulfur- Lignite-Brown coals…
In situ desulfuration with Limestone in ashes
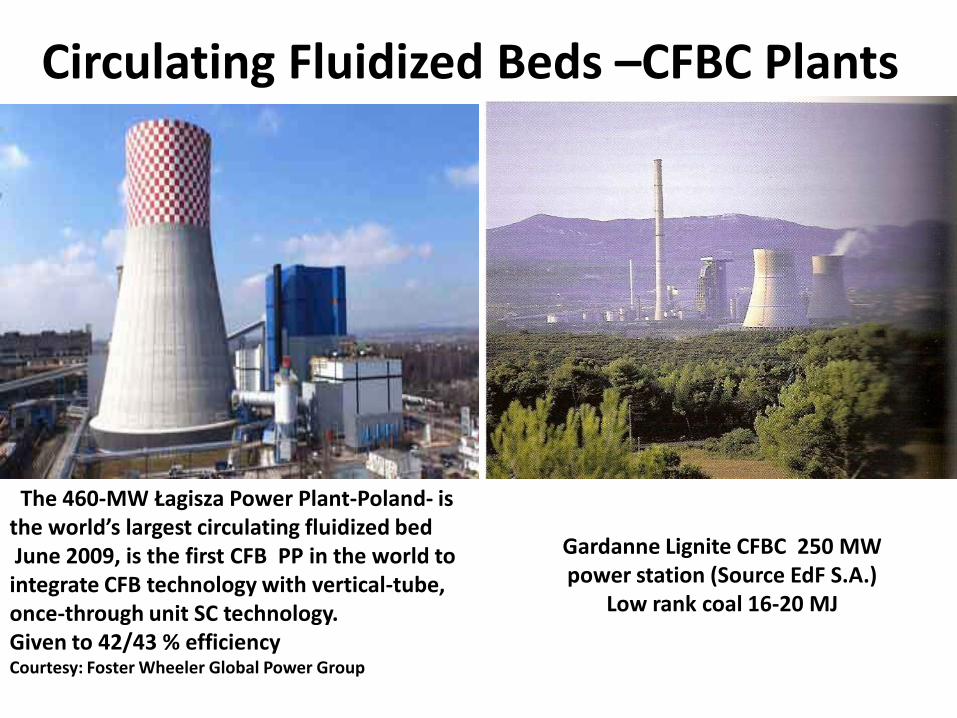
The 460-MW Łagisza Power Plant-Poland- is the world’s largest circulating fluidized bed June 2009, is the first CFB PP in the world to integrate CFB technology with vertical-tube, once-through unit SC technology. Given to 42/43 % efficiency Courtesy: Foster Wheeler Global Power Group
Gardanne Lignite CFBC 250 MW power station (Source EdF S.A.)
Low rank coal 16-20 MJ
Circulating Fluidized Beds –CFBC Plants
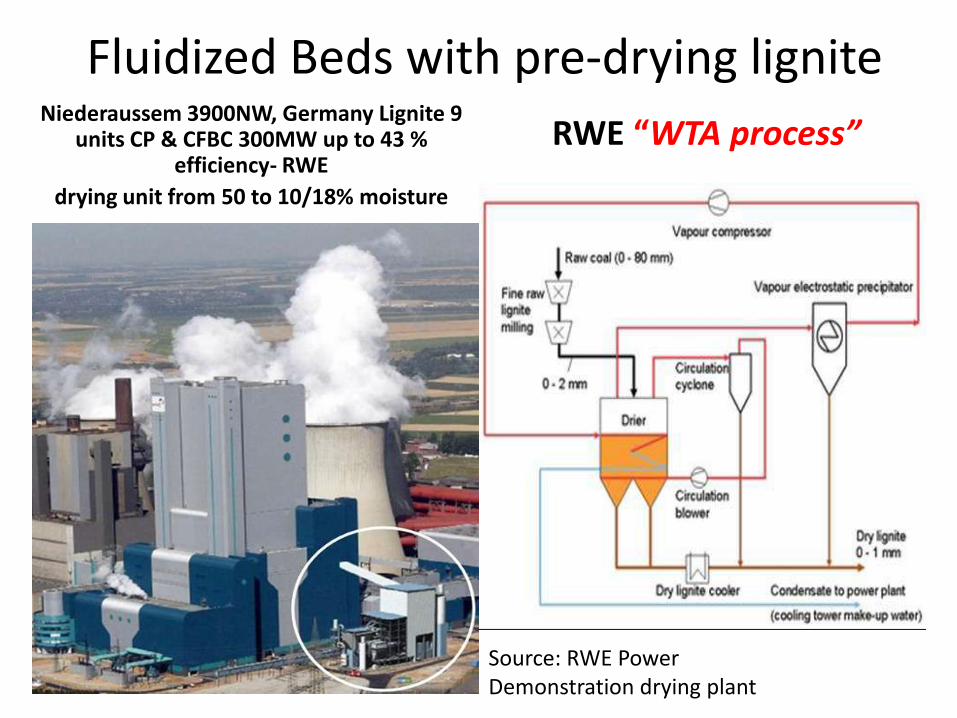
Fluidized Beds with pre-drying ligniteNiederaussem 3900NW, Germany Lignite 9
units CP & CFBC 300MW up to 43 % efficiency- RWE
drying unit from 50 to 10/18% moisture
RWE “WTA process”
Source: RWE PowerDemonstration drying plant
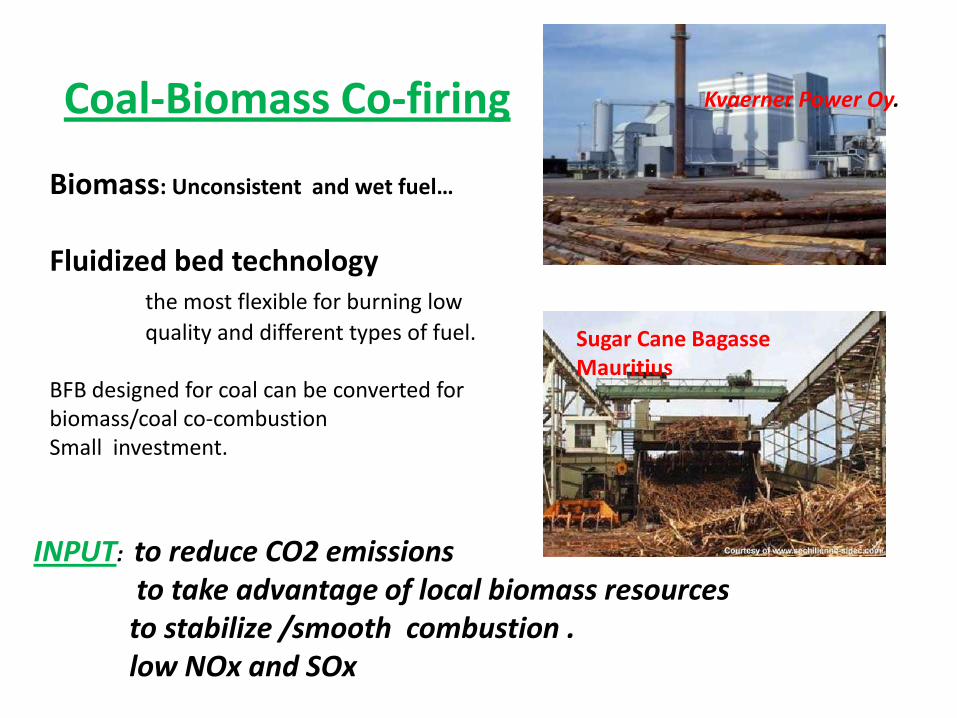
Coal-Biomass Co-firing
Biomass: Unconsistent and wet fuel…
Fluidized bed technologythe most flexible for burning low
quality and different types of fuel.
BFB designed for coal can be converted for biomass/coal co-combustionSmall investment.
INPUT: to reduce CO2 emissionsto take advantage of local biomass resourcesto stabilize /smooth combustion .low NOx and SOx
Kvaerner Power Oy.
Sugar Cane Bagasse Mauritius
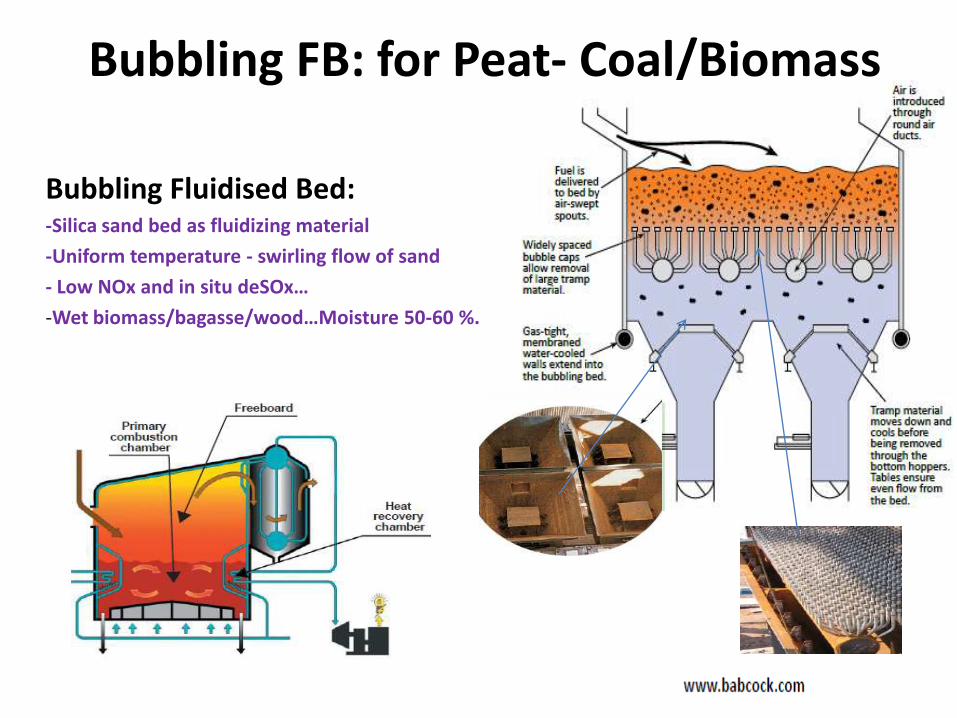
Bubbling FB: for Peat- Coal/Biomass
Bubbling Fluidised Bed: -Silica sand bed as fluidizing material
-Uniform temperature - swirling flow of sand
- Low NOx and in situ deSOx…
-Wet biomass/bagasse/wood…Moisture 50-60 %.
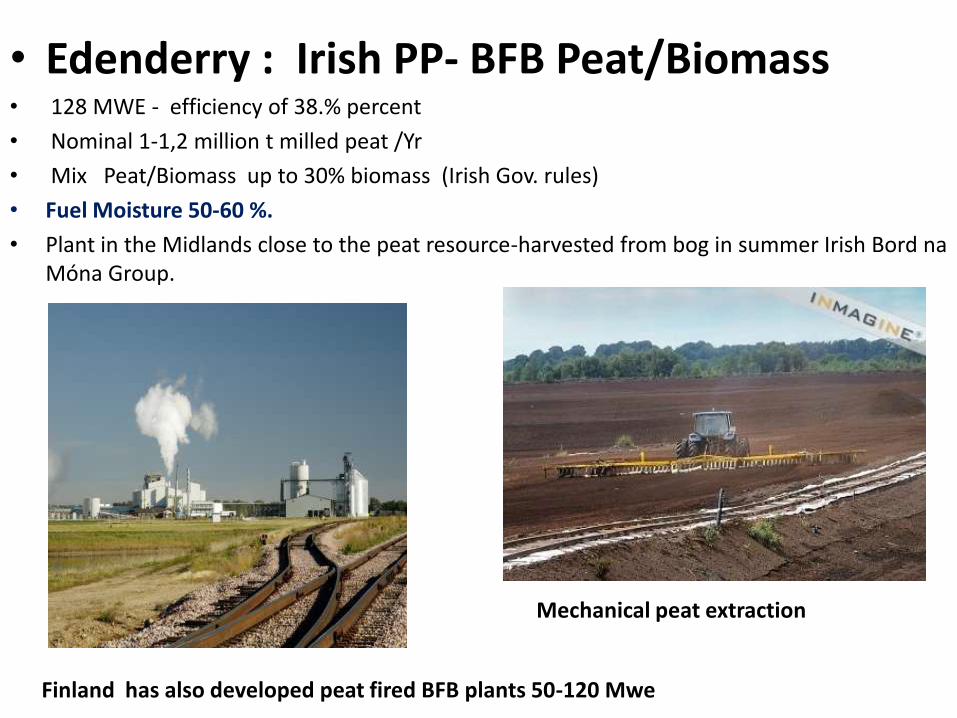
• Edenderry : Irish PP- BFB Peat/Biomass • 128 MWE - efficiency of 38.% percent
• Nominal 1-1,2 million t milled peat /Yr
• Mix Peat/Biomass up to 30% biomass (Irish Gov. rules)
• Fuel Moisture 50-60 %.
• Plant in the Midlands close to the peat resource-harvested from bog in summer Irish Bord naMóna Group.
Mechanical peat extraction
Finland has also developed peat fired BFB plants 50-120 Mwe
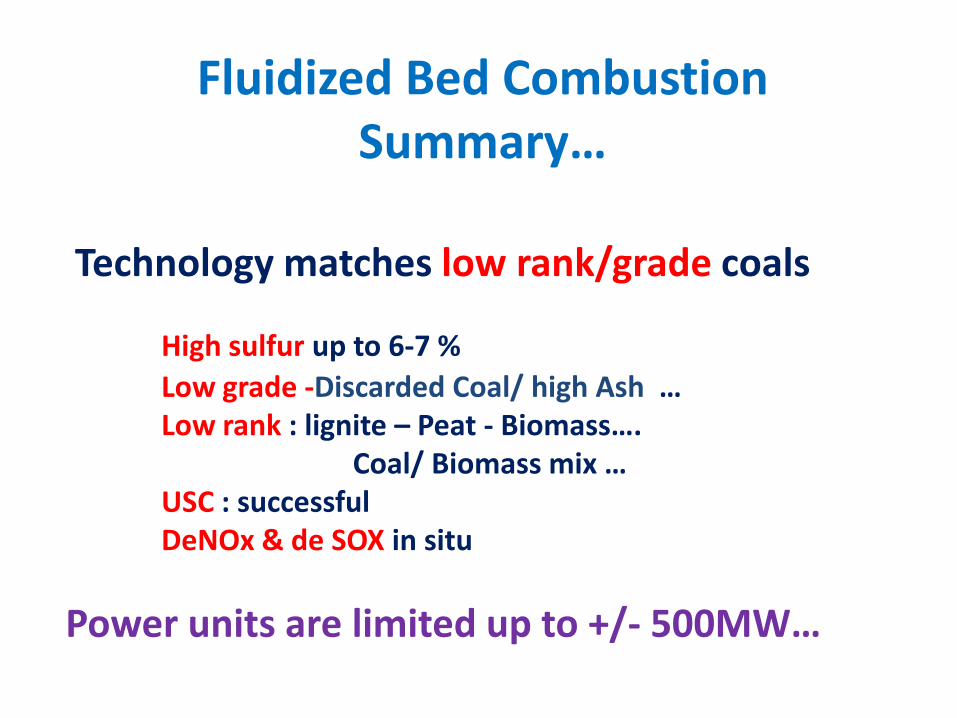
Fluidized Bed CombustionSummary…
Technology matches low rank/grade coals
High sulfur up to 6-7 %
Low grade -Discarded Coal/ high Ash … Low rank : lignite – Peat - Biomass….
Coal/ Biomass mix …USC : successfulDeNOx & de SOX in situ
Power units are limited up to +/- 500MW…

Integrated Coal gasification Combine Cycles IGCC
Process is based on following main steps:
-Coal is Gasified to produce a Synthetic gas (Syngas)CO + H2
- Pollutants SOX removed from the Syngas
- Gas turbine type generator to burn the Syngas

.SOx, NOx and particulate emissions much lower . 20% less CO2.
•IGCC plants use 20-40% less water . •higher efficiencies up to 42%•CO2 easyly captured from an IGCC plant .
A simplified flow diagram (courtesy Energy Northwest)
Air & Steam
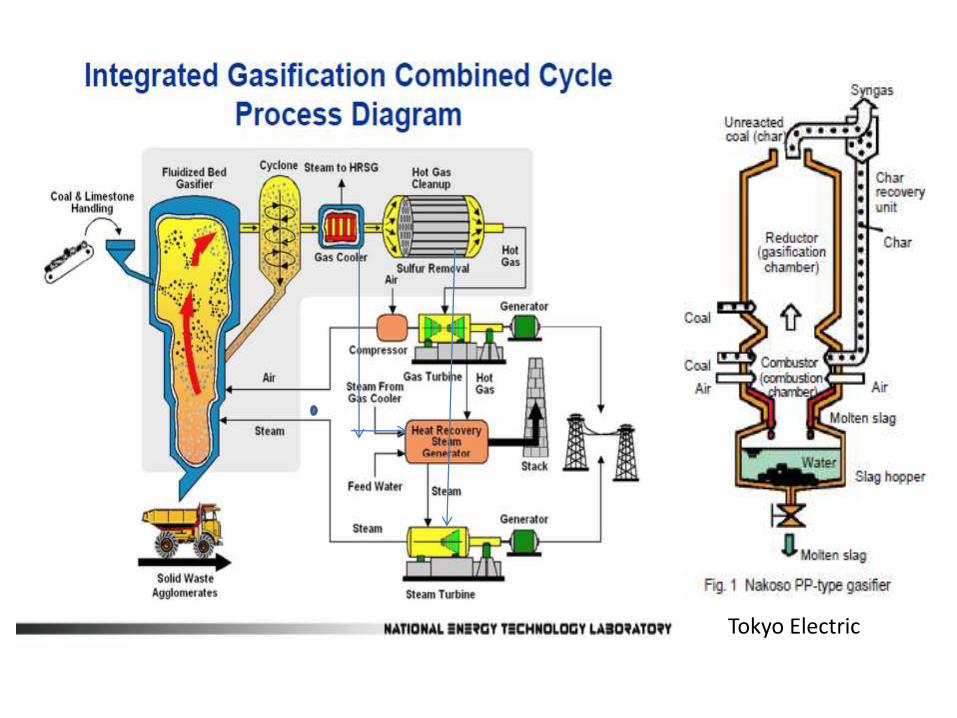
Tokyo Electric
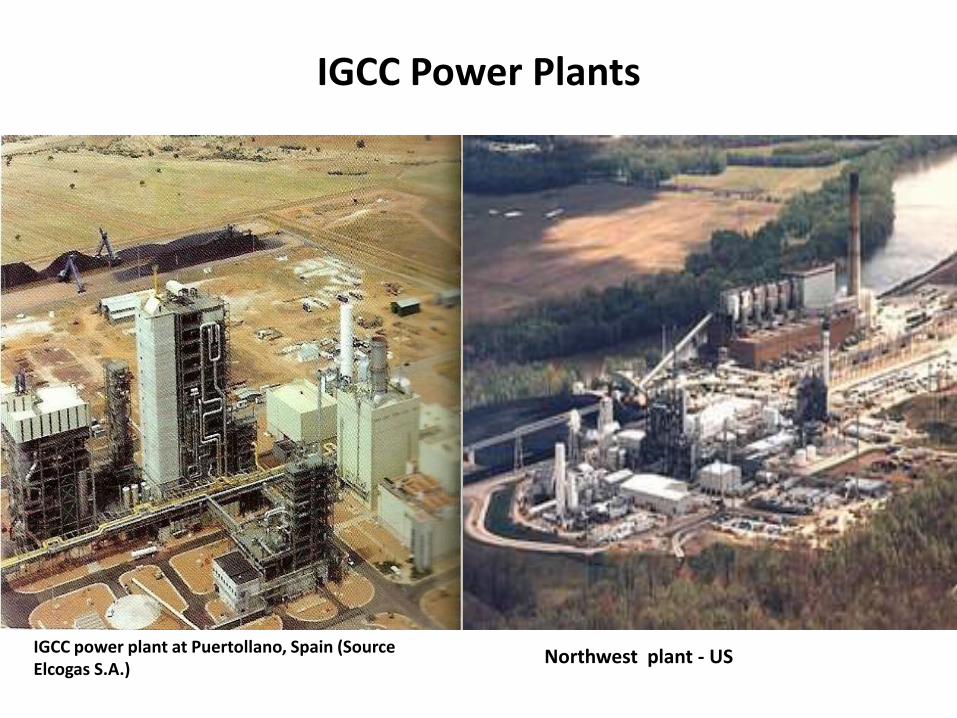
IGCC power plant at Puertollano, Spain (Source Elcogas S.A.)
IGCC Power Plants
Northwest plant - US
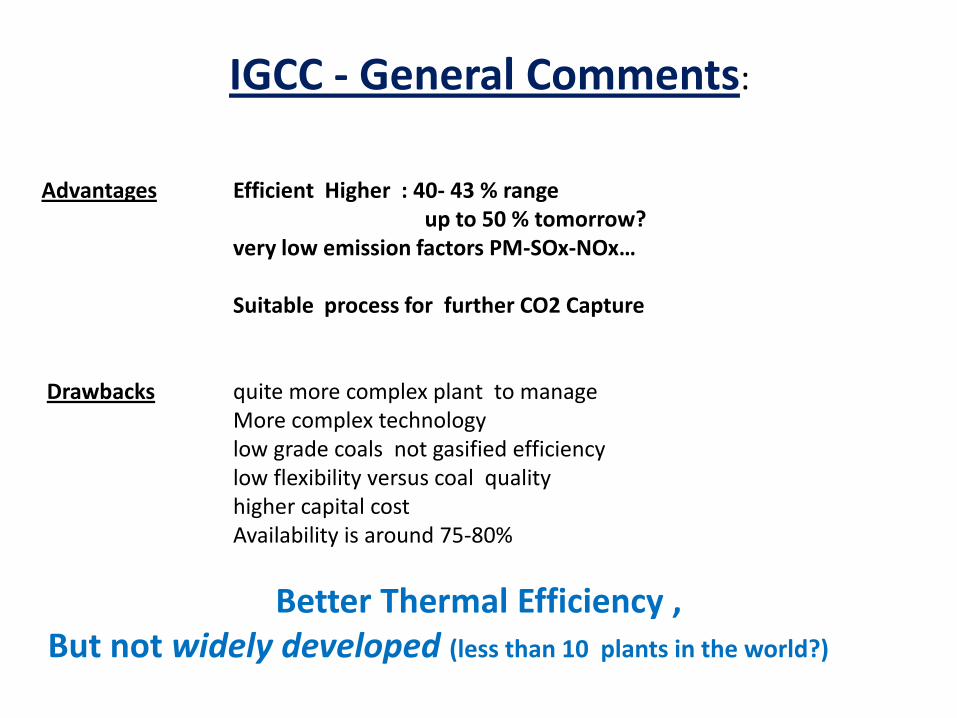
IGCC - General Comments:
Advantages Efficient Higher : 40- 43 % range up to 50 % tomorrow?
very low emission factors PM-SOx-NOx…
Suitable process for further CO2 Capture
Drawbacks quite more complex plant to manage More complex technology low grade coals not gasified efficiency low flexibility versus coal qualityhigher capital cost Availability is around 75-80%
Better Thermal Efficiency ,But not widely developed (less than 10 plants in the world?)
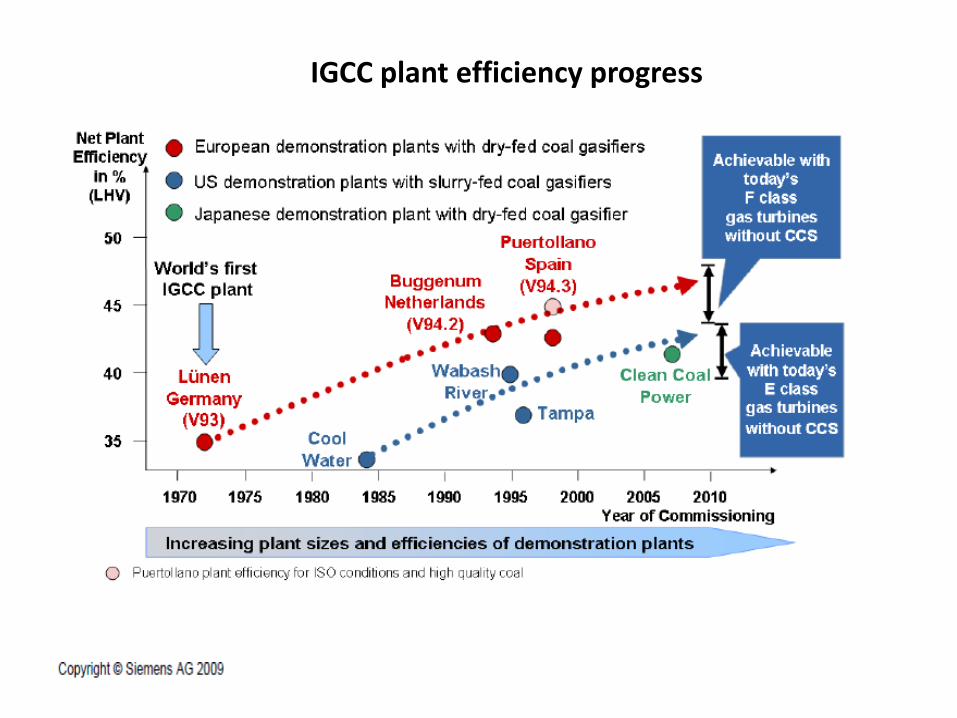
IGCC plant efficiency progress
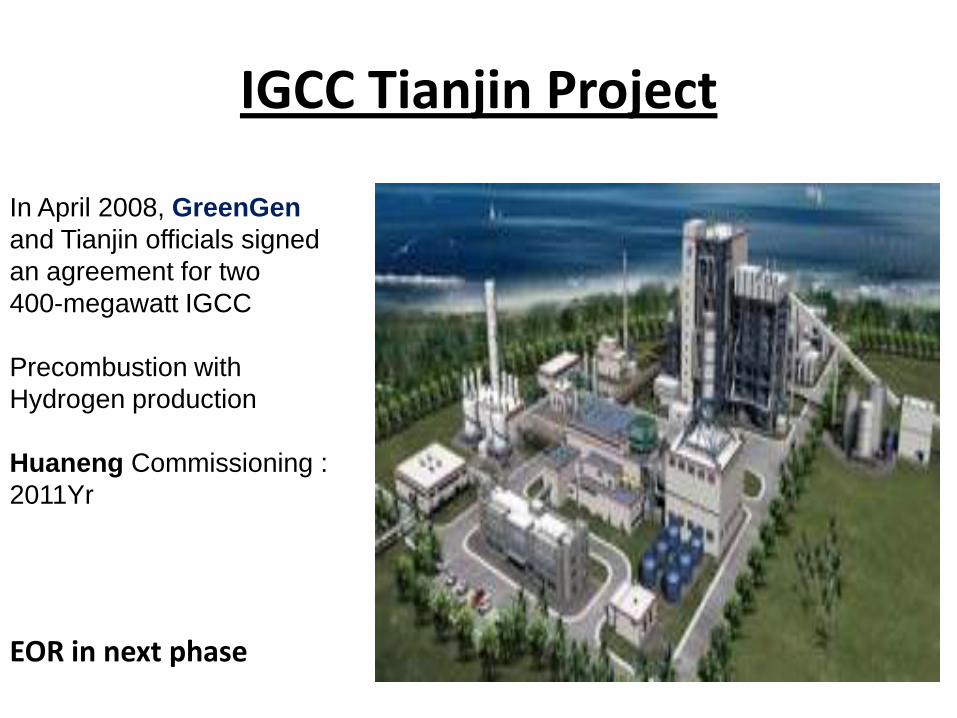
IGCC Tianjin Project
In April 2008, GreenGen
and Tianjin officials signed
an agreement for two
400-megawatt IGCC
Precombustion with
Hydrogen production
Huaneng Commissioning :
2011Yr
EOR in next phase

PC- CFBC- IGCC Efficiency & Issues State of Art 2011 – Subcritical - IEA report
PCC CFBC IGCC
Capacity Mwe 300-1200 200-500 250-300Emissions mg/NM3
PM-Dust 5-10 less 5 less 1
SO2 less 20 less 200* less 20
NOX 50-100 less 200* less 50
Availability % 90/93 + 90 + 80 +
Total Efficiency %Sub-C 38 39/40 42/43SC/USC 46 41/43
Fuel flexibility Middle High Low
CAPEX** USD/KW 800/2000 1500/2000 2000/2500
* Without FGD & deNOx units **Overnight costs-subcritical
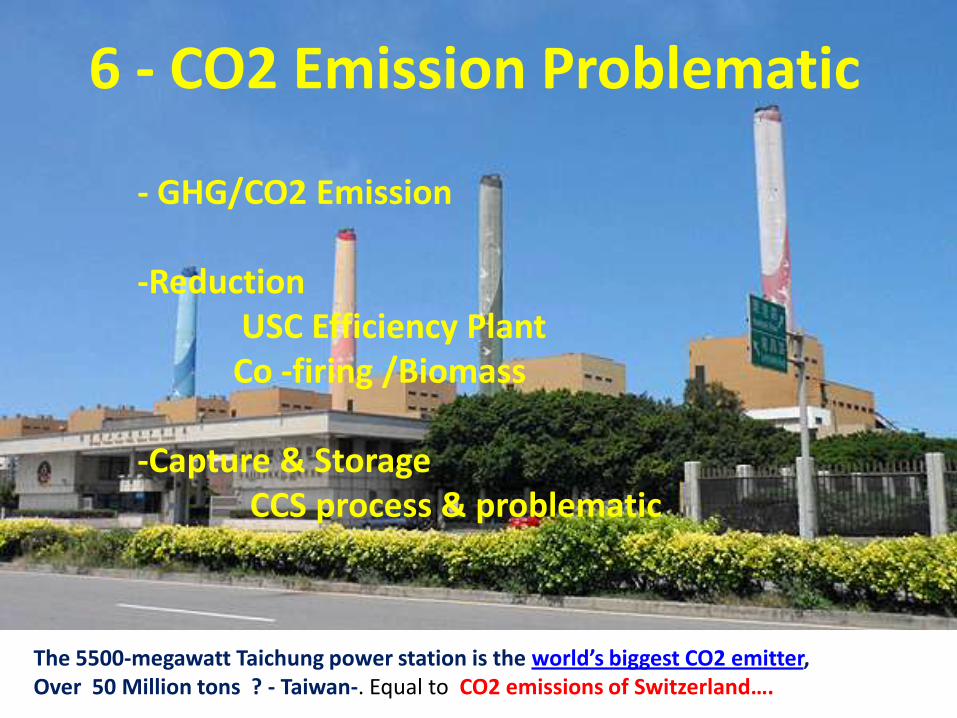
The 5500-megawatt Taichung power station is the world’s biggest CO2 emitter, Over 50 Million tons ? - Taiwan-. Equal to CO2 emissions of Switzerland….
6 - CO2 Emission Problematic
- GHG/CO2 Emission
-ReductionUSC Efficiency PlantCo -firing /Biomass
-Capture & Storage CCS process & problematic
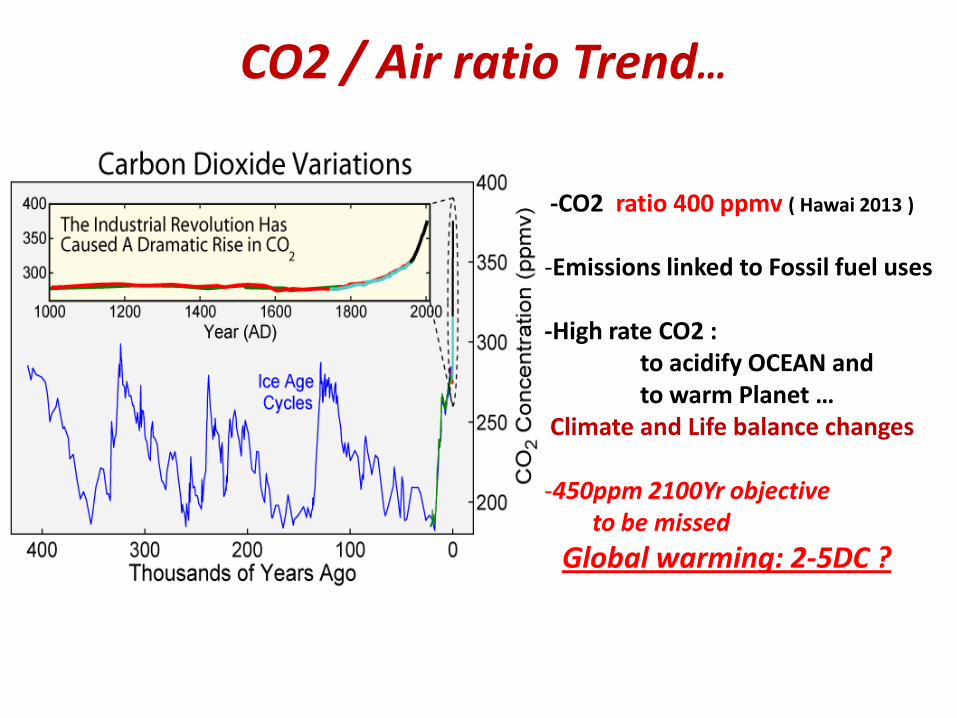
-CO2 ratio 400 ppmv ( Hawai 2013 )
-Emissions linked to Fossil fuel uses
-High rate CO2 :to acidify OCEAN and to warm Planet …
Climate and Life balance changes
-450ppm 2100Yr objectiveto be missed
Global warming: 2-5DC ?
CO2 / Air ratio Trend…

1 ton CO2 :
10 000 km urban trafficSmall car)
1 Return -1 passenger Paris-New York
9 Months heating fuel oil
CO2 Anthropogenic emissions
31.7 GT CO2 in 2012 Yr…
Sources : GIEC / ONU
1000 kWh e+/- 400kg Coal
Power Plant
- 30%Transport (Oil..)
- 45% Thermal PP Coal /Gas
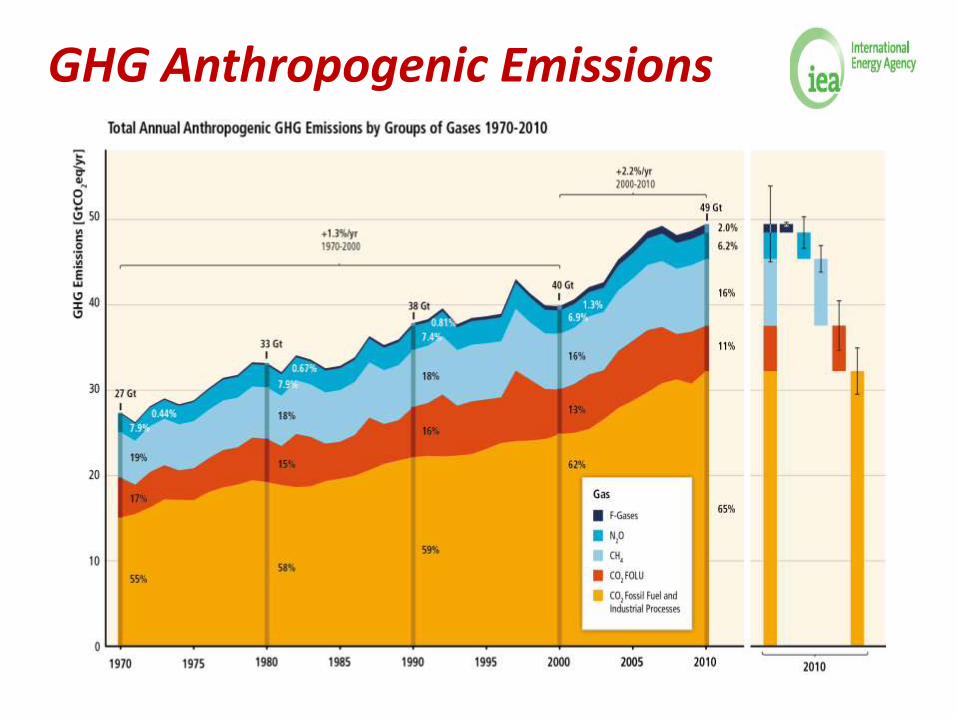
GHG Anthropogenic Emissions

COAL & CO2 Emissions…IEA report 2014
CO2/ Coal Power # 9.5Gt
Gas 20%
Oil 35%
Coal 44 %
CO2: 31.7 Gt 7 2012Yr
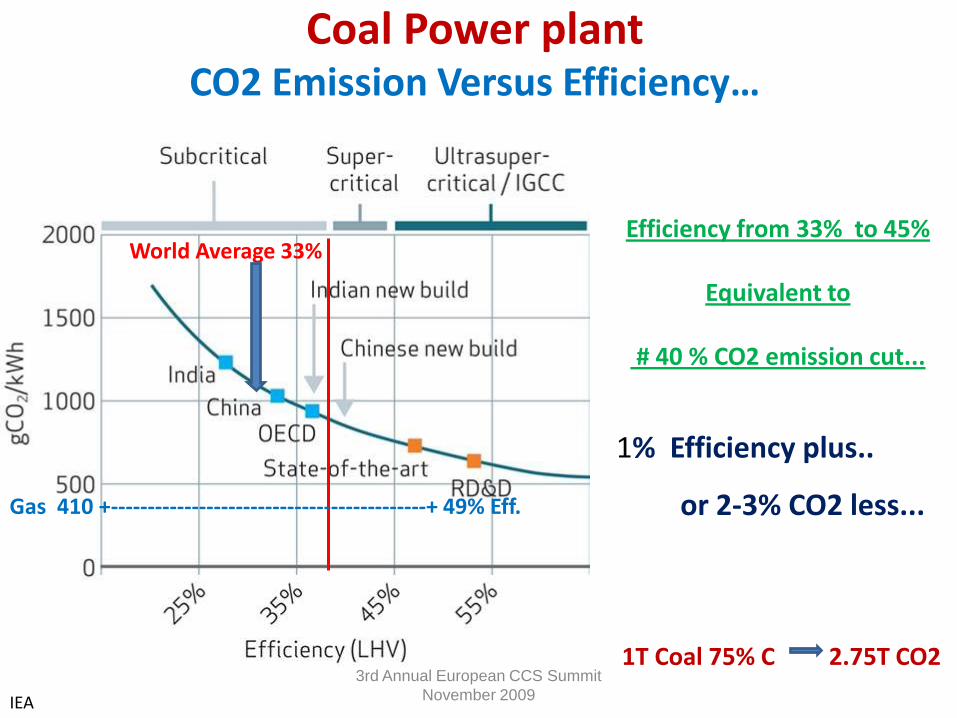
3rd Annual European CCS Summit
November 2009IEA
1% Efficiency plus..
or 2-3% CO2 less...
1T Coal 75% C 2.75T CO2
Coal Power plant CO2 Emission Versus Efficiency…
Efficiency from 33% to 45%
Equivalent to
# 40 % CO2 emission cut...
Gas 410 +-------------------------------------------+ 49% Eff.
World Average 33%
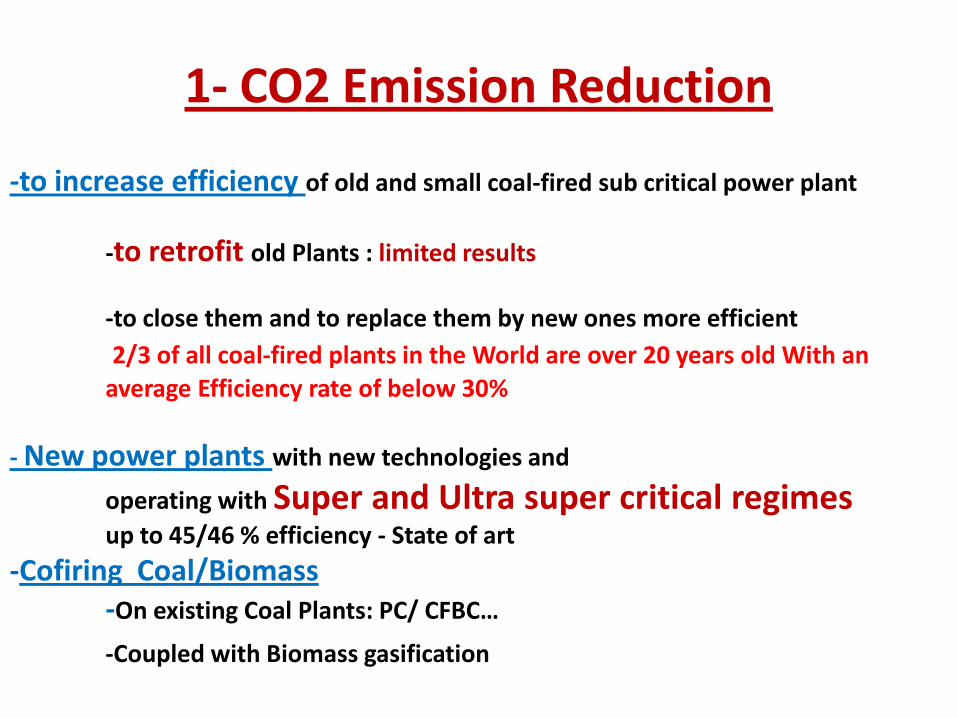
1- CO2 Emission Reduction
-to increase efficiency of old and small coal-fired sub critical power plant
-to retrofit old Plants : limited results
-to close them and to replace them by new ones more efficient
2/3 of all coal-fired plants in the World are over 20 years old With an
average Efficiency rate of below 30%
- New power plants with new technologies and
operating with Super and Ultra super critical regimes up to 45/46 % efficiency - State of art
-Cofiring Coal/Biomass-On existing Coal Plants: PC/ CFBC…
-Coupled with Biomass gasification

-Retrofitting Existing PPCheap Process but Limited Benefits…
Global Efficiency = Combustion *Thermodynamic*Electrical Efficiencies
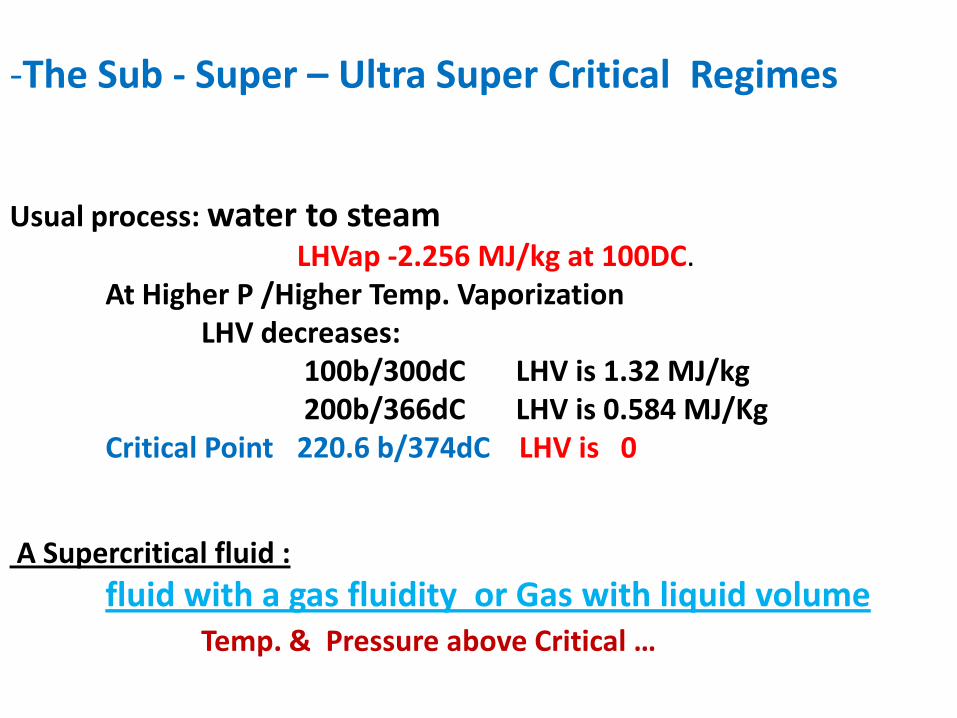
-The Sub - Super – Ultra Super Critical Regimes
Usual process: water to steamLHVap -2.256 MJ/kg at 100DC.
At Higher P /Higher Temp. Vaporization LHV decreases:
100b/300dC LHV is 1.32 MJ/kg200b/366dC LHV is 0.584 MJ/Kg
Critical Point 220.6 b/374dC LHV is 0
A Supercritical fluid :
fluid with a gas fluidity or Gas with liquid volumeTemp. & Pressure above Critical …
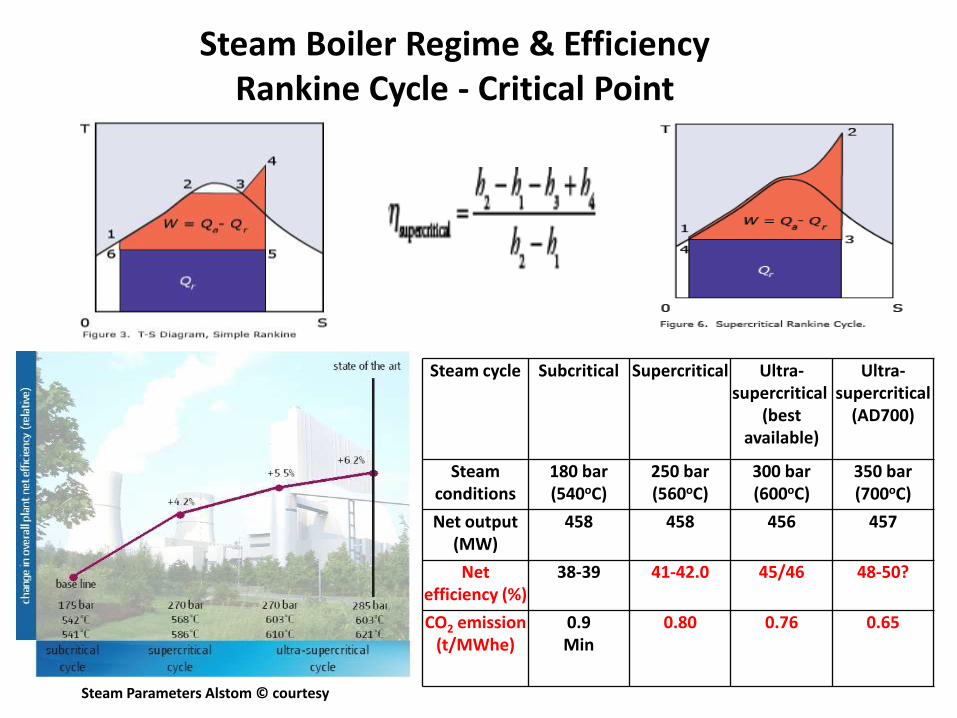
Steam Parameters Alstom © courtesy
Steam Boiler Regime & EfficiencyRankine Cycle - Critical Point
Steam cycle Subcritical Supercritical Ultra-supercritical
(best available)
Ultra-supercritical
(AD700)
Steam conditions
180 bar (540oC)
250 bar (560oC)
300 bar (600oC)
350 bar (700oC)
Net output (MW)
458 458 456 457
Net efficiency (%)
38-39 41-42.0 45/46 48-50?
CO2 emission (t/MWhe)
0.9Min
0.80 0.76 0.65
Siemens Doc.
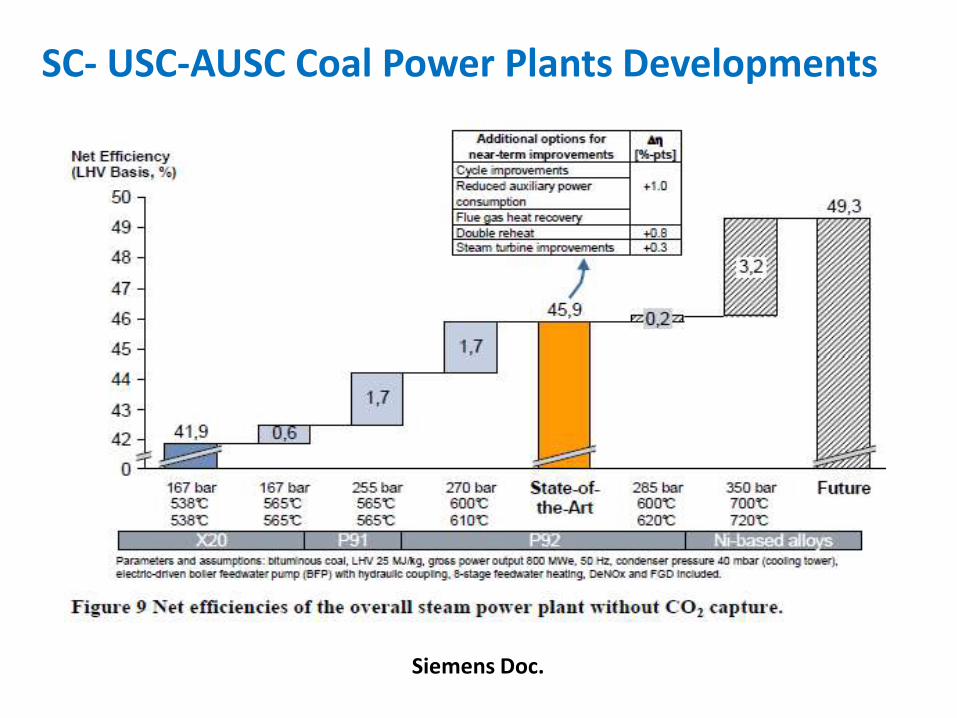
SC- USC-AUSC Coal Power Plants Developments
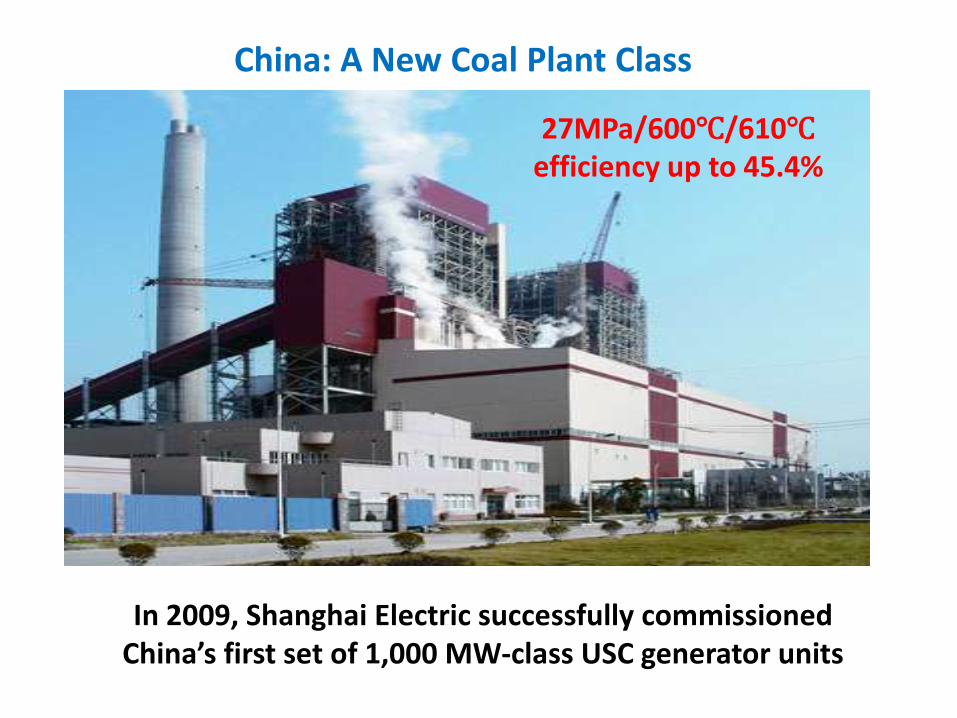
In 2009, Shanghai Electric successfully commissioned China’s first set of 1,000 MW-class USC generator units
27MPa/600℃/610℃efficiency up to 45.4%
China: A New Coal Plant Class
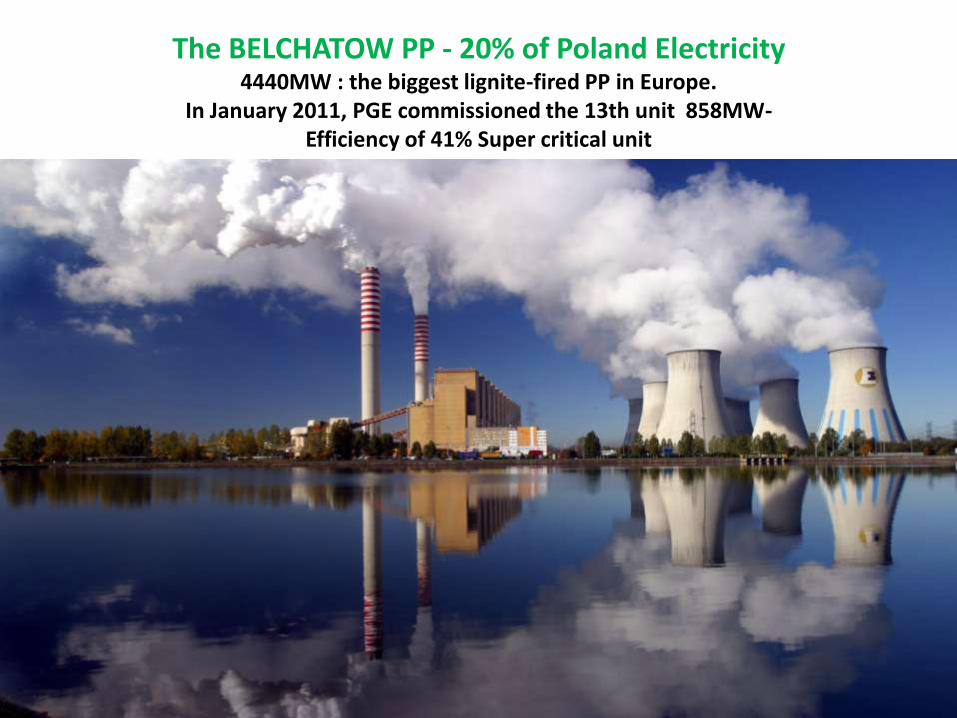
The BELCHATOW PP - 20% of Poland Electricity 4440MW : the biggest lignite-fired PP in Europe.
In January 2011, PGE commissioned the 13th unit 858MW-Efficiency of 41% Super critical unit

Germany new PP
2012- EnBW Karlsruhe
912 Mwe Capacity
USC regime : 600°C -275Bar Efficiency 46%
CO2 Emission #740 g/kWh.

South Africa: Mega New Coal Plant projectsMedupi. 6 by 800MW units -dry cool-commissioning from 2015Y
Kusile: 6 by 8000MW units – commissioning 2016/2017
Eskom Medupi picture

SC & USC Plant Construction
100% coal
10% biomass
20% biomass
100% nat.gas
300
400
500
600
700
800
900
1000
1100
1200
25 30 35 40 45 50 55 60 Net efficiency (%)
CO
2 e
mis
sio
n (
g/k
Wh
)
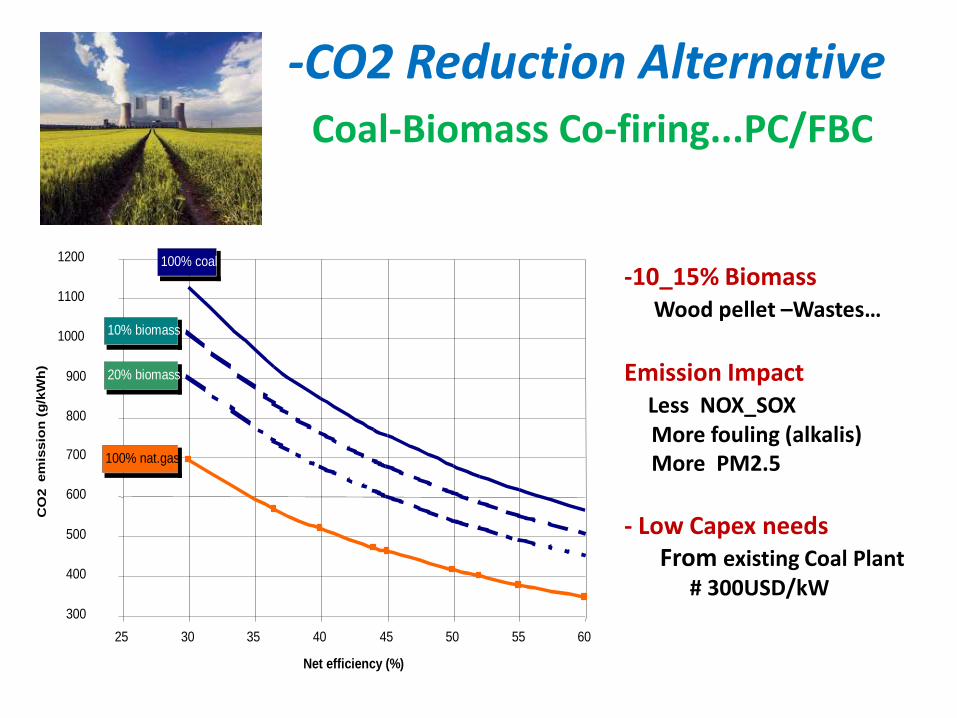
-CO2 Reduction AlternativeCoal-Biomass Co-firing...PC/FBC
-10_15% BiomassWood pellet –Wastes…
Emission Impact Less NOX_SOX More fouling (alkalis) More PM2.5
- Low Capex needsFrom existing Coal Plant
# 300USD/kW

PC 4000 MW COAL…
10_15% biomassLess NOX_SOX - More fouling (alkalis) and PM2.5
Co-Firing a Mature Process…
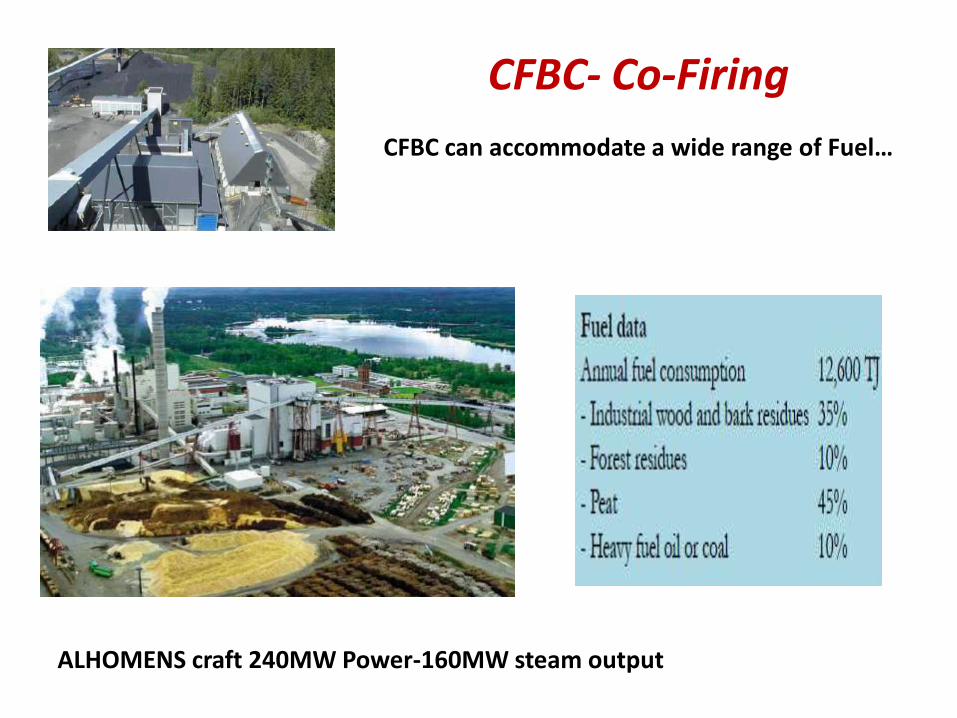
CFBC- Co-Firing
CFBC can accommodate a wide range of Fuel…
ALHOMENS craft 240MW Power-160MW steam output

2-CO2 Capture & Storage: CCS
Capture technologies to capture a concentrated stream of CO2
finally transported to a suitable storage site.
CO2 in exhaust gas:15-17%
Process Industrially developed -Post combustion-Oxy combustion-Pre combustion
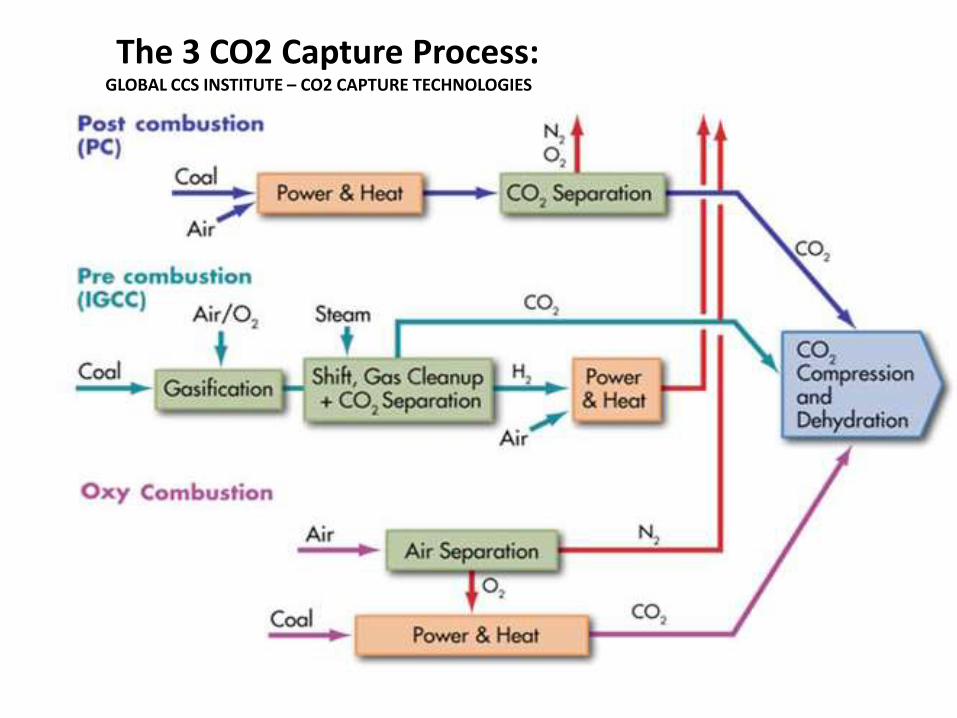
The 3 CO2 Capture Process: GLOBAL CCS INSTITUTE – CO2 CAPTURE TECHNOLOGIES
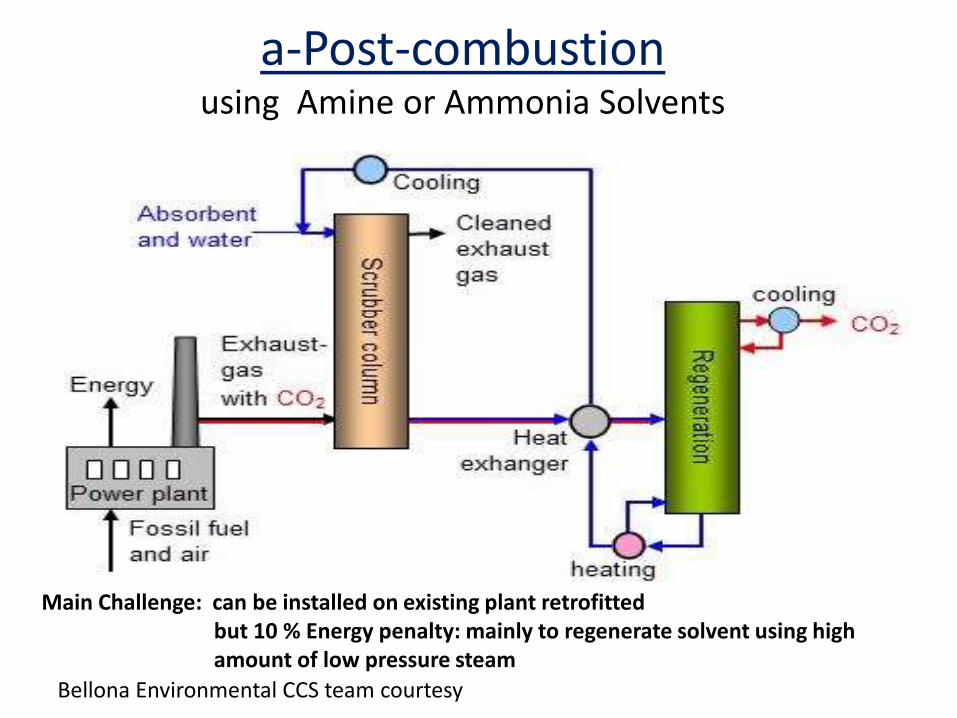
a-Post-combustionusing Amine or Ammonia Solvents
Main Challenge: can be installed on existing plant retrofitted but 10 % Energy penalty: mainly to regenerate solvent using high amount of low pressure steam
Bellona Environmental CCS team courtesy

b-Oxyfuel combustion Flue gas: only water vapor and CO2
Water is condensed by cooling down Pure CO2 gas remains
. Pure oxygen is expensive to produce -The most common method is to separate oxygen from air by cryogenic distillation. This requires large amounts of energy
The combustion of fossil fuels and pure oxygen creates high material stress, hence the development of new materials is a prerequisite for deployment of this technology or alternative is to recycle partly flue gas to cool combustion level …
From Bellona Environmental CCS team courtesy
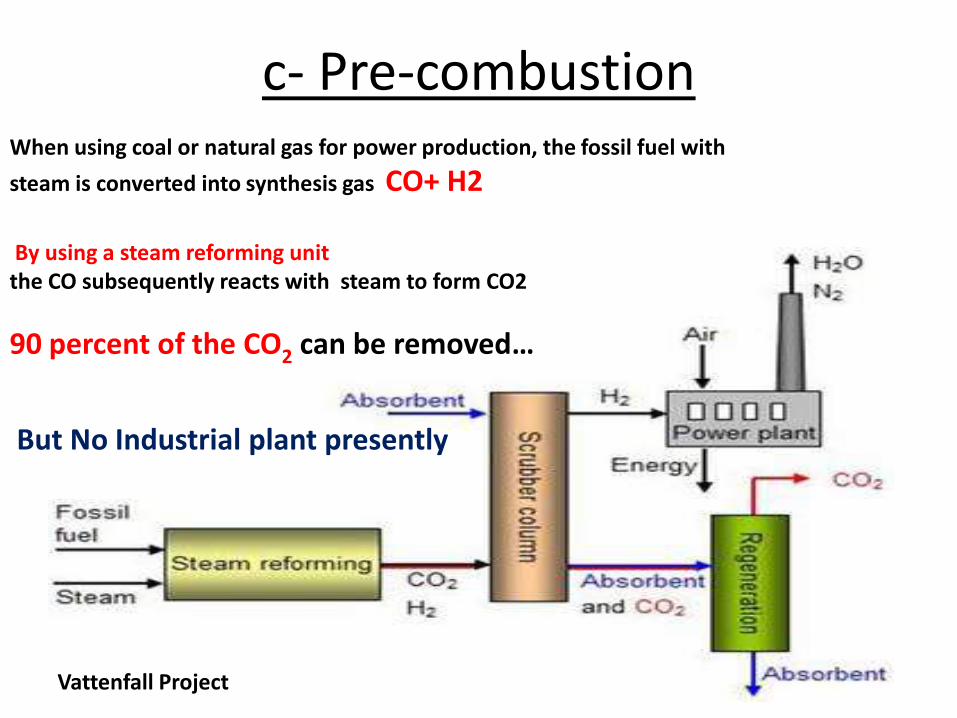
c- Pre-combustionWhen using coal or natural gas for power production, the fossil fuel with
steam is converted into synthesis gas CO+ H2
By using a steam reforming unit the CO subsequently reacts with steam to form CO2
90 percent of the CO2 can be removed…
But No Industrial plant presently
Vattenfall Project
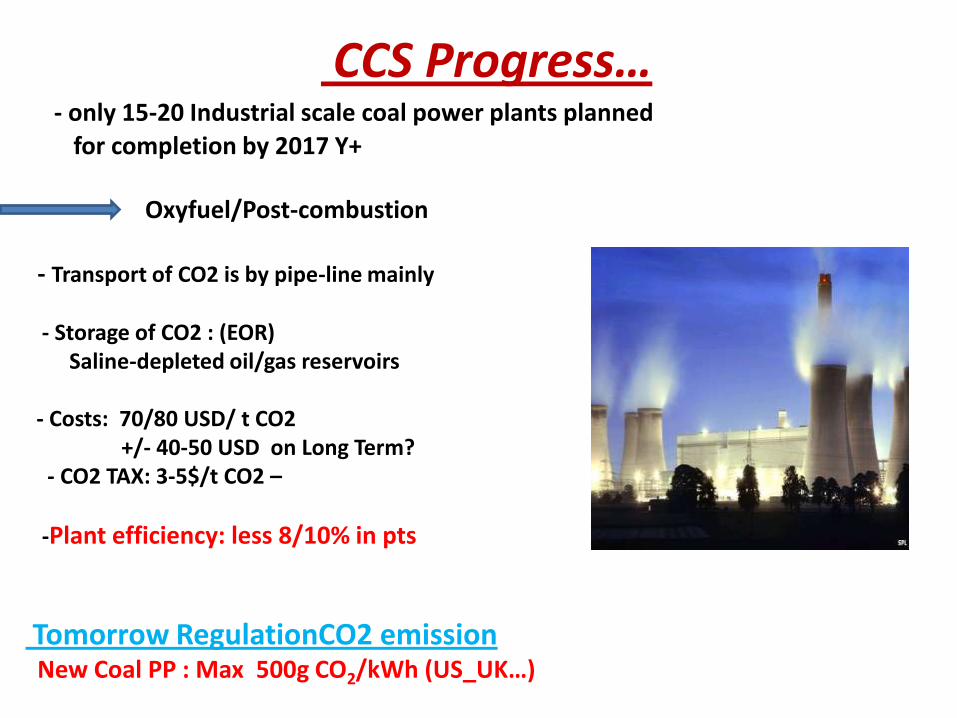
CCS Progress…- only 15-20 Industrial scale coal power plants planned
for completion by 2017 Y+
Oxyfuel/Post-combustion
- Transport of CO2 is by pipe-line mainly
- Storage of CO2 : (EOR)Saline-depleted oil/gas reservoirs
- Costs: 70/80 USD/ t CO2+/- 40-50 USD on Long Term?
- CO2 TAX: 3-5$/t CO2 –
-Plant efficiency: less 8/10% in pts
Tomorrow RegulationCO2 emissionNew Coal PP : Max 500g CO2/kWh (US_UK…)
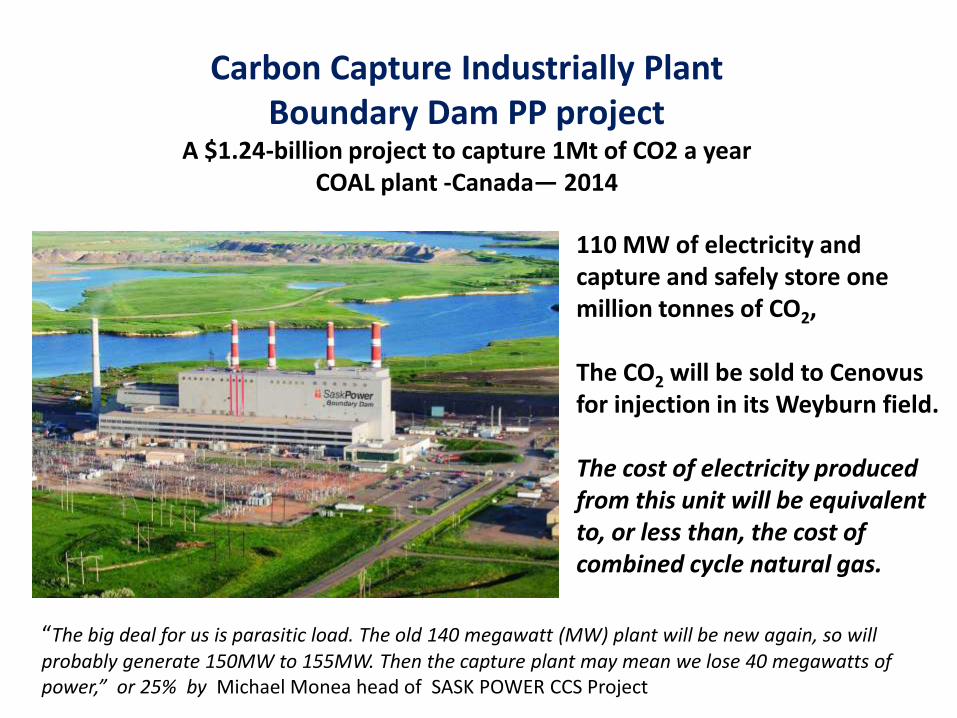
Carbon Capture Industrially PlantBoundary Dam PP project
A $1.24-billion project to capture 1Mt of CO2 a year COAL plant -Canada— 2014
110 MW of electricity and capture and safely store one million tonnes of CO2,
The CO2 will be sold to Cenovusfor injection in its Weyburn field.
The cost of electricity produced from this unit will be equivalent to, or less than, the cost of combined cycle natural gas.
“The big deal for us is parasitic load. The old 140 megawatt (MW) plant will be new again, so will probably generate 150MW to 155MW. Then the capture plant may mean we lose 40 megawatts of power,” or 25% by Michael Monea head of SASK POWER CCS Project
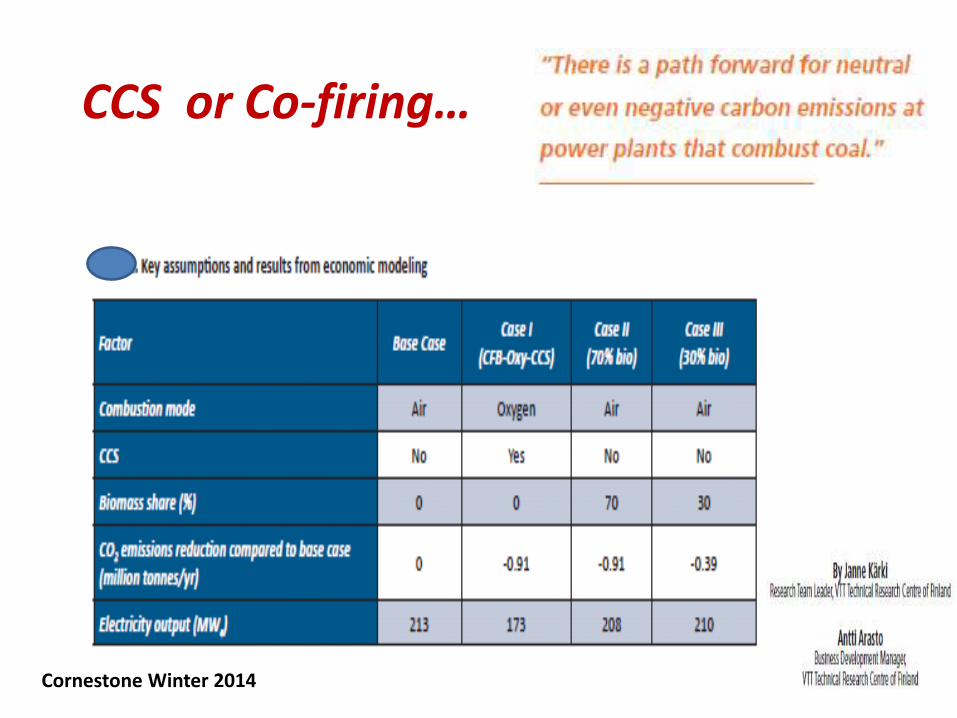
CCS or Co-firing…
Cornestone Winter 2014
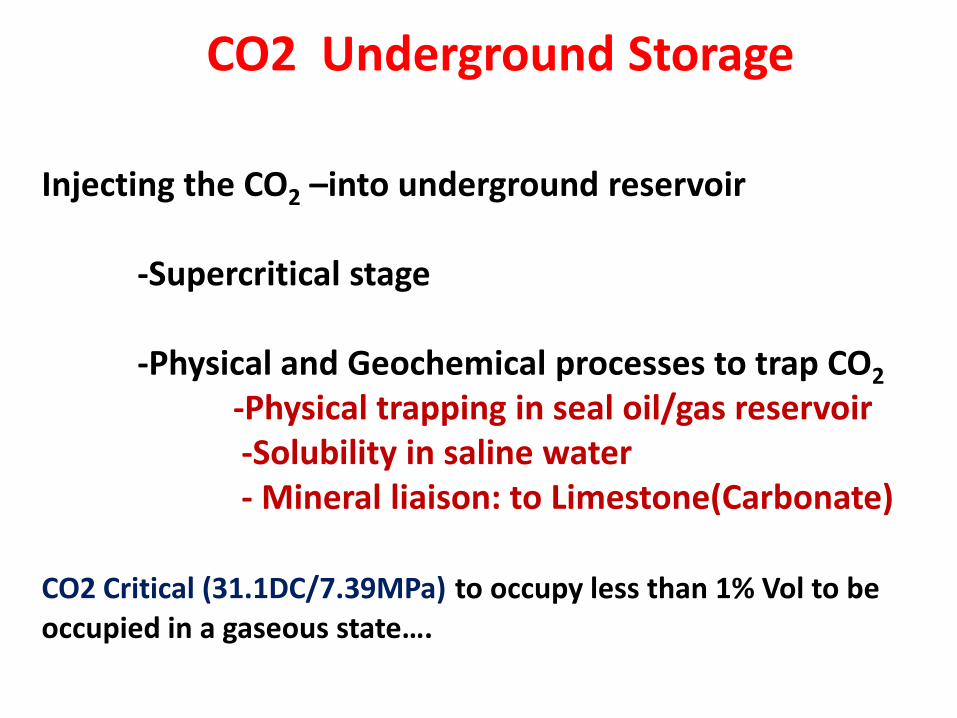
CO2 Underground Storage
Injecting the CO2 –into underground reservoir
-Supercritical stage
-Physical and Geochemical processes to trap CO2
-Physical trapping in seal oil/gas reservoir -Solubility in saline water- Mineral liaison: to Limestone(Carbonate)
CO2 Critical (31.1DC/7.39MPa) to occupy less than 1% Vol to be occupied in a gaseous state….
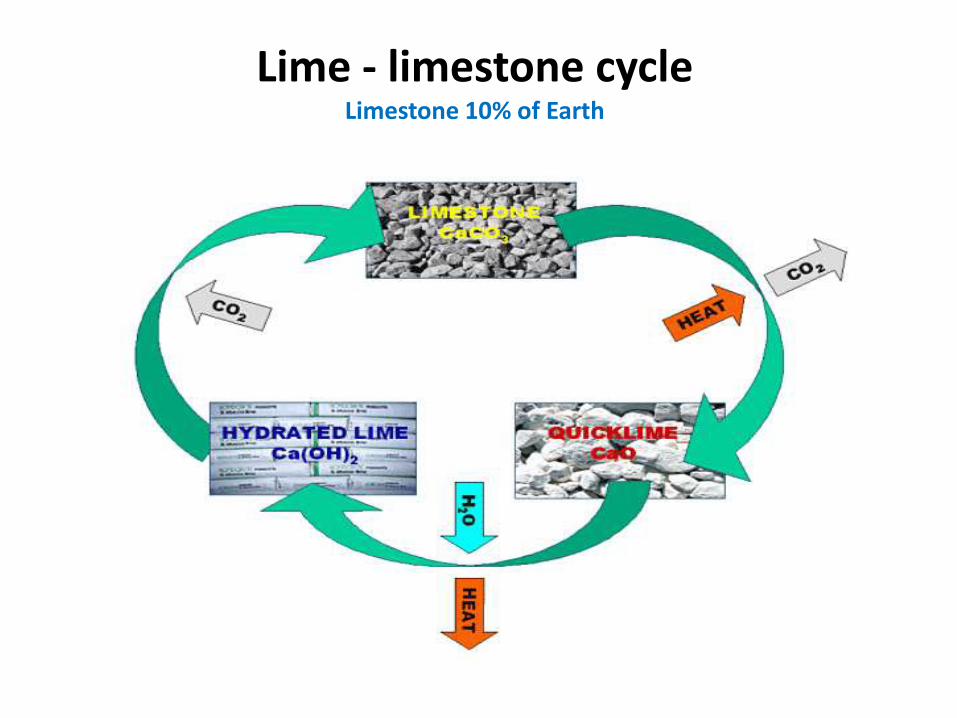
Lime - limestone cycleLimestone 10% of Earth

Statoil North Sea1MTCO2/YR
CO2 Storage
CCUS: to assist oil and gas fields /CO2 Commercial Value
CCS Oil/Gas Reservoir- deep saline formations /unminable coal seams.

Enhance Oil Recovery /CCUS… CO2 dissolves in Oil –decreasing Oil Viscosity
to enhance Oil Recovery-(already developed within oil Industry )

Successful Total’s oxyfuel
combustion CCS pilot project
2015 Confirm..
TOTAL Project CO2 Storage- since 2010Integrated CO2 Capture and Storage Project in a depleted Gas field
Gas Lacq basin in Southwestern FranceGas steam plant - Oxyfuel combustion unit-30MW Capturing, pressurizing, transporting 30 km via pipeline and injecting the CO2 into the depleted gas reservoirs of the Lacq area 4,500 meters underground.
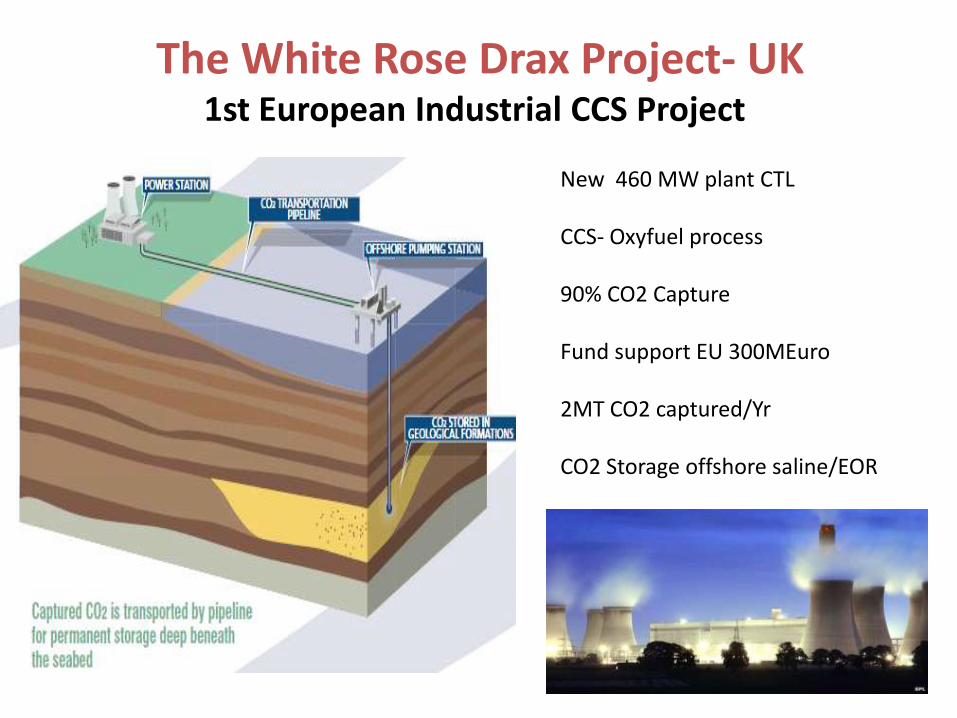
New 460 MW plant CTL
CCS- Oxyfuel process
90% CO2 Capture
Fund support EU 300MEuro
2MT CO2 captured/Yr
CO2 Storage offshore saline/EOR
The White Rose Drax Project- UK 1st European Industrial CCS Project

Oxy fuel Capture project- 2Mt/Yr capacity
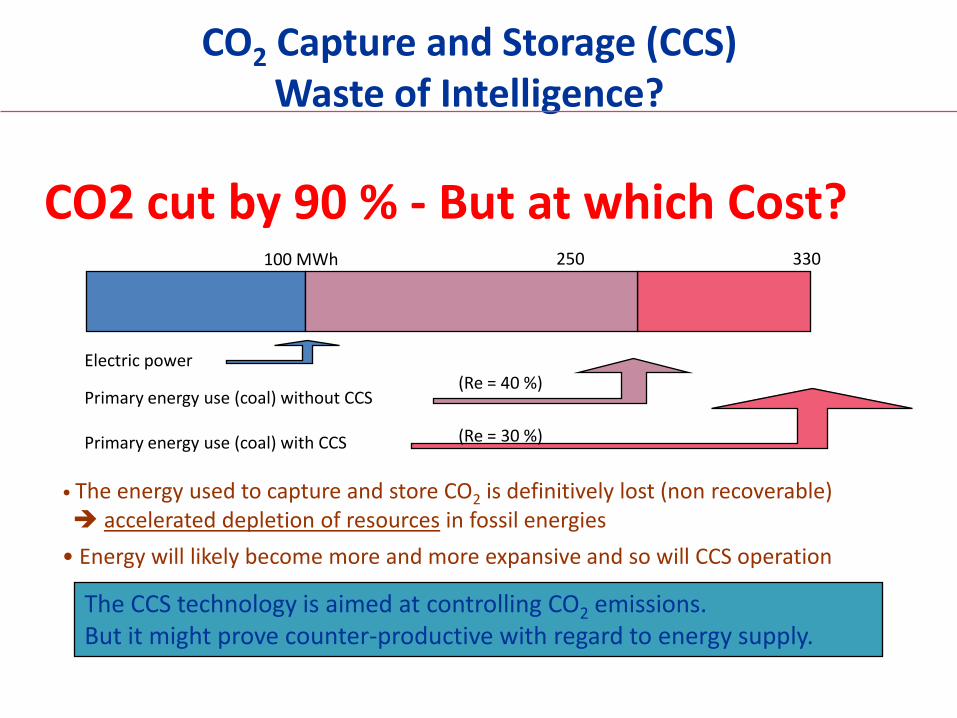
CO2 Capture and Storage (CCS) Waste of Intelligence?
CO2 cut by 90 % - But at which Cost?
• The energy used to capture and store CO2 is definitively lost (non recoverable) accelerated depletion of resources in fossil energies
• Energy will likely become more and more expansive and so will CCS operation
The CCS technology is aimed at controlling CO2 emissions.But it might prove counter-productive with regard to energy supply.
100 MWh 250 330
Electric power
Primary energy use (coal) without CCS
Primary energy use (coal) with CCS
(Re = 40 %)
(Re = 30 %)

RD: tomorrow new process for CO2 Capture
-Chemical Looping Combustion-Dry Membrane Osmosis
-Fuel cells…
Instituto de Carboquímica:
Concept based on the transfer of oxygen from the combustion air to the fuel by means of an oxygen carrier in the form of a metal oxide, CH4 ( C, CO, H2) + MeO →
CO2 + H2O (CO2,H2O)+Me
The exit gas mainly CO2 and H2O.
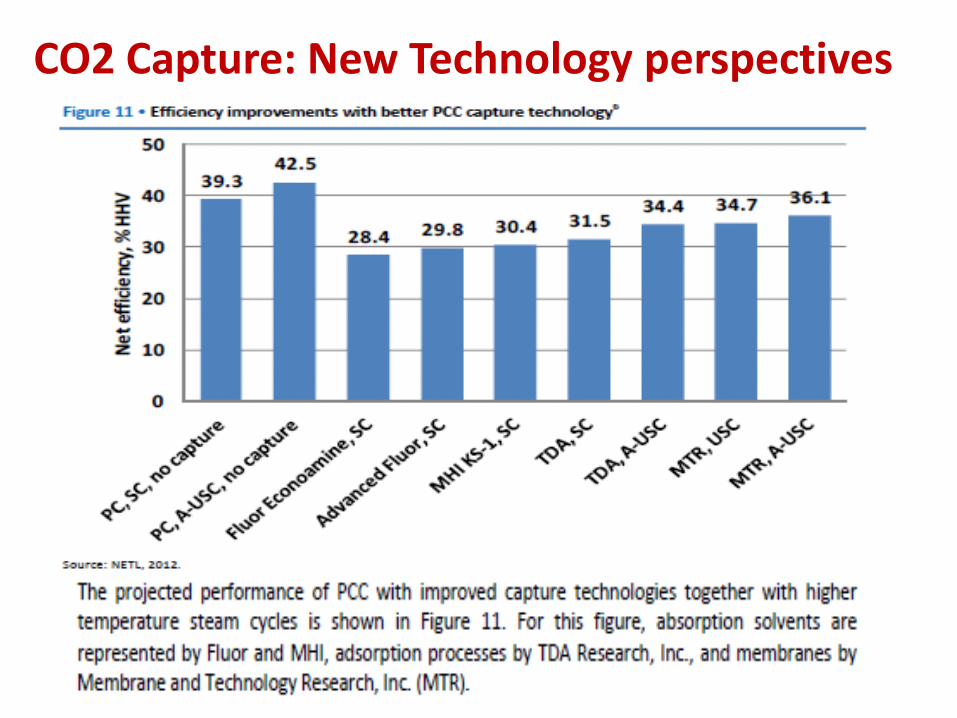
CO2 Capture: New Technology perspectives
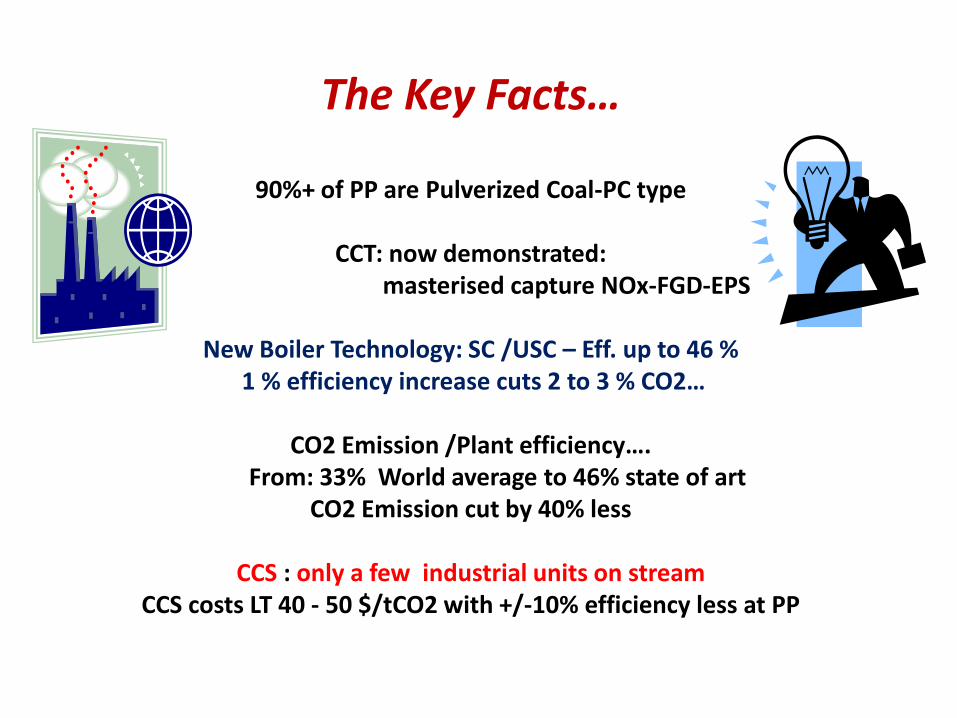
The Key Facts…
90%+ of PP are Pulverized Coal-PC type
CCT: now demonstrated:masterised capture NOx-FGD-EPS
New Boiler Technology: SC /USC – Eff. up to 46 %1 % efficiency increase cuts 2 to 3 % CO2…
CO2 Emission /Plant efficiency….From: 33% World average to 46% state of art
CO2 Emission cut by 40% less
CCS : only a few industrial units on stream CCS costs LT 40 - 50 $/tCO2 with +/-10% efficiency less at PP

7- 21st Century COAL & Power
Perspective &
Key Cases …
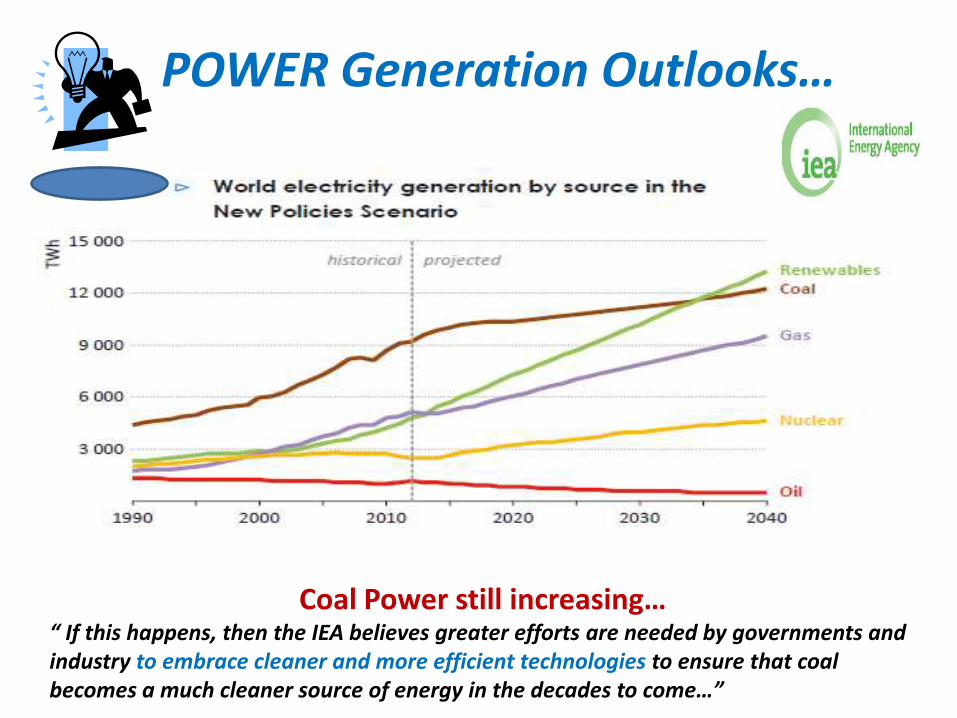
POWER Generation Outlooks…
Coal Power still increasing…“ If this happens, then the IEA believes greater efforts are needed by governments and industry to embrace cleaner and more efficient technologies to ensure that coal becomes a much cleaner source of energy in the decades to come…”
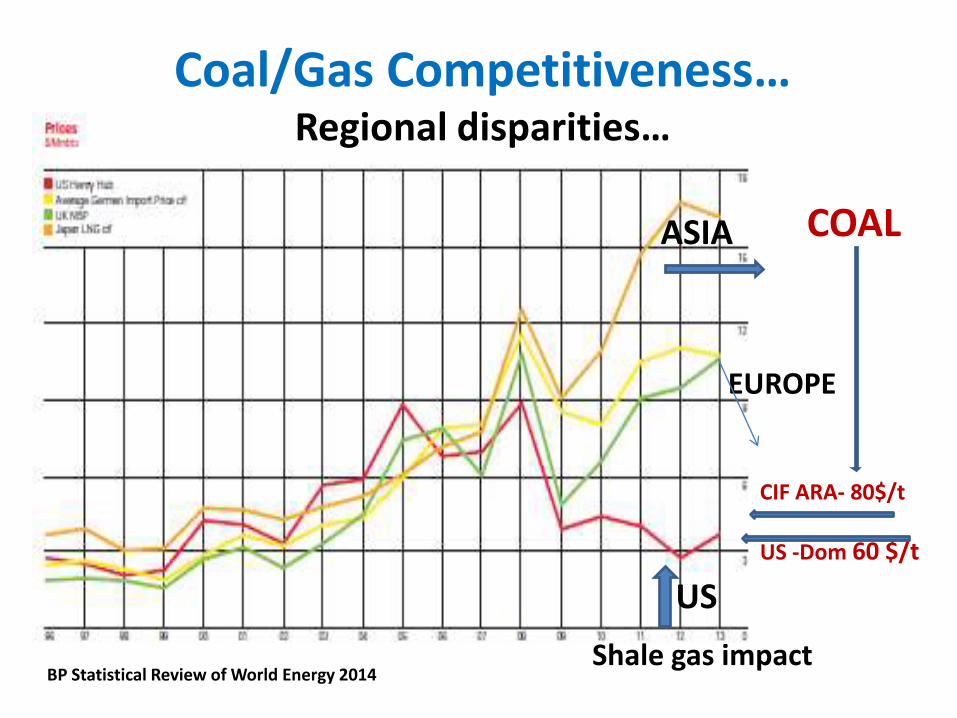
Coal/Gas Competitiveness…Regional disparities…
BP Statistical Review of World Energy 2014
ASIA
US
EUROPE
Shale gas impact
COAL
CIF ARA- 80$/t
US -Dom 60 $/t
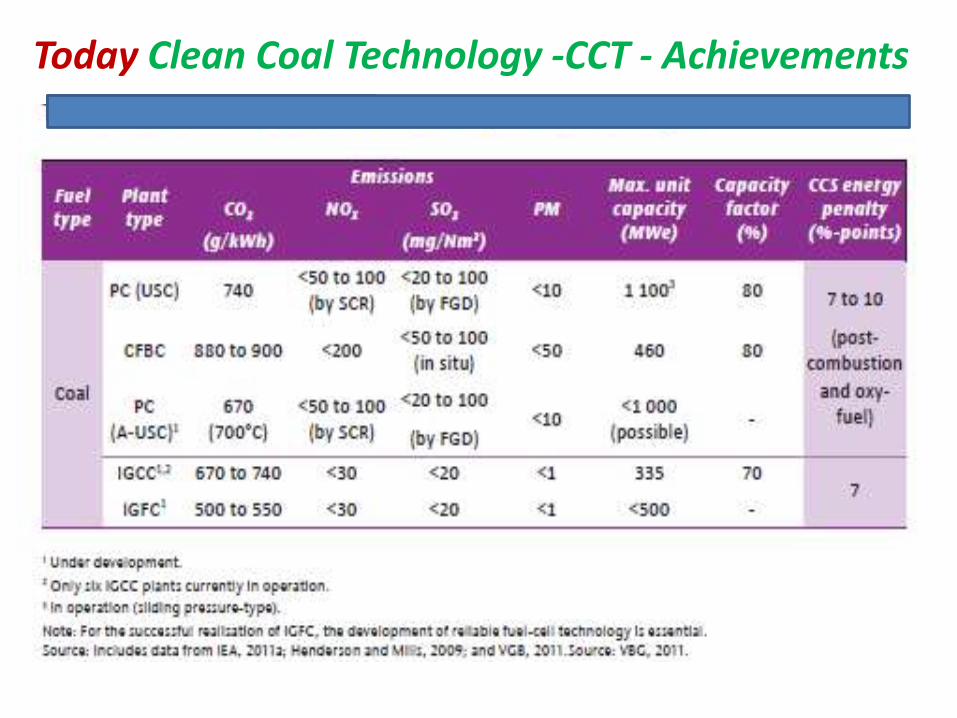
Today Clean Coal Technology -CCT - Achievements
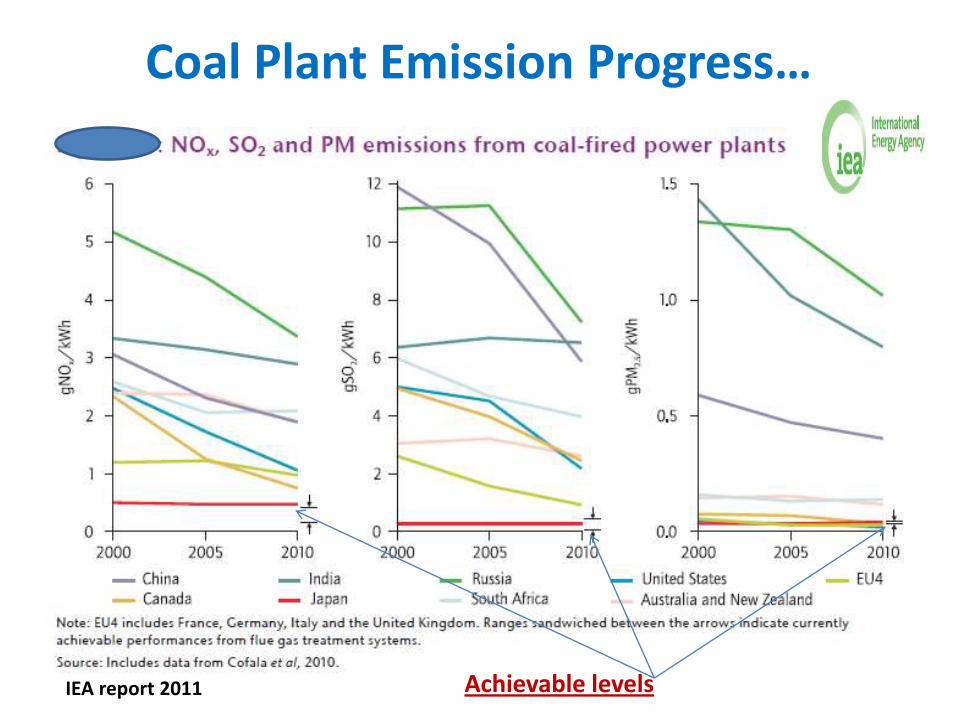
Coal Plant Emission Progress…
IEA report 2011 Achievable levels

Tomorrow Gas Cleaning and New Advanced USC Plants
5 Industrial Plants –under test – to 2020Yr-(EU-USA-India-China-Japan)
Efficiency: +50 % LHV/ kWhe
AUSC 35 MPa/700DC+
650 gCO2/kWh
Effluent achievements
PM less 1mg/nM3
SO2 less 10mg/nM3
NOX less 10 mg/nM3
Hg 99% removal
IEA clean road map forecast…
The AD 700- Ultra Supercritical EU Coal Project
EU ELSAM-project Commissioning 2020?
Steam (700/720°C, 375 bar). Efficiency 50 % ++

High-Efficiency, Low-Emissions –HELE-Coal-Fired Power GenerationIEA report Dec 2012 -Cornestone Spring 2015
Super- Ultra super critical… Plant Construction trendIEA- Technology Roadmap
South Korea example…

CO2 Reduction Trend…

CO2 Capture and Storage (CCS) Waste of Intelligence?
CO2 cut by 90 % - But at which Cost?
• The energy used to capture and store CO2 is definitively lost (non recoverable) accelerated depletion of resources in fossil energies
• Energy will likely become more and more expansive and so will CCS operation
The CCS technology is aimed at controlling CO2 emissions.But it might prove counter-productive with regard to energy supply.
100 MWh 250 330
Electric power
Primary energy use (coal) without CCS
Primary energy use (coal) with CCS
(Re = 40 %)
(Re = 30 %)
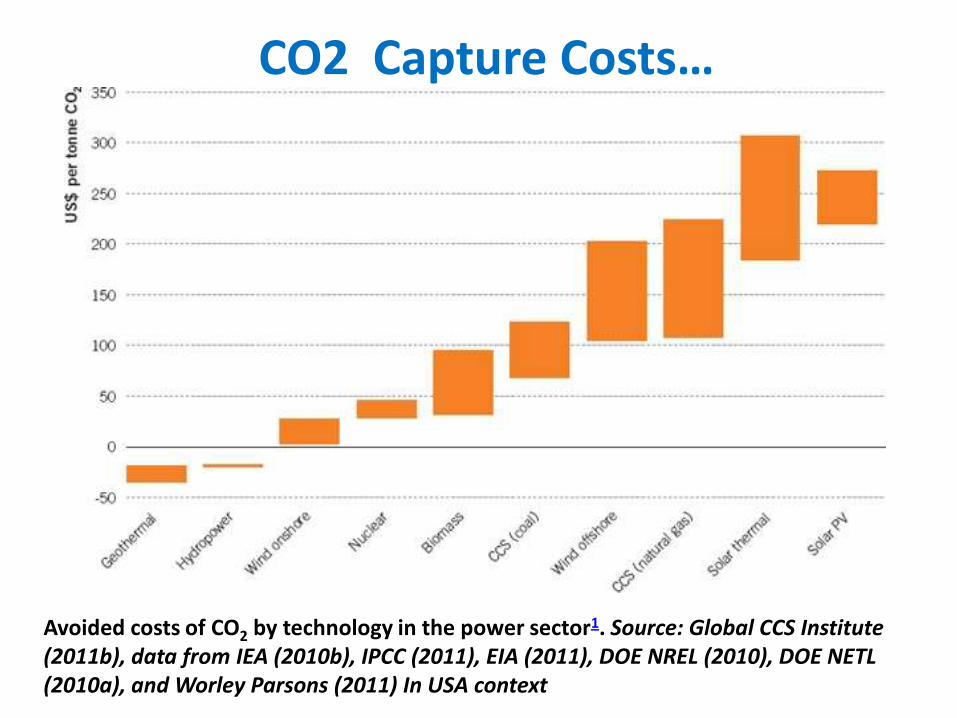
Avoided costs of CO2 by technology in the power sector1. Source: Global CCS Institute (2011b), data from IEA (2010b), IPCC (2011), EIA (2011), DOE NREL (2010), DOE NETL (2010a), and Worley Parsons (2011) In USA context
CO2 Capture Costs…
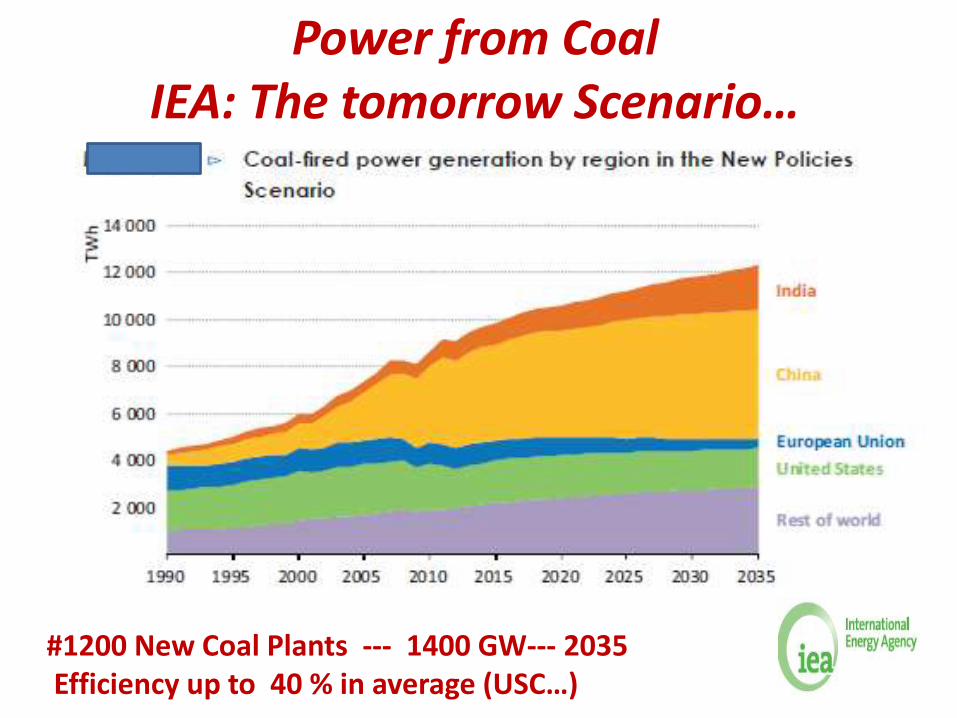
Power from Coal IEA: The tomorrow Scenario…
#1200 New Coal Plants --- 1400 GW--- 2035Efficiency up to 40 % in average (USC…)

Coal Case & Perspective…
India -China- USA – EU/Germany…
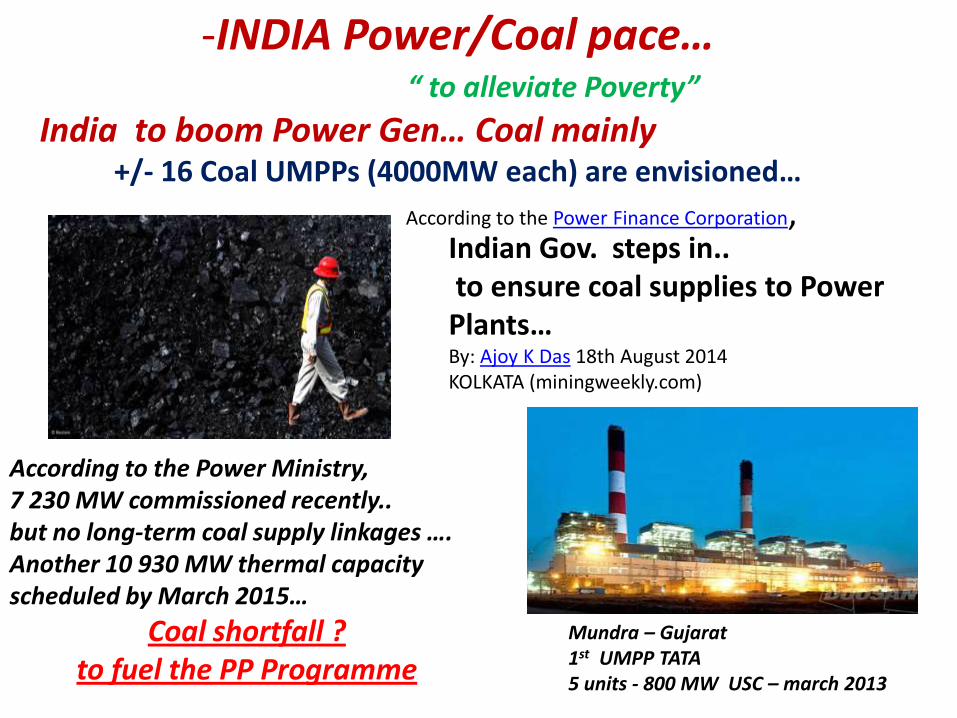
Indian Gov. steps in..to ensure coal supplies to Power Plants…By: Ajoy K Das 18th August 2014 KOLKATA (miningweekly.com)
According to the Power Ministry, 7 230 MW commissioned recently..but no long-term coal supply linkages …. Another 10 930 MW thermal capacity scheduled by March 2015…
Coal shortfall ? to fuel the PP Programme
Mundra – Gujarat 1st UMPP TATA5 units - 800 MW USC – march 2013
-INDIA Power/Coal pace… “ to alleviate Poverty”
India to boom Power Gen… Coal mainly +/- 16 Coal UMPPs (4000MW each) are envisioned…
According to the Power Finance Corporation,
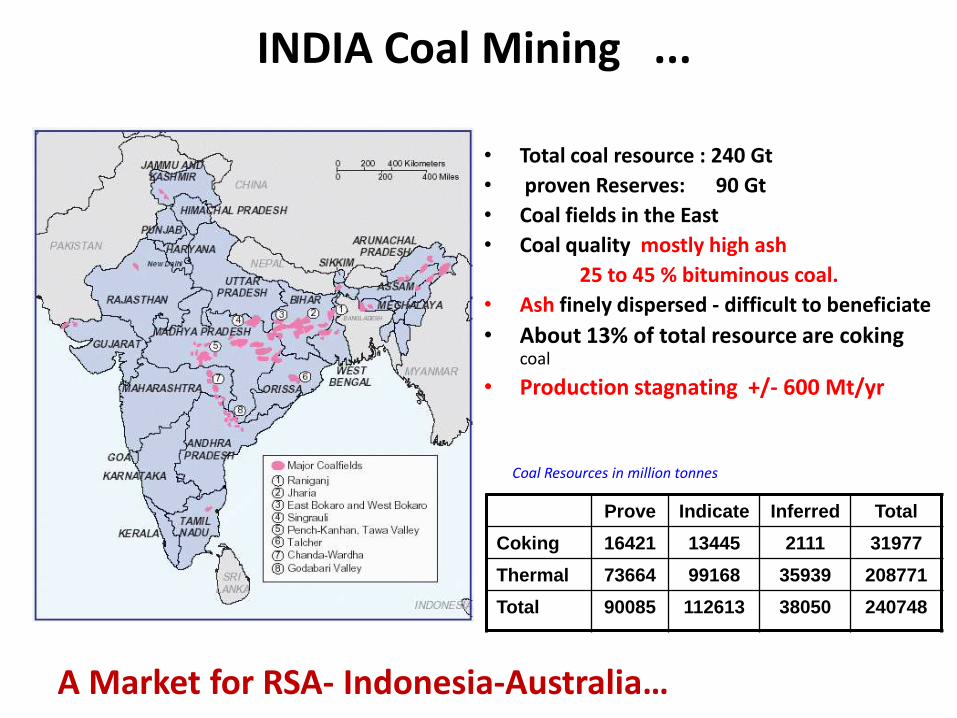
INDIA Coal Mining ...
• Total coal resource : 240 Gt
• proven Reserves: 90 Gt
• Coal fields in the East
• Coal quality mostly high ash
25 to 45 % bituminous coal.
• Ash finely dispersed - difficult to beneficiate
• About 13% of total resource are coking coal
• Production stagnating +/- 600 Mt/yr
Prove Indicate Inferred Total
Coking 16421 13445 2111 31977
Thermal 73664 99168 35939 208771
Total 90085 112613 38050 240748
Coal Resources in million tonnes
A Market for RSA- Indonesia-Australia…
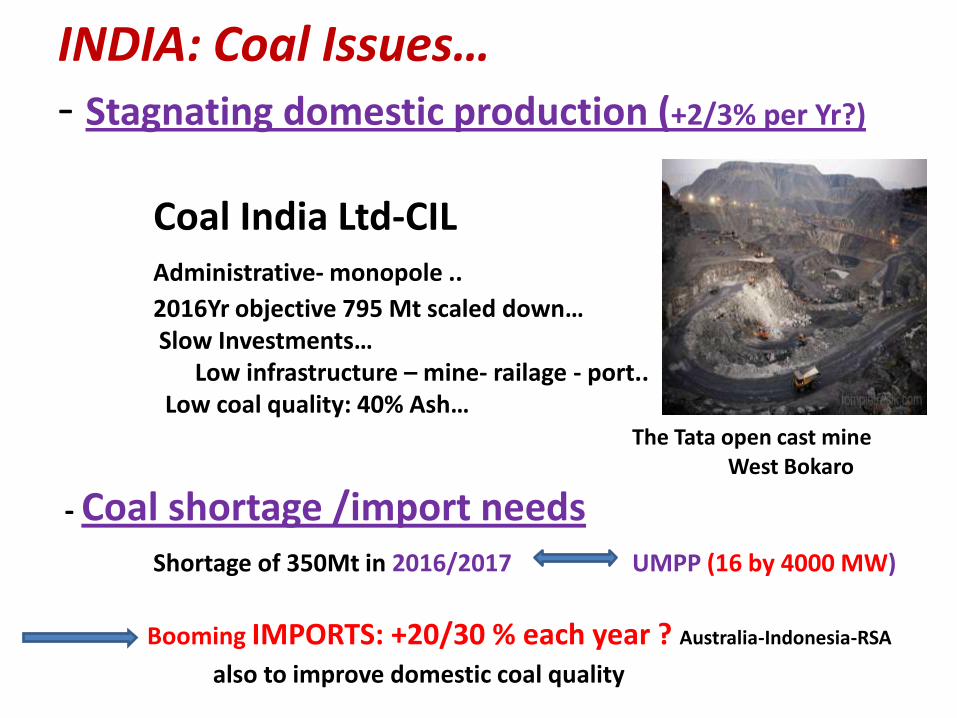
INDIA: Coal Issues…- Stagnating domestic production (+2/3% per Yr?)
Coal India Ltd-CIL Administrative- monopole ..
2016Yr objective 795 Mt scaled down…Slow Investments…
Low infrastructure – mine- railage - port.. Low coal quality: 40% Ash…
The Tata open cast mine West Bokaro
- Coal shortage /import needs Shortage of 350Mt in 2016/2017 UMPP (16 by 4000 MW)
Booming IMPORTS: +20/30 % each year ? Australia-Indonesia-RSA
also to improve domestic coal quality
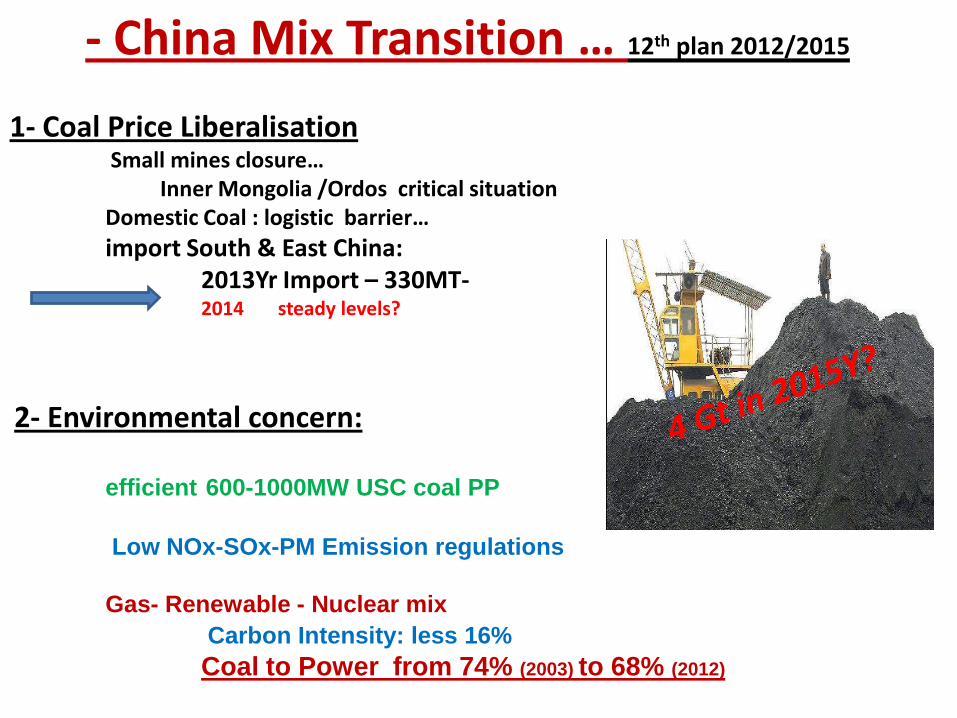
- China Mix Transition … 12th plan 2012/2015
1- Coal Price LiberalisationSmall mines closure…
Inner Mongolia /Ordos critical situation Domestic Coal : logistic barrier…
import South & East China:2013Yr Import – 330MT-2014 steady levels?
2- Environmental concern:
efficient 600-1000MW USC coal PP
Low NOx-SOx-PM Emission regulations
Gas- Renewable - Nuclear mix
Carbon Intensity: less 16%
Coal to Power from 74% (2003) to 68% (2012)
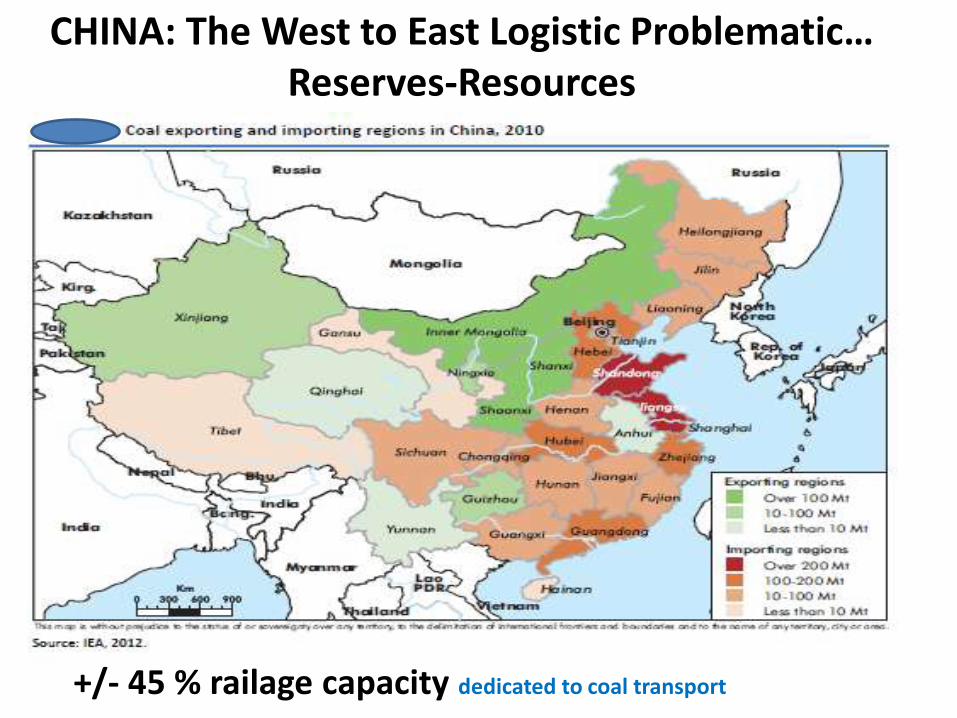
CHINA: The West to East Logistic Problematic…Reserves-Resources
+/- 45 % railage capacity dedicated to coal transport

South China CIF Coal-2013 Indicative price
China Domestic Coal less competitive than imported Coal…
Sept 2013 USD/T Inner Mongolia :FOB 60/65 -- Railage 20/25 + coastal shipping Indicative Costs Australia: FOB 80/85 Freight SEAsia 5/8
High stocks and Small Mine closures - Inner Mongolia
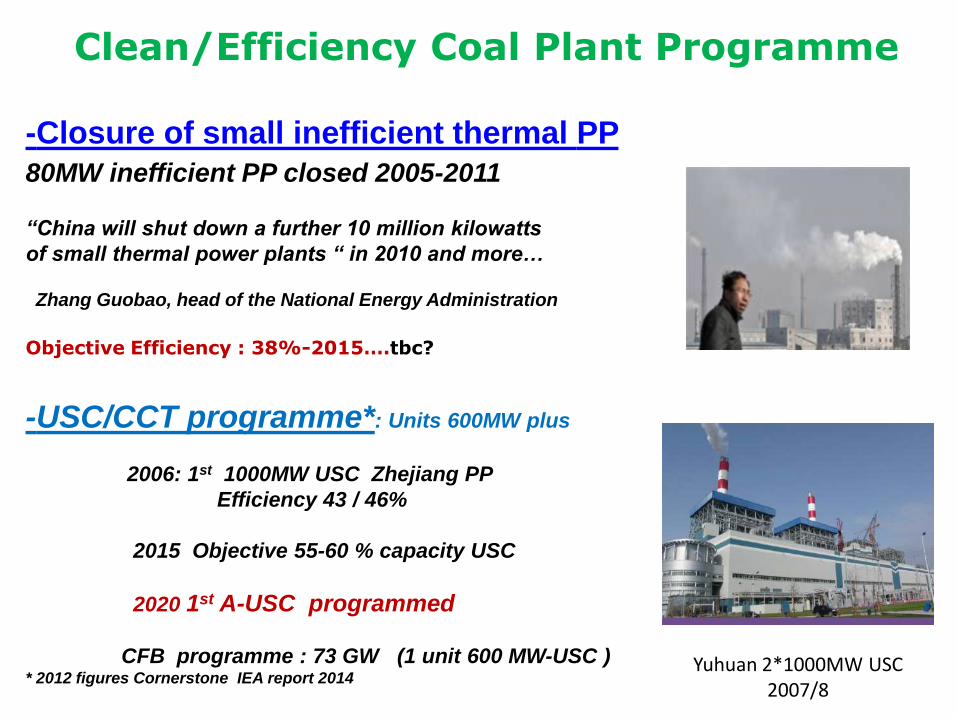
Clean/Efficiency Coal Plant Programme
-Closure of small inefficient thermal PP
80MW inefficient PP closed 2005-2011
“China will shut down a further 10 million kilowatts
of small thermal power plants “ in 2010 and more…
Zhang Guobao, head of the National Energy Administration
Objective Efficiency : 38%-2015….tbc?
-USC/CCT programme*: Units 600MW plus
2006: 1st 1000MW USC Zhejiang PP
Efficiency 43 / 46%
2015 Objective 55-60 % capacity USC
2020 1st A-USC programmed
CFB programme : 73 GW (1 unit 600 MW-USC ) * 2012 figures Cornerstone IEA report 2014
Yuhuan 2*1000MW USC 2007/8

CHINA Efficient & USC Coal PP trend…13th 5Year Plan to come…
CHINA 1247 GW : 746 MW Coal or 70 % electricityCornestone Spring 2015
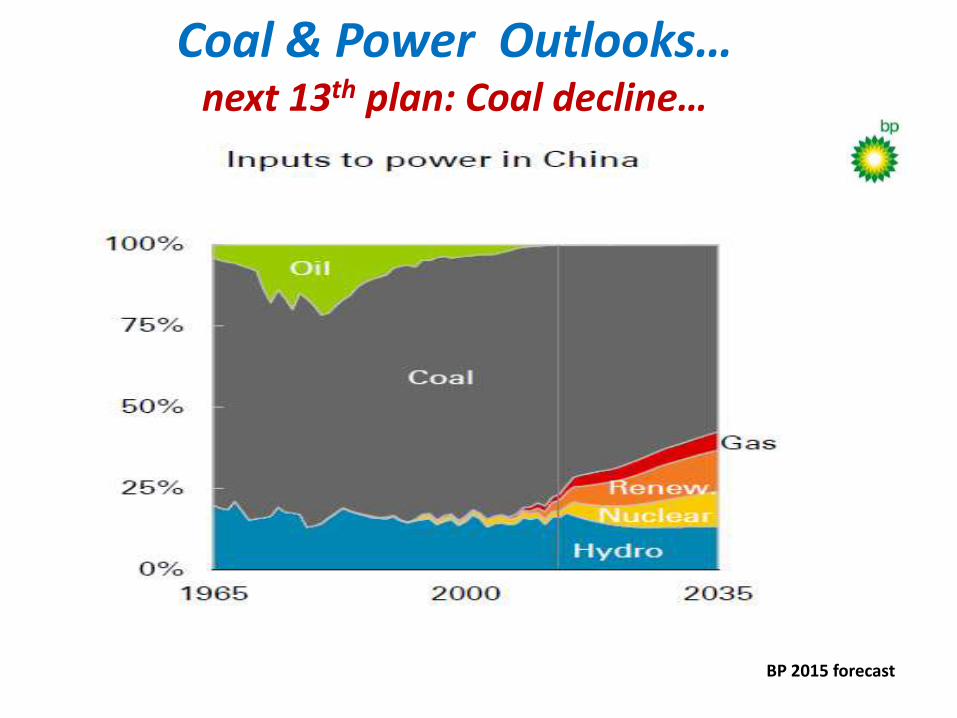
Coal & Power Outlooks…next 13th plan: Coal decline…
BP 2015 forecast
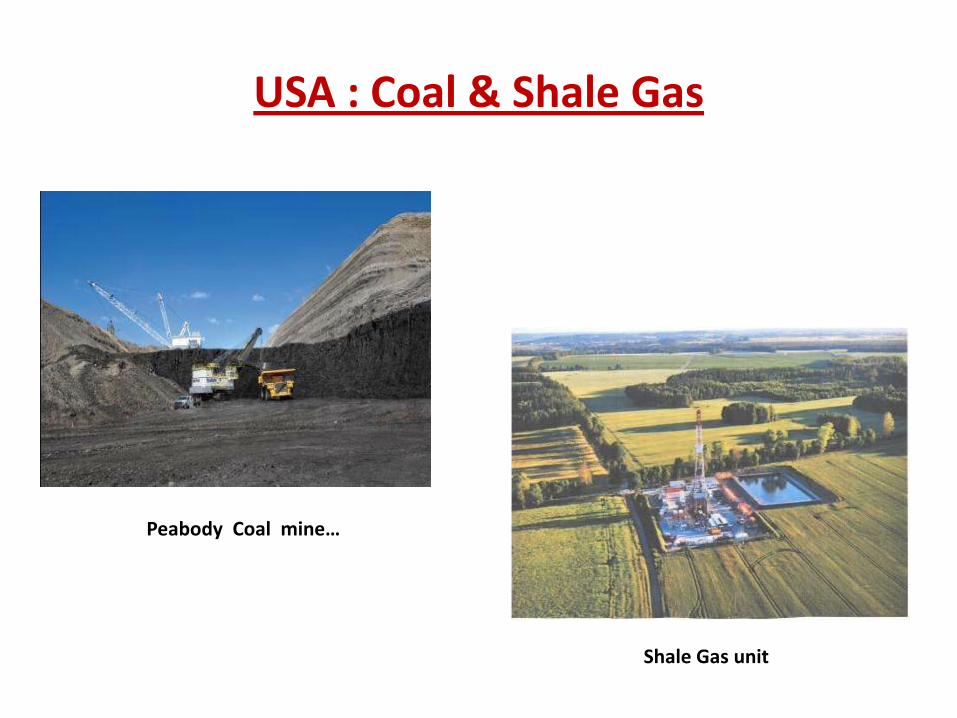
USA : Coal & Shale Gas
Peabody Coal mine…
Shale Gas unit
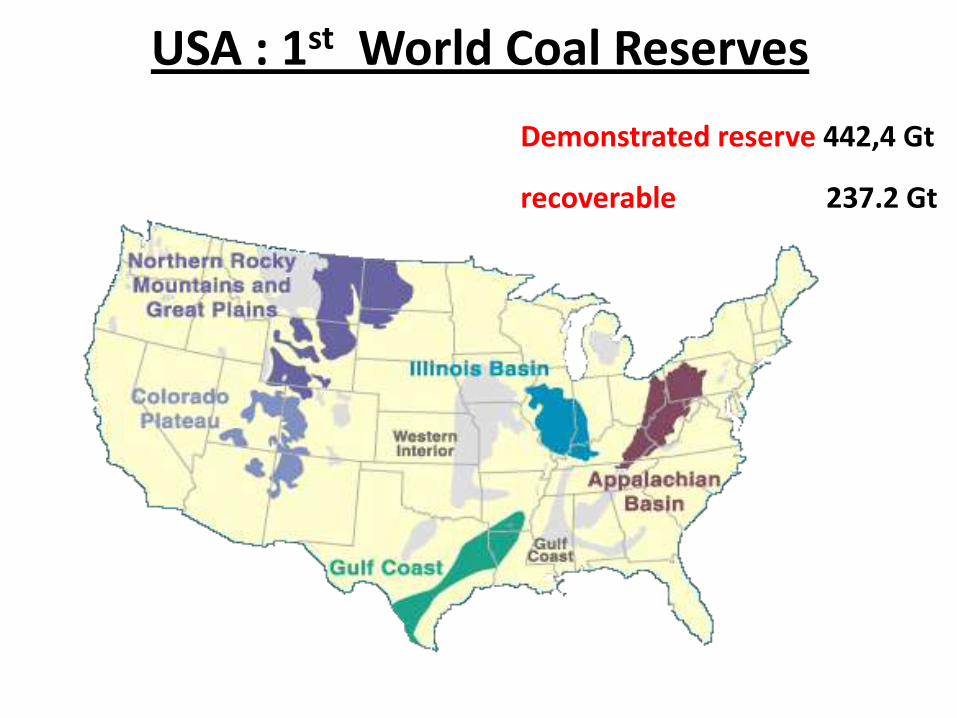
USA : 1st World Coal Reserves
Demonstrated reserve 442,4 Gt
recoverable 237.2 Gt
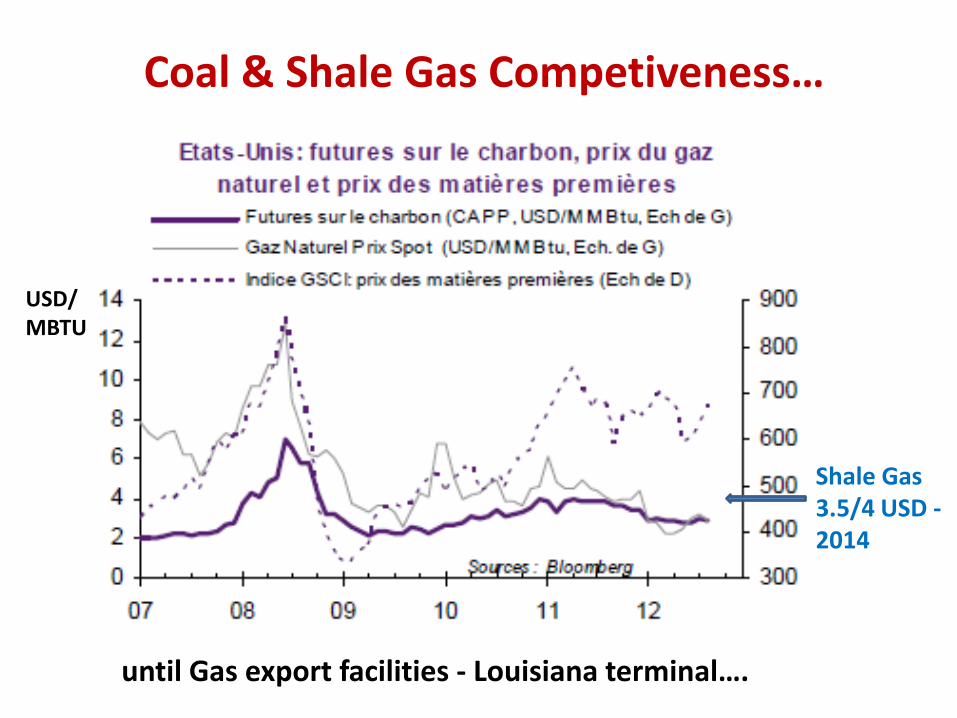
Coal & Shale Gas Competiveness…
until Gas export facilities - Louisiana terminal….
USD/MBTU
Shale Gas 3.5/4 USD -2014
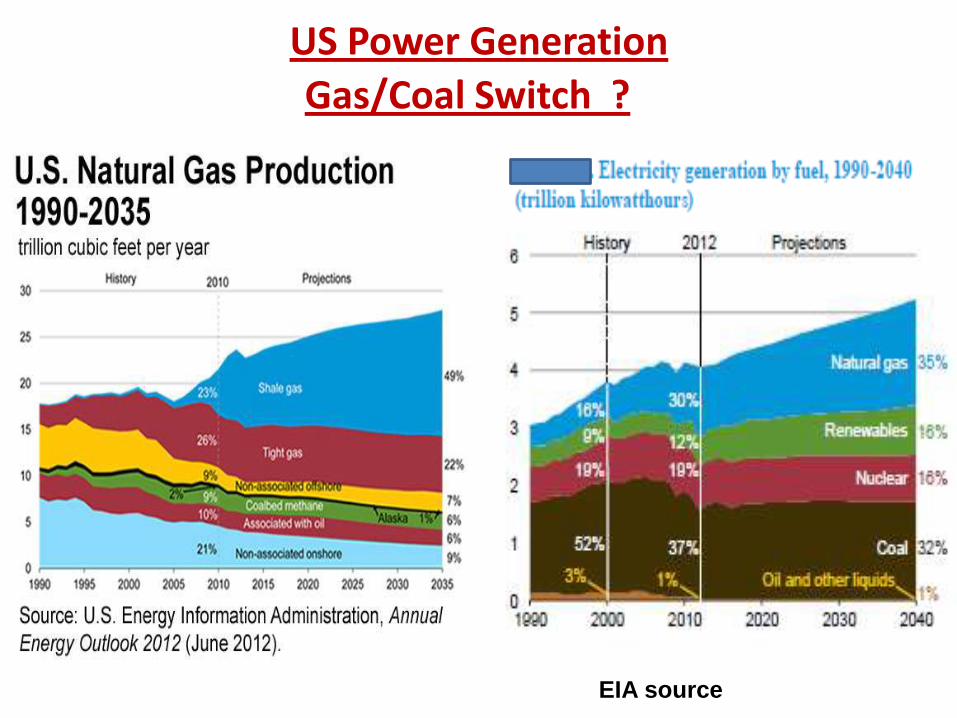
US Power Generation
Gas/Coal Switch ?
EIA source

USA : A New Coal Exporter ?
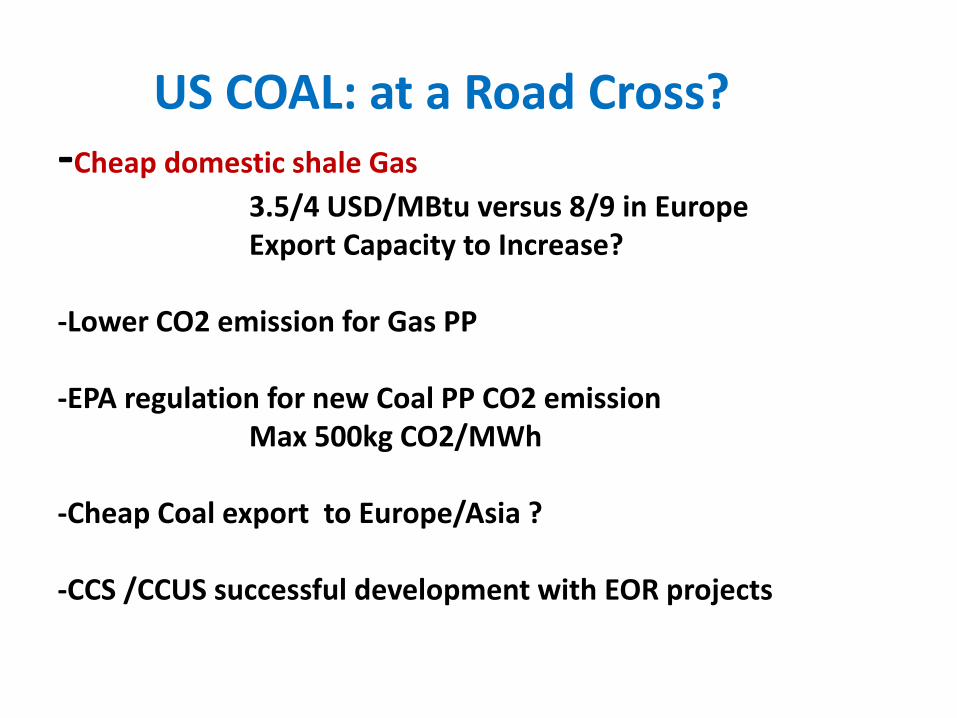
US COAL: at a Road Cross?-Cheap domestic shale Gas
3.5/4 USD/MBtu versus 8/9 in EuropeExport Capacity to Increase?
-Lower CO2 emission for Gas PP
-EPA regulation for new Coal PP CO2 emission Max 500kg CO2/MWh
-Cheap Coal export to Europe/Asia ?
-CCS /CCUS successful development with EOR projects
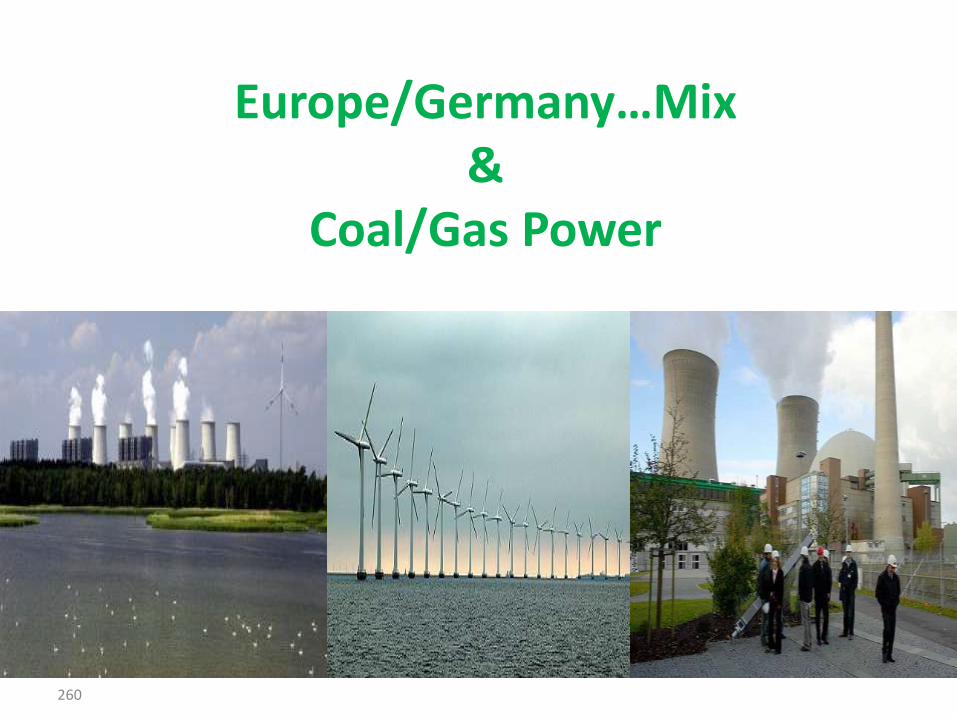
260
Europe/Germany…Mix &
Coal/Gas Power
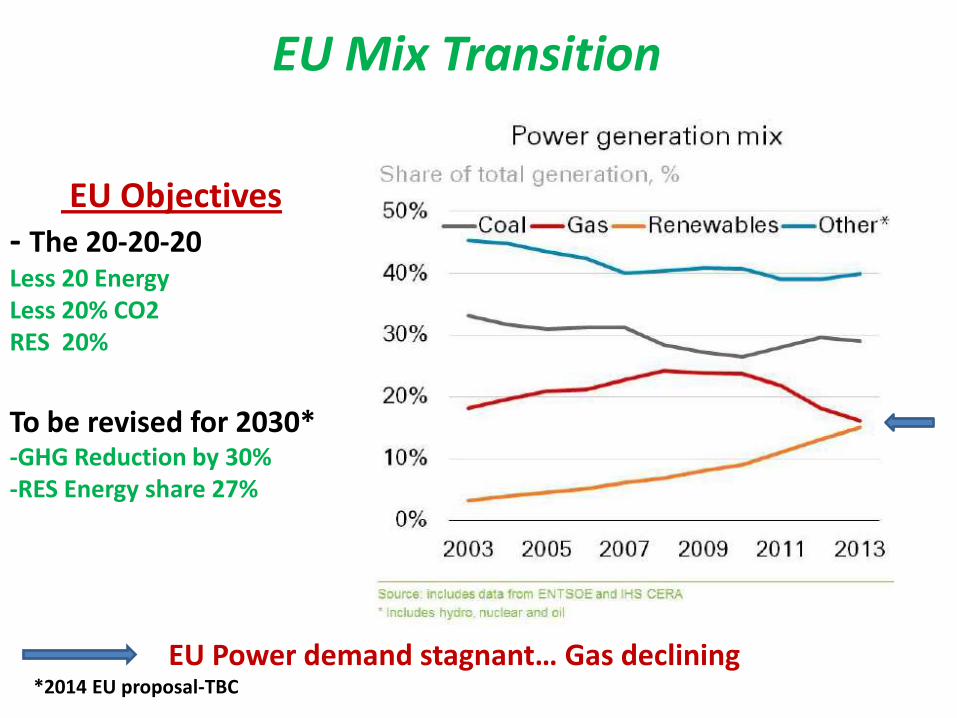
EU Mix Transition
EU Objectives- The 20-20-20Less 20 EnergyLess 20% CO2RES 20%
To be revised for 2030* -GHG Reduction by 30%-RES Energy share 27%
EU Power demand stagnant… Gas declining*2014 EU proposal-TBC

The German Case : Nuclear exit
Nuclear plants : before Fukushima 18 plants -25% of electricity
8/10 plants now stopped Objective: final stop in 2022 Y
Renewable : Electricity contribution increasing from 17% to 20%Objective 35% in 2020Yr- Wind & PV
COAL (with lignite) still 44% Electricity
Renewable: Unlikely & Intermittent?
Fossil Back up: Gas or Coal?

Electricity Price fixed by RES power price delivered on the grid…
GAS spark Spread = Power Price – (Gas cost/0.5).Coal dark Spread = Power Price – (Coal Cost/0.38)Clean Spark Spread = Spark Spread – (Carbon Price*0.411). For Gas
Gas & Coal spark spread
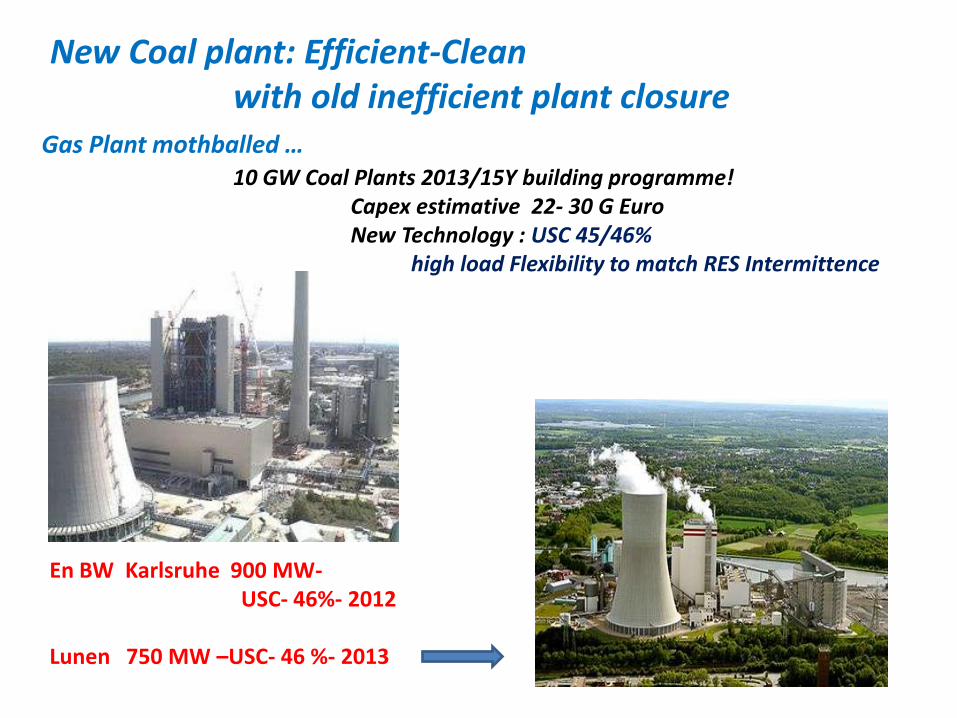
New Coal plant: Efficient-Clean with old inefficient plant closure
Gas Plant mothballed …10 GW Coal Plants 2013/15Y building programme!
Capex estimative 22- 30 G EuroNew Technology : USC 45/46%
high load Flexibility to match RES Intermittence
En BW Karlsruhe 900 MW-USC- 46%- 2012
Lunen 750 MW –USC- 46 %- 2013
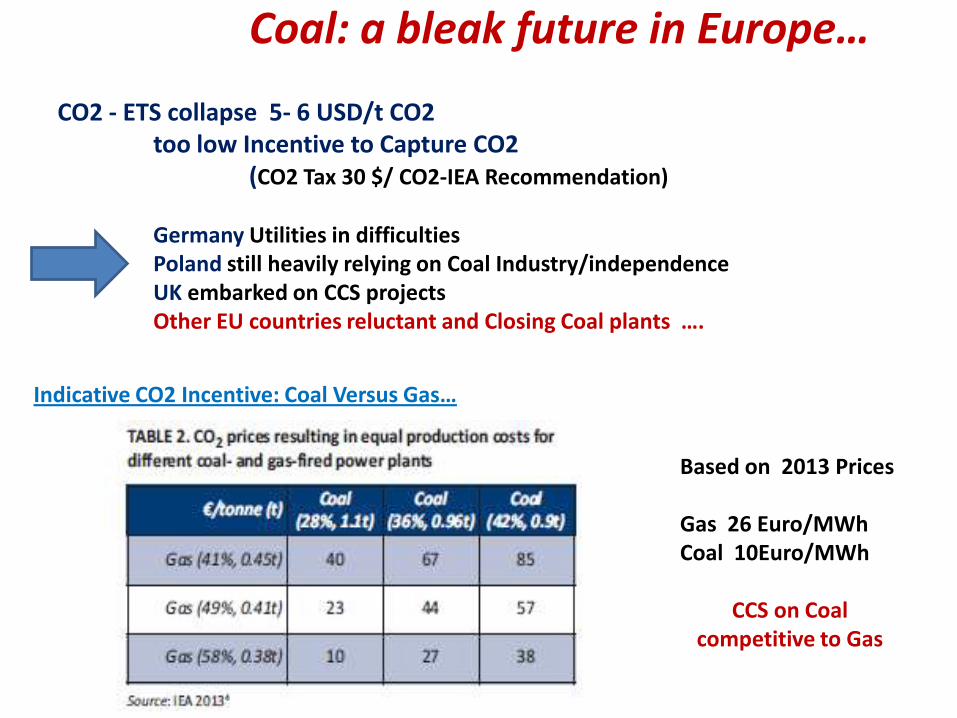
Coal: a bleak future in Europe…
CO2 - ETS collapse 5- 6 USD/t CO2too low Incentive to Capture CO2
(CO2 Tax 30 $/ CO2-IEA Recommendation)
Germany Utilities in difficulties Poland still heavily relying on Coal Industry/independence UK embarked on CCS projectsOther EU countries reluctant and Closing Coal plants ….
Based on 2013 Prices
Gas 26 Euro/MWhCoal 10Euro/MWh
CCS on Coal competitive to Gas
Indicative CO2 Incentive: Coal Versus Gas…
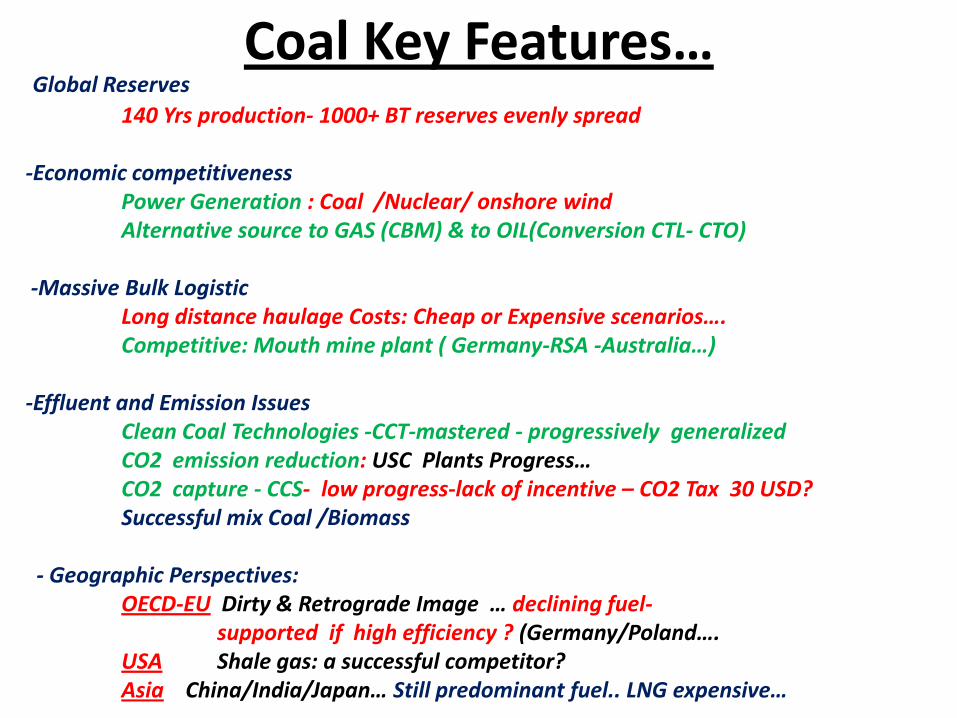
Global Reserves
140 Yrs production- 1000+ BT reserves evenly spread
-Economic competitivenessPower Generation : Coal /Nuclear/ onshore wind Alternative source to GAS (CBM) & to OIL(Conversion CTL- CTO)
-Massive Bulk Logistic Long distance haulage Costs: Cheap or Expensive scenarios…. Competitive: Mouth mine plant ( Germany-RSA -Australia…)
-Effluent and Emission IssuesClean Coal Technologies -CCT-mastered - progressively generalized CO2 emission reduction: USC Plants Progress… CO2 capture - CCS- low progress-lack of incentive – CO2 Tax 30 USD?Successful mix Coal /Biomass
- Geographic Perspectives: OECD-EU Dirty & Retrograde Image … declining fuel-
supported if high efficiency ? (Germany/Poland….USA Shale gas: a successful competitor?Asia China/India/Japan… Still predominant fuel.. LNG expensive…
Coal Key Features…
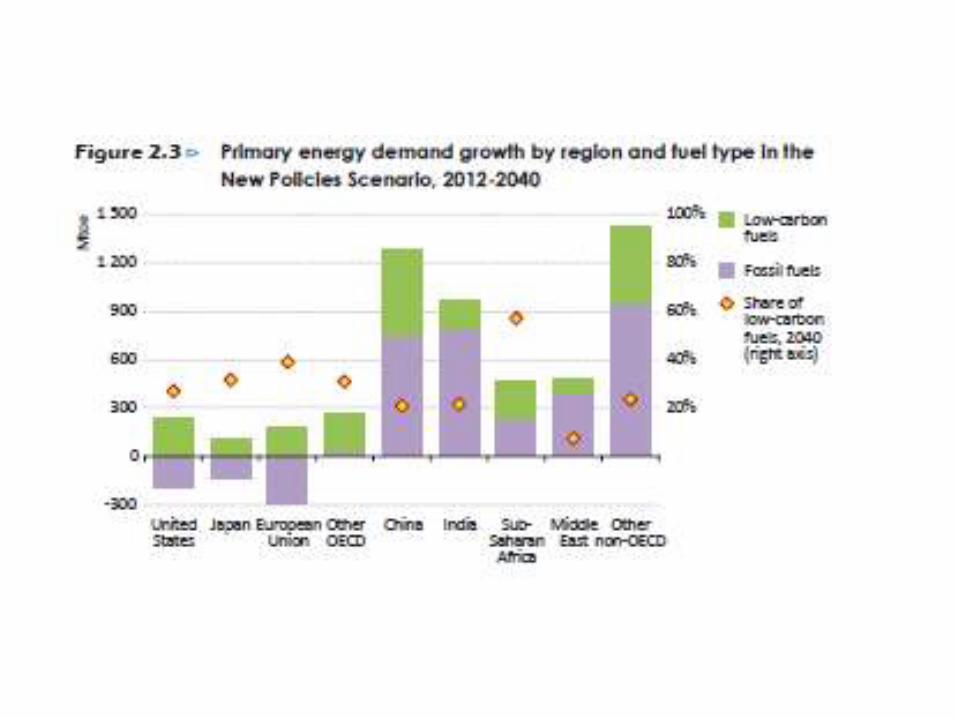
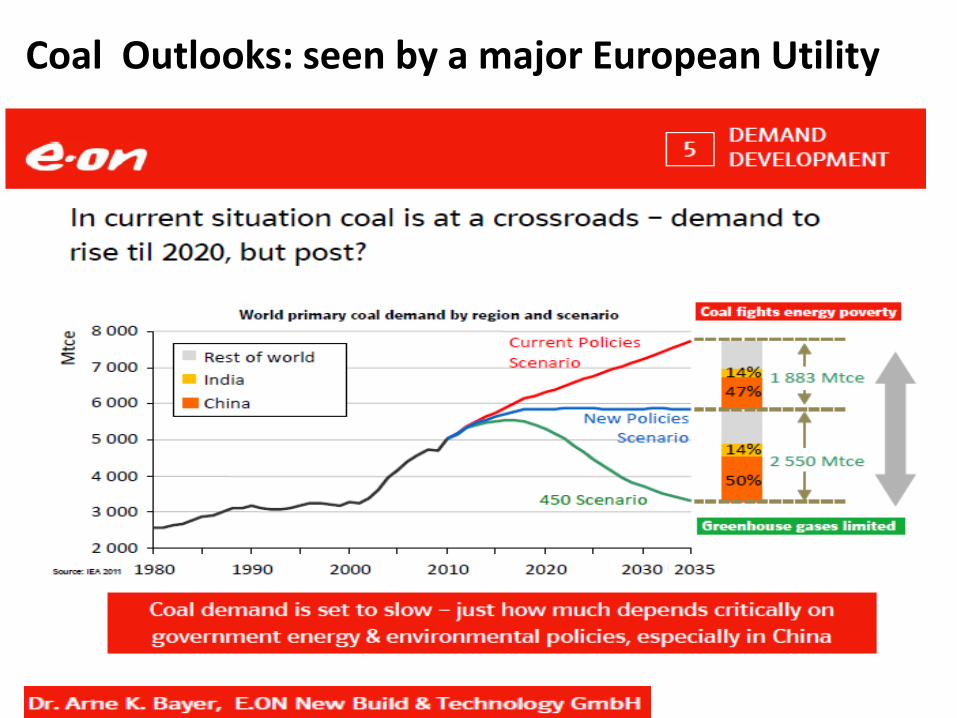
Coal Outlooks: seen by a major European Utility
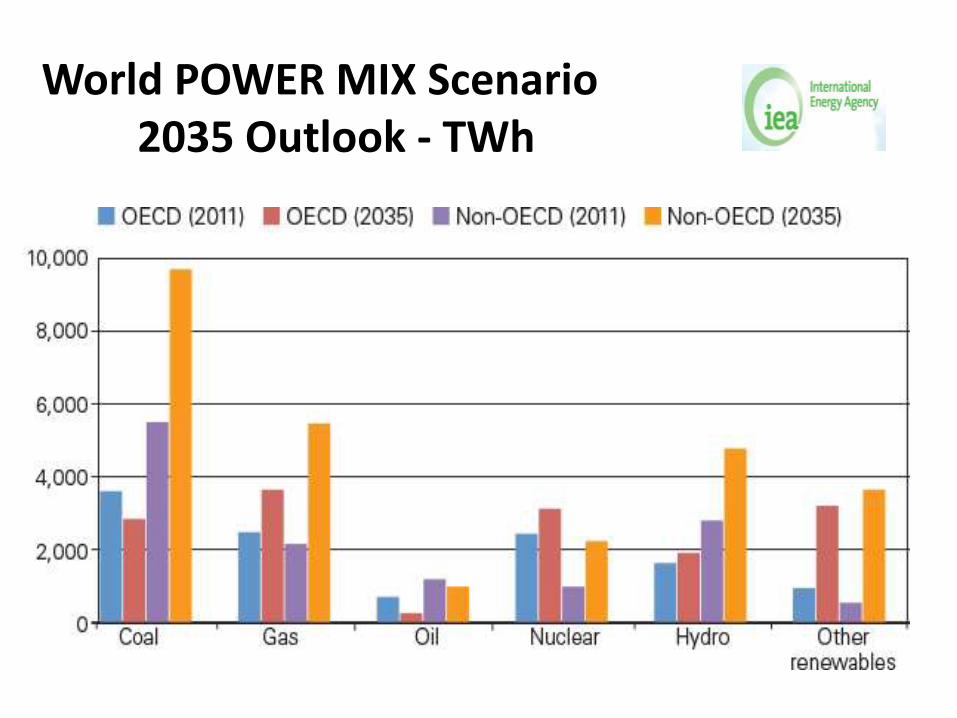
World POWER MIX Scenario 2035 Outlook - TWh
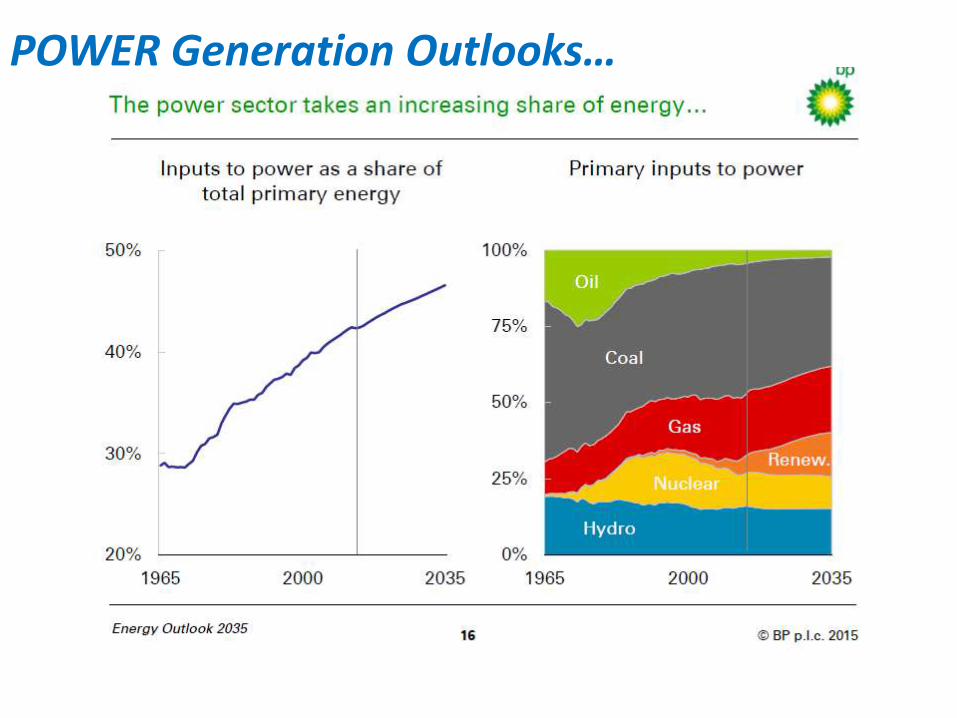
POWER Generation Outlooks…
“Coal is an important source of energy for the world, particularly for Power generation. Demand for coal has grown rapidly over the last decade, outstripping that for gas, oil, nuclear and renewable energy sources. This comes at a cost. Coal contributes to over 40% of global anthropomorphic CO2 emissions and more than 70% of CO2 emissions that arise from power generation are attributed to coal.
To play its role in a sustainable energy future, its environmental footprint needs to be reduced
Using coal more efficiently is an important first step. Beyond efficiency improvement, carbon capture and storage (CCS) must be deployed to make deep cuts in CO2 emissions.”From Maria van der Hoeven IEA Executive Director- 2011 power Generation from Coal
Coal & Power IEA View….
Thank you….
Main Reference and information sources
Thanks for all courtesy documentation and pictures in particular
IEA: OCDE reports and yearly statistics
WCA: World Coal Association/Cornerstone BP -Yearly statisticsGCCS -BellonaAlstom Power-Siemens-Hitachi- Babcock… Eon-Vattenfall – Elsam- RWE- EdF- National Power- Eskom –Huaneng -Money Power-CLP-Electricity Board of India -Drax…. CEC -Shanghai Electric -Shenhua-Huaneng -Sasol , Australian Coal Association-SA DME-FFF- China Coal state entities –India Coal -Atic /Cdf – Exxaro- Rio Tinto –Anglocoal -Xstrata-Peabody-RbctPlatts-TOTAL SA –TPA…IfpenEIA- EPA- US – Euracoal- BRG- EU : publication and statisticsCSR : reports….
www………com
Tutorial Works - Session IProposed topics:
Session 1 - 1h30
Energy Units
Coal analysis Humidity references Net/ Gross CV Coal sampling methodology
Coal resources/reserves
Mining technology : Opencast / Underground comparison Coal beneficiation
Mine Visit film -10 mn

Tutorial Works - Session IIProposed topics- 1H30
1000 MWe PP case:to review PP coal bulk scheme –logistic/supply
by-products /effluents Supplier / Mine production –
Industrial Plant Combustion : Review & Assessment Exhaust GasCO2 --Desulfuration Plant efficiency - CCS
Electricity production Movie 10 mn.

COAL Course Evaluation QuestionnaireICARE-TPA Wuhan-Hust
To be completed by the students - Thursday Nov- last session
1- Which topic was the most instructive?
2- Which topic you haven’t well understood ?
3- Which topic would need more development according to you ?
Answer in a few words-1line Max-for each question
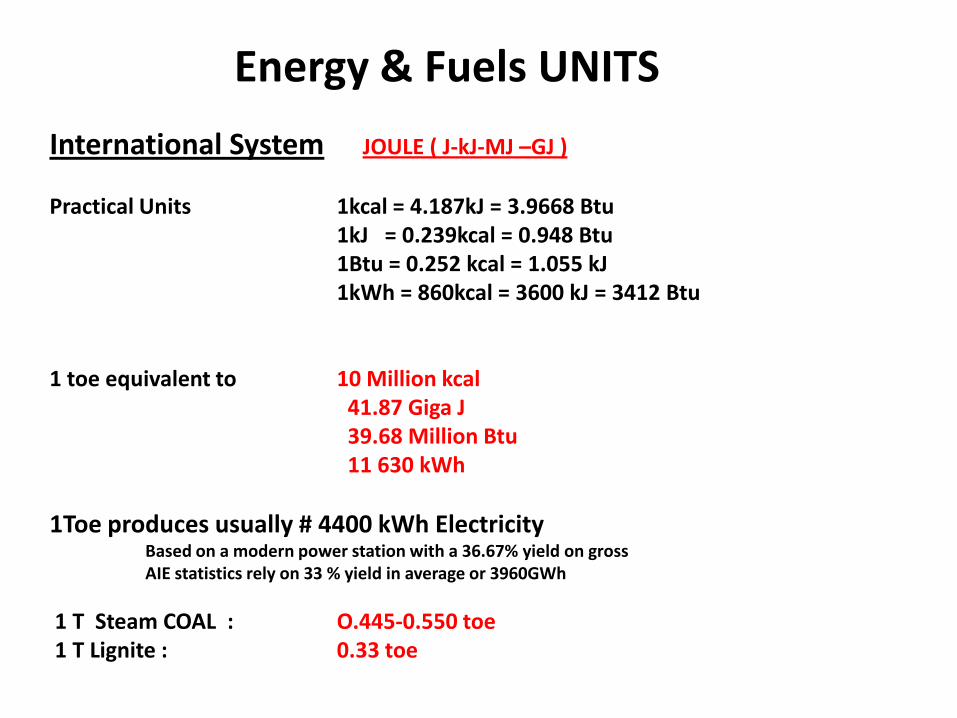
Energy & Fuels UNITS
International System JOULE ( J-kJ-MJ –GJ )
Practical Units 1kcal = 4.187kJ = 3.9668 Btu1kJ = 0.239kcal = 0.948 Btu1Btu = 0.252 kcal = 1.055 kJ1kWh = 860kcal = 3600 kJ = 3412 Btu
1 toe equivalent to 10 Million kcal41.87 Giga J 39.68 Million Btu11 630 kWh
1Toe produces usually # 4400 kWh Electricity Based on a modern power station with a 36.67% yield on grossAIE statistics rely on 33 % yield in average or 3960GWh
1 T Steam COAL : O.445-0.550 toe1 T Lignite : 0.33 toe


COAL Formation Periods….
1-Carboniferous deposits -360 to -286 MYrs
The Pangea Eurasia/Laurentia & Gondwana
formed Climatic changes… Warm & Humid: Swamp areas…Final glaciation & flora extinction
2- Permian deposits -286M to – 251/0 M Yrs
drier period -Fauna & Flora Great Extinction…
Southern part -Gondwana - to split later
into Eastern Asia, India , Southern Africa and Australia sub continents
Both periods represent: 60-65% of the World Coal fields
with High Quality

Younger Coal Deposits:- Upper Cretaceous period: # -100 to -65 M Yrs
Extensive coal deposits are found in the Cretaceous and Tertiary formation in the western North America, Northeastern Russia, Siberia , Africa…
Cretaceous coals were formed in areas where annual rainfall exceeded evaporation as in tropical areas and humid climate to preserve the carbonaceous sediments. Conifer forests were also abundant during the Early Cretaceous with ferns, Gingophytes, Angiosperms and became an important source of plant debris
Lower rank/quality coals: sub-bituminous - lignite & peat
Example: Brown coals of Germany and central Europe - Eurasia , Australia, Indonesia and India.Also in West Africa ( Nigeria Benoue trough…)
-Quaternary Period -2 M YrsPeat deposits -mainly located in Northern former Icy areas :
Scandinavia-Siberia -Ireland… A few are also found in Tropical zones ( Indonesia-Cameroun
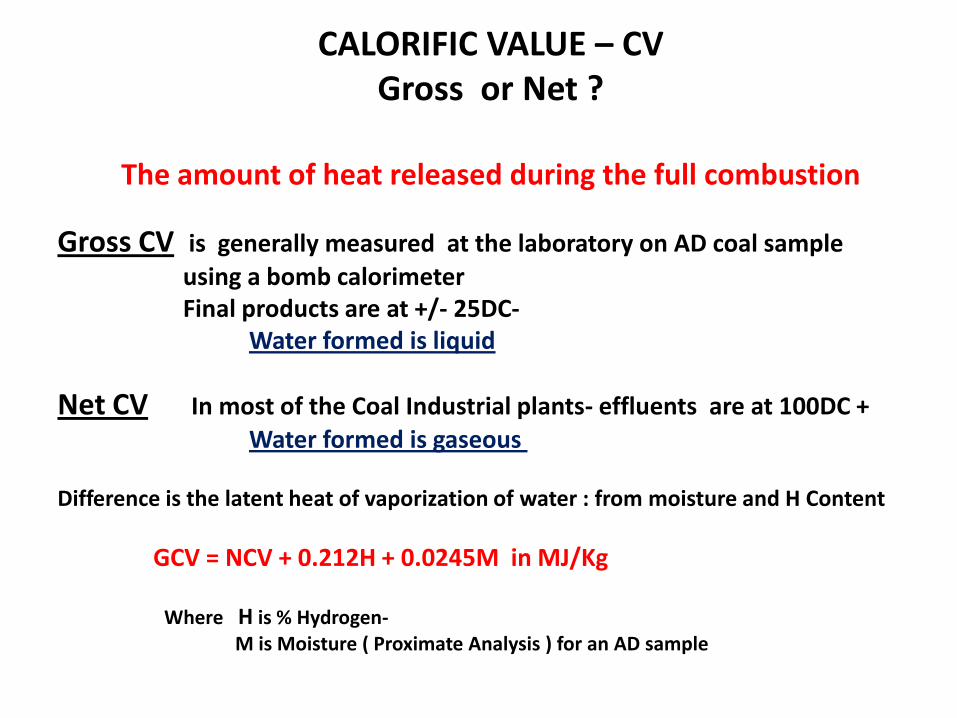
CALORIFIC VALUE – CV Gross or Net ?
The amount of heat released during the full combustion
Gross CV is generally measured at the laboratory on AD coal sample
using a bomb calorimeter Final products are at +/- 25DC-
Water formed is liquid
Net CV In most of the Coal Industrial plants- effluents are at 100DC +
Water formed is gaseous
Difference is the latent heat of vaporization of water : from moisture and H Content
GCV = NCV + 0.212H + 0.0245M in MJ/Kg
Where H is % Hydrogen-M is Moisture ( Proximate Analysis ) for an AD sample
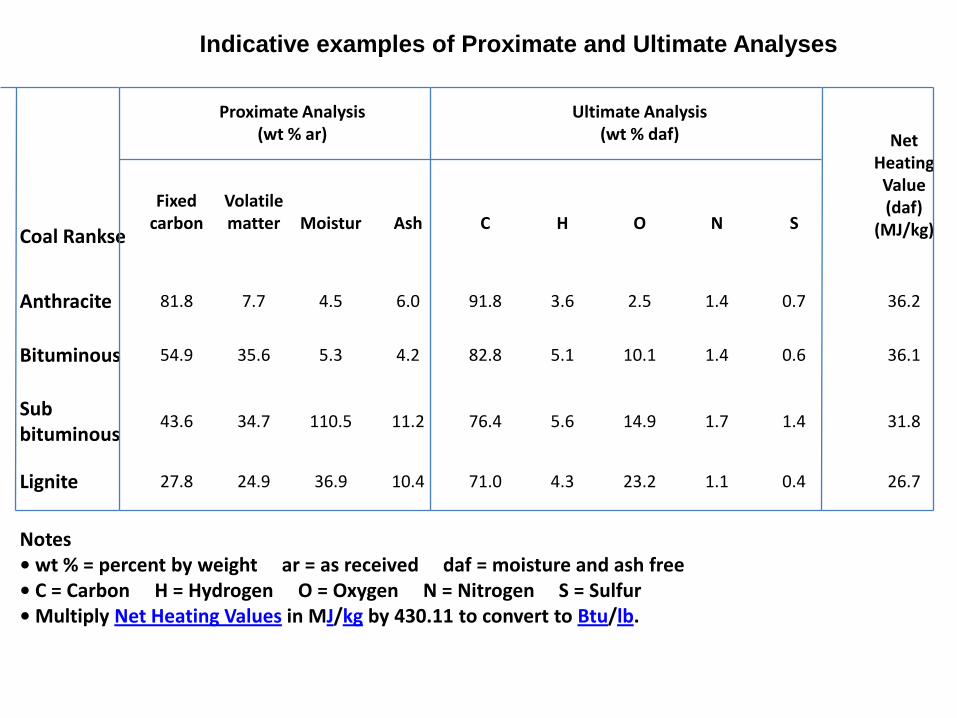
Coal Rankse
Proximate Analysis(wt % ar)
Ultimate Analysis(wt % daf) Net
HeatingValue(daf)
(MJ/kg)
Fixedcarbon
Volatilematter Moistur Ash C H O N S
Anthracite 81.8 7.7 4.5 6.0 91.8 3.6 2.5 1.4 0.7 36.2
Bituminous 54.9 35.6 5.3 4.2 82.8 5.1 10.1 1.4 0.6 36.1
Subbituminous
43.6 34.7 110.5 11.2 76.4 5.6 14.9 1.7 1.4 31.8
Lignite 27.8 24.9 36.9 10.4 71.0 4.3 23.2 1.1 0.4 26.7
Notes• wt % = percent by weight ar = as received daf = moisture and ash free• C = Carbon H = Hydrogen O = Oxygen N = Nitrogen S = Sulfur • Multiply Net Heating Values in MJ/kg by 430.11 to convert to Btu/lb.
Indicative examples of Proximate and Ultimate Analyses
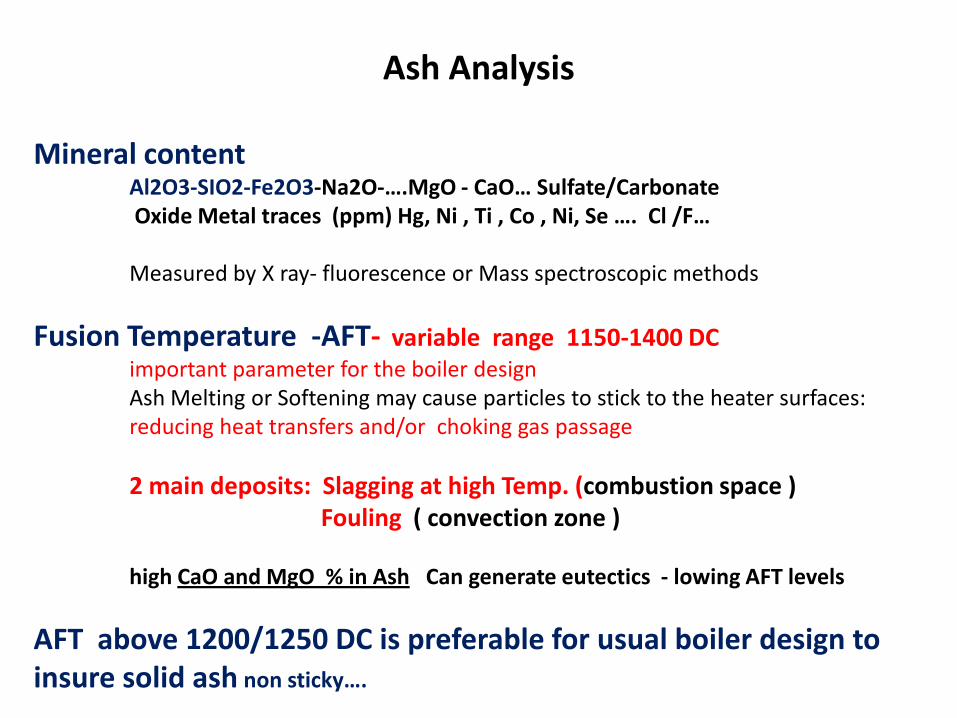
Ash Analysis
Mineral contentAl2O3-SIO2-Fe2O3-Na2O-….MgO - CaO… Sulfate/CarbonateOxide Metal traces (ppm) Hg, Ni , Ti , Co , Ni, Se …. Cl /F…
Measured by X ray- fluorescence or Mass spectroscopic methods
Fusion Temperature -AFT- variable range 1150-1400 DCimportant parameter for the boiler design Ash Melting or Softening may cause particles to stick to the heater surfaces: reducing heat transfers and/or choking gas passage
2 main deposits: Slagging at high Temp. (combustion space )Fouling ( convection zone )
high CaO and MgO % in Ash Can generate eutectics - lowing AFT levels
AFT above 1200/1250 DC is preferable for usual boiler design to insure solid ash non sticky….

Ash (AR Basis) % 11.5 24.4
SiO2, % 46.8 55.0 Al2O3, % 21.8 24.1 Fe2O3, % 9.6 9.3 CaO, % 5.8 3.4 MgO, % 3.5 1.5 Na2O, % 0.8 1.1K2O, % 3.1 1.7 TiO2, % 0.7 1.1P2O5, % 0.3 0.5SO3, % 6.6 2.8Base/acid ratio 0.33 0.2
Ash Fusibility DCInitial 1206 1248 Softening 1290 1345Fluid 1344 1470
Ash Alkali - Impact on AFT South African coal example
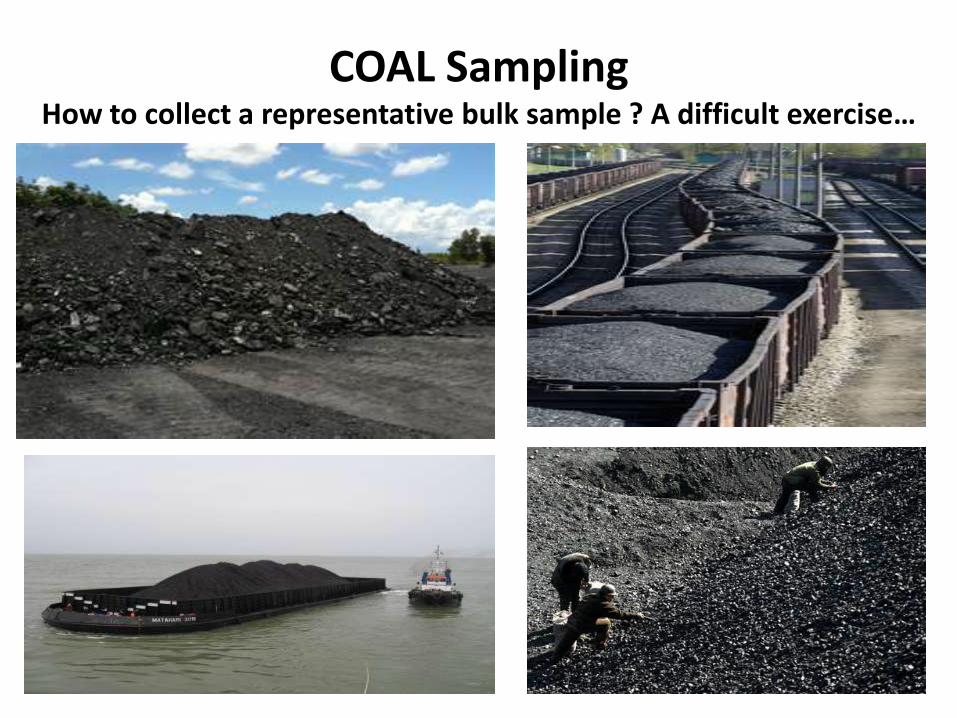
COAL Sampling How to collect a representative bulk sample ? A difficult exercise…
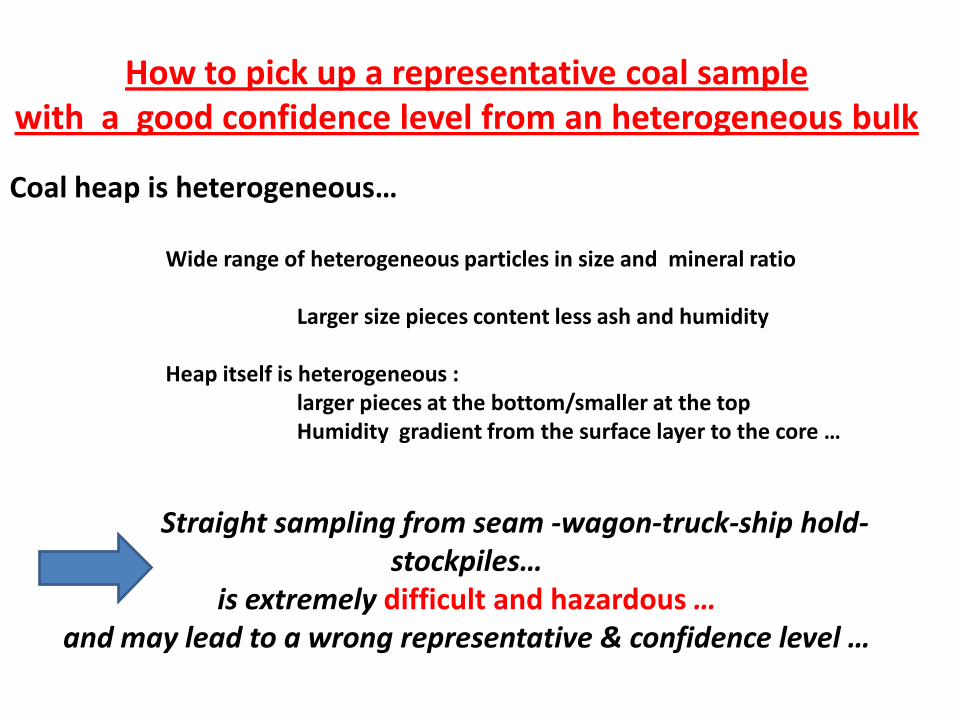
How to pick up a representative coal sample with a good confidence level from an heterogeneous bulk
Coal heap is heterogeneous…
Wide range of heterogeneous particles in size and mineral ratio
Larger size pieces content less ash and humidity
Heap itself is heterogeneous : larger pieces at the bottom/smaller at the topHumidity gradient from the surface layer to the core …
Straight sampling from seam -wagon-truck-ship hold-stockpiles…
is extremely difficult and hazardous … and may lead to a wrong representative & confidence level …

Usual Methodology
General Method based on a large number of increments to be combined to form gross sample
An increment is a sample taken by a single action: from a shovel- a swing arm sampler..
Generally increments are taken regularly- from a conveyor belt moving coal to a stockpile or into the hold of ship… this technique gives the best confidence
Number of increments varies with the size of the shipment-sampling process-coal nature: Usually 30-60 for shipment less than 1000T Above 1000 T :
Number of Increments = Mass of consignment in T /1000
Increment Mass (kg) = 0.06* nominal upper size of coal in mm Example : 3 Kg for a 50 mm max size …)
Sample preparation: blending and crushing all increments to final 0.2 mm sizing for a final 1kg sample
Straight sampling from seam -wagon-truck-ship hold and stockpiles… is extremely difficult and hazardous …
and may lead to a wrong representative & confidence level …
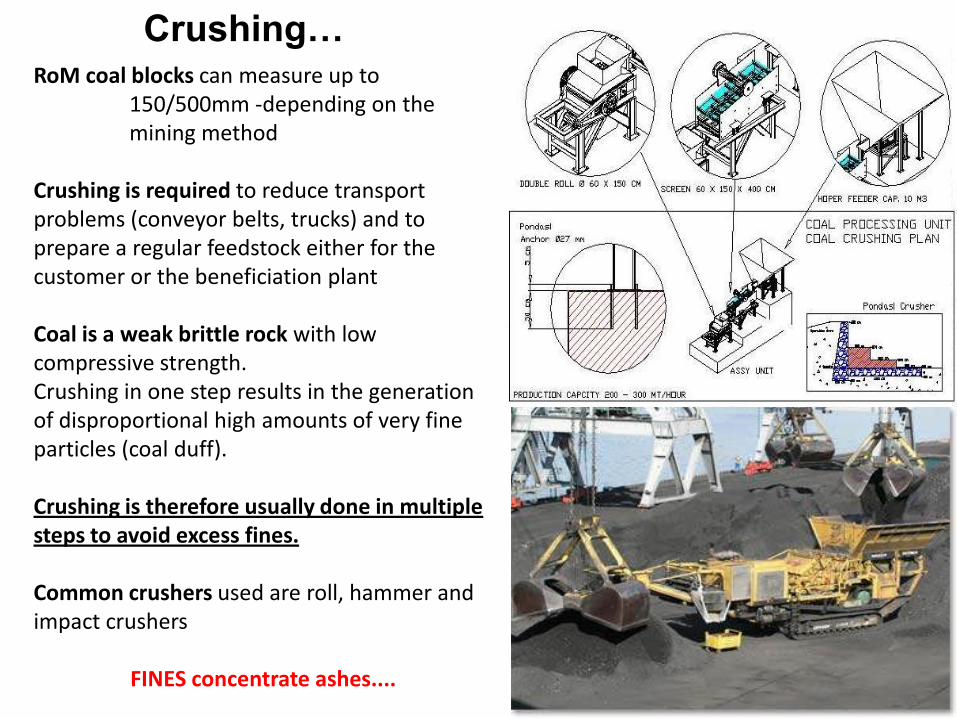
Crushing…RoM coal blocks can measure up to
150/500mm -depending on the mining method
Crushing is required to reduce transport problems (conveyor belts, trucks) and to prepare a regular feedstock either for the customer or the beneficiation plant
Coal is a weak brittle rock with low compressive strength. Crushing in one step results in the generation of disproportional high amounts of very fine particles (coal duff).
Crushing is therefore usually done in multiple steps to avoid excess fines.
Common crushers used are roll, hammer and impact crushers
FINES concentrate ashes....
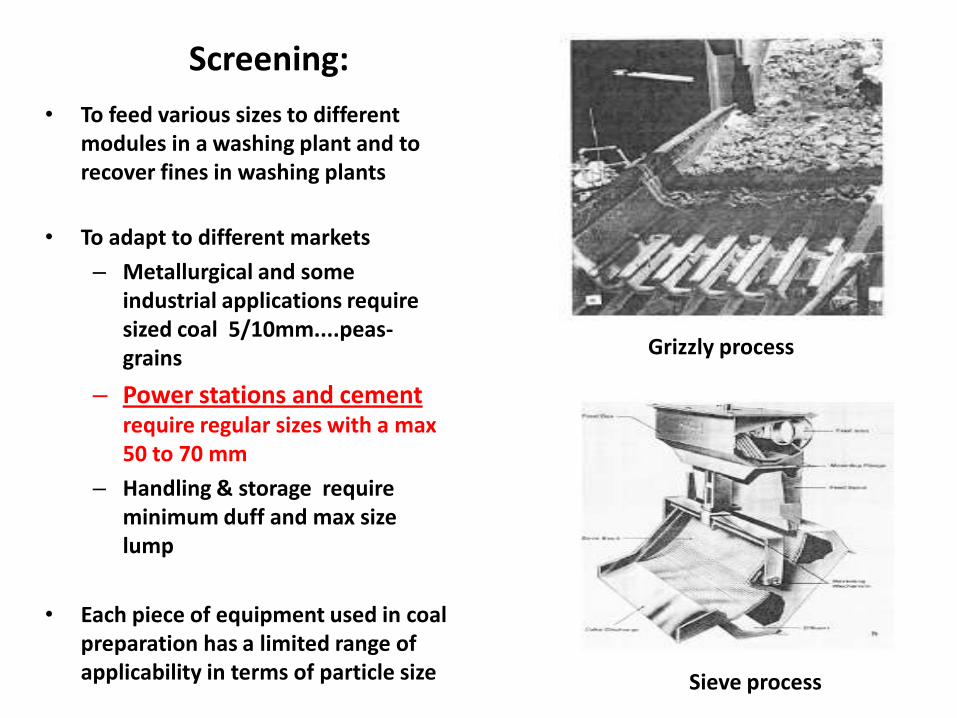
Screening:
• To feed various sizes to different modules in a washing plant and to recover fines in washing plants
• To adapt to different markets
– Metallurgical and some industrial applications require sized coal 5/10mm....peas-grains
– Power stations and cement require regular sizes with a max 50 to 70 mm
– Handling & storage require minimum duff and max size lump
• Each piece of equipment used in coal preparation has a limited range of applicability in terms of particle size Sieve process
Grizzly process
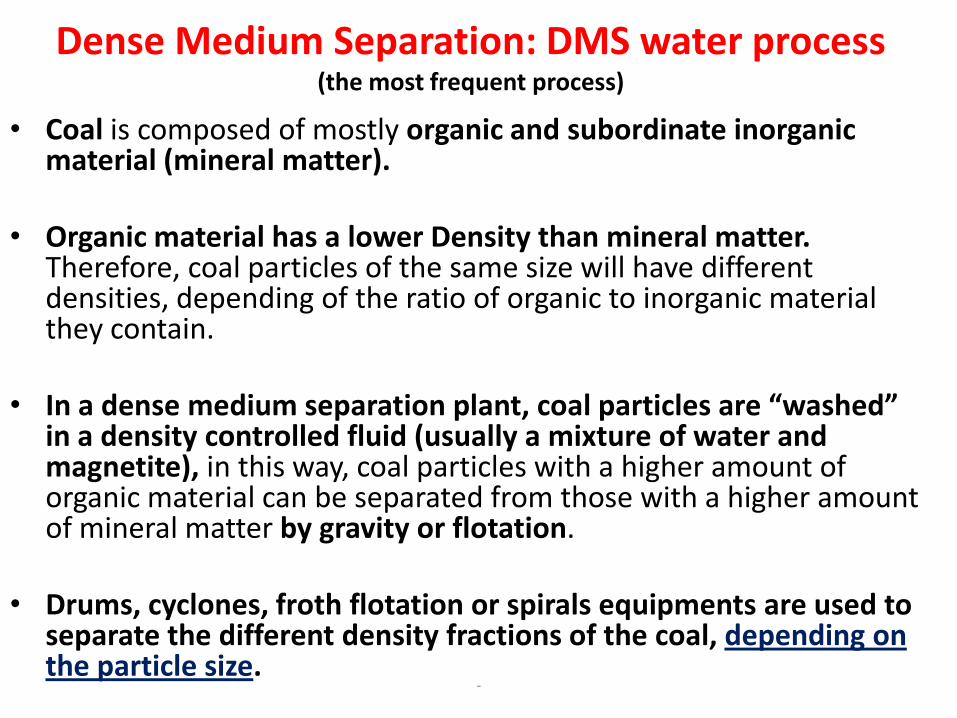
-
Dense Medium Separation: DMS water process (the most frequent process)
• Coal is composed of mostly organic and subordinate inorganic material (mineral matter).
• Organic material has a lower Density than mineral matter. Therefore, coal particles of the same size will have different densities, depending of the ratio of organic to inorganic material they contain.
• In a dense medium separation plant, coal particles are “washed” in a density controlled fluid (usually a mixture of water and magnetite), in this way, coal particles with a higher amount of organic material can be separated from those with a higher amount of mineral matter by gravity or flotation.
• Drums, cyclones, froth flotation or spirals equipments are used to separate the different density fractions of the coal, depending on the particle size.
-
Coal Gravimetric BeneficiationCoal Density & Ash/CV relation
• Washability analyses are used in order to determine the cut density required to obtain a specific product:
• A coal sample is separated in different density ranges and the sub-samples are analysed.
• The results reflect the Ash content variations at different cut densities with corresponding CV
• As density decrease : Ash content decrease
CV and Volatile increase
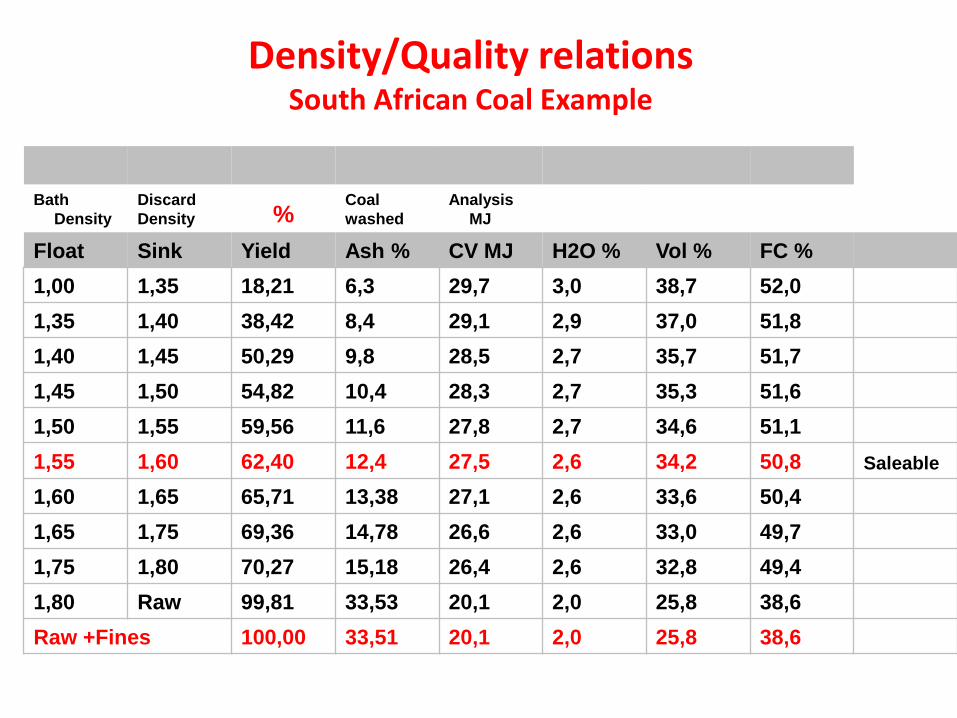
Bath
Density
Discard
Density %Coal
washed
Analysis
MJ
Float Sink Yield Ash % CV MJ H2O % Vol % FC %
1,00 1,35 18,21 6,3 29,7 3,0 38,7 52,0
1,35 1,40 38,42 8,4 29,1 2,9 37,0 51,8
1,40 1,45 50,29 9,8 28,5 2,7 35,7 51,7
1,45 1,50 54,82 10,4 28,3 2,7 35,3 51,6
1,50 1,55 59,56 11,6 27,8 2,7 34,6 51,1
1,55 1,60 62,40 12,4 27,5 2,6 34,2 50,8 Saleable
1,60 1,65 65,71 13,38 27,1 2,6 33,6 50,4
1,65 1,75 69,36 14,78 26,6 2,6 33,0 49,7
1,75 1,80 70,27 15,18 26,4 2,6 32,8 49,4
1,80 Raw 99,81 33,53 20,1 2,0 25,8 38,6
Raw +Fines 100,00 33,51 20,1 2,0 25,8 38,6
Density/Quality relationsSouth African Coal Example
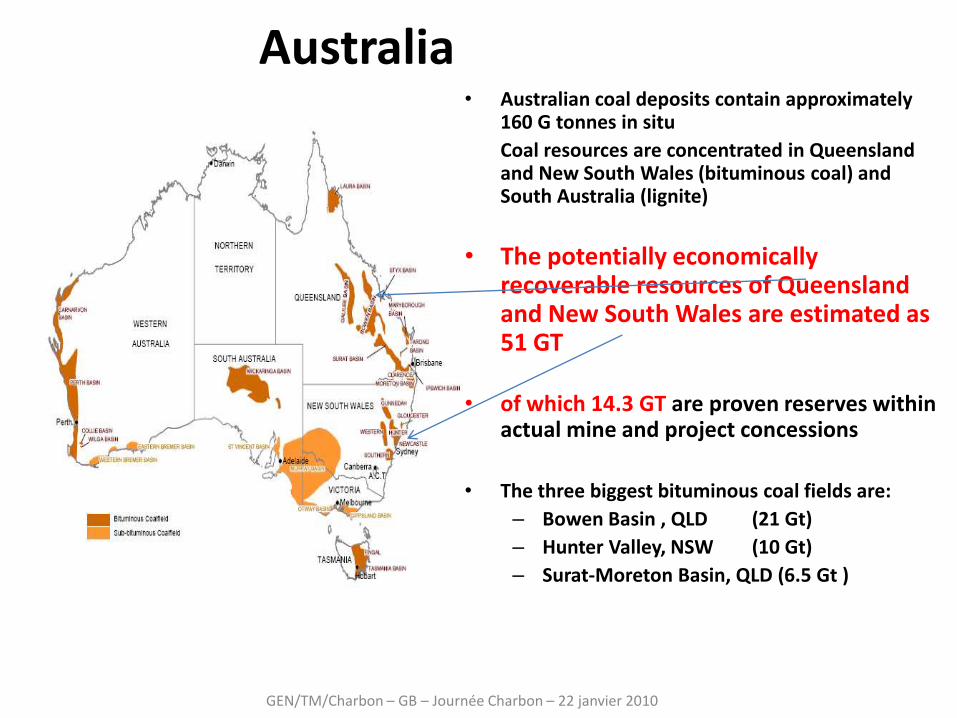
GEN/TM/Charbon – GB – Journée Charbon – 22 janvier 2010
Australia• Australian coal deposits contain approximately
160 G tonnes in situ
Coal resources are concentrated in Queensland and New South Wales (bituminous coal) and South Australia (lignite)
• The potentially economically recoverable resources of Queensland and New South Wales are estimated as 51 GT
• of which 14.3 GT are proven reserves within actual mine and project concessions
• The three biggest bituminous coal fields are:
– Bowen Basin , QLD (21 Gt)
– Hunter Valley, NSW (10 Gt)
– Surat-Moreton Basin, QLD (6.5 Gt )
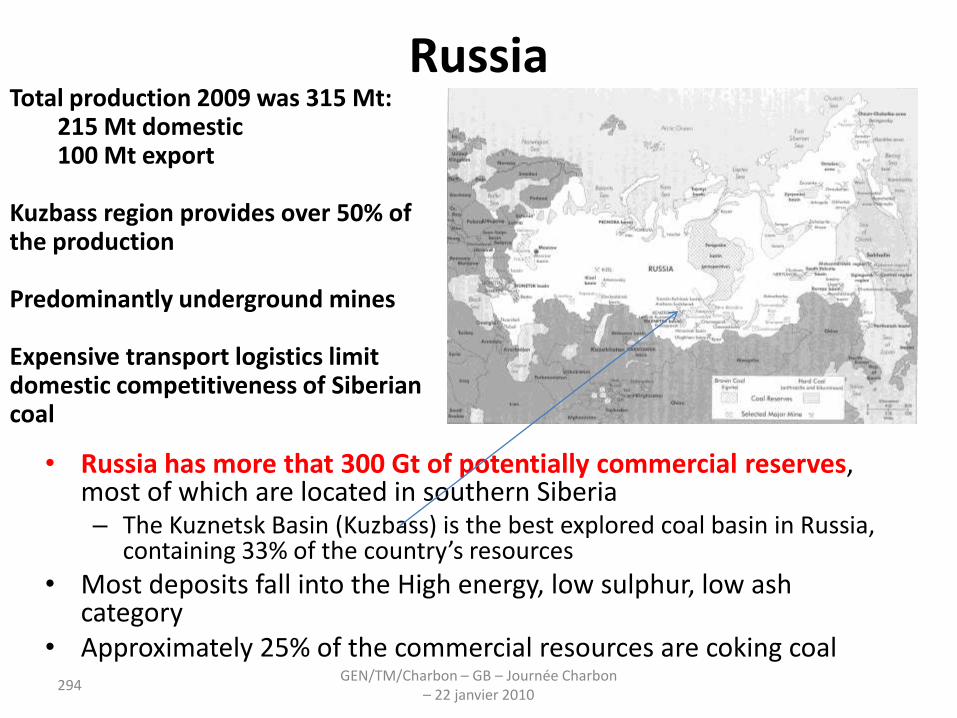
294GEN/TM/Charbon – GB – Journée Charbon
– 22 janvier 2010
Russia
• Russia has more that 300 Gt of potentially commercial reserves, most of which are located in southern Siberia– The Kuznetsk Basin (Kuzbass) is the best explored coal basin in Russia,
containing 33% of the country’s resources
• Most deposits fall into the High energy, low sulphur, low ash category
• Approximately 25% of the commercial resources are coking coal
Total production 2009 was 315 Mt:215 Mt domestic100 Mt export
Kuzbass region provides over 50% of the production
Predominantly underground mines
Expensive transport logistics limit domestic competitiveness of Siberian coal
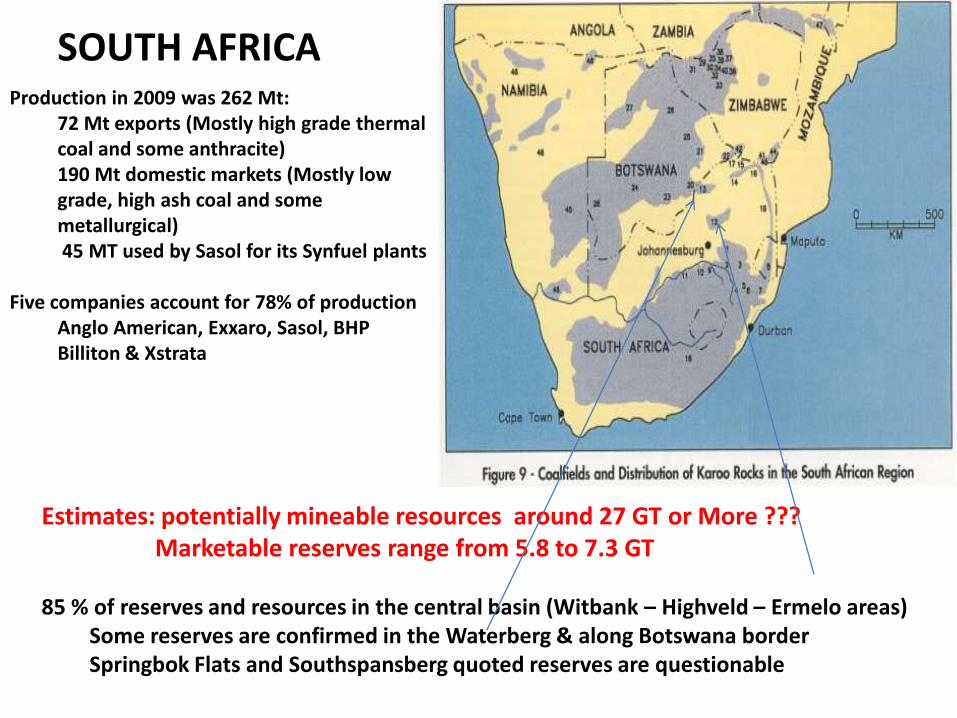
Production in 2009 was 262 Mt:72 Mt exports (Mostly high grade thermal coal and some anthracite)190 Mt domestic markets (Mostly low grade, high ash coal and some metallurgical)45 MT used by Sasol for its Synfuel plants
Five companies account for 78% of productionAnglo American, Exxaro, Sasol, BHP Billiton & Xstrata
SOUTH AFRICA
Estimates: potentially mineable resources around 27 GT or More ???Marketable reserves range from 5.8 to 7.3 GT
85 % of reserves and resources in the central basin (Witbank – Highveld – Ermelo areas)Some reserves are confirmed in the Waterberg & along Botswana border Springbok Flats and Southspansberg quoted reserves are questionable
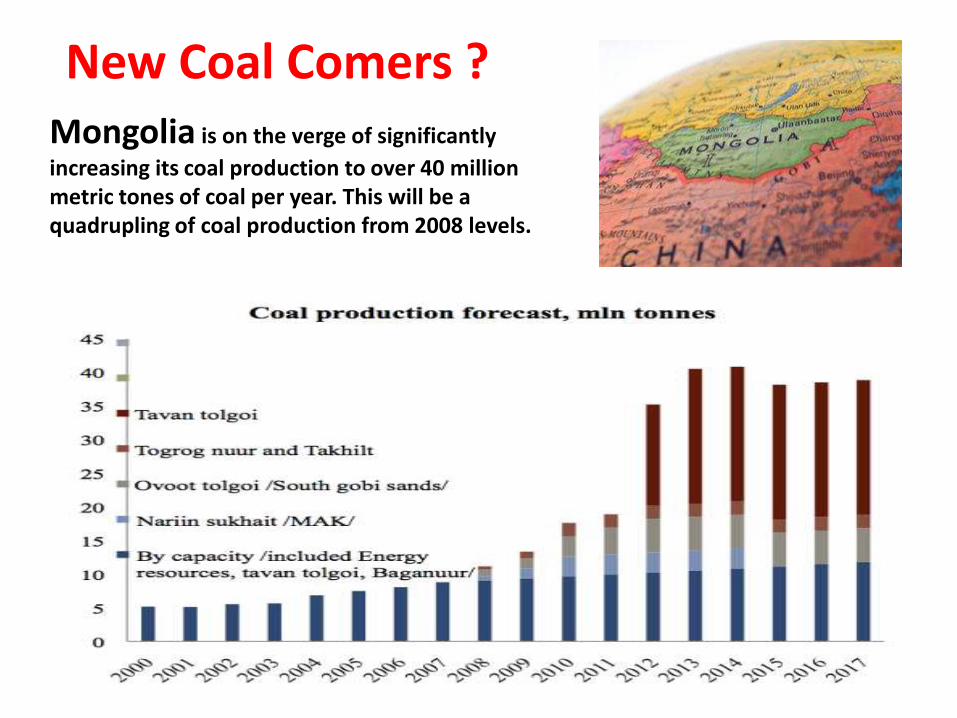
Mongolia is on the verge of significantly
increasing its coal production to over 40 million metric tones of coal per year. This will be a quadrupling of coal production from 2008 levels.
New Coal Comers ?
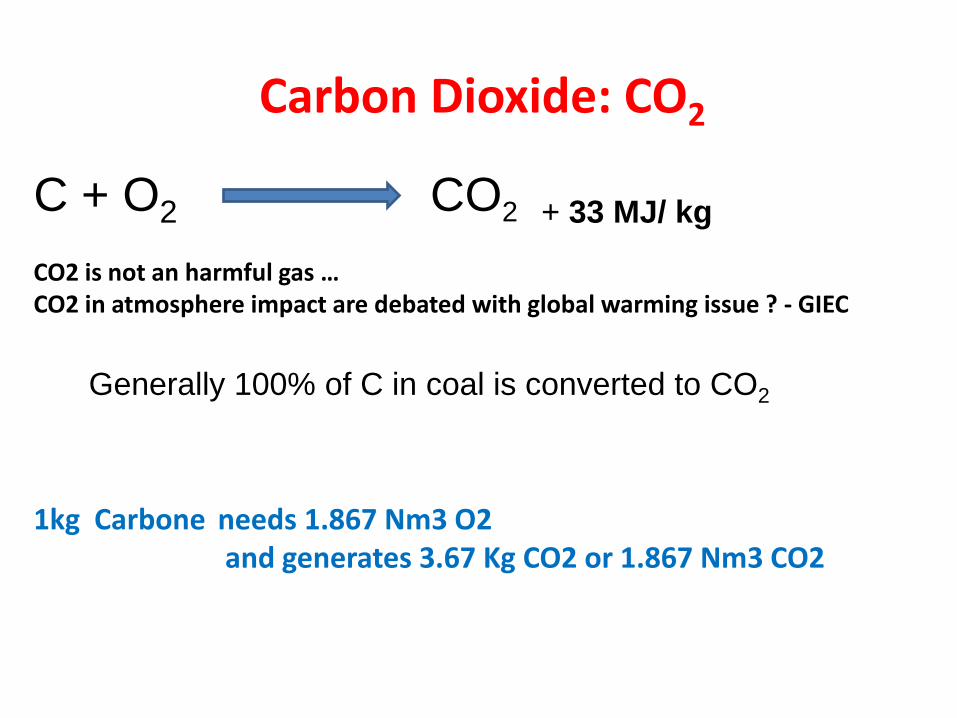
Carbon Dioxide: CO2
C + O2 CO2 + 33 MJ/ kg
CO2 is not an harmful gas …CO2 in atmosphere impact are debated with global warming issue ? - GIEC
Generally 100% of C in coal is converted to CO2
1kg Carbone needs 1.867 Nm3 O2and generates 3.67 Kg CO2 or 1.867 Nm3 CO2
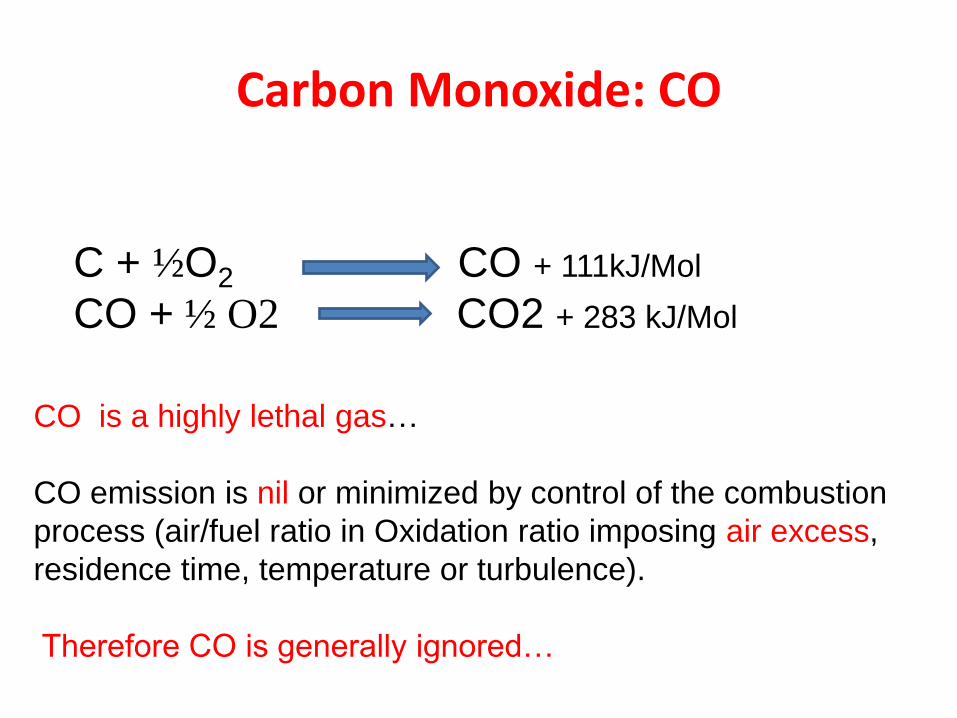
Carbon Monoxide: CO
C + ½O2 CO + 111kJ/Mol
CO + ½ O2 CO2 + 283 kJ/Mol
CO is a highly lethal gas…
CO emission is nil or minimized by control of the combustion
process (air/fuel ratio in Oxidation ratio imposing air excess,
residence time, temperature or turbulence).
Therefore CO is generally ignored…
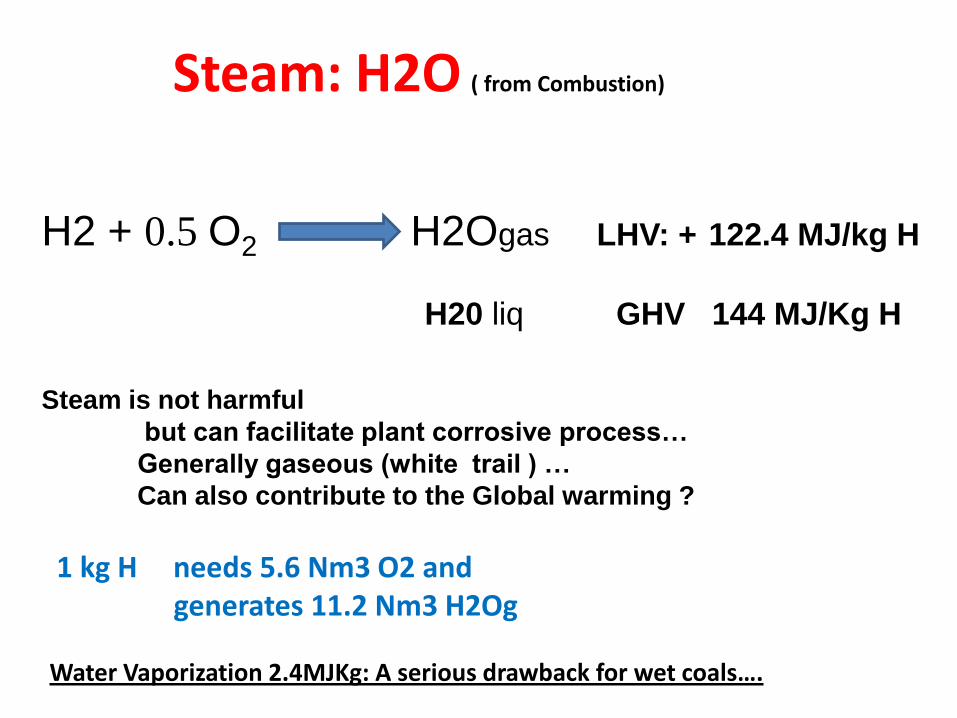
H2 + 0.5 O2 H2Ogas LHV: + 122.4 MJ/kg H
H20 liq GHV 144 MJ/Kg H
Steam is not harmful
but can facilitate plant corrosive process…
Generally gaseous (white trail ) …
Can also contribute to the Global warming ?
Steam: H2O ( from Combustion)
1 kg H needs 5.6 Nm3 O2 and generates 11.2 Nm3 H2Og
Water Vaporization 2.4MJKg: A serious drawback for wet coals….
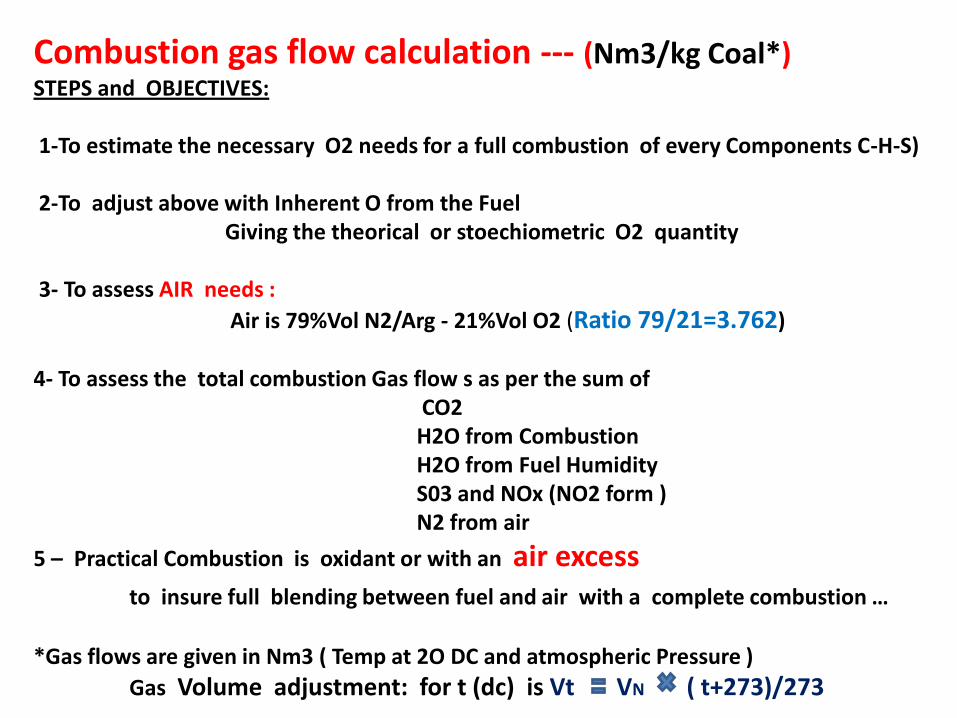
Combustion gas flow calculation --- (Nm3/kg Coal*)STEPS and OBJECTIVES:
1-To estimate the necessary O2 needs for a full combustion of every Components C-H-S)
2-To adjust above with Inherent O from the Fuel Giving the theorical or stoechiometric O2 quantity
3- To assess AIR needs :
Air is 79%Vol N2/Arg - 21%Vol O2 (Ratio 79/21=3.762)
4- To assess the total combustion Gas flow s as per the sum of CO2H2O from Combustion H2O from Fuel HumidityS03 and NOx (NO2 form )N2 from air
5 – Practical Combustion is oxidant or with an air excess to insure full blending between fuel and air with a complete combustion …
*Gas flows are given in Nm3 ( Temp at 2O DC and atmospheric Pressure )
Gas Volume adjustment: for t (dc) is Vt VN ( t+273)/273
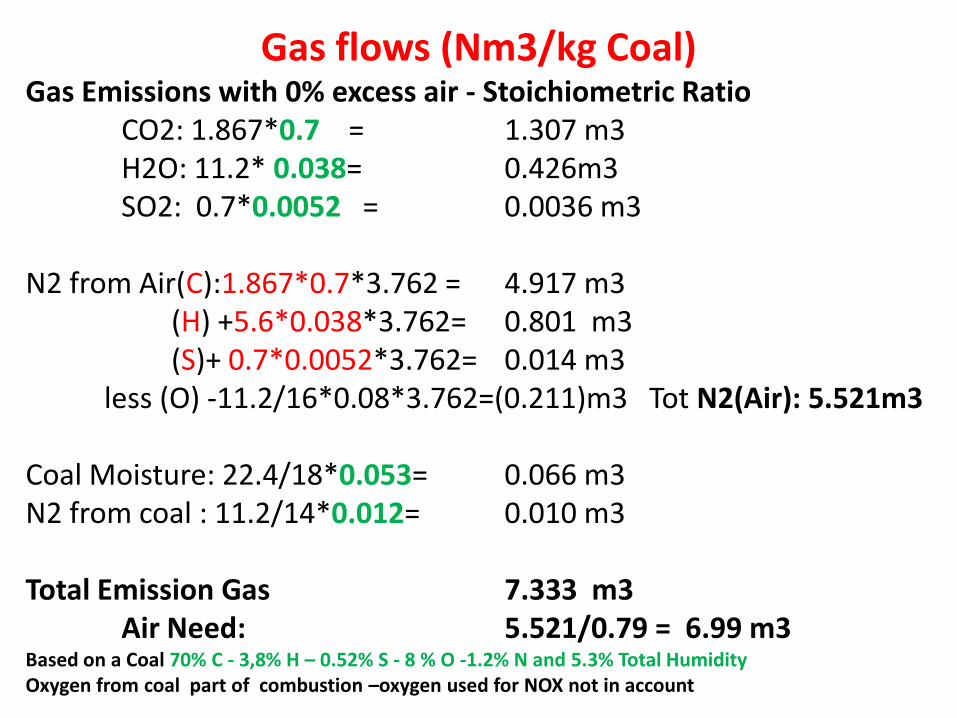
Gas flows (Nm3/kg Coal)Gas Emissions with 0% excess air - Stoichiometric Ratio
CO2: 1.867*0.7 = 1.307 m3H2O: 11.2* 0.038= 0.426m3SO2: 0.7*0.0052 = 0.0036 m3
N2 from Air(C):1.867*0.7*3.762 = 4.917 m3(H) +5.6*0.038*3.762= 0.801 m3(S)+ 0.7*0.0052*3.762= 0.014 m3
less (O) -11.2/16*0.08*3.762=(0.211)m3 Tot N2(Air): 5.521m3
Coal Moisture: 22.4/18*0.053= 0.066 m3N2 from coal : 11.2/14*0.012= 0.010 m3
Total Emission Gas 7.333 m3Air Need: 5.521/0.79 = 6.99 m3
Based on a Coal 70% C - 3,8% H – 0.52% S - 8 % O -1.2% N and 5.3% Total Humidity Oxygen from coal part of combustion –oxygen used for NOX not in account

INDICATIVE COAL QUALITY Range for usual Pulverized Process- PC- plants
Total Moisture Max 15 %
Ash Max 25/30 %
Volatile 10- 30 %
CV 20 to 28+ MJ/kg - (below 20 possible…)
Sulphur 0.05- 1.5%
Nitrogen Max 1.5/2%
Chlorine Max 0.2- 0.3 %
HGI Min 45-50 (Milling Energy)
Sizing 0-50 mm
Fines minus 3 mm Max 20/30 %
Minus 1 mm Max ( Moisture and Handling issues )
Ash Fusion AFT More than 1250/1300 DC
A wide range and flexible coal quality is acceptable
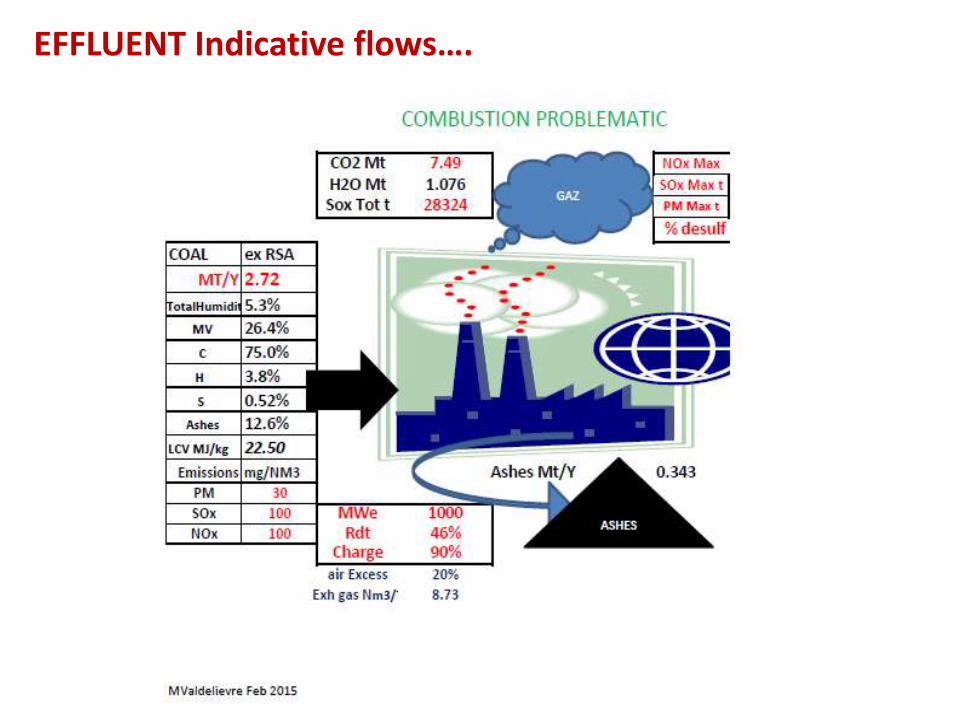
EFFLUENT Indicative flows….
Top Related