


Languages
Pages
Legal


CO2 Emissions from Freight TransportAn Analysis of UK Data
Professor Alan McKinnon
Logistics Research CentreHeriot-Watt University
EDINBURGH
LRN Conference 2007
University of Hull

Estimation Methods
• Input-based measures:
– top-down
– based on energy / fuel purchases
– sectoral - classified by dominant activity
• Output-based measures;
– bottom-up
– based on surveys of freight transport operations
– cross-sectoral
– multiply volume of freight movement by CO2 emission factor
tonne-kms x CO2 per tonne-km
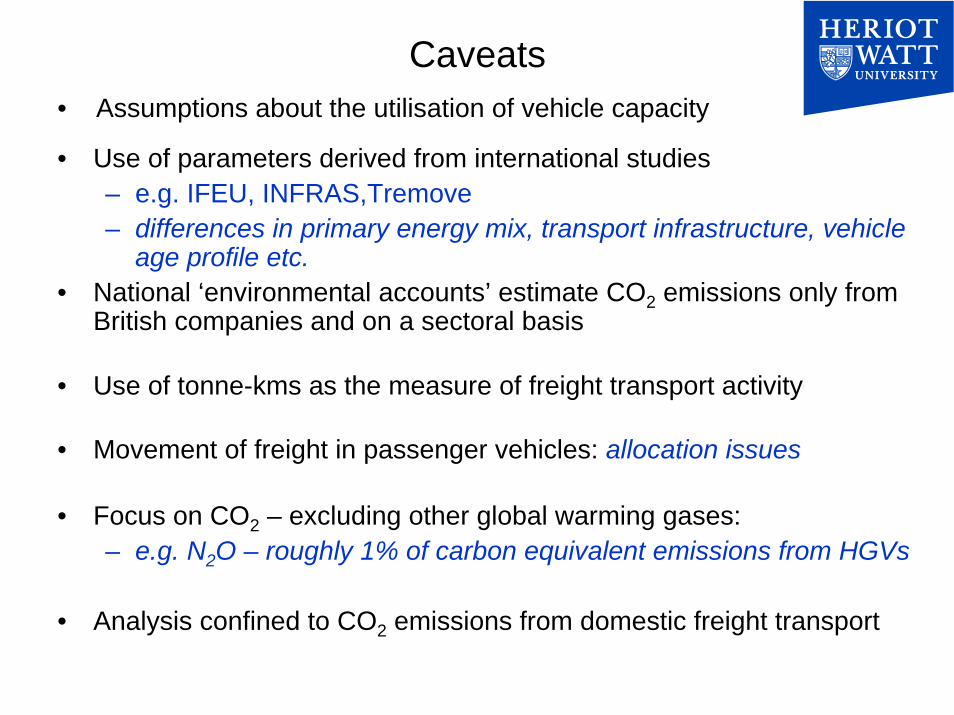
Caveats
• Use of parameters derived from international studies– e.g. IFEU, INFRAS,Tremove– differences in primary energy mix, transport infrastructure, vehicle
age profile etc.• National ‘environmental accounts’ estimate CO2 emissions only from
British companies and on a sectoral basis
• Use of tonne-kms as the measure of freight transport activity
• Movement of freight in passenger vehicles: allocation issues
• Focus on CO2 – excluding other global warming gases:– e.g. N2O – roughly 1% of carbon equivalent emissions from HGVs
• Analysis confined to CO2 emissions from domestic freight transport
• Assumptions about the utilisation of vehicle capacity
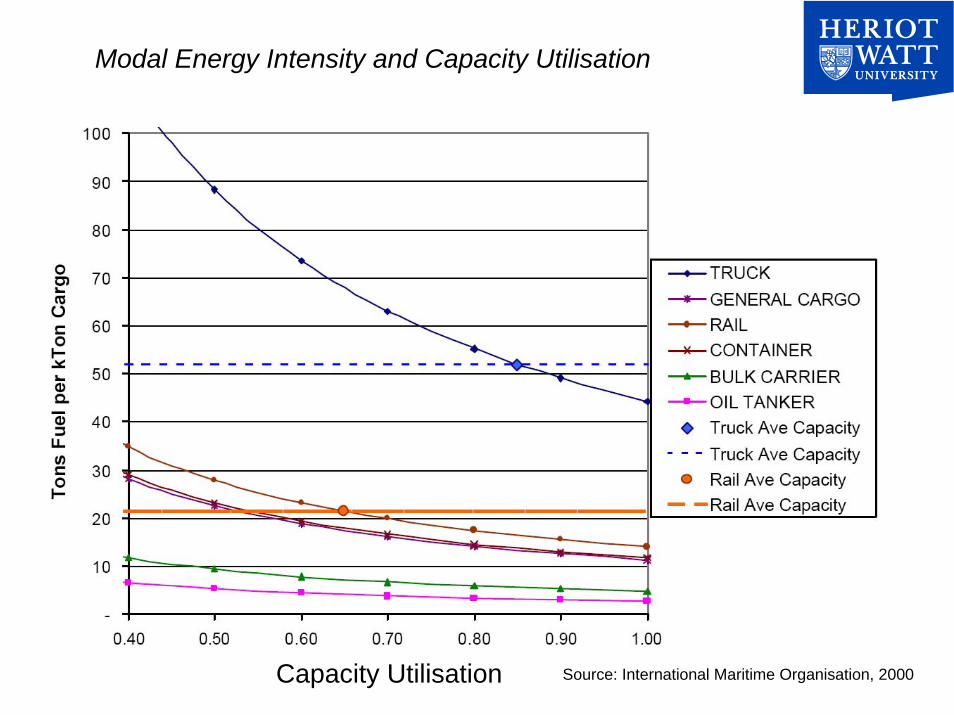
Source: International Maritime Organisation, 2000
Modal Energy Intensity and Capacity Utilisation
Capacity Utilisation

Off-shoring of Manufacturing and the Upstream Supply Chain
retail distribution centremain assembly plant
component supplier
warehouseprocessing plant
Export of carbon-generating activities reducing UK’s ‘carbon footprint’
Embedded carbon in imported products
UK contributing to the growth of freight-related CO2 emissions in exporting countries + growth of CO2 emissions from international transport

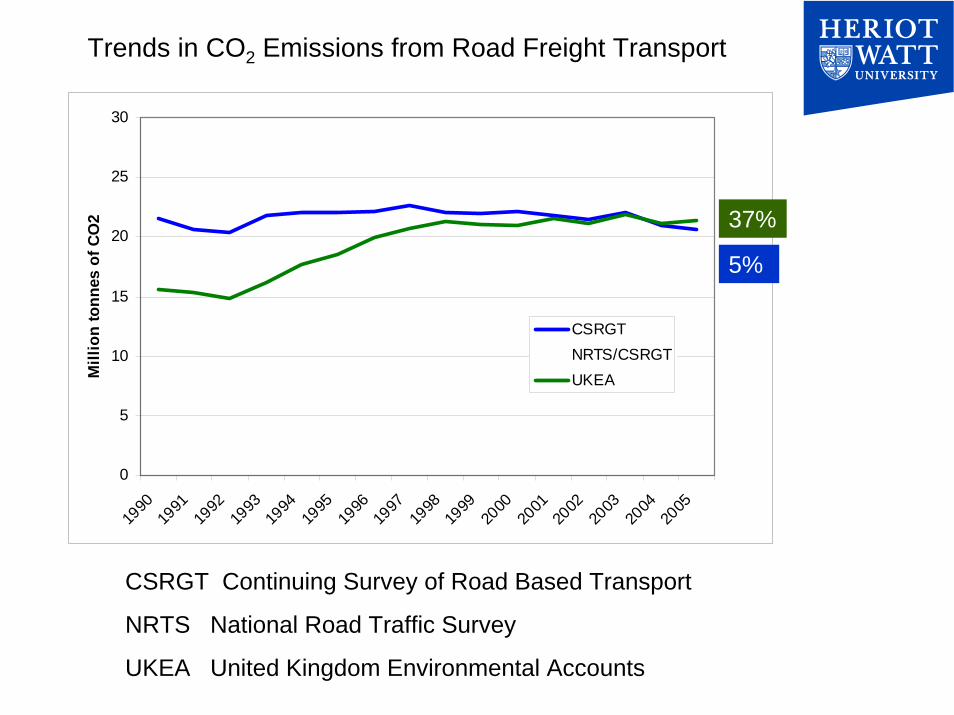
Trends in CO2 Emissions from Road Freight Transport
CSRGT Continuing Survey of Road Based Transport
NRTS National Road Traffic Survey
UKEA United Kingdom Environmental Accounts
0
5
10
15
20
25
30
1990
1991
1992
1993
1994
1995
1996
1997
1998
1999
2000
2001
2002
2003
2004
2005
Mill
ion
tonn
es o
f CO
2
CSRGTNRTS/CSRGTUKEA
37%
5%

Trends in CO2 Emissions from Road Freight Transport
CSRGT Continuing Survey of Road Based Transport
NRTS National Road Traffic Survey
UKEA United Kingdom Environmental Accounts
0
5
10
15
20
25
30
1990
1991
1992
1993
1994
1995
1996
1997
1998
1999
2000
2001
2002
2003
2004
2005
Mill
ion
tonn
es o
f CO
2
CSRGTNRTS/CSRGTUKEA
37%
-4%
5%
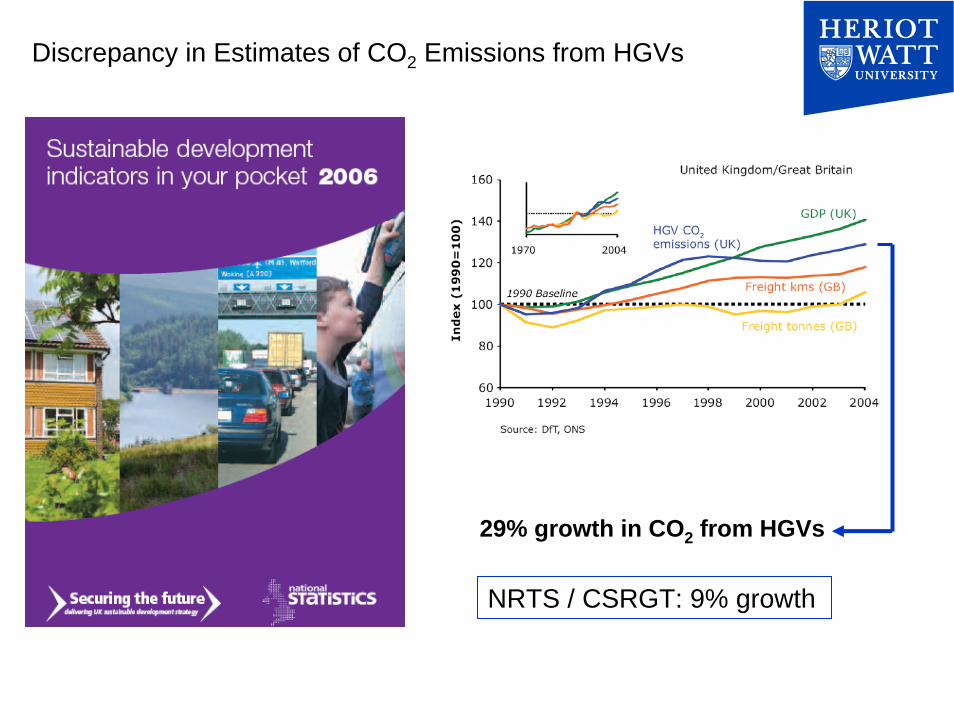
Discrepancy in Estimates of CO2 Emissions from HGVs
29% growth in CO2 from HGVs
NRTS / CSRGT: 9% growth

Road Traffic Growth in the UK 1990-2005
Source: Department for Transport
Growth of CO2 emissions
1997-2005
Cars = + 3.2%
Vans = + 24.4%(Source: SMMT)
80
90
100
110
120
130
140
150
160
170
1990 1992 1994 1996 1998 2000 2002 2004
Inde
x of
traf
fic g
row
th (1
990=
100) vans
HGVscars
No CO2 / km target for vans
EU target being considered

Vans
• Freight collections and deliveries + associated empty
running represents only 35% of total van-kms
• 10.7 bn tonne-kms of freight in 2004 6.6% of total
• Assuming average fuel efficiency of 12 km / litre for vans
• 242 gms of CO2 per tonne-km
• 2.6 million tonnes of CO2
• Not possible to monitor trends for freight-carrying vans

CO2 Emissions from Railfreight
National Atmospheric Emissions Inventory
0
200
400
600
800
1000
1200
1990 1991 1992 1993 1994 1995 1996 1997 1998 1999 2000 2001 2002 2003 2004
'000
tonn
es o
f CO
2

CO2 Emissions from Railfreight
0
200
400
600
800
1000
1200
1990
1991
1992
1993
1994
1995
1996
1997
1998
1999
2000
2001
2002
2003
2004
'000
tonn
es o
f CO
2
10
12
14
16
18
20
22
24
26
28
30
bn to
nne-
kms
CO2 ktonnesTonne-km bn
• Assumes fixed CO2 intensity: 49 gms of CO2 per tonne-km
• No allowance for improvements in fuel efficiency of railfreight operations
• Rail Emissions Model (2000) for SRA: 20 gms of CO2 per tonne-km
• EWS / DfT estimate – based on high load factors: 14.7 gms of CO2 per tonne-km
• Using 20 gms of CO2 per tonne-km: 420K tonnes of CO2 in 2004 (cf 1,012K)

Other Freight Transport Modes
• Coastal shipping (UK vessels): 97.5% of all waterborne tonne-kms30 gm of CO2 per tonne-km1.74 m tonnes of CO2
• Inland waterways: 2.5% of waterborne tonne-kms35 gm of CO2 per tonne-km53K tonnes of CO2
Airfreight (domestic): 29 million tonne-km 0.01% of all UK freight movement
bellyhold freight on passenger aircraft + freighters
average 1600 gm of CO2 per tonne-km
55K tonnes of CO2 (2 x global warming potential)
Pipeline: 11 bn tonne-km 8.2 gm of CO2 per tonne-km 90K tonnes of CO2

CO2 Emissions from Freight Transport in the UK (2004)
33.7 million tonnes of
CO2
20.6 million tonnes of CO2
Drax power station
6% of total UK CO2 emissions
21% of transport CO2 emissions
HGV 78.5%
Vans13.3%
Waterway6.8%
Rail 1.1%
Pipeline0.3%
Air0.1%
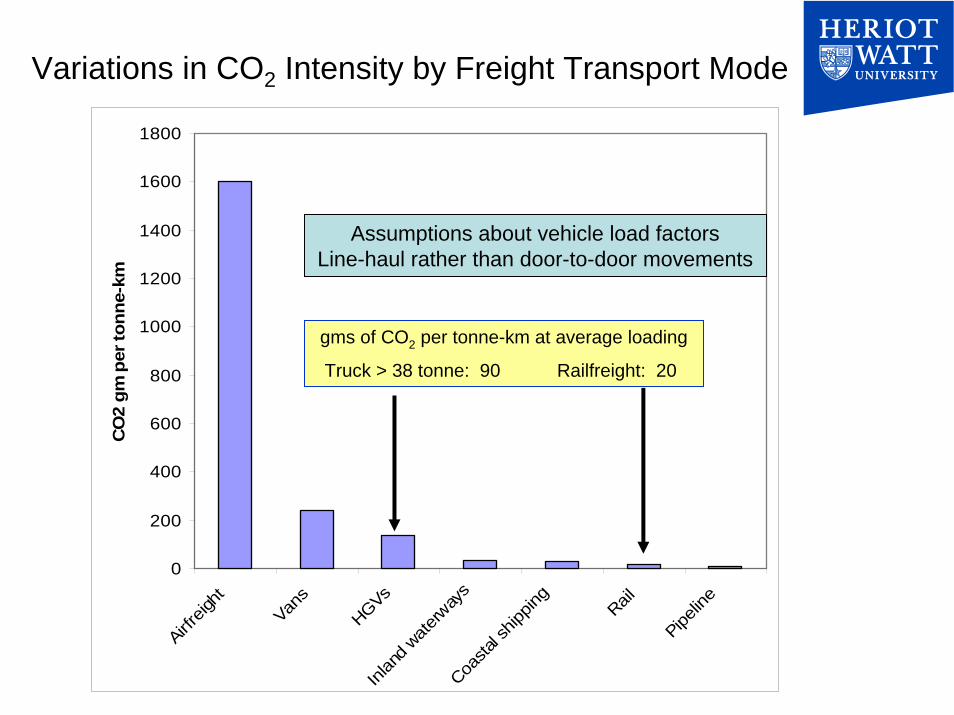
Variations in CO2 Intensity by Freight Transport Mode
0
200
400
600
800
1000
1200
1400
1600
1800
Airfreig
ht
Vans
HGVsInl
and w
aterw
ays
Coasta
l ship
ping
Rail
Pipelin
e
CO
2 gm
per
tonn
e-km
gms of CO2 per tonne-km at average loading
Truck > 38 tonne: 90 Railfreight: 20
Assumptions about vehicle load factorsLine-haul rather than door-to-door movements

Research undertaken for the Climate Change Working Group of the Commission for Integrated Transport
Publication of main report and briefing papers
12th September 2007
http://www.cfit.gov.uk/docs/2007/climatechange/index.htm
Logistics Research CentreHeriot-Watt University
EDINBURGH UK
A.C. [email protected]
http://www.sml.hw.ac.uk/logistics
Contact details
www.greenlogistics.org
Top Related