


Languages
Pages
Legal


_____________________________________________________________________
CAPITALAND MALL TRUST
2018 SECOND QUARTER UNAUDITED FINANCIAL STATEMENT AND DISTRIBUTION ANNOUNCEMENT
_____________________________________________________________________
TABLE OF CONTENTS
Item No. Description Page No.
- Summary of CMT Results 2
- Introduction 3
1(a) Statements of Total Return & Distribution Statements 4-9
1(b)(i) Statements of Financial Position 10-11
1(b)(ii) Aggregate Amount of Borrowings and Debt Securities 12
1(c) Statements of Cash Flow 13-14
1d(i) Statements of Movements in Unitholders’ Funds 15-16
1d(ii) Details of Any Change in the Units 17
2 & 3 Audit Statement 17
4 & 5 Changes in Accounting Policies 17-18
6 Earnings Per Unit and Distribution Per Unit 19
7 Net Asset Value / Net Tangible Asset Per Unit 20
8 Review of the Performance 21-22
9 Variance from Previous Forecast / Prospect Statement 22
10 Outlook & Prospects 22
11 & 12 Distributions 23-24
13 Interested Person Transactions 24
14 Confirmation Pursuant to Rule 720(1) of the Listing Manual 24
15 Confirmation Pursuant to Rule 705(5) of the Listing Manual 24

CAPITALAND MALL TRUST 2018 SECOND QUARTER UNAUDITED FINANCIAL STATEMENT & DISTRIBUTION ANNOUNCEMENT
_____________________________________________________________________
Page 2 of 24
Summary of CMT Results
FY 2016 FY 2017
2018
1 January to 31 March
1 April to 30 June
Actual Actual Actual Actual
Gross Revenue (S$’000) 689,732 682,469 175,164 171,366
Net Property Income (S$’000) 479,679 478,234 125,651 120,792
Amount Available for Distribution (S$’000) 424,368 413,003 109,081 104,633
Distributable Income (S$’000) 394,3231 395,8242 98,9633 100,0334
Distribution Per Unit (“DPU”) (cents)
For the period 11.13¢ 11.16¢ 2.78¢ 2.81¢
Annualised 11.13¢ 11.16¢ 11.27¢ 11.27¢
Footnotes:
1. Capital distribution and tax-exempt income distribution of S$12.9 million received from CapitaLand Retail
China Trust (“CRCT”) in FY 2016 had been retained for general corporate and working capital purposes. Following the completion of the sale of the office strata units of Westgate Tower on 20 October 2016, CapitaLand Mall Trust (“CMT”) received S$17.1 million of capital distribution from Infinity Office Trust (“IOT”), which had also been retained for general corporate and working capital purposes.
2. Capital distribution and tax-exempt income distribution of S$17.2 million, including advanced distribution of tax-exempt income of S$4.8 million for the period 1 July 2017 to 6 December 2017, received from CRCT in FY 2017 had been retained for general corporate and working capital purposes.
3. CMT is committed to distribute 100% of its taxable income available for distribution to Unitholders for the financial year ending 31 December 2018. For 1Q 2018, CMT has retained S$9.1 million of its taxable income available for distribution to Unitholders for distribution in FY 2018. Capital distribution and tax-exempt income distribution of S$1.0 million received from CRCT in respect of the period 7 December 2017 to 31 December 2017 had also been retained for general corporate and working capital purposes.
4. In 2Q 2018, CMT had retained S$4.6 million of its taxable income available for distribution to Unitholders for distribution in FY 2018.
DISTRIBUTION & BOOKS CLOSURE DATE
Distribution For 1 April 2018 to 30 June 2018
Distribution type Taxable income
Distribution rate Taxable income distribution of 2.81 cents per Unit
Books closure date 30 July 2018
Payment date 29 August 2018

CAPITALAND MALL TRUST 2018 SECOND QUARTER UNAUDITED FINANCIAL STATEMENT & DISTRIBUTION ANNOUNCEMENT
_____________________________________________________________________
Page 3 of 24
INTRODUCTION
CMT was constituted under a trust deed dated 29 October 2001 entered into between CapitaLand Mall Trust Management Limited (as manager of CMT) (the “Manager”) and HSBC Institutional Trust Services (Singapore) Limited (as trustee of CMT) (the “Trustee”), as amended.
CMT is the first Real Estate Investment Trust (“REIT”) listed on Singapore Exchange Securities Trading Limited (the “SGX–ST”) in July 2002.
The principal activity of CMT is to own and invest in quality income producing real estate, which is used or substantially used for retail purposes with the primary objective of achieving an attractive level of return from rental income and for long term capital growth.
CMT’s current portfolio comprises 15 shopping malls which are strategically located in the suburban areas and downtown core of Singapore - Tampines Mall, Junction 8 Shopping Centre, Funan (which was closed in July 2016 for redevelopment), IMM Building (“IMM”), Plaza Singapura, Bugis Junction, JCube, a 40.0% stake in Raffles City Singapore (“RCS”) held through RCS Trust, Lot One Shoppers’ Mall, 90 out of 91 strata lots in Bukit Panjang Plaza, The Atrium@Orchard, Clarke Quay, Bugis+, a 30.0% stake in Westgate held through Infinity Mall Trust (“IMT”) and Bedok Mall held through Brilliance Mall Trust (“BMT”).
In relation to the redevelopment of Funan, three private trusts, namely Victory Office 1 Trust (“VO1T”), Victory Office 2 Trust (“VO2T”) and Victory SR Trust (“VSRT”) (collectively, the “Victory Trusts”) were constituted on 30 August 2016 by CMT. CMT, together with Victory Trusts, jointly own and undertake to redevelop Funan which comprises a retail component (held through CMT), two office towers and serviced residences.
On 31 October 2017, CMT divested all of the units held in VSRT, which holds the serviced residence component of Funan, to Victory SR Pte. Ltd.
As at 30 June 2018, CMT owns approximately 12.7% interest in CRCT, the first China shopping mall REIT listed on the SGX-ST in December 2006.
On 18 April 2018, the Trustee entered into a sale and purchase agreement to sell its investment property, Sembawang Shopping Centre, to Lian Beng – Apricot (Sembawang) Pte. Ltd. for a total consideration of S$248.0 million. The sale of Sembawang Shopping Centre (the “Sale”) was completed on 18 June 2018 and the net proceeds from the Sale had been used to repay the existing bank borrowings of CMT in June 2018.
On 9 May 2018, CMT MTN Pte. Ltd. (“CMT MTN”), a wholly owned subsidiary of CMT, issued fixed rate notes of S$130.0 million due 9 November 2023 through its S$3.5 billion Multicurrency Medium Term Note Programme (“MTN Programme”) at 3.2115% per annum. The proceeds from this issuance had been used to repay the existing bank borrowings of CMT.

CAPITALAND MALL TRUST 2018 SECOND QUARTER UNAUDITED FINANCIAL STATEMENT & DISTRIBUTION ANNOUNCEMENT
_____________________________________________________________________
Page 4 of 24
1(a)(i) Statements of Total Return and Distribution Statements (2Q 2018 vs 2Q 2017)
Group Trust
Statements of Total Return 2Q 2018 2Q 2017 % 2Q 2018 2Q 2017 %
S$’000 S$’000 Change S$’000 S$’000 Change
Gross rental income 156,818 155,441 0.9 143,854 143,143 0.5
Car park income 5,031 4,793 5.0 4,577 4,793 (4.5)
Other income 9,517 8,405 13.2 8,874 7,904 12.3
Gross revenue 171,366 168,639 1.6 157,305 155,840 0.9
Property management fees (6,481) (6,409) 1.1 (5,989) (5,918) 1.2
Property tax (14,441) (14,751) (2.1) (13,155) (13,540) (2.8)
Other property operating expenses 1 (29,652) (29,928) (0.9) (27,459) (27,546) (0.3)
Property operating expenses (50,574) (51,088) (1.0) (46,603) (47,004) (0.9)
Net property income 120,792 117,551 2.8 110,702 108,836 1.7
Interest income 2 2,358 2,295 2.7 7,334 7,028 4.4
Investment income 3 - - - 19,105 19,709 (3.1)
Management fees (10,853) (11,170) (2.8) (9,814) (10,123) (3.1)
Trust expenses (1,019) (1,216) (16.2) (939) (1,098) (14.5)
Finance costs (24,110) (26,053) (7.5) (24,277) (26,100) (7.0)
Net income before share of results of associate and joint ventures
87,168 81,407 7.1 102,111 98,252 3.9
Share of results (net of tax) of:
- Associate 4 2,272 2,688 (15.5) - - -
- Joint ventures 5 31,355 10,789 NM - - -
Net income 120,795 94,884 27.3 102,111 98,252 3.9
Net change in fair value of investment properties
55,490 207,541 (73.3) 54,469 206,810 (73.7)
Net change in fair value of investment properties under development
(138) - NM (138) - NM
Gain on disposal of investment property 6
119,734 - NM 119,734 - NM
Impairment loss written back/(recognised) 7
- - - 9,971 (28,457) NM
Dilution (loss)/gain of interest in associate
(8) 73 NM - - -
Total return for the period before taxation
295,873 302,498 (2.2) 286,147 276,605 3.4
Taxation - - - - - -
Total return for the period 295,873 302,498 (2.2) 286,147 276,605 3.4
Distribution Statements
Net income before share of results of associate and joint ventures
87,168 81,407 7.1 102,111 98,252 3.9
Net effect of non-tax deductible items 8
2,523 1,495 68.8 2,522 1,457 73.1
Distributions from joint ventures 9 14,462 16,024 (9.7) - - -
Rollover adjustment 10 274 129 NM - 129 NM
Net loss from subsidiaries 11 206 783 (73.7) - - -
Amount available for distribution to Unitholders
104,633 99,838 4.8 104,633 99,838 4.8
Distributable income to Unitholders 12
100,033 97,238 2.9 100,033 97,238 2.9

CAPITALAND MALL TRUST 2018 SECOND QUARTER UNAUDITED FINANCIAL STATEMENT & DISTRIBUTION ANNOUNCEMENT
_____________________________________________________________________
Page 5 of 24
Footnotes:
1. Included as part of the other property operating expenses are the following:
Group Trust
2Q 2018 2Q 2017 % 2Q 2018 2Q 2017 %
S$’000 S$’000 Change S$’000 S$’000 Change
Depreciation and amortisation 129 179 (27.9) 125 175 (28.6)
Allowance for doubtful debts and bad debts written off
31 - NM 27 - NM
2. At Group level, it includes interest income on the unitholders’ loans extended to IMT. At Trust level, it includes
interest income on the unitholders’ loans to BMT, VO1T, VO2T and IMT for 2Q 2018 and interest income from BMT, the Victory Trusts and IMT for 2Q 2017.
3. Investment income relates to distributions from BMT, RCS Trust and IMT.
4. Share of result of associate relates to the equity accounting of CRCT’s result on a 3-month lag basis.
5. This relates to the Group’s 40.0% interest in RCS Trust and 30.0% interest in IMT and IOT (collectively, the
“Infinity Trusts”). Details are as follows:
Group
2Q 2018 2Q 2017 %
S$’000 S$’000 Change
Share of results (net of tax) of joint ventures
- Gross revenue 28,118 28,242 (0.4)
- Property operating expenses (7,132) (7,225) (1.3)
- Net property income 20,986 21,017 (0.1)
- Finance costs (5,454) (4,581) 19.1
- Net change in fair value of investment properties 17,726 (4,063) NM
- Others (A) (1,903) (1,584) 20.1
31,355 10,789 NM
(A) Included management fees.
6. This relates to gain arising from the disposal of Sembawang Shopping Centre which was completed on 18 June
2018.
7. In 2Q 2018, this relates to write back of impairment loss in respect of CMT’s interest in BMT and IMT. In 2Q 2017, this relates to impairment loss in respect of CMT’s interest in IMT, partially offset by write back of impairment loss in respect of CMT’s interest in BMT.

CAPITALAND MALL TRUST 2018 SECOND QUARTER UNAUDITED FINANCIAL STATEMENT & DISTRIBUTION ANNOUNCEMENT
_____________________________________________________________________
Page 6 of 24
8. Included in the non-tax deductible items are the following:
Group Trust
2Q 2018 2Q 2017 % 2Q 2018 2Q 2017 %
S$’000 S$’000 Change S$’000 S$’000 Change
Non-tax deductible items
- Trustee’s fees 311 314 (1.0) 311 314 (1.0)
- Temporary differences and other adjustments
2,212 1,181 87.3 2,211 1,143 93.4
Net effect of non-tax deductible items
2,523 1,495 68.8 2,522 1,457 73.1
9. Distributions from joint ventures relate to CMT’s 40.0% interest in RCS Trust and 30.0% interest in IMT.
10. For 2Q 2018, this is the difference between taxable income previously distributed by BMT and the quantum
finally agreed with Inland Revenue Authority of Singapore (“IRAS”) for year of assessment (“YA”) 2016 and 2017. For 2Q 2017, this is the difference between taxable income previously distributed by CMT and the quantum finally agreed with IRAS for YA 2014 and 2015.
11. For 2Q 2018, this relates to CMT MTN, VO1T and VO2T. For 2Q 2017, this relates to CMT MTN and the Victory Trusts.
12. CMT is committed to distribute 100% of its taxable income available for distribution to Unitholders for the financial year ending 31 December 2018. For 2Q 2018, CMT had retained S$4.6 million of its taxable income available for distribution to Unitholders for distribution in FY 2018. In 2Q 2017, CMT had retained S$2.6 million of its taxable income available for distribution to Unitholders for distribution in FY 2017.
NM – not meaningful

CAPITALAND MALL TRUST 2018 SECOND QUARTER UNAUDITED FINANCIAL STATEMENT & DISTRIBUTION ANNOUNCEMENT
_____________________________________________________________________
Page 7 of 24
1(a)(i) Statements of Total Return and Distribution Statements (1H 2018 vs 1H 2017)
Group Trust
Statements of Total Return 1H 2018 1H 2017 % 1H 2018 1H 2017 %
S$’000 S$’000 Change S$’000 S$’000 Change
Gross rental income 318,546 314,863 1.2 292,697 289,069 1.3
Car park income 10,154 9,474 7.2 9,242 9,474 (2.4)
Other income 17,830 16,325 9.2 16,593 15,439 7.5
Gross revenue 346,530 340,662 1.7 318,532 313,982 1.4
Property management fees (13,223) (12,983) 1.8 (12,192) (11,946) 2.1
Property tax (29,544) (29,736) (0.6) (26,971) (27,280) (1.1)
Other property operating expenses 1 (57,320) (60,332) (5.0) (52,864) (55,042) (4.0)
Property operating expenses (100,087) (103,051) (2.9) (92,027) (94,268) (2.4)
Net property income 246,443 237,611 3.7 226,505 219,714 3.1
Interest income 2 4,454 4,560 (2.3) 14,320 13,911 2.9
Investment income 3 - - - 39,261 45,263 (13.3)
Management fees (21,874) (22,304) (1.9) (19,807) (20,182) (1.9)
Trust expenses (2,003) (2,264) (11.5) (1,872) (2,109) (11.2)
Finance costs (48,492) (51,771) (6.3) (48,757) (51,818) (5.9)
Net income before share of results of associate and joint ventures
178,528 165,832 7.7 209,650 204,779 2.4
Share of results (net of tax) of:
- Associate 4 6,406 7,277 (12.0) - - -
- Joint Ventures 5 45,959 25,841 77.9 - - -
Net income 230,893 198,950 16.1 209,650 204,779 2.4
Net change in fair value of investment properties
55,490 207,541 (73.3) 54,469 206,810 (73.7)
Net change in fair value of investment properties under development
(138) - NM (138) - NM
Gain on disposal of investment property 6
119,734 - NM 119,734 - NM
Impairment loss written back/(recognised) 7
- - - 9,971 (28,457) NM
Dilution gain/(loss) of interest in associate
349 (561) NM - - -
Total return for the period before taxation
406,328 405,930 0.1 393,686 383,132 2.8
Taxation - - - - - -
Total return for the period 406,328 405,930 0.1 393,686 383,132 2.8
Distribution Statements
Net income before share of results of associate and joint ventures
178,528 165,832 7.7 209,650 204,779 2.4
Net effect of non-tax deductible items 8
4,069 2,750 48.0 4,064 2,707 50.1
Distributions from associate 1,018 5,804 (82.5) - - -
Distributions from joint ventures 9 29,208 30,859 (5.4) - - -
Rollover adjustment 10 274 129 NM - 129 NM
Net loss from subsidiaries 11 617 2,241 (72.5) - - -
Amount available for distribution to Unitholders
213,714 207,615 2.9 213,714 207,615 2.9
Distributable income to Unitholders 12
198,996 194,211 2.5 198,996 194,211 2.5
CAPITALAND MALL TRUST 2018 SECOND QUARTER UNAUDITED FINANCIAL STATEMENT & DISTRIBUTION ANNOUNCEMENT
_____________________________________________________________________
Page 8 of 24
Footnotes:
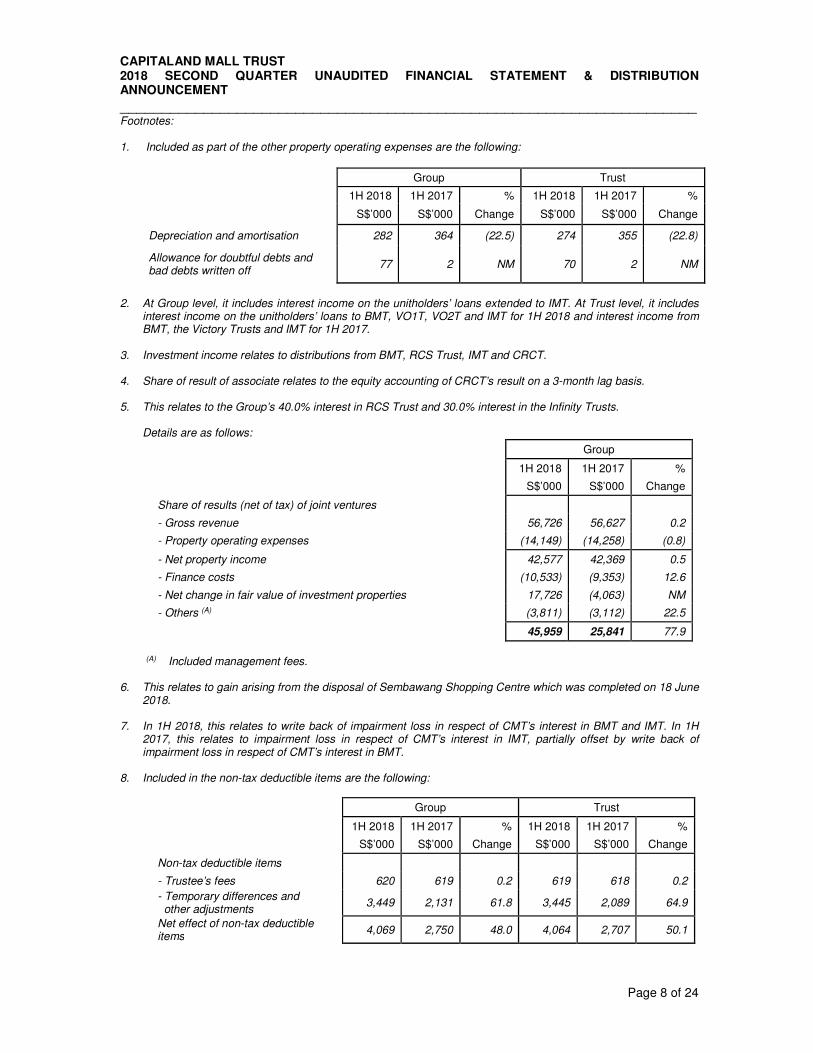
1. Included as part of the other property operating expenses are the following:
Group Trust
1H 2018 1H 2017 % 1H 2018 1H 2017 %
S$’000 S$’000 Change S$’000 S$’000 Change
Depreciation and amortisation 282 364 (22.5) 274 355 (22.8)
Allowance for doubtful debts and bad debts written off
77 2 NM 70 2 NM
2. At Group level, it includes interest income on the unitholders’ loans extended to IMT. At Trust level, it includes
interest income on the unitholders’ loans to BMT, VO1T, VO2T and IMT for 1H 2018 and interest income from BMT, the Victory Trusts and IMT for 1H 2017.
3. Investment income relates to distributions from BMT, RCS Trust, IMT and CRCT.
4. Share of result of associate relates to the equity accounting of CRCT’s result on a 3-month lag basis.
5. This relates to the Group’s 40.0% interest in RCS Trust and 30.0% interest in the Infinity Trusts.
Details are as follows:
Group
1H 2018 1H 2017 %
S$’000 S$’000 Change
Share of results (net of tax) of joint ventures
- Gross revenue 56,726 56,627 0.2
- Property operating expenses (14,149) (14,258) (0.8)
- Net property income 42,577 42,369 0.5
- Finance costs (10,533) (9,353) 12.6
- Net change in fair value of investment properties 17,726 (4,063) NM
- Others (A) (3,811) (3,112) 22.5
45,959 25,841 77.9
(A) Included management fees.
6. This relates to gain arising from the disposal of Sembawang Shopping Centre which was completed on 18 June
2018.
7. In 1H 2018, this relates to write back of impairment loss in respect of CMT’s interest in BMT and IMT. In 1H 2017, this relates to impairment loss in respect of CMT’s interest in IMT, partially offset by write back of impairment loss in respect of CMT’s interest in BMT.
8. Included in the non-tax deductible items are the following:
Group Trust
1H 2018 1H 2017 % 1H 2018 1H 2017 %
S$’000 S$’000 Change S$’000 S$’000 Change
Non-tax deductible items
- Trustee’s fees 620 619 0.2 619 618 0.2
- Temporary differences and other adjustments
3,449 2,131 61.8 3,445 2,089 64.9
Net effect of non-tax deductible items
4,069 2,750 48.0 4,064 2,707 50.1

CAPITALAND MALL TRUST 2018 SECOND QUARTER UNAUDITED FINANCIAL STATEMENT & DISTRIBUTION ANNOUNCEMENT
_____________________________________________________________________
Page 9 of 24
9. Distributions from joint ventures relate to CMT’s 40.0% interest in RCS Trust and 30.0% interest in IMT.
10. For 1H 2018, this is the difference between taxable income previously distributed by BMT and the quantum finally agreed with IRAS for YA 2016 and 2017. For 1H 2017, this is the difference between taxable income previously distributed by CMT and the quantum finally agreed with IRAS for YA 2014 and 2015.
11. For 1H 2018, this relates to CMT MTN, VO1T and VO2T. For 1H 2017, this relates to CMT MTN and the Victory Trusts.
12. CMT is committed to distribute 100% of its taxable income available for distribution to Unitholders for the financial year ending 31 December 2018. For 1H 2018, CMT had retained S$13.7 million of its taxable income available for distribution to Unitholders for distribution in FY 2018. Capital distribution and tax-exempt income distribution of S$1.0 million received from CRCT in respect of the period 7 December 2017 to 31 December 2017 had also been retained for general corporate and working capital purposes.
For 1H 2017, CMT had retained S$7.6 million of its taxable income available for distribution to Unitholders for distribution in FY 2017. Capital distribution and tax-exempt income distribution of S$5.8 million received from CRCT in 1Q 2017 had also been retained for general corporate and working capital purposes.
NM – not meaningful

CAPITALAND MALL TRUST 2018 SECOND QUARTER UNAUDITED FINANCIAL STATEMENT & DISTRIBUTION ANNOUNCEMENT
_____________________________________________________________________
Page 10 of 24
1(b)(i) Statements of Financial Position
As at 30 Jun 2018 vs 31 Dec 2017
Group Trust
30 Jun
2018 31 Dec
2017 %
30 Jun 2018
31 Dec 2017
%
S$’000 S$’000 Change S$’000 S$’000 Change
Non-current assets
Plant & equipment 1,906 2,120 (10.1) 1,462 1,676 (12.8)
Investment properties 1 8,248,000 8,311,000 (0.8) 7,466,000 7,530,000 (0.8)
Investment properties under development 2
533,848 459,386 16.2 357,125 308,808 15.6
Interest in subsidiaries 3 - - - 941,154 935,958 0.6
Interest in associate 4 204,608 194,389 5.3 130,836 130,836 -
Interest in joint ventures 5 960,443 937,895 2.4 721,865 708,194 1.9
Financial derivatives 6 27,604 14,953 84.6 - - -
Other assets 137 137 - 137 137 -
Total non-current assets 9,976,546 9,919,880 0.6 9,618,579 9,615,609 0.0
Current assets
Trade & other receivables 25,931 32,399 (20.0) 28,850 32,738 (11.9)
Cash & cash equivalents 347,668 522,745 (33.5) 331,674 491,871 (32.6)
Financial derivatives 6 - 29,418 NM - - -
Total current assets 373,599 584,562 (36.1) 360,524 524,609 (31.3)
Total assets 10,350,145 10,504,442 (1.5) 9,979,103 10,140,218 (1.6)
Current liabilities
Trade & other payables 137,780 155,588 (11.4) 119,342 139,717 (14.6)
Current portion of security deposits
60,257 57,619 4.6 57,242 54,317 5.4
Short-term borrowings 7 - 534,692 NM - 505,132 NM
Provision for taxation 452 302 49.7 - 159 NM
Total current liabilities 198,489 748,201 (73.5) 176,584 699,325 (74.7)
Non-current liabilities
Financial derivatives 6 55,761 77,013 (27.6) - - -
Long-term borrowings 8 2,836,999 2,648,409 7.1 2,842,519 2,681,705 6.0
Non-current portion of security deposits
98,555 98,113 0.5 87,176 87,509 (0.4)
Other payables 10,905 4,661 NM 8,494 3,992 NM
Total non-current liabilities
3,002,220 2,828,196 6.2 2,938,189 2,773,206 5.9
Total liabilities 3,200,709 3,576,397 (10.5) 3,114,773 3,472,531 (10.3)
Net assets 7,149,436 6,928,045 3.2 6,864,330 6,667,687 2.9
Unitholders’ funds 7,149,436 6,928,045 3.2 6,864,330 6,667,687 2.9

CAPITALAND MALL TRUST 2018 SECOND QUARTER UNAUDITED FINANCIAL STATEMENT & DISTRIBUTION ANNOUNCEMENT
_____________________________________________________________________
Page 11 of 24
Footnotes:
1. Investment properties are stated at valuations performed by independent professional valuers as at 30 June 2018.
2. Investment properties under development refer to Funan which is undergoing redevelopment into an integrated
development. The carrying amount reflects the valuation of the total land value as at 30 June 2018 and the capital expenditure capitalised.
3. Interests in subsidiaries refer to cost of investments in BMT, CMT MTN, VO1T and VO2T (including the unitholders’ loans to subsidiaries).
4. Interest in associate consists of investment in CRCT. Aggregate investment in CRCT amounts to 122,705,000 units in CRCT at cost of S$130.8 million.
5. These relate to 40.0% interest in RCS Trust and 30.0% interest in Infinity Trusts (including the unitholders’ loans to IMT).
6. Financial derivative assets and liabilities as at 30 June 2018 relate to fair value of the cross currency swaps.
7. On 21 March 2018, the Group has repaid the Euro-Medium Term Note (“EMTN”) of US$400.0 million issued
under its US$3.0 billion EMTN Programme.
8. These relate mainly to the fixed and floating rates notes issued by CMT MTN through its US$3.0 billion EMTN Programme and S$3.5 billion MTN Programme, the S$350.0 million 7-year retail bonds issued under the S$3.5 billion retail bond programme by CMT as well as unsecured bank borrowings.
NM – not meaningful

CAPITALAND MALL TRUST 2018 SECOND QUARTER UNAUDITED FINANCIAL STATEMENT & DISTRIBUTION ANNOUNCEMENT
_____________________________________________________________________
Page 12 of 24
1(b)(ii) Aggregate Amount of Borrowings and Debt Securities
Group Trust
30 Jun 2018 31 Dec 2017 30 Jun 2018 31 Dec 2017
S$’000 S$’000 S$’000 S$’000
Unsecured borrowings
Amount repayable after one year 2,841,911 2,653,588 2,847,431 2,686,884
Less: Unamortised transaction costs (4,912) (5,179) (4,912) (5,179)
2,836,999 2,648,409 2,842,519 2,681,705
Amount repayable within one year - 534,760 - 505,200
Less: Unamortised transaction costs - (68) - (68)
- 534,692 - 505,132
Total unsecured borrowings 2,836,999 3,183,101 2,842,519 3,186,837
All 13 properties wholly owned, directly and indirectly held by CMT are unencumbered. For information only As at 30 June 2018, CMT’s 40.0% share of RCS Trust’s and 30.0% share of IMT’s aggregate amount of borrowings are as follows:
For information only
30 Jun 2018 31 Dec 2017
S$’000 S$’000
Secured borrowings
Amount repayable after one year 162,000 162,000
Less: Unamortised transaction costs (235) (325)
Total secured borrowings 1 161,765 161,675
Unsecured borrowings
Amount repayable after one year 354,400 352,400
Less: Unamortised transaction costs (688) (689)
353,712 351,711
Amount repayable within one year 99,933 99,948
Total unsecured borrowings 2 453,645 451,659
Grand Total 615,410 613,334
Footnotes:
1. Relates to CMT’s 30.0% share of IMT’s aggregate amount of borrowings.
2. Relates to CMT’s 40.0% share of RCS Trust’s aggregate amount of borrowings.

CAPITALAND MALL TRUST 2018 SECOND QUARTER UNAUDITED FINANCIAL STATEMENT & DISTRIBUTION ANNOUNCEMENT
_____________________________________________________________________
Page 13 of 24
1(c) Statements of Cash Flow (2Q 2018 vs 2Q 2017)
Group
2Q 2018 2Q 2017
S$’000 S$’000
Operating activities
Net Income 120,795 94,884
Adjustments for:
Interest income (2,358) (2,295)
Finance costs 24,110 26,053
Depreciation and amortisation 129 179
Allowance for doubtful debts and bad debts written off 31 -
Share of result of associate (2,272) (2,688)
Share of results of joint ventures (31,355) (10,789)
Operating income before working capital changes 109,080 105,344
Changes in working capital:
Trade and other receivables 4,275 (601)
Trade and other payables 4,413 5,728
Security deposits 4,438 1,554
Cash flows from operating activities 122,206 112,025
Investing activities
Interest received 2,254 3,076
Distributions received from joint ventures 14,747 14,834
Capital expenditure on investment properties (3,920) (8,156)
Capital expenditure on investment properties under development (32,945) (21,725)
Purchase of plant and equipment (22) (101)
Proceeds from disposal of plant and equipment 9 1
Proceeds from disposal of investment property 1 242,909 -
Cash flows from/(used in) investing activities 223,032 (12,071)
Financing activities
Payment of issue and financing expenses (236) (553)
Proceeds from interest bearing loans and borrowings 163,400 16,300
Repayment of interest bearing loans and borrowings (386,464) -
Distribution paid to Unitholders 2 (98,638) (96,778)
Interest paid (16,517) (13,191)
Cash flows used in financing activities (338,455) (94,222)
Increase in cash and cash equivalents 6,783 5,732
Cash and cash equivalents at beginning of the period 340,885 502,008
Cash and cash equivalents at end of the period 347,668 507,740
Footnote:
1. The net proceeds from the sale of Sembawang Shopping Centre had been used to repay the bank borrowings of CMT in June 2018.
2. Distributions for 2Q 2018 is for the period from 1 January 2018 to 31 March 2018 paid in May 2018. Distributions for 2Q 2017 is for the period from 1 January 2017 to 31 March 2017 paid in May 2017.

CAPITALAND MALL TRUST 2018 SECOND QUARTER UNAUDITED FINANCIAL STATEMENT & DISTRIBUTION ANNOUNCEMENT
_____________________________________________________________________
Page 14 of 24
1 (c) Statements of Cash Flow (1H 2018 vs 1H 2017)
Group
1H 2018 1H 2017
S$’000 S$’000
Operating activities
Net Income 230,893 198,950
Adjustments for:
Interest income (4,454) (4,560)
Finance costs 48,492 51,771
Assets written off - 1
Gain on disposal of plant and equipment - (2)
Depreciation and amortisation 282 364
Allowance for doubtful debts and bad debts written off 77 2
Share of result of associate (6,406) (7,277)
Share of results of joint ventures (45,959) (25,841)
Operating income before working capital changes 222,925 213,408
Changes in working capital:
Trade and other receivables 5,756 (1,116)
Trade and other payables (15,234) (13,625)
Security deposits 6,032 2,662
Income tax refunded/(paid) 150 (1,026)
Cash flows from operating activities 219,629 200,303
Investing activities
Interest received 2,727 4,172
Distributions received from associate 1,018 5,804
Distributions received from joint ventures 31,686 31,582
Capital expenditure on investment properties (11,959) (17,655)
Capital expenditure on investment properties under development (61,831) (29,194)
Purchase of plant and equipment (68) (343)
Proceeds from disposal of plant and equipment 9 3
Proceeds from disposal of investment property 1 242,909 -
Cash flows from/(used in) investing activities 204,491 (5,631)
Financing activities
Payment of issue and financing expenses (656) (927)
Proceeds from interest bearing loans and borrowings 675,000 181,200
Repayment of interest bearing loans and borrowings (1,019,654) (100,000)
Distributions paid to Unitholders 2 (201,484) (198,818)
Interest paid (52,403) (51,849)
Cash flows used in financing activities (599,197) (170,394)
(Decrease)/increase in cash and cash equivalents (175,077) 24,278
Cash and cash equivalents at beginning of the year 522,745 483,462
Cash and cash equivalents at end of the period 347,668 507,740
Footnote:
1. The net proceeds from the sale of Sembawang Shopping Centre had been used to repay the bank
borrowings of CMT in June 2018.
2. Distributions for 1H 2018 is for the period from 1 October 2017 to 31 December 2017 and 1 January 2018 to 31 March 2018 paid in February 2018 and May 2018 respectively. Distributions for 1H 2017 is for the period from 1 October 2016 to 31 December 2016 and 1 January 2017 to 31 March 2017 paid in February 2017 and May 2017 respectively.

CAPITALAND MALL TRUST 2018 SECOND QUARTER UNAUDITED FINANCIAL STATEMENT & DISTRIBUTION ANNOUNCEMENT
_____________________________________________________________________
Page 15 of 24
1(d)(i) Statements of Movements in Unitholders’ Funds (2Q 2018 vs 2Q 2017)
Group Trust
2Q 2018 2Q 2017 2Q 2018 2Q 2017
S$'000 S$'000 S$'000 S$'000
Balance as at beginning of the period 6,941,476 6,687,804 6,676,012 6,419,753
Operations
Total return for the period 295,873 302,498 286,147 276,605
Movement in hedging reserves 1 3,067 (9,799) - -
Movement in foreign currency translation reserves 2
6,652 (4,286) - -
Movement in general reserves 2 197 223 - -
Unitholders’ transactions
Creation of Units
- Units issued in respect of RCS Trust’s management fees 3
809 791 809 791
Distributions to Unitholders 4 (98,638) (96,778) (98,638) (96,778)
Net decrease in net assets resulting from Unitholders’ transactions
(97,829) (95,987) (97,829) (95,987)
Balance as at end of the period 7,149,436 6,880,453 6,864,330 6,600,371
Footnotes:
1. This includes movements in hedging reserve of CMT MTN and the Group’s share in RCS Trust’s,
IMT’s as well as CRCT’s hedging reserves.
2. This includes the Group’s share in CRCT’s foreign currency translation reserves and general reserves.
3. For 2Q 2018, it relates to payment of base component of management fees for 1Q 2018 which were issued in May 2018. For 2Q 2017, it relates to payment of base component of management fees for 1Q 2017 which were issued in May 2017.
4. Distributions for 2Q 2018 is for the period from 1 January 2018 to 31 March 2018 paid in May 2018.
Distributions for 2Q 2017 is for the period from 1 January 2017 to 31 March 2017 paid in May 2017.

CAPITALAND MALL TRUST 2018 SECOND QUARTER UNAUDITED FINANCIAL STATEMENT & DISTRIBUTION ANNOUNCEMENT
_____________________________________________________________________
Page 16 of 24
1(d)(i) Statements of Movements in Unitholders’ Funds (1H 2018 vs 1H 2017)
Group Trust
1H 2018 1H 2017 1H 2018 1H 2017
S$'000 S$'000 S$'000 S$'000
Balance as at beginning of the year 6,928,045 6,692,222 6,667,687 6,411,655
Operations
Total return for the period 406,328 405,930 393,686 383,132
Movement in hedging reserves 1 8,190 (23,870) - -
Movement in foreign currency translation reserves 2
3,535 162 - -
Movement in general reserves 2 381 425 - -
Unitholders’ transactions
Creation of Units
- Units issued in respect of RCS Trust’s management fees 3
4,441 4,402 4,441 4,402
Distributions to Unitholders 4 (201,484) (198,818) (201,484) (198,818)
Net decrease in net assets resulting from Unitholders’ transactions
(197,043) (194,416) (197,043) (194,416)
Balance as at end of the period 7,149,436 6,880,453 6,864,330 6,600,371
Footnotes:
1. This includes movements in hedging reserve of CMT MTN and the Group’s share in RCS Trust’s,
IMT’s as well as CRCT’s hedging reserves.
2. This includes the Group’s share in CRCT’s foreign currency translation reserves and general reserves.
3. For 1H 2018, it relates to payment of base component of management fees for 4Q 2017 and performance component of management fees for FY 2017 which were issued in February 2018, as well as payment of base component of management fees for 1Q 2018 in May 2018. For 1H 2017, it relates to payment of base component of management fees for 4Q 2016 and performance component of management fees for FY 2016 which were issued in February 2017, as well as payment of base component of management fees for 1Q 2017 in May 2017.
4. Distributions for 1H 2018 is for the period from 1 October 2017 to 31 December 2017 and 1 January
2018 to 31 March 2018 paid in February 2018 and May 2018 respectively. Distributions for 1H 2017 is for the period from 1 October 2016 to 31 December 2016 and 1 January 2017 to 31 March 2017 paid in February 2017 and May 2017 respectively.

CAPITALAND MALL TRUST 2018 SECOND QUARTER UNAUDITED FINANCIAL STATEMENT & DISTRIBUTION ANNOUNCEMENT
_____________________________________________________________________
Page 17 of 24
1(d)(ii) Details of any change in the issued Units (2Q 2018 vs 2Q 2017)
Trust
2Q 2018 2Q 2017
Units Units
Issued Units as at beginning of the period 3,548,126,679 3,544,975,166
New Units issued:
- As payment of management fees in relation to 40% interest in RCS Trust 1
392,859 404,397
Issued Units as at end of the period 3,548,519,538 3,545,379,563
Footnote:
1. For 2Q 2018, it relates to payment of base component of management fees for 1Q 2018 which were issued in May 2018. For 2Q 2017, it relates to payment of base component of management fees for 1Q 2017 which were issued in May 2017.
1(d)(ii) Details of any change in the issued Units (1H 2018 vs 1H 2017)
Trust
1H 2018 1H 2017
Units Units
Balance as at beginning of the year 3,546,423,043 3,543,069,556
New Units issued:
- As payment of management fees in relation to 40% interest in RCS Trust 1
2,096,495 2,310,007
Total issued Units as at end of the period 3,548,519,538 3,545,379,563
Footnote:
1. For 1H 2018, it relates to payment of base component of management fees for 4Q 2017 and performance component of management fees for FY 2017 which were issued in February 2018, as well as payment of base component of management fees for 1Q 2018 in May 2018. For 1H 2017, it relates to payment of base component of management fees for 4Q 2016 and performance component of management fees for FY 2016 which were issued in February 2017, as well as payment of base component of management fees for 1Q 2017 in May 2017.
2 Whether the figures have been audited or reviewed, and in accordance with which auditing standard or practice.
The figures have not been audited nor reviewed by our auditors.
3 Where the figures have been audited or reviewed, the auditor’s report (including any qualifications or emphasis of matter)
Not applicable.
4 Whether the same accounting policies and methods of computation as in the issuer’s most recent audited annual financial statements have been complied
Except as disclosed in paragraph 5 below, the Group has applied the same accounting policies and methods of computation in the preparation of the financial statements for the current reporting period compared with theaudited financial statements for the year ended 31 December 2017.
5 If there are any changes in the accounting policies and methods of computation, including any required by an accounting standard, what has changed, as well as the reasons for, and the effect of, the change
The Group has adopted new Financial Reporting Standards in Singapore (“FRSs”) and interpretations effective for the financial period beginning 1 January 2018 as follows:

CAPITALAND MALL TRUST 2018 SECOND QUARTER UNAUDITED FINANCIAL STATEMENT & DISTRIBUTION ANNOUNCEMENT
_____________________________________________________________________
Page 18 of 24
(i) FRS 115 Revenue from Contracts with Customers
FRS 115 establishes a comprehensive framework for determining whether, how much and when revenue is recognised. It also introduces new cost guidance which requires certain costs of obtaining and fulfilling contracts to be recognised as separate assets when specified criteria are met.
There was no significant impact to the financial statements of the Group. Accordingly, comparative financial information presented in this set of announcement has not been restated.
(ii) FRS 109 Financial Instruments
FRS 109 introduces new requirements for classification and measurement of financial assets, impairment of financial assets and hedge accounting.
There was no change in measurement basis arising from the adoption of the new classification and measurement model. In assessing for impairment losses on financial assets, the Group has adopted the simplified approach and recorded lifetime expected losses on all trade receivables using the expected credit loss model. There was no significant impact to the financial statements of the Group. Accordingly, the Group did not recognize any adjustments to its opening unitholders’ funds on 1 January 2018. The Group’s existing hedges that are designated in effective hedging relationships continue to qualify for hedge accounting under FRS 109.

CAPITALAND MALL TRUST 2018 SECOND QUARTER UNAUDITED FINANCIAL STATEMENT & DISTRIBUTION ANNOUNCEMENT
_____________________________________________________________________
Page 19 of 24
6 Earnings per Unit (“EPU”) and DPU for the financial period
In computing the DPU, the number of Units as at the end of each period is used.
Group Trust
2Q 2018 2Q 2017 2Q 2018 2Q 2017
EPU
Basic and Diluted EPU
Weighted average number of Units in issue
3,548,377,073 3,545,241,801 3,548,377,073 3,545,241,801
Based on weighted average number of Units in issue 1
8.34¢ 8.53¢ 8.06¢ 7.80¢
DPU
Number of Units in issue at end of the period
3,548,519,538 3,545,379,563 3,548,519,538 3,545,379,563
Based on the number of Units in issue at end of the period
2.81¢ 2.75¢ 2.81¢ 2.75¢
Footnote:
1. In computing the EPU, total returns for the period after tax and the weighted average number of Units at the
end of the period are used.
Group Trust
1H 2018 1H 2017 1H 2018 1H 2017
EPU
Basic and Diluted EPU
Weighted average number of Units in issue
3,547,706,651 3,544,498,583 3,547,706,651 3,544,498,583
Based on weighted average number of Units in issue 1
11.45¢ 11.45¢ 11.10¢ 10.81¢
DPU
Number of Units in issue at end of the period
3,548,519,538 3,545,379,563 3,548,519,538 3,545,379,563
Based on the number of Units in issue at end of the period
5.59¢ 5.48¢ 5.59¢ 5.48¢
Footnote:
1. In computing the EPU, total returns for the period after tax and the weighted average number of Units at the
end of the period are used.

CAPITALAND MALL TRUST 2018 SECOND QUARTER UNAUDITED FINANCIAL STATEMENT & DISTRIBUTION ANNOUNCEMENT
_____________________________________________________________________
Page 20 of 24
7 Net asset value (“NAV”) / Net tangible asset (“NTA”) per Unit based on issued Units at end of the period
Group Trust
30 Jun 2018 31 Dec 2017 30 Jun 2018 31 Dec 2017
Number of Units issued at end of the period
3,548,519,538 3,546,423,043 3,548,519,538 3,546,423,043
NAV / NTA ($’000) 7,149,436 6,928,045 6,864,330 6,667,687
NAV / NTA per Unit 1 ($) 2.01 1.95 1.93 1.88
Adjusted NAV / NTA per Unit (excluding the distributable income) ($)
1.99 1.92 1.91 1.85
Footnote: 1. NAV / NTA per Unit is computed based on net asset value / net tangible asset over the issued Units at the
end of the period.

CAPITALAND MALL TRUST 2018 SECOND QUARTER UNAUDITED FINANCIAL STATEMENT & DISTRIBUTION ANNOUNCEMENT
_____________________________________________________________________
Page 21 of 24
8 Review of the performance
Group
2Q 2018 2Q 2017 1H 2018 1H 2017
S$’000 S$’000 S$’000 S$’000
Income Statements
Gross revenue 171,366 168,639 346,530 340,662
Property operating expenses (50,574) (51,088) (100,087) (103,051)
Net property income 120,792 117,551 246,443 237,611
Interest income 2,358 2,295 4,454 4,560
Management fees (10,853) (11,170) (21,874) (22,304)
Trust expenses (1,019) (1,216) (2,003) (2,264)
Finance costs (24,110) (26,053) (48,492) (51,771)
Net income before share of results of associate and joint ventures
87,168 81,407 178,528 165,832
Group
2Q 2018 2Q 2017 1H 2018 1H 2017
S$’000 S$’000 S$’000 S$’000
Distribution Statements
Net income before share of results of associate and joint ventures
87,168 81,407 178,528 165,832
Net effect of non-tax deductible items
2,523 1,495 4,069 2,750
Distributions from associate - - 1,018 5,804
Distributions from joint ventures 14,462 16,024 29,208 30,859
Rollover adjustment 274 129 274 129
Net loss from subsidiaries 206 783 617 2,241
Amount available for distribution to Unitholders
104,633 99,838 213,714 207,615
Distributable income to Unitholders
100,0331 97,2382 198,9963 194,2114
DPU (in cents)
For the period 2.811 2.752 5.593 5.484
Annualised 11.271 11.032 11.273 11.054
Footnotes:
1. CMT is committed to distribute 100% of its taxable income available for distribution to Unitholders for the financial year ending 31 December 2018. For 2Q 2018, CMT had retained S$4.6 million of its taxable income available for distribution to Unitholders for distribution in FY 2018.
2. For 2Q 2017, CMT had retained S$2.6 million of its taxable income available for distribution to
Unitholders for distribution in FY 2017.
3. For 1H 2018, CMT had retained S$13.7 million of its taxable income available for distribution to Unitholders for distribution in FY 2018. Capital distribution and tax-exempt income distribution of S$1.0 million received from CRCT in respect of the period 7 December 2017 to 31 December 2017 had also been retained for general corporate and working capital purposes.
4. For 1H 2017, CMT had retained S$7.6 million of its taxable income available for distribution to Unitholders for distribution in FY 2017. Capital distribution and tax-exempt income distribution of S$5.8 million received from CRCT in 1Q 2017 had also been retained for general corporate and working capital purposes.

CAPITALAND MALL TRUST 2018 SECOND QUARTER UNAUDITED FINANCIAL STATEMENT & DISTRIBUTION ANNOUNCEMENT
_____________________________________________________________________
Page 22 of 24
2Q 2018 vs 2Q 2017
Gross revenue for 2Q 2018 was S$171.4 million, an increase of S$2.7 million or 1.6% from 2Q 2017. The increase was mainly due to higher other income as well as higher gross rental income from Plaza Singapura, Bedok Mall, Bugis Junction and Tampines Mall. The increase was partially offset by lower occupancy and rental rates contracted on new and renewed leases from JCube and Bukit Panjang Plaza and lower gross revenue from Sembawang Shopping Centre which was divested on 18 June 2018.
Property operating expenses for 2Q 2018 were S$50.6 million, a decrease of S$0.5 million or 1.0% from 2Q 2017. The decrease was mainly due to lower utilities, marketing and property tax expenses, partially offset by higher maintenance expenses.
Management fees at S$10.9 million were S$0.3 million or 2.8% lower than 2Q 2017. Finance costs for 2Q 2018 of S$24.1 million were S$1.9 million or 7.5% lower than the same quarter last year. This was mainly due to refinancing of EMTN of US$400.0 million in March 2018 at lower interest rates through loan drawdowns. These loans were partially repaid with net proceeds from sale of Sembawang Shopping Centre in June 2018 and MTN issuance at a lower interest rate in May 2018. The decrease was also due to refinancing of MTN of S$150.0 million with proceeds from divestment of VSRT and MTN issuance at a lower interest rate in November 2017, as well as repayment of bank borrowings in January 2018. 1H 2018 vs 1H 2017
Gross revenue for 1H 2018 was S$346.5 million, an increase of S$5.9 million or 1.7% from 1H 2017. The increase was mainly due to higher gross rental income from Plaza Singapura, Clarke Quay, IMM, The Atrium@Orchard, Bugis Junction and Tampines Mall as well as higher other income. The increase was partially offset by lower occupancy and rental rates contracted on new and renewed leases from JCube and Bukit Panjang Plaza and lower gross revenue from Sembawang Shopping Centre which was divested on 18 June 2018.
Property operating expenses for 1H 2018 were S$100.1 million, a decrease of S$2.9 million or 2.9% from 1H 2017. The decrease was mainly due to lower marketing and utilities expenses.
Management fees at S$21.9 million were S$0.4 million or 1.9% lower than 1H 2017. Finance costs for 1H 2018 of S$48.5 million were S$3.3 million or 6.3% lower than 1H 2017. This was mainly due to refinancing of MTN of S$150.0 million with proceeds from divestment of VSRT and MTN issuance at a lower interest rate in November 2017, as well as repayment of bank borrowings in January 2018. In addition, the decrease was due to refinancing of EMTN of US$400.0 million in March 2018 at lower interest rates through loan drawdowns. These loans were partially repaid with net proceeds from sale of Sembawang Shopping Centre in June 2018 and MTN issuance at a lower interest rate in May 2018.
9 Variance from Previous Forecast / Prospect Statement
CMT has not disclosed any forecast to the market.
10 Commentary on the competitive conditions of the industry in which the Group operates and any known factors or events that may affect the Group in the next reporting period and the next 12 months
According to advanced estimates by the Ministry of Trade and Industry, the Singapore economy grew by 3.8% on a year-on-year basis in 2Q 2018, moderating from the 4.3% growth in the previous quarter. On a quarter-on-quarter seasonally-adjusted annualised basis, the economy expanded at a slower pace of 1.0% compared to the 1.5% growth in the preceding quarter. Based on figures released by Singapore Department of Statistics, the retail sales index (excluding motor vehicle sales) increased 0.7% and 2.2% on a year-on-year basis in April and May 2018 respectively. CMT has a strong portfolio of quality shopping malls which are well-connected to public transportation hubs and are strategically located either in areas with large population catchments or within Singapore’s popular shopping and tourist destinations. This, coupled with the large and diversified tenant base of the portfolio, will contribute to the stability and sustainability of the malls’ occupancy rates and rental revenues. Going forward, the Manager of CMT will continue to focus on sustaining DPU.
CAPITALAND MALL TRUST 2018 SECOND QUARTER UNAUDITED FINANCIAL STATEMENT & DISTRIBUTION ANNOUNCEMENT
_____________________________________________________________________
Page 23 of 24
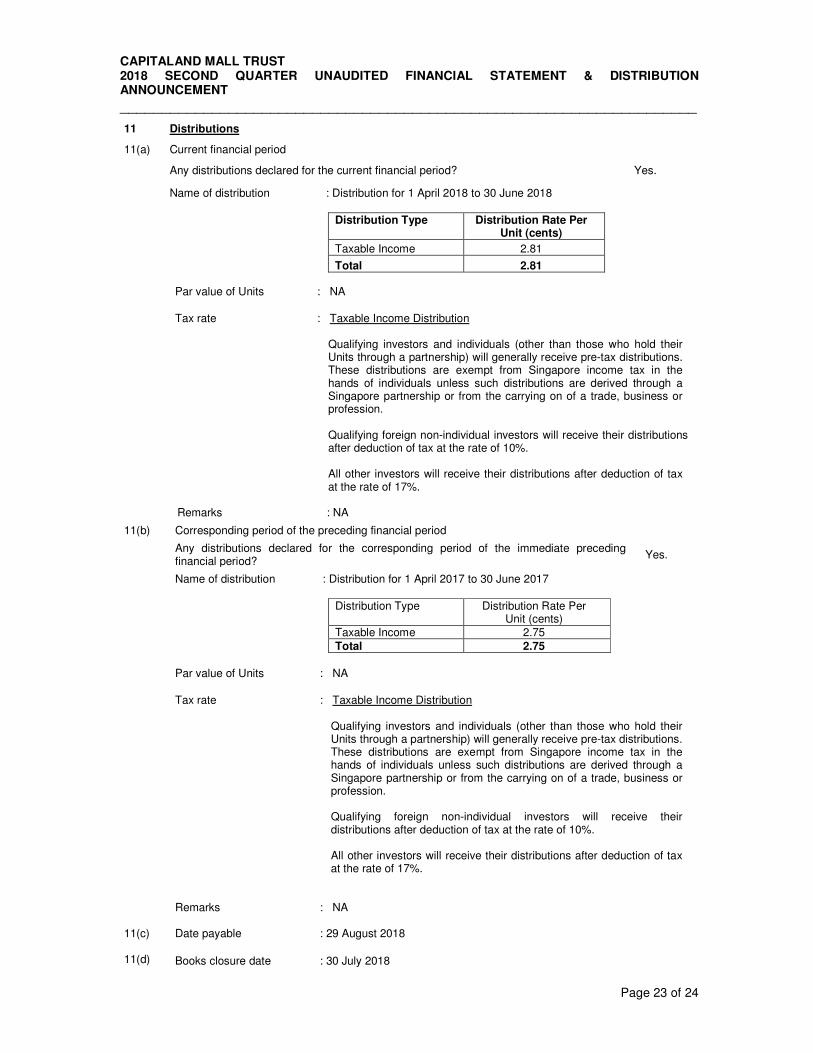
11 Distributions
11(a) Current financial period
Any distributions declared for the current financial period? Yes.
Name of distribution : Distribution for 1 April 2018 to 30 June 2018
Distribution Type Distribution Rate Per Unit (cents)
Taxable Income 2.81
Total 2.81
Par value of Units : NA
Tax rate
: Taxable Income Distribution
Qualifying investors and individuals (other than those who hold their Units through a partnership) will generally receive pre-tax distributions. These distributions are exempt from Singapore income tax in the hands of individuals unless such distributions are derived through a Singapore partnership or from the carrying on of a trade, business or profession.
Qualifying foreign non-individual investors will receive their distributions after deduction of tax at the rate of 10%. All other investors will receive their distributions after deduction of tax at the rate of 17%.
Remarks : NA
11(b) Corresponding period of the preceding financial period
Any distributions declared for the corresponding period of the immediate preceding financial period?
Yes.
Name of distribution : Distribution for 1 April 2017 to 30 June 2017
Distribution Type Distribution Rate Per Unit (cents)
Taxable Income 2.75 Total 2.75
Par value of Units : NA
Tax rate : Taxable Income Distribution
Qualifying investors and individuals (other than those who hold their Units through a partnership) will generally receive pre-tax distributions. These distributions are exempt from Singapore income tax in the hands of individuals unless such distributions are derived through a Singapore partnership or from the carrying on of a trade, business or profession.
Qualifying foreign non-individual investors will receive their distributions after deduction of tax at the rate of 10%.
All other investors will receive their distributions after deduction of tax at the rate of 17%.
Remarks
: NA
11(c)
Date payable
: 29 August 2018
11(d) Books closure date : 30 July 2018

CAPITALAND MALL TRUST 2018 SECOND QUARTER UNAUDITED FINANCIAL STATEMENT & DISTRIBUTION ANNOUNCEMENT
_____________________________________________________________________
Page 24 of 24
12 If no distribution has been declared/recommended, a statement to that effect
NA
13 Interested Person Transactions
CMT has not obtained a general mandate from Unitholders for Interested Person Transactions.
14 Confirmation pursuant to Rule 720(1) of the Listing Manual The Manager confirms that it has procured undertakings from all its Directors and Executive Officers in the format set out in Appendix 7.7 of the Listing Manual of the SGX-ST (the “Listing Manual”), as required by Rule 720(1) of the Listing Manual.
15
Confirmation pursuant to Rule 705(5) of the Listing Manual To the best of our knowledge, nothing has come to the attention of the Board of Directors of the Manager which may render the unaudited interim financial results of the Group and the Trust (comprising the statements of financial position as at 30 June 2018, statements of total return & distribution statements, statements of cash flow and statements of movements in unitholders’ funds for the six months ended on that date), together with their accompanying notes, to be false or misleading, in any material respect.
On behalf of the Board of Manager
Jason Leow Juan Thong Tan Tee Hieong Director Chief Executive Officer
BY ORDER OF THE BOARD CAPITALAND MALL TRUST MANAGEMENT LIMITED (Company registration no. 200106159R) (as Manager of CapitaLand Mall Trust)
Lee Ju Lin, Audrey Company Secretary 20 July 2018
This release may contain forward-looking statements that involve assumptions, risks and uncertainties. Actual future performance, outcomes and results may differ materially from those expressed in forward-looking statements as a result of a number of risks, uncertainties and assumptions. Representative examples of these factors include (without limitation) general industry and economic conditions, interest rate trends, cost of capital and capital availability, competition from other developments or companies, shifts in expected levels of occupancy rate, property rental income, charge out collections, changes in operating expenses (including employee wages, benefits and training costs), governmental and public policy changes and the continued availability of financing in the amounts and the terms necessary to support future business. You are cautioned not to place undue reliance on these forward-looking statements, which are based on the current view of management on future events.
Top Related