


Languages
Pages
Legal


Climate Change DialogueIndia Country Presentation
Surya P. SethiAdviser, Energy
Planning Commission, IndiaMay 2006
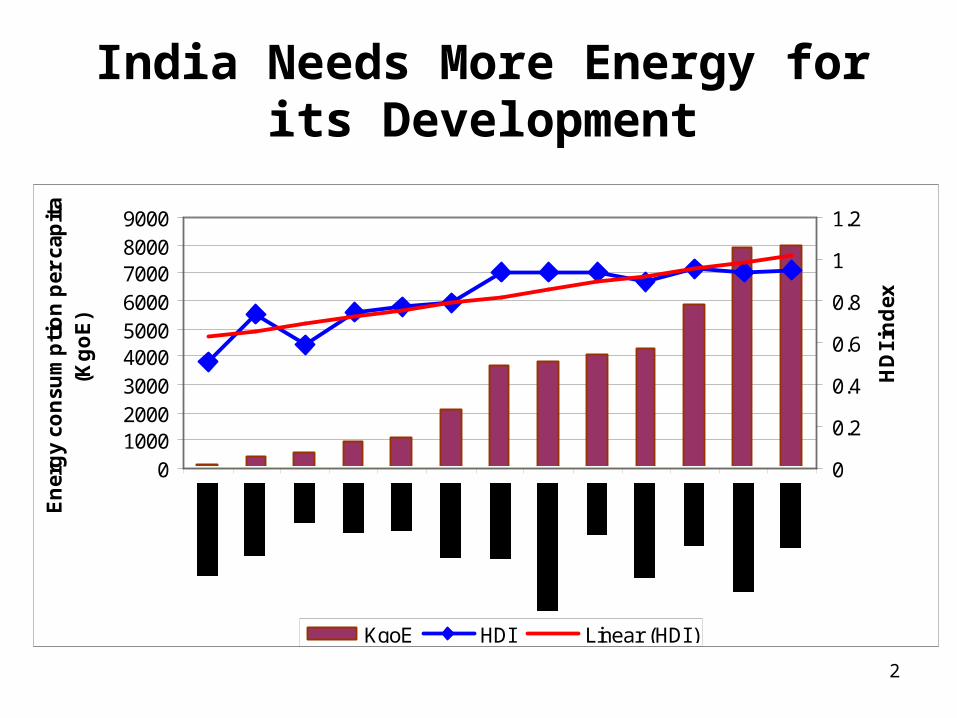
2
India Needs More Energy for its Development
0100020003000400050006000700080009000
En
erg
y co
nsu
mp
tio
n p
er c
apit
a (K
go
E)
0
0.2
0.4
0.6
0.8
1
1.2
HD
I in
dex
KgoE HDI Linear (HDI )

3
India is NOT Following the Fuelish Path of Industrialized Countries

4
Decreasing Energy Intensity Behind India’s Sustainable Development
Energy intensity of GDP (kgoe/$ 2000 PPP)
0.15
0.17
0.19
0.21
0.23
0.25
0.27
0.29
0.31
1971
1975
1980
1985
1990
1995
1999
2000
2001
2002
2003
TP
ES
(kg
oe)/
GD
P (
$2000 P
PP
)

5
India’s Development Goals
1. Reducing the poverty ratio by 5 percentage points by 2007 and by 15 percentage points by 2012
2. Providing gainful and high-quality employment to the labor force
3. All children in school by 2003; all children to complete 5 years of schooling by 2007
4. Reducing gender gaps in literacy and wage rates by at least 50 % by 2007
• Raising the literacy rate to 75% within the 10th Plan
6. Reducing the decadal rate of population growth between 2001-2011 to 16.2%
The goals in blue are more ambitious than corresponding MDGs

6
India’s Developmental Goals…7. Reducing the Infant Mortality Rate (IMR) to 45 per 1000
live births by 2007 and to 28 by 2012
8. Reducing the Maternal Mortality Ratio (MMR) to 2 per 1000 live births by 2007 and to 1 by 2012
9. Increasing the forest and tree cover to 25 % by 2007 and 33 % by 2007
10. All villages to have sustained access to potable drinking water by 2007
11. Electricity for all by 2012
12. Cleaning of all major polluted rivers by 2007 and other notified stretches by 2012

7
Energy Implications of India’s Development Goals

8
1. Reducing the poverty ratio by 5 percentage points by 2007 and by 15 percentage points by 2012
• About 26% of India’s population below poverty line in 2001 (Govt. estimate)
• National poverty line:2100 calories/capita (urban); 2400 calories/capita (rural)
• 35% of Indian population < US $1/day; 80% < US $2/day (UNDP estimate)
Annual incremental energy consumption & associated CO2 emissions for reducing poverty ratios with 2001 as base year
12.0
27.423.5
52.8
0
10
20
30
40
50
60
Additional energyconsumption (mtoe)
Additional CO2 (MMT) Additional energyconsumption (mtoe)
Additional CO2 (MMT)
2007 2012

9
2. Providing gainful and high-quality employment to the labor force
• Estimated addition to labor force during 2002-2007: ~35 million
• Assumed that basic energy consumption patterns of the newly employed population changes from Below poverty line to Above poverty line
Incremental energy & emissions in 2008
1.1
2.6
0
0.5
1
1.5
2
2.5
3
Energy (mtoe) CO2 emissions (million tonnes)
En
erg
y (m
toe)
0
0.5
1
1.5
2
2.5
3
CO
2 (M
MT
)

10
3. All children to complete 5 years of schooling; Increase in literacy rate to 75%; Reduction in
gender gaps in literacy by at least 50% - by 2007
•Two major programmes of Government of India:
Sarva Shiksha Abhiyan (SSA) – to achieve universal elementary education
National Literacy Mission: ~100 million persons (in age group 15-35 yrs) to be made literate through NLM scheme
Estimated Additional Enrolment at Primary Level (million)
0.67 0.67 0.67 0.69 0.69
2.01 2.1 2.18 2.27 2.372.68 2.77 2.85 2.96 3.06
0
1
2
3
2002-03 2003-04 2004-05 2005-06 2006-07
Boys
Girls
Total

11
3. All children to complete 5 years of schooling; Increase in literacy rate to 75%; Reduction in
gender gaps in literacy by at least 50% - by 2007
• Energy required:1.8 mtoe; CO2 emissions: 10.3 MMT
•90% of energy requirements and 88% of CO2 emissions on account of infrastructure development
0.00
0.50
1.00
1.50
2.00
Energy(mtoe)
0
1
2
3
4
5
6
7
8
9
10
11
CO2 emissions
(MMT)
Transportationof food grain
Paperconsumption
Lighting & fans
Infrastructuredevelopment

12
4. Health related targets
Reduction in decadal growth rate of population during 2001-11 to 16.2%
Reduction in Infant Mortality Rate to 45 per 1,000 live births by 2007 and 28 per 1,000 live births by 2012
Reduction in Maternal Mortality Ratio to 2 per 1,000 live births by 2007 & 1 per 1,000 live births by 2012.
Estimated increase in energy consumption & emissions due to additional infrastructure & services
Energy Consumption (mtoe)
2.08
0.060.02
CO2 emissions (MMT)
8.92
0.170.32
Construction
Lighting, Fans &Refrigeration
Referral Transport

13
• 2 GoI Programs: Rajiv Gandhi drinking water mission
Swajaldhara (community led participatory program to provide drinking water in rural areas )
• 15% of rural population not covered by safe drinking water 1 million bore-wells needed (0.3 m motorized)
• 5.6 million acre-foot of water to be treated
• 30,000 tons of steel required for GI pipes
• 0.26 mtoe energy requirement
• 3.45 MMT CO2 emissions
5. All villages to have sustained access to potable drinking water by 2007
Energy Requirement for supply of clean drinking water to rural community (mtoe)
Water extraction and distributionWater treatmentMaterial requirement
0.14 (54%)
0.02 (9%)
0.09 (37%)

14
6. Cleaning of all major polluted rivers by 2007 and other notified stretches by 2012
• Current sewage generation ~ 33,000 MLD; Treatment capacity 7,000 MLD
• Treatment capacity to be created 26,000 MLD at national level + 1300 MLD under National River Conservation Plan (NRCP)
• Industrial effluent generation ~ 15,000 MLD; treatment capacity 9,000 MLD 6,000 MLD discharged untreated by Small Industries
• Capacity requirement: 10 KW/MLD (STP); 12 KW/MLD (ETP)
• Energy required to meet target: 0.31 mtoe /year (till 2007)
• CO2 emissions resulting from additional energy requirement: 4.2 MMT/year
0
1000
2000
3000
4000
5000
2002 2007 2012
Urb
an p
op
ula
tio
n (
'000
)
0
10000
20000
30000
40000
50000
ML
D
Sewagegeneration
Projected urbanpopulation
15
India’s Policies For Sustainable Growth
16
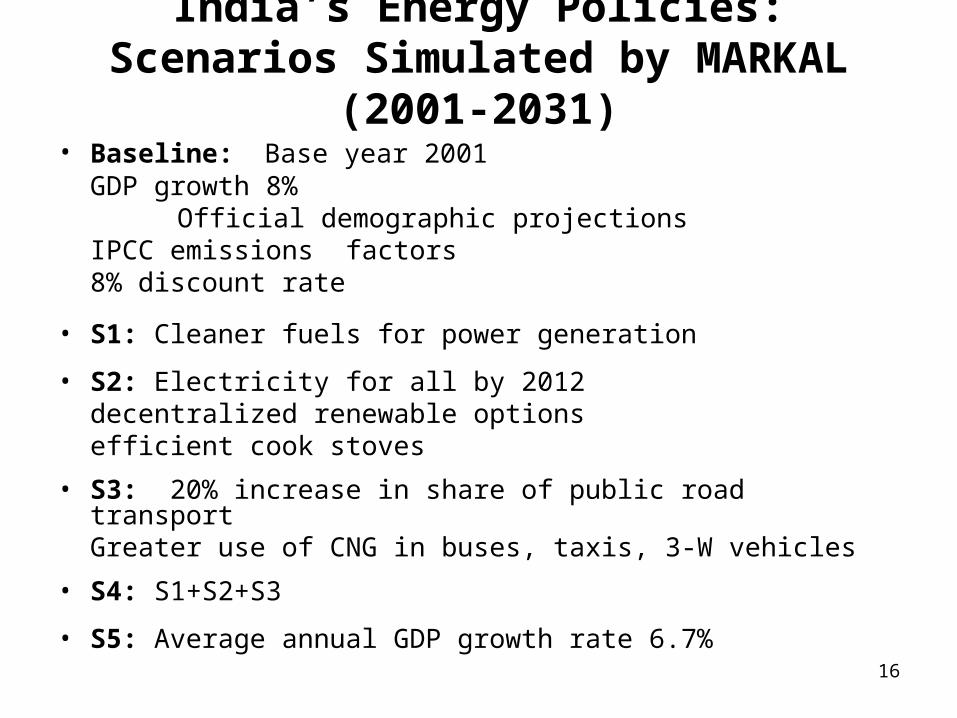
India’s Energy Policies: Scenarios Simulated by MARKAL (2001-2031)
• Baseline: Base year 2001GDP growth 8%
Official demographic projectionsIPCC emissions factors
8% discount rate
• S1: Cleaner fuels for power generation
• S2: Electricity for all by 2012decentralized renewable optionsefficient cook stoves
• S3: 20% increase in share of public road transport Greater use of CNG in buses, taxis, 3-W vehicles
• S4: S1+S2+S3
• S5: Average annual GDP growth rate 6.7%

17
Comparison of Energy Supply Intensity
0
5
10
15
20
25
30
35
40
2001 2006 2011 2016 2021 2026 2031
PJ
/Bil
lio
n U
S$
Baseline S1 S2 S3 S4 S5

18
Change in India’s CO2 intensity as a result of Government policy initiatives
CO2 Intensity
0.0
0.5
1.0
1.5
2.0
2.5
3.0
2001 2006 2011 2016 2021 2026 2031
Years
MM
T/B
illio
n U
S $
Baseline S1 S2 S3 S4 S5
19
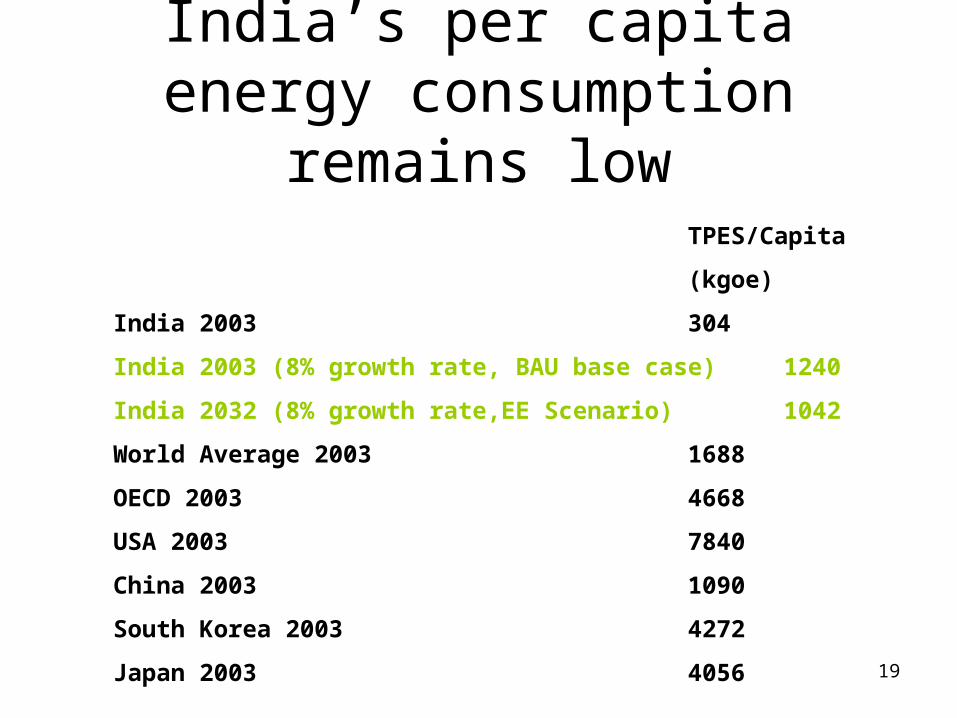
India’s per capita energy consumption remains low
TPES/Capita
(kgoe)
India 2003 304
India 2003 (8% growth rate, BAU base case) 1240
India 2032 (8% growth rate,EE Scenario) 1042
World Average 2003 1688
OECD 2003 4668
USA 2003 7840
China 2003 1090
South Korea 2003 4272
Japan 2003 4056

20
India’s Technology Needs For Sustainability

21
Issues in Technology
• Principles relating to technology transfer
• Country-specific circumstances
• Technology for sustainable development to be placed in limited public domain for developing countries
• Collaborative R&D to replace conventional technology transfer
22
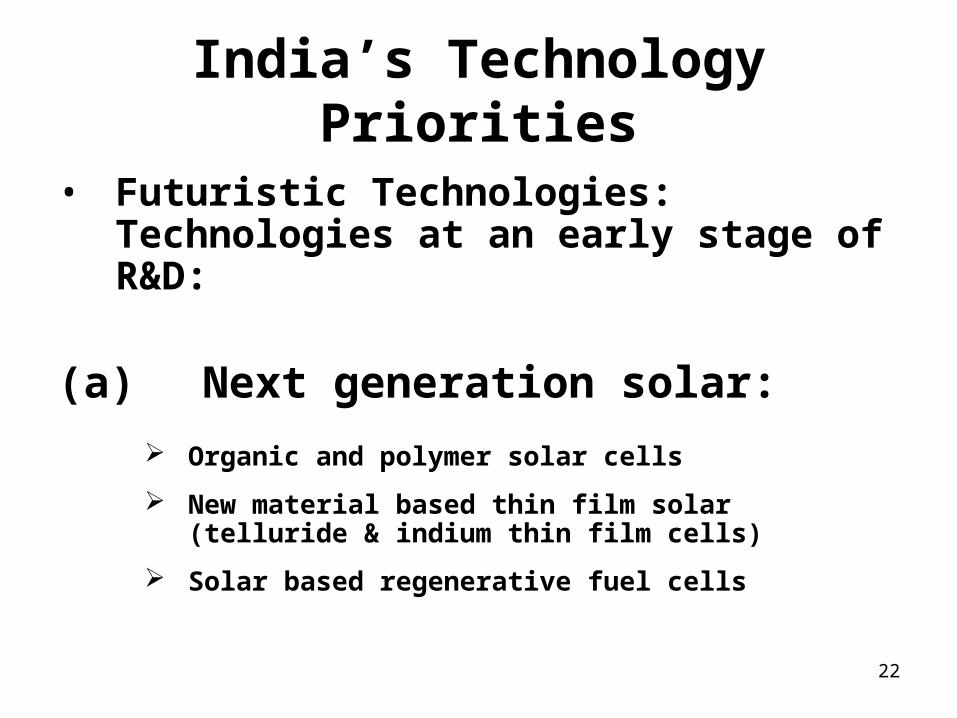
India’s Technology Priorities
• Futuristic Technologies: Technologies at an early stage of R&D:
(a)Next generation solar:
Organic and polymer solar cells
New material based thin film solar (telluride & indium thin film cells)
Solar based regenerative fuel cells

23
Futuristic Technologies for India…
(b) Next generation biomass:
Microbial fuel cells
Microbial production of hydrogen from biomass
Bioreactors for hydrogen production

24
Futuristic Technologies for India…
(c)Next generation coal:
Liquefaction of coal to produce fuel oil
(d)Next generation energy storage
Advanced ultra-capacitors/super-capacitors
Carbon nanotubes and glass micro spheres for hydrogen storage
High density storage batteries

25
Technologies to be adopted to Indian conditions:
(a) Solar energy Tandem cells Low cost concentrator with PV Solar thermal sterling cycle
(b) Biomass Enzymatic degradation of ligno cellulosic
biomass for bio-ethanol and bio-methanol
High yielding germ plasms for TBO plants
MCFC / SOFC integrated with biomass gasifiers & gas turbines for power generation

26
Technologies to be adopted to Indian conditions…
(c) Coal Integrated gasification combined cycle (IGCC)
In–situ coal gasification (UCG)
Ultra-critical & supercritical coal combustion
(d) End-use technologies Metal hydride based hydrogen storage
Solar passive architecture
Light emitting diodes
Integrated hybrid PV water heating systems

27
Technologies Requiring Removal of Barriers Specifically Cost Barrier
(a) Solar energy
Hybrid solar systems
Solar concentrators
Solar passive systems
(b) Biomass
Biomass gasifiers for power generation
Thermal application of biomass gasifiers (process heat)
Bio-oil from biomass by flash pyrolysis

28
Technologies Requiring Removal of Barriers Specifically Cost Barrier
(c) Coal Beneficiation of coalHigher conversion efficiency in existing plants
(d) End use technologiesGreen building architecture
Efficient appliances/processes currently in use
Absorption refrigeration
Solar thermal for residential / commercial and low-grade industrial
29
Issues On Adaptation

30
Issues in Adaptation
Principles for action on adaptation
The full ‘additional’ cost of adaptation should be financed and not just the incremental cost
A simplified modality for predictable and flexible cost-sharing should be developed
Adequacy and predictability of resources for financing adaptation should be ensured

31
Adaptation issues…
Principles for disbursing and managing funds available for adaptation
Flexibility in decision making and processing
Mechanism should enable wider access to resources in the pool- include regional and specialized agencies as implementing agencies
A portfolio based approach that leads to:Mainstreaming Adaptation in ongoing development
programsTechnology development, diffusion and transfer Insurance to enhance adaptive capacity
32
Adaptation issues…
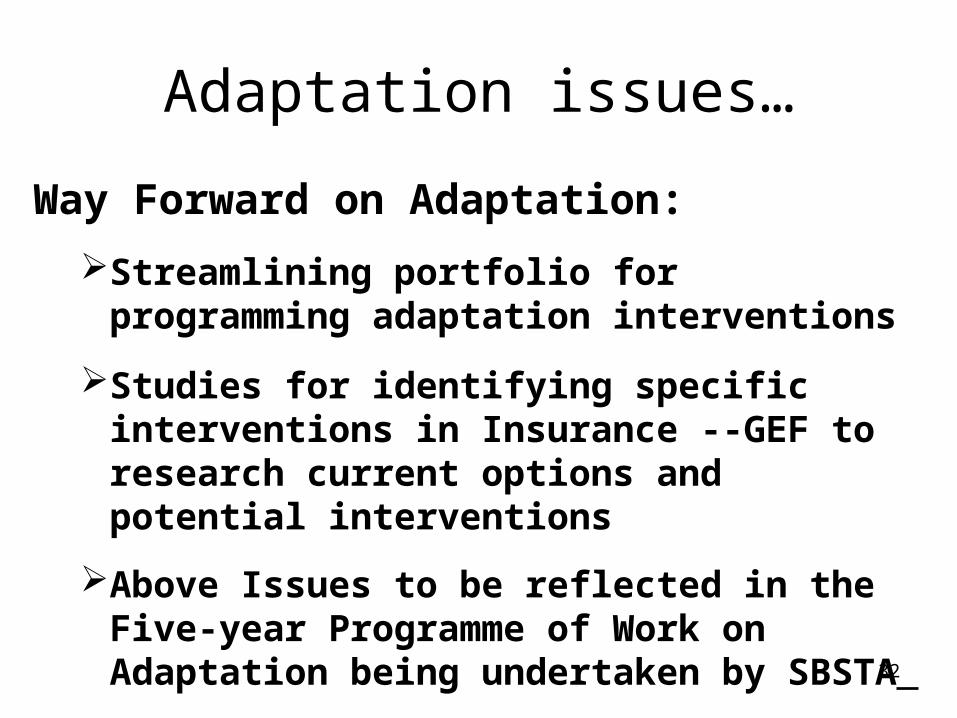
Way Forward on Adaptation:
Streamlining portfolio for programming adaptation interventions
Studies for identifying specific interventions in Insurance --GEF to research current options and potential interventions
Above Issues to be reflected in the Five-year Programme of Work on Adaptation being undertaken by SBSTA
Top Related