


Languages
Pages
Legal


Joint Venture of THE Louis Berger Group, INC and DHI (India) Water & Environment Pvt. Ltd.
Pollution Control Board, Assam
Conservation of River Kolong, Nagaon
Preparation of Detailed Project Report
City Sanitation Plan
December 2013

City Sanitation Plan
ii
Photos on the front page are taken by the project field team in Nagaon town during visits in year 2013.
City Sanitation Plan
iii
CONTENTS
Salient Features of the Project .................................................................................................. viii
Executive Summary ...................................................................................................................... x
Check List for City Sanitation Plan ............................................................................................. xi
1 About the Project Area ............................................................................................... 1
1.1 Authority for Preparation of Project ................................................................................................ 1
1.2 Composition of the Team for CSP ................................................................................................. 1
1.3 Description of the Project Area ...................................................................................................... 1
1.3.1 Description of the Polluted Stretch ................................................................................................ 3 1.3.2 Justification for selecting the Town for Project Formulation under NRCP/NGRBA ....................... 3 1.3.3 Brief History of the Town................................................................................................................ 3 1.3.4 Geographical Location ................................................................................................................... 3 1.3.5 Climate ........................................................................................................................................... 3 1.3.6 Topography .................................................................................................................................... 5 1.3.7 Drainage Channels ........................................................................................................................ 6 1.3.8 Administrative Divisions ................................................................................................................. 6 1.3.9 Commercial Aspects ...................................................................................................................... 7 1.3.10 Industrial Activities ......................................................................................................................... 7 1.3.11 Educational Activities ..................................................................................................................... 8 1.3.12 Cultural Activities ........................................................................................................................... 9 1.3.13 Religious Activities ....................................................................................................................... 10 1.3.14 Socio-Economic Status ................................................................................................................ 10 1.3.15 Town Management ...................................................................................................................... 10 1.3.16 Land Cost in and around the Town .............................................................................................. 10 1.3.17 City Development Plan ................................................................................................................ 10
1.4 Population within the Project Area ............................................................................................... 11
1.4.1 Ward Wise Population ................................................................................................................. 11 1.4.2 Slum Wise Population of the last 5 Decades ............................................................................... 11 1.4.3 Population Projections as per the City Master Plan .................................................................... 12 1.4.4 Cattle Population .......................................................................................................................... 13
2 Sewerage Work ......................................................................................................... 14
2.1 Status of Water Supply ................................................................................................................ 14
2.1.1 Actual Water Supply from Different Sources ............................................................................... 15 2.1.2 Proposal for Augmentation of Water Supply System .................................................................. 15
2.2 Status of Existing Waste Water Disposal Works ......................................................................... 16
2.2.1 Existing Work ............................................................................................................................... 16 2.2.2 Work under Execution.................................................................................................................. 16 2.2.3 Work Sanctioned but not yet started ............................................................................................ 16 2.2.4 Total Waste Water Generation .................................................................................................... 17 2.2.5 Industrial Flow .............................................................................................................................. 17
2.3 Status of Pollution of the River .................................................................................................... 17
2.3.1 Number and Details of Drainage Channel ................................................................................... 17 2.3.2 Waste Water Flow Carried by Drains .......................................................................................... 18 2.3.3 Measurement of Flows in Drains along with Copies of Test Report ............................................ 19 2.3.4 Waste Water Characteristics of Different Drains ......................................................................... 19 2.3.5 Measurement of Waste Water Characteristics along with Copies of Test Reports ..................... 20 2.3.6 Water Quality of the River U/S, D/S and at Outfall of Drain discharging into River..................... 21 2.3.7 Measurement of the Quality of River Water along with copies of Test Report ............................ 22

City Sanitation Plan
iv
2.3.8 Methodology followed for Flow Measurement and Quality Characteristics ................................. 22 2.3.9 Water Quality Standards of River Water Quality ......................................................................... 22
2.4 Justification of the Project for Pollution abatement of the River .................................................. 22
3 Non-Sewerage Work ................................................................................................. 23
3.1 Community Sanitation Scheme ................................................................................................... 23
3.2 Crematoria ................................................................................................................................... 25
3.3 River Front Development ............................................................................................................. 25
3.4 Dhobi Ghat ................................................................................................................................... 26
3.5 Carcass Disposal ......................................................................................................................... 26
3.6 Others (Waste Disposal from Dairies, Slaughter Houses, etc.)................................................... 27
4 Solid Waste Management ......................................................................................... 28
4.1 Baseline Information .................................................................................................................... 28
4.2 Category Wise Quantity of Solid Waste and its Characteristics .................................................. 29
4.3 Biodegradable and Non-Biodegradables Waste ......................................................................... 30
4.4 Industrial Waste ........................................................................................................................... 30
4.5 Bio-medical Waste ....................................................................................................................... 30
4.6 Segregation of the Solid Waste ................................................................................................... 31
4.7 Collection and Storage System ................................................................................................... 31
4.8 Transfer System ........................................................................................................................... 32
4.9 Garbage Dumping and Disposal Sites......................................................................................... 33
4.10 Solid Waste converted to Compost - Composting Site and its Capacity ..................................... 33
4.11 Solid Waste Recycled .................................................................................................................. 33
4.12 Deficiencies in SWM System ....................................................................................................... 33
4.13 Justification for Upgrading the Present System or a New System .............................................. 34
4.13.1 Proposed MSW Management System ......................................................................................... 34
4.14 Consultation with Stakeholders ................................................................................................... 35
4.14.1 Resolution of ULB’s for CSP Adoption ........................................................................................ 35 4.14.2 Consultation with Community ...................................................................................................... 35
5 Consultation with Stakeholders ............................................................................... 36
5.1 Resolution of ULB’ for CSP Adoption .......................................................................................... 36
5.2 Consultation with Community ...................................................................................................... 38
6 Schemes for City Sanitation Plan ............................................................................ 39
6.1 Key Elements ............................................................................................................................... 39
6.2 Good Practices to be followed ..................................................................................................... 39
6.3 Proposed Actions ......................................................................................................................... 39
6.3.1 Proposed Actions that Comprise the Restoration Solution.......................................................... 40
6.4 Sewage Collection and Treatment Options ................................................................................. 41
6.4.1 Kolong 5-year Plan ...................................................................................................................... 43 6.4.2 Kolong 10-year Plan (after 5-year plan)....................................................................................... 43 6.4.3 Kolong 15 to 30 year Plan (after 10-year plan) ............................................................................ 43
6.5 River Front Development ............................................................................................................. 44
7 Financial Strategy for Executing the Different Components ................................. 48
7.1 Planning ....................................................................................................................................... 48
7.2 Investment Requirements and Financing Options ....................................................................... 49
7.3 Strategic Planning ........................................................................................................................ 50

City Sanitation Plan
v
8 Maps ........................................................................................................................... 52
9 References ................................................................................................................. 53
Appendix A: Water Quality Data (Present project) .................................................................... 54
Appendix B: Water Quality Methodology (Present project) ..................................................... 56
Appendix C: Water Quality Data (PCBA, 2013) .......................................................................... 58
Appendix D: Water Quality Data (Khan & Arup, 2012) .............................................................. 61
Appendix E: Water Quality Data (PCBA, 2010) .......................................................................... 63
FIGURES Figure 1-1: Study area. ....................................................................................................................................... 1 Figure 1-2: Kolong River basin. The polluted stretch in Nagaon town is marked. ............................................. 2 Figure 1-3: Average annual rainfall (mm) in the Nagaon district (data from Nagaon Water Resource
Division, 2011). .............................................................................................................................. 4 Figure 1-4: Maximum and minimum monthly temperatures in the Nagaon district in 2010 (data from
Nagaon Water Resource Division, 2011). ..................................................................................... 5 Figure 1-5: Topographic elevations (DEM) in the Kolong catchment area. ....................................................... 5 Figure 1-6: Population projection of Nagaon Town. ......................................................................................... 13 Figure 2-1: Elevated service reservoirs in Zones 1, 2 and 3. ........................................................................... 14 Figure 2-2: Example of water contamination by septic tank and water pump placed side by side by
side............................................................................................................................................... 14 Figure 2-3: Population coverage by source (Source: Census 2011). .............................................................. 15 Figure 2-4: Sewerage discharges along Kolong River. .................................................................................... 16 Figure 2-5: Map showing the four (4) areas. .................................................................................................... 18 Figure 2-6: Water sample collected from drain in Nagaon town. ..................................................................... 20 Figure 2-7: Locations of water samples. .......................................................................................................... 21 Figure 3-1: Structures for access to the Kolong River in Nagaon. ................................................................... 26 Figure 4-1: Improper Waste disposal. .............................................................................................................. 28 Figure 4-2 : Swatch Plasma system Installed by Nagaon Municipal Board for Waste Disposal. .................... 29 Figure 4-3 : Composition of Solid Waste. ......................................................................................................... 30 Figure 4-4: Dumped waste from a hospital. ..................................................................................................... 31 Figure 4-5 : Dumping of waste along and into the Kolong River. ..................................................................... 32 Figure 4-6: Solid waste transported by the Nagaon Municipal Board. ............................................................. 33 Figure 5-1: Discussion with Nagaon Municipal Board members about solid waste. ....................................... 37 Figure 5-2: Interaction with local people during field trips in the town. ............................................................ 38 Figure 6-1: Schematic of Conservation Framework. ........................................................................................ 40 Figure 6-2: Example of location where dredging is required. ........................................................................... 41 Figure 6-3: People using the river front for recreational activities. ................................................................... 44 Figure 6-4: Stone pitching done along the RKB Bridge. .................................................................................. 44 Figure 6-5: Proposed location of Amphitheatre along Kolong River. ............................................................... 45 Figure 6-6: Concept of the Amphitheatre at Nehru ground. ............................................................................. 45 Figure 6-7: Section A-A of the Amphitheatre complex at Nehru ground. ......................................................... 46 Figure 6-8: Section B-B of the Amphitheatre at Nehru ground. ....................................................................... 46 Figure 6-9: Conceptual sketch of plantings and jogging track in the Children Park. ....................................... 46 Figure 6-10: Fencing of the Ghats at the temple area. .................................................................................... 47

City Sanitation Plan
vi
TABLES Table 1-1: Average annual rainfall (mm) in Nagaon. ......................................................................................... 4 Table 1-2: Maximum and minimum monthly temperatures in the Nagaon district. ............................................ 4 Table 1-3: Drains to be improved (Source: Data from PCBA, 2010). ................................................................ 6 Table 1-4: Administrative divisions in the Nagaon district. ................................................................................. 7 Table 1-5: Types of Institutions in Nagaon District. ............................................................................................ 8 Table 1-6: Disaster Management Authority. ..................................................................................................... 11 Table 1-7: Demographic details of Nagaon town. ............................................................................................ 11 Table 1-8: Ward wise population of Nagaon Municipal area (Source: Census of India). ................................ 12 Table 1-9: Population Projection by Different Methods. ................................................................................... 13 Table 2-1: Water Supply by Source. ................................................................................................................ 15 Table 2-2: Waste water Generation in Nagaon town. ...................................................................................... 17 Table 2-3: Calculation of per Capita Sewage Generation. ............................................................................... 17 Table 2-4: Projection for Total Waste Water Generation for Nagaon town (Population projection can be
found in Table 1-9). ...................................................................................................................... 17 Table 2-5: Effluent limits prescribed by NRCD (see Table 4.7 in NRCD). ....................................................... 20 Table 2-6: NRCD water quality limits for rivers (designated best use bathing) (see Tables 2.3 and 4.5
in NRCD). ..................................................................................................................................... 22 Table 3-1: Ward Population in the Nagaon District. ......................................................................................... 23 Table 3-2: Household Data on Availability of Latrines. .................................................................................... 24 Table 3-3: Slum Wise Population Data. ........................................................................................................... 24 Table 3-4: Number of Toilet Facilities............................................................................................................... 24 Table 3-5: Nagaon Population Data. ................................................................................................................ 25 Table 4-1 : Composition of Solid Waste. .......................................................................................................... 29 Table 5-1: List of Key Stakeholder. .................................................................................................................. 36 Table 5-2: Partial list of officials and others consulted so far. .......................................................................... 36 Table 5-3: List of Stakeholder that attended the meeting on the 4
th December 2013. .................................... 37
Table 7-1: Schemes within the area of responsibility of government or public agencies. ............................... 49 Table 7-2: Phased implementation of the CSP. The years shown are an example that may be changed
during actual implementation. ...................................................................................................... 50 Table 7-3: Strategic Planning Framework. ....................................................................................................... 51 Table 8-1: List of maps. .................................................................................................................................... 52
LIST OF KEY ABBREVIATIONS BOD : Biological Oxygen Demand
CDM : Clean Development Mechanism
COD : Chemical Oxygen Demand
CPCB : Central Pollution Control Board
CPHEEO : Central Public Health Environmental Engineering Organisation
CSP : City Sanitation Plan
CWC : Central Water Commission
DA : Drainage Area
DBO : Design, Build & Operate
DO : Dissolved Oxygen
DPR : Detailed Project Report
FR : Feasibility Report
GIS : Geographical Information System
GL : Ground Level
GoI : Government of India
ICT : Information and communications technology
IEC : Information, Education & Communication
JNNURM : Jawahar Lal Nehru National Urban Renewable Mission
LPD : Litres Per Day
City Sanitation Plan
vii
MLD : Million Litres per Day
MoEF : Ministry of Environment and Forests, Govt. of India
MSW : Municipal Solid Waste
NGRBA : National Ganga River Basin Authority
NMB : Nagaon Municipal Board
NMC : Nagaon Municipal Corporation
NRCD : National River Conservation Directorate
NRCP : National River Conservation Plan
O&M : Operation and Maintenance
PCBA : Pollution Control Board, Assam
PFR : Project Feasibility Report
PHE : Public Health Engineering
PMU : Project Management Unit
PS : Pumping Station
RFD : River Front Development
SPS : Sewage Pumping Station
SS : Suspended Solids
STP : Sewerage Treatment Plant
SWM : Solid Waste Management
TSS : Total Suspended Solids
ULB : Urban Local Bodies

City Sanitation Plan
viii
Salient Features of the Project
Background and Objective
A study conducted by the Central Pollution Control Board (CPCB) identified the Kolong River
(Kolong), a tributary of Brahmaputra River as one of 71 most polluted rivers in India. The Kolong
originates from the Brahmaputra River in the Hatimura region of Jakhalabandha (Nagaon
district, Assam), and after traversing approximately 250 kms through the districts of Nagaon,
Morigaon and Kamrup, rejoins the Brahmaputra River at Kolongpar near Guwahati. The river
flows through the heart of the Nagaon urban area and divides the town into two regions (Nagaon
and Haiborgaon).
The Kolong River stretch which runs through the Nagaon town (Nagaon) is polluted resulting in
environmental degradation and continues to impact the health/hygiene of the inhabitants in the
surrounding area. Therefore, the Pollution Control Board of Assam (PCBA) has commissioned
preparation of this Detailed Project Report (DPR) for Kolong in accordance with the Ministry of
Environment and Forests (MoEF), National River Conservation Directorate (NRCD) guidelines
(NRCD, 2010).
The NRCD had earlier prescribed specific guidelines for the preparation of the Project Feasibility
Report (PFR) and DPR under the National River Conservation Plan. Subsequent developments
including the formulation of the March 2001 resolution by the National River Conservation
Authority, lead to the issuance of new guidelines for the preparation of the DPR under the
consolidated National River Conservation Plan and the National Lake Conservation Plan. The
overall objective of the DPR is formulating a comprehensive and integrated river restoration plan
for the Kolong in accordance with the 2010 NRCD guidelines.
Scope of the Work
Per the NRCD (2010) guidelines, the DPR will be prepared in a three-stage process related to
sewerage schemes, namely:
City Sanitation Plan (CSP), which constitutes this report.
Project Feasibility Report (PFR) for sewerage scheme.
Detailed Project Report (DPR).
The DPR will possess the following salient features:
Adopt a holistic approach and provide for an integrated sewer network up to house-
property lines in place of drain interception and diversion to ensure full coverage of
Nagaon town and thereby transport all sewage to treatment plants for optimal utilization.
Incorporate dovetailing with projects under the JNNURM/UIDSSMT/State Plan to
ensure optimal utilization of resources on a priority basis.
Adopt the Design, Build & Operate model for efficient operation and maintenance of
river conservation schemes.
Incorporate a stakeholder focused consultative approach at the stage of formulation and
implementation of the project, to ensure active involvement of various stakeholders and
the civil society to generate support and encourage ownership.
Apply cutting-edge information and communications technology (ICT) tools and software
for project planning and design.
Select the most innovative and best technology options for treatment of sewage.
Selection and analysis of technical and financial sustainability of created assets created
for this life cycle study along with detailed analysis of the performance metrics will be
further considered at PFR stage.
City Sanitation Plan
ix
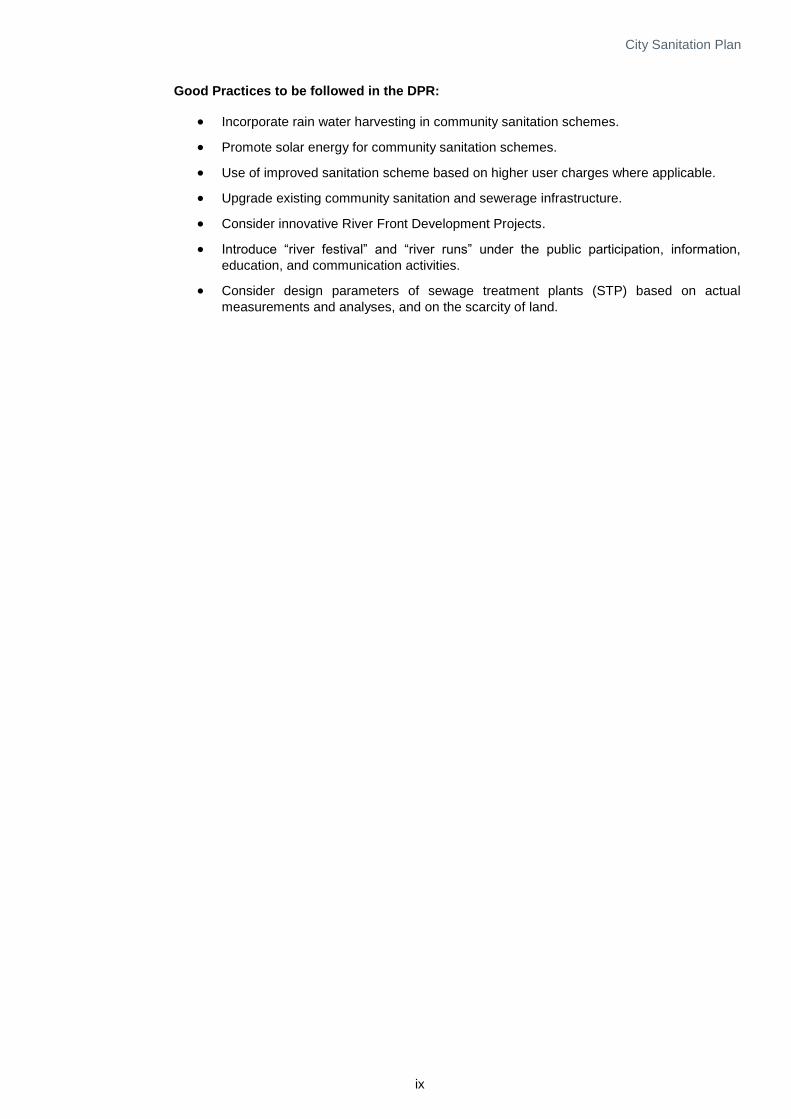
Good Practices to be followed in the DPR:
Incorporate rain water harvesting in community sanitation schemes.
Promote solar energy for community sanitation schemes.
Use of improved sanitation scheme based on higher user charges where applicable.
Upgrade existing community sanitation and sewerage infrastructure.
Consider innovative River Front Development Projects.
Introduce “river festival” and “river runs” under the public participation, information,
education, and communication activities.
Consider design parameters of sewage treatment plants (STP) based on actual
measurements and analyses, and on the scarcity of land.
City Sanitation Plan
x
Executive Summary
The Nagaon stretch of Kolong suffers from environmental degradation and continues to impact
the health/hygiene of the inhabitants in the surrounding area. Therefore, PCBA has assigned its
highest priority to restoring the Kolong in accordance with the NRCD guidelines by adopting a
series of integrated conservation measures. These measures include among others; waste
water management; solid waste management; water resources management for hydraulic
improvement of the river channel; provision of civil amenities along the river and around the area
of influence; and, formulation of an awareness program among the affected communities and
stakeholders to refrain from activities that degrade the condition of the river in any manner. The
conservation measures will be analysed and documented in a DPR following NRCD (2010)
guidelines. The DPR will thereafter serve as the primary guidance document for future river
restoration measures.
The overall aim of the project is to revitalize the Kolong within the context of the continued
urbanization of Nagaon by restoring it to its natural state, while allowing the river system to
continue to support flood management, landscape development and recreational activities. In its
current degraded state, the Kolong serves as an extended sewer canal running through the
densest populated areas within Nagaon. The water quality of the river will be restored per NRCD
guidelines by: restricting inflows of raw sewerage from residential/commercial establishments;
limiting direct discharge from storm water drains along roads adjacent to the river; and
preventing unabated dumping of solid waste by communities residing along the river. Measures
will be adopted to augment inflow of clean water to improve river hydraulics and flood
management controls, and to develop an integrated water resource management system to
sustain optimum water levels required in the river during the dry winter months. The
revitalization efforts will incorporate riverfront development to encourage public participation and
ownership of the river. It is noted that this DPR is one of the several initiatives currently
underway by the Government of Assam to improve the living conditions in Nagaon.
The DPR is being prepared by an experienced team of Indian and international professionals
with a wide range of expertise in river restoration and wastewater management controls. In
addition to collecting data and reviewing reports and documents of relevant programmes,
consultations have been carried out with relevant Government agencies, municipalities,
community members and other stakeholders. The DPR will also address diverse yet related
issues such as environmental sustainability and dependency of local communities. An action
plan has been drawn up per contract provisions and includes data collection and field surveys,
preparation of the City Sanitation Plan, assessment of the feasibility of the main components of
the proposed pollution abatement and river conservation measures, and finally preparation of
the DPR.
City Sanitation Plan
xi
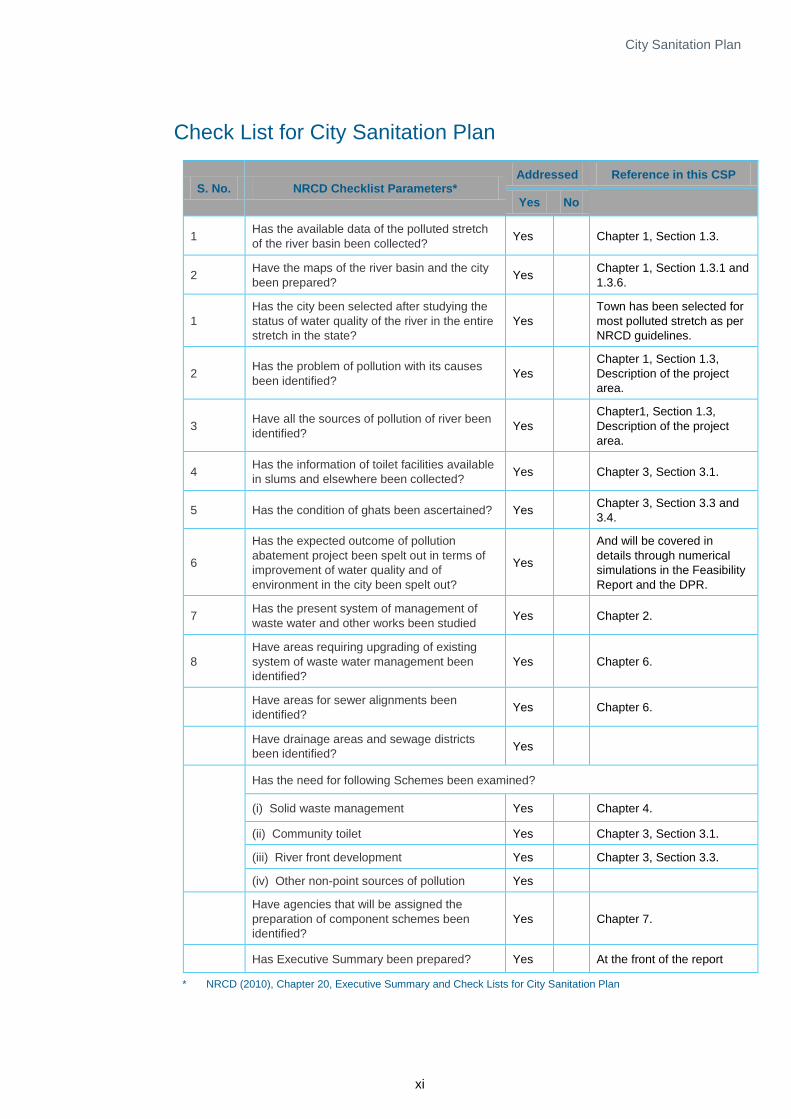
Check List for City Sanitation Plan
S. No. NRCD Checklist Parameters* Addressed Reference in this CSP
Yes No
1 Has the available data of the polluted stretch
of the river basin been collected? Yes
Chapter 1, Section 1.3.
2 Have the maps of the river basin and the city
been prepared? Yes
Chapter 1, Section 1.3.1 and
1.3.6.
1
Has the city been selected after studying the
status of water quality of the river in the entire
stretch in the state?
Yes
Town has been selected for
most polluted stretch as per
NRCD guidelines.
2 Has the problem of pollution with its causes
been identified? Yes
Chapter 1, Section 1.3,
Description of the project
area.
3 Have all the sources of pollution of river been
identified? Yes
Chapter1, Section 1.3,
Description of the project
area.
4 Has the information of toilet facilities available
in slums and elsewhere been collected? Yes
Chapter 3, Section 3.1.
5 Has the condition of ghats been ascertained? Yes
Chapter 3, Section 3.3 and
3.4.
6
Has the expected outcome of pollution
abatement project been spelt out in terms of
improvement of water quality and of
environment in the city been spelt out?
Yes
And will be covered in
details through numerical
simulations in the Feasibility
Report and the DPR.
7 Has the present system of management of
waste water and other works been studied Yes
Chapter 2.
8
Have areas requiring upgrading of existing
system of waste water management been
identified?
Yes
Chapter 6.
Have areas for sewer alignments been
identified? Yes
Chapter 6.
Have drainage areas and sewage districts
been identified? Yes
Has the need for following Schemes been examined?
(i) Solid waste management Yes
Chapter 4.
(ii) Community toilet Yes
Chapter 3, Section 3.1.
(iii) River front development Yes
Chapter 3, Section 3.3.
(iv) Other non-point sources of pollution Yes
Have agencies that will be assigned the
preparation of component schemes been
identified?
Yes
Chapter 7.
Has Executive Summary been prepared? Yes
At the front of the report
* NRCD (2010), Chapter 20, Executive Summary and Check Lists for City Sanitation Plan

City Sanitation Plan
1
1 About the Project Area
1.1 Authority for Preparation of Project
The authority for preparation of the project is:
River and Lake Conservation Cell
Pollution Control Board, Assam
Bamunimaidam; Guwahati-21
Ph: +91-361-2652774 (O)
+91-9435343530 (M)
Fax: +91-361-2550259
Website: www.pcbassam.org
1.2 Composition of the Team for CSP
The project team for the CSP consists of The Louis Berger Group, Inc. in consortium with DHI
(India) Water & Environment Pvt. Ltd.
1.3 Description of the Project Area
The Kolong River is a spill channel that diverts from the Brahmaputra River in the Hatimura
region of Jakhalabandha (Nagaon district, Assam; Figure 1-1 and Figure 1-2).
Figure 1-1: Study area.
City Sanitation Plan
2
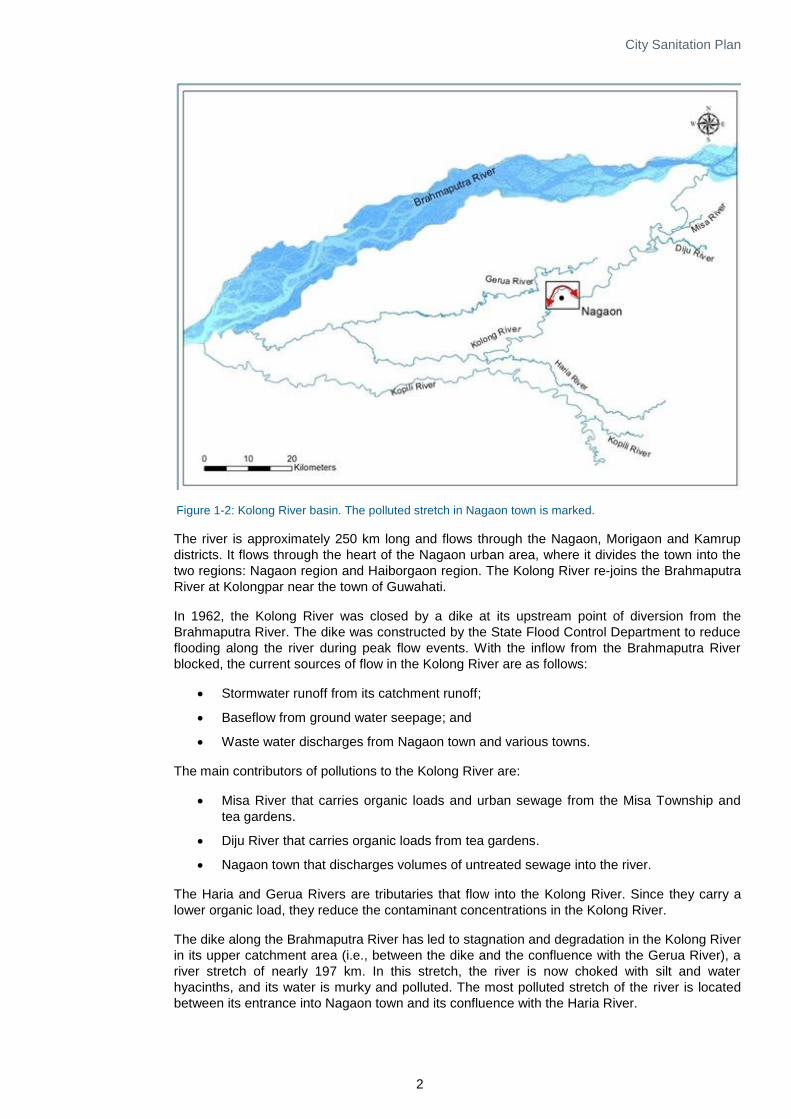
Figure 1-2: Kolong River basin. The polluted stretch in Nagaon town is marked.
The river is approximately 250 km long and flows through the Nagaon, Morigaon and Kamrup
districts. It flows through the heart of the Nagaon urban area, where it divides the town into the
two regions: Nagaon region and Haiborgaon region. The Kolong River re-joins the Brahmaputra
River at Kolongpar near the town of Guwahati.
In 1962, the Kolong River was closed by a dike at its upstream point of diversion from the
Brahmaputra River. The dike was constructed by the State Flood Control Department to reduce
flooding along the river during peak flow events. With the inflow from the Brahmaputra River
blocked, the current sources of flow in the Kolong River are as follows:
Stormwater runoff from its catchment runoff;
Baseflow from ground water seepage; and
Waste water discharges from Nagaon town and various towns.
The main contributors of pollutions to the Kolong River are:
Misa River that carries organic loads and urban sewage from the Misa Township and
tea gardens.
Diju River that carries organic loads from tea gardens.
Nagaon town that discharges volumes of untreated sewage into the river.
The Haria and Gerua Rivers are tributaries that flow into the Kolong River. Since they carry a
lower organic load, they reduce the contaminant concentrations in the Kolong River.
The dike along the Brahmaputra River has led to stagnation and degradation in the Kolong River
in its upper catchment area (i.e., between the dike and the confluence with the Gerua River), a
river stretch of nearly 197 km. In this stretch, the river is now choked with silt and water
hyacinths, and its water is murky and polluted. The most polluted stretch of the river is located
between its entrance into Nagaon town and its confluence with the Haria River.

City Sanitation Plan
3
1.3.1 Description of the Polluted Stretch
The Kolong River flows through the heart of the Nagaon, Morigaon and Kamrup districts and
transverses through densely populated residential, industrial and commercial areas. It carries a
portion of the municipal and other wastes from neighbouring communities and also serves as
the natural drainage for storm water runoff.
The pollution caused by domestic and industrial waste poses a threat to the people along the
river. The major focus of the restoration and conservation of the river is Nagaon town, the
biggest polluter, and its immediate downstream stretch. Misa, Kaliabor, Puranigudam,
Samaguri, Raha and Jamunamukh are also priority peripheral towns, where conservation works
should to be taken up in the future.
1.3.2 Justification for selecting the Town for Project Formulation under NRCP/NGRBA
A study by the Central Pollution Control Board found that the Kolong River is among the most
polluted rivers in India. Similarly, the NRCD (2010) guidelines identify the Kolong River as one of
the rivers to consider for conservation.
There has furthermore been a strong and collective demand from the inhabitants of Nagaon
town to clean up the river and bring it back to its past pristine status along with a healthy
ecosystem in the river basin.
1.3.3 Brief History of the Town
The present Nagaon district was once known as Khagarijan with its headquarter at
Paranigudam. At that time there was a canal in the heart of the district. This canal was covered
by reeds which were locally known as Khagari (hence the name Khagarijan).
During the reign of the Ahom King Pratap Sinha (1603 -1641 AD) the Kacharis attacked his
kingdom and advanced as far as to Kaliabor. The people in the area between Kaliabor and
Raha fled in panic. After expulsion of the Kacharis from the Ahom Kingdom, the king deputed an
officer named Momai Tamuli Brabarua to reconstruct the area. Brabarua established new
villages for the repatriated fugitives. The new settlements were called Nagaon, which stands for
‘new village settlement’, a name later given to the district.
1.3.4 Geographical Location
The Nagaon district in Assam is situated on the south bank of the Brahmaputra River (between
25º45’ and 26º45’ North and 91º50’ and 93º20’ East). It is bounded by six other districts (Figure
1-1). The Nagaon district covers an area of 4,002 km2 making it one of the largest district in
Assam.
1.3.5 Climate
The climate of the Nagaon district has the following characteristics:
Winter: Dry and cool winter months with little rain and moderate winds from the east and
north-east (north-east monsoon). Fog is a predominant feature of the weather condition
during this season.
Pre-monsoon season: The winter period is followed by the pre-monsoon season with
thunderstorms from March to May.
Monsoon season: Humid and hot conditions in summer months with the south-west
monsoon and abundant rains.
Post-monsoon season: This season lasts from October to November.

City Sanitation Plan
4
The average annual rainfall in the district was 1,788 mm between years 2000 and 2010 (Table
1-1; Figure 1-3). Annual rainfall in the district ranges from approximately 1,000 mm in the south
to 2,000 mm in the north. About 68% of the annual rainfall amount falls in the period from June
to September, with July being the rainiest month of the year. In the pre-monsoon months of April
and May and the post-monsoon month of October, rainfall occurs mostly as thundershowers.
Table 1-1: Average annual rainfall (mm) in Nagaon.
Year Average Annual Rainfall (mm)
2000 2,381
2001 1,556
2002 1,865
2003 2,064
2004 2,060
2005 2,778
2006 645
2007 1,620
2008 1,457
2009 1,017
2010 2,221
Average (2000 to 2010) 1,788
Source: Nagaon Water Resource Division, 2011
Figure 1-3: Average annual rainfall (mm) in the Nagaon district (data from Nagaon Water Resource Division, 2011).
Air temperatures are recorded at two meteorological observatories in the district, one at
Lumding and the other at Chaparmukh. The record from Lumding covers a long period while
that from Chapurmukh only covers a short period. In the five (5) years from 2009 to 2013, daily
temperatures ranged from a maximum of 34°C in July-August to a minimum of 10°C in January
(Table 1-2; Figure 1-4).
Table 1-2: Maximum and minimum monthly temperatures in the Nagaon district.
Month Max Temperature
(°C) Min Temperature
(°C)
January 23.2 10.3
February 27.7 13.6
March 30.8 16.8
April 31.0 20.3
May 32.7 22.8
June 33.5 25.3
July 33.6 25.6
August 33.6 25.5
September 33.5 24.8
October 32.5 21.9
November 28.6 16.7
December 25.3 13.3

City Sanitation Plan
5
Figure 1-4: Maximum and minimum monthly temperatures in the Nagaon district in 2010 (data from Nagaon Water Resource Division, 2011).
1.3.6 Topography
The catchment area is bordered by the Meghalaya Hills to the south and the Brahmaputra River
to the north (Figure 1-5). Due to the downwards areal slope, storm water from the wet
Meghalaya Hills flows towards the Brahmaputra River through numerous smaller rivers.
However, much of the catchment area of the Kolong River in located in the low-gradient plain
south of the Brahmaputra River in the northern part of Assam.
Figure 1-5: Topographic elevations (DEM) in the Kolong catchment area.

City Sanitation Plan
6
1.3.7 Drainage Channels
There is no well-connected drainage system in Nagaon town. Many of the open or closed-at-
surface drains running along the side of the roads are either blocked or not linked up properly.
That condition is one of the reasons for floods in the town particularly during the monsoon
season. After heavy showers water-logged areas can be found in the town. The worst affected
areas are:
Part of Panigaon
Hotelbari area
Teliapatti
Santipur
Lakshminagar
Islampatty
Area opposite to Haibargaon railway station.
Table 1-3 lists the drains proposed to be improved by the State Government (PCBA, 2010).
Table 1-3: Drains to be improved (Source: Data from PCBA, 2010).
S.No. Name of the drain Length
(m) Width
(m) Drain type
1 NH-37 688 1.25 Type -1
2 Namghar Road 785 1.25 Type -1
3 Radhika Sati Road 688 1.25 Type -1
4 Rudraram Bora Road 1,313 1.25 Type -1
5 NH-37 (Dhing chariali to Kolong River 938 1.25 Type -1
6 Tarunram Phukam Road 1,250 1.25 Type -1
7 Laokhowa Road 1,875 1.25 Type -1
8 Madhav Dev road 2,063 1.25 Type -1
9 Mohichandra Bora Road 850 1.25 Type -1
10 Gunabhira, Bora Road 1,250 1.25 Type -1
11 NH-37 to Jail Road( Bara Bazar) 1,250 1.25 Type -1
12 Gurudwara Road 1,188 1.25 Type -1
13 Bimala Bora Road 1,750 1.25 Type -1
14 Masjid Road 1,000 1.25 Type -1
15 Kirtanghar Road 1,000 1.25 Type -1
16 Motiram Bora Road 937 1.25 Type -1
17 Milanpur Road 1,125 1.25 Type -1
18 Abad Nagar area road 1,938 1.25 Type -1
19 ITI Road 1,000 1.25 Type -1
20 RK Mission Road 1,681 1.25 Type -1
21 ADP Road 1,375 1.25 Type -1
22 Basanti Bora Road 2,250 1.25 Type -1
23 Railway open drain 813 1.50 Type -3
24 NH-37 ( from ADP Road to Nagaon College junction) 1,250 1.25 Type -1
25 NH-37 Via Ghanashyam Bezbarua Rd. Manik Bezbarua Road to Kolong
1,750 1.50 Type -3
26 Amolapatty Rd to Kolong via Girls College Road 1,500 1.25 Type -1
27 Amolapatty Rd. to NH-37 via Stadium Road 1,375 1.4 Type -2
28 Chay Ali to Kolong via Amolapatty Rd. and Shankar Mandir Road
1,400 1.4 Type -2
29 Polytechnic Road to Kolong via Chay Ali 2,938 1.25 Type -1
30 NH-37 from Polytechnis to Panigaon Chariali 2,250 1.25 Type -1
31 Park Road 1,188 1.25 Type -1
32 Bara Bazar crossing N. Ahmed Road Thana Road and Azad Road
3,125 1.4 Type -2
33 Drain from N Ahmed to Mori Kolong 2,250 1.4 Type -2
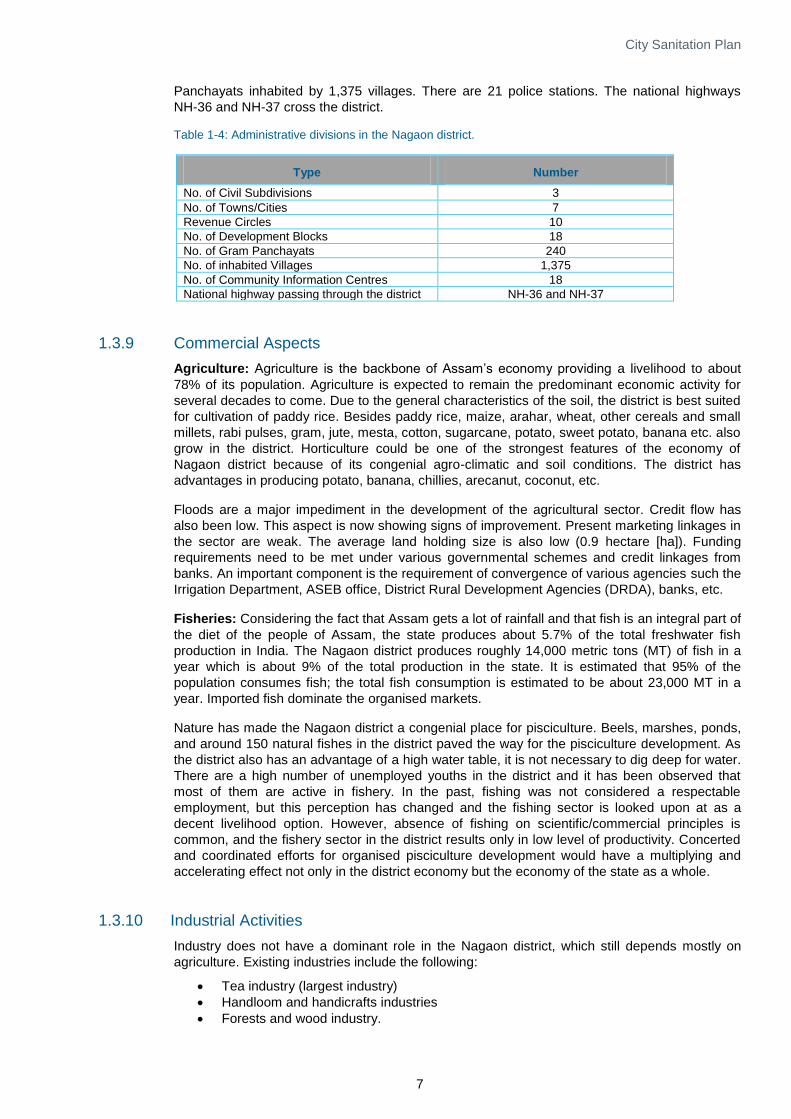
1.3.8 Administrative Divisions
Nagaon district has 3 civil subdivisions, namely Nagaon, Kaliabor and Hojai (Table 1-4). It is
divided into 10 revenue circles and 18 development blocks. The biggest of the seven
communities in the district is Nagaon town with 126,115 inhabitants. There are 240 Gram
City Sanitation Plan
7
Panchayats inhabited by 1,375 villages. There are 21 police stations. The national highways
NH-36 and NH-37 cross the district.
Table 1-4: Administrative divisions in the Nagaon district.
Type Number
No. of Civil Subdivisions 3
No. of Towns/Cities 7
Revenue Circles 10
No. of Development Blocks 18
No. of Gram Panchayats 240
No. of inhabited Villages 1,375
No. of Community Information Centres 18
National highway passing through the district NH-36 and NH-37
1.3.9 Commercial Aspects
Agriculture: Agriculture is the backbone of Assam’s economy providing a livelihood to about
78% of its population. Agriculture is expected to remain the predominant economic activity for
several decades to come. Due to the general characteristics of the soil, the district is best suited
for cultivation of paddy rice. Besides paddy rice, maize, arahar, wheat, other cereals and small
millets, rabi pulses, gram, jute, mesta, cotton, sugarcane, potato, sweet potato, banana etc. also
grow in the district. Horticulture could be one of the strongest features of the economy of
Nagaon district because of its congenial agro-climatic and soil conditions. The district has
advantages in producing potato, banana, chillies, arecanut, coconut, etc.
Floods are a major impediment in the development of the agricultural sector. Credit flow has
also been low. This aspect is now showing signs of improvement. Present marketing linkages in
the sector are weak. The average land holding size is also low (0.9 hectare [ha]). Funding
requirements need to be met under various governmental schemes and credit linkages from
banks. An important component is the requirement of convergence of various agencies such the
Irrigation Department, ASEB office, District Rural Development Agencies (DRDA), banks, etc.
Fisheries: Considering the fact that Assam gets a lot of rainfall and that fish is an integral part of
the diet of the people of Assam, the state produces about 5.7% of the total freshwater fish
production in India. The Nagaon district produces roughly 14,000 metric tons (MT) of fish in a
year which is about 9% of the total production in the state. It is estimated that 95% of the
population consumes fish; the total fish consumption is estimated to be about 23,000 MT in a
year. Imported fish dominate the organised markets.
Nature has made the Nagaon district a congenial place for pisciculture. Beels, marshes, ponds,
and around 150 natural fishes in the district paved the way for the pisciculture development. As
the district also has an advantage of a high water table, it is not necessary to dig deep for water.
There are a high number of unemployed youths in the district and it has been observed that
most of them are active in fishery. In the past, fishing was not considered a respectable
employment, but this perception has changed and the fishing sector is looked upon at as a
decent livelihood option. However, absence of fishing on scientific/commercial principles is
common, and the fishery sector in the district results only in low level of productivity. Concerted
and coordinated efforts for organised pisciculture development would have a multiplying and
accelerating effect not only in the district economy but the economy of the state as a whole.
1.3.10 Industrial Activities
Industry does not have a dominant role in the Nagaon district, which still depends mostly on
agriculture. Existing industries include the following:
Tea industry (largest industry)
Handloom and handicrafts industries
Forests and wood industry.
City Sanitation Plan
8
In addition, the following industrial projects are taken up in cooperative and state sectors:
Assam Cooperative Jute Mill Ltd.
Kampur Cooperative Sugar Mill
Katimari Weaving Project
Sack Craft paper project at Dhing.
These are all medium-scale industrial projects. Whereas the Jute Mill at Silghat is flourishing,
the Kampur Sugar Mill has been struggling.
The handloom industry is the most important cottage industry in Assam with a glorious past. It is
closely associated with art and culture of the society. Weaving is a traditional activity of the
state. Weaving of fabrics is a way of livelihood for a large number of rural families and artisans.
Looms are often found in rural households. However, weaving is only a part-time activity and not
the primary bread-earning activity. As a result, the handloom industry has not yet been
developed to its full potential. Jajori, located about 17 km from Nagaon town, is an important
centre of handloom production. Famous for its Kacha pat products, there are approximately
6,705 weavers which include most of the local families. In addition, the government has
established a handloom production centre at Jajori. The Nagaon district has a potential by way
of organising, modernisation, training and providing adequate marketing linkages, and it is
proposed to use the Self-Help Group (SHG) method to develop its potential more fully.
Handicraft is also an important cottage and household industry, providing self-employment
opportunities for the inhabitants in rural areas to supplement their earnings. The most important
handicraft are: 1) kuhila craft; 2) pottery and terracotta; 3) jute, cane and bamboo products; and
4) rantholi jewellery.
The Nagaon district has potential for agro-based industries, including pisciculture and
sericulture. Identified limitations for such industries are power shortages, seasonal floods,
shortage of industrial labour, and lack of practical entrepreneurial motivation or experience.
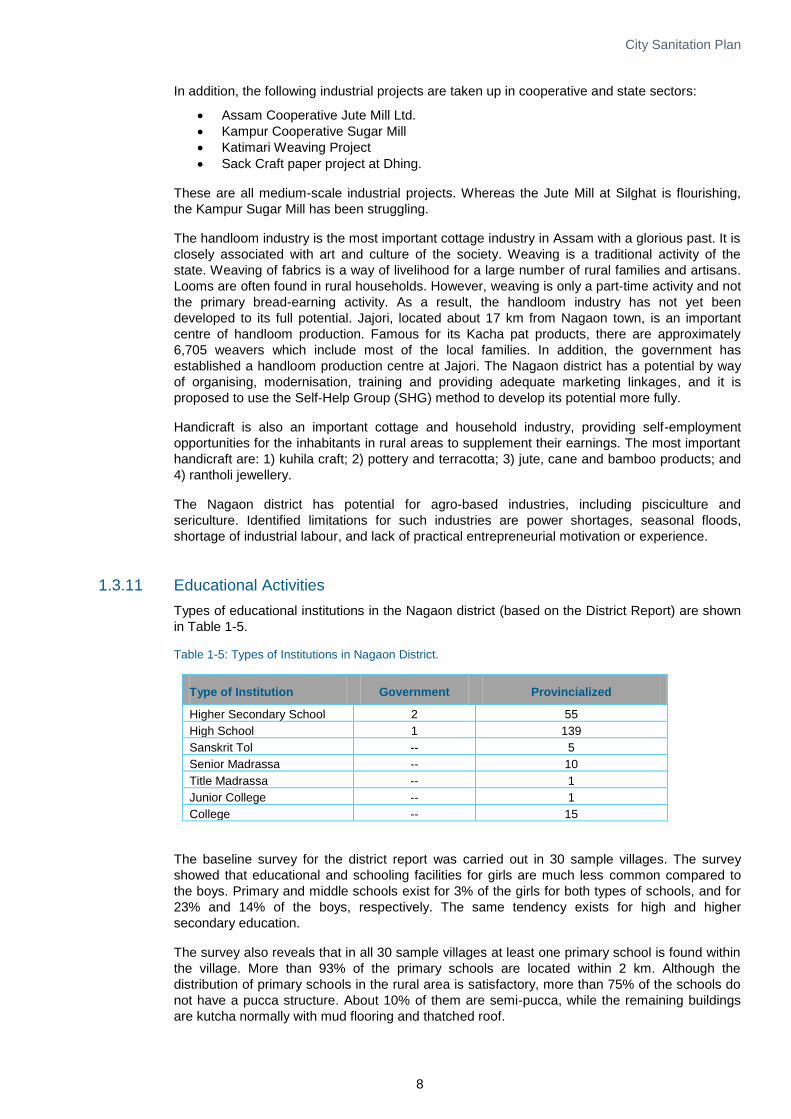
1.3.11 Educational Activities
Types of educational institutions in the Nagaon district (based on the District Report) are shown
in Table 1-5.
Table 1-5: Types of Institutions in Nagaon District.
Type of Institution Government Provincialized
Higher Secondary School 2 55
High School 1 139
Sanskrit Tol -- 5
Senior Madrassa -- 10
Title Madrassa -- 1
Junior College -- 1
College -- 15
The baseline survey for the district report was carried out in 30 sample villages. The survey
showed that educational and schooling facilities for girls are much less common compared to
the boys. Primary and middle schools exist for 3% of the girls for both types of schools, and for
23% and 14% of the boys, respectively. The same tendency exists for high and higher
secondary education.
The survey also reveals that in all 30 sample villages at least one primary school is found within
the village. More than 93% of the primary schools are located within 2 km. Although the
distribution of primary schools in the rural area is satisfactory, more than 75% of the schools do
not have a pucca structure. About 10% of them are semi-pucca, while the remaining buildings
are kutcha normally with mud flooring and thatched roof.

City Sanitation Plan
9
There are approximately 15 degree colleges and one junior college in Nagaon district. Main
educational institutions in the Nagaon district are listed below:
Assam Agricultural University
Homeopathic Medical College, Nagaon
A.D.P. College (named after Anandaram Dhekial Phukan)
Khagorijan College (named after the old administrative headquarter of the Nowgong
District)
Nowgong Law College
1.3.12 Cultural Activities
The Nagaon district has a rich cultural heritage:
Place Bordowa, where the great Vaishnavite Saitn Mapurush Srimanta Shakardev was
born, is situated just 18 km northwest from Nagaon town.
There are two Satras (Vaishnavite monasteries) in Nagaon, one is Narowa Sattra and
one is Salaguri Sattras.
There is a mini museum in Narowa Sattras.
There are numerous Namghars (worship places) but the main ones are Bharalli
Namghar, situated in Hatbar. Subhagya Madhav, Dulal Madhav and Gopal Madhav are
three ancient temples built during the reign of Ahom King Shiva Singh. People visit the
Namghars regularly, particularly during the birth and death anniversaries of the
Vainavite saints, and on occasions such as Janmastami, Bihu and Assamese New
Year.
The colourful culture of Nagaon can be seen in its music and dance, art and craft forms,
festivals, and food. Of the dances practised in Nagaon, Nagayan Ojhapali is most well-known.
Tourism attractions in the Nagaon district include the following:
Kaziranga National Park: It is a world heritage site giving home to five big mammals: the
great Indian one-horned rhinoceros, the royal Bengal tiger, the Asian elephant, the
eastern swamp deer, and the Asiatic wild buffalo. Furthermore, it is the habitat of a
sizeable population of other rare and endangered species. Every year thousands of
tourists visit this park.
Lowkhowa Avayaranya: The park is situated at Lowkhowa about 25 km from Nagaon
town and covers an area of 70 km2. The main attraction is its great Indian one-horned
rhinoceros. Various species of birds and other animals like tiger, leopard, Asiatic buffalo,
wild boar, civet cat, leopard cat, hog deer, are also found in Lawkhowa.
Samaguri Bill (also known as Pokhi Tirtha): Situated about 16 km east of Nagaon town,
the area has migrating birds from different places of the world in the winter season. The
Rock Garden Amusement Park and Tanz Water Park, situated near Samaguri, are new
attractions for the Nagaon public.
Subdivision towns like Kaliabor (48 km east of Nagaon town) and Hojai (61 km from
Nagaon town) are historic places. Hojai is renowned as the granary of Assam and the
principal wholesale market for rice in Assam, though sugarcane, mustard, jute and
vegetables are also grown in abundance. Hojai is also the centre of the Agar perfume
industry.
Silghat: Situated at almost 50 km from Nagaon is a vital and picturesque river port lying
on the south bank of the Brahmaputra River. Pre-communication links of central Assam
across the Brahmaputra River are maintained through this port town. Besides playing
host to the Assam Cooperative Jute mill, Silghat also has several temples to enthral
visitors. A big Samantagiri hillock draws big crowds from everywhere.

City Sanitation Plan
10
Jugijan: Situated at about 6 km from Hojai, it has become well-known after the recent
discovery of remnants of a fort and three stone temples decorated with carvings and
base-reliefs.
Kamakhya Temple: The famous Kamakhya temple is situated in Silghat on the bank of
Brahmaputra River. The Ashok Astami Melas is held every year at the Kamakhya
temple.
Waterfalls like Akashiganaga (located near Doboka, 34 km to the south-east of Nagaon
town) and Champawati Kunda (located in Chapanala) are famous falls, and favourites
for many picknickers.
Other places like Ranthaliu village, located 4 km west of Nagaon town, is famous for its
gold-plated traditional ornaments. Jamnunamukh, located 35 km from Nagaon town is
also famous for its earthen wares.
1.3.13 Religious Activities
The population in the Nagaon district has the following religions, as per the District Report
(2010) that was based on a total of 900 sample households in 30 villages:
Muslim: 54.6%
Hindu: 45.2%
Christian: 0.2%
Of the total sample households, 11.8% were from Scheduled Caste (SC), 3.9% from Scheduled
Tribe (ST), and 21.6% from Other Backward Caste (OBC). The Muslim and Christian
households represent general caste.
1.3.14 Socio-Economic Status
As described in section 1.3.9, agriculture is the backbone of Nagaon’s economy and more than
78% of its working population derives their livelihood from agriculture. Fishing is another
common economic activity in the district.
People of Nagaon are in many ways still living the traditional Indian way. People help each other
during the time of family function, family crisis and also during festivals, like bihu and puja. The
community feeling is strong. In the namghars, most time of the year, people offer Prasad on the
occasion of death anniversaries, birthdays and any other important dates of family members and
also during Assamese New Year and during the month of Bhadra.
1.3.15 Town Management
The Nagaon Municipal Board is responsible for town management. The Chairman of the
Nagaon Municipal Board (NMB) is the head of the town and District Magistrate has the full
responsibility for the district. Disasters are managed by the district Disaster Management
Authority (Table 1-6).
1.3.16 Land Cost in and around the Town
Land cost at Nagaon vary by location, but typical cost for 1 katta is from 6-7 lakhs INR and up to
1 crore INR (1 katta is equal to 2,880 square feet).
1.3.17 City Development Plan
A development plan for Nagaon town is not available.

City Sanitation Plan
11
Table 1-6: Disaster Management Authority.
S.No. Designation Status
1 Deputy Commissioner, Nagaon Chairperson
2 Chairperson, Zilla Parishad, Nagaon Co-chairperson
4 Superintendent of Police, Nagaon Member
5 Jt. Director, Health Services, Nagaon Member
6 Executive Engineer, PWD (R) Nagaon State Road Division, Nagaon Member
7 Executive Engineer, PWD (R), Nagaon Rural Road Division, Nagaon Member
8 Executive Engineer, Nagaon Water Resources Division, Nagaon Member
9 Executive Engineer, Irrigation, Nagaon Division, Nagaon Member
10 Executive Engineer, PWD (R), Building Division, Nagaon Member
11 Executive Engineer, PHE, Dhing, Nagaon Member
12 Executive Engineer, NH-37, Nagaon Member
13 Executive Engineer, PHE, Nagaon Member
14 Executive Engineer, (PWD) Electrical Division, Nagaon Member
15 Executive Engineer PWD, Kaliabor Rural Road Division, Jakhalabandha, Nagaon
Member
1.4 Population within the Project Area
According to census data, the population of Nagaon town has grown by 30% in 20 years, from
93,350 in year 1991 to 1,21,628 in year 2011 (Table 1-7). The sex ratio between males and
females is near even. The most recent literacy rate was recorded with 74%.
Table 1-7: Demographic details of Nagaon town.
Area Year Population Sex Ratio (females per 1000
males) Literacy Rate (%)
Nagaon town
1991 93,350 929 55
2001 1,07,667 944 62
2011 1,21,628 962 74
Source: Census of India
1.4.1 Ward Wise Population
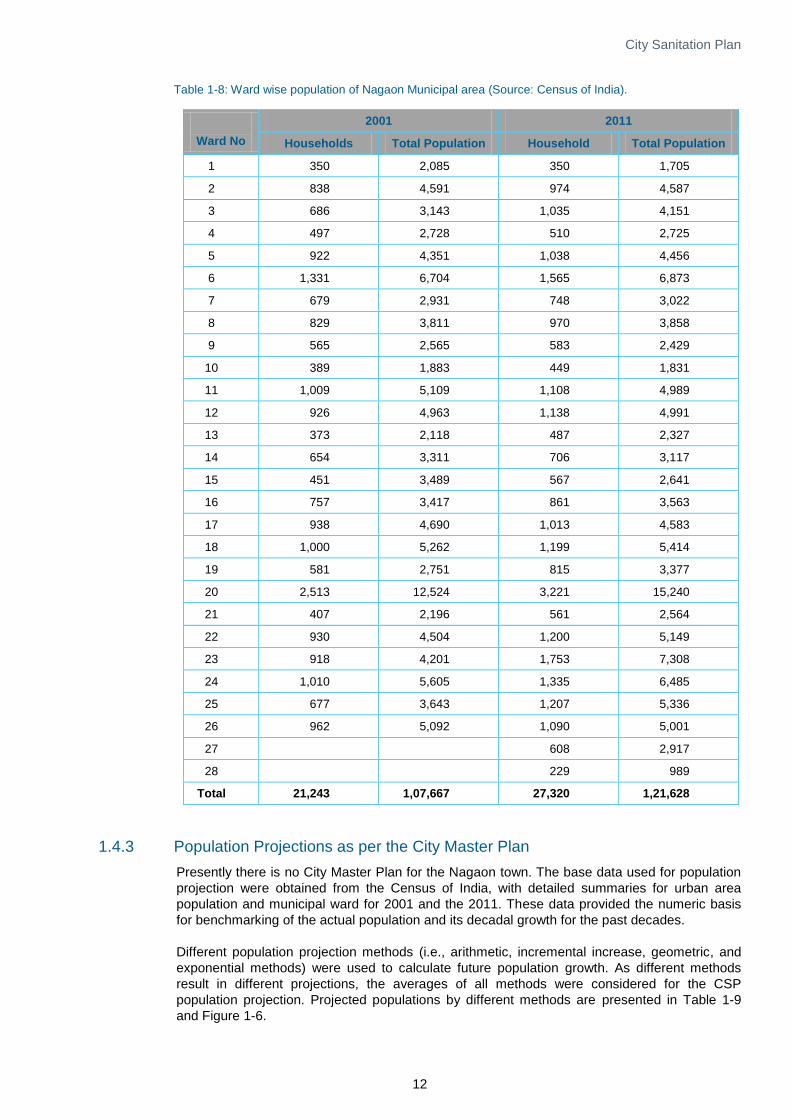
The ward wise population of the Nagaon town is presented in Table 1-8. Population and
number of households were obtained from census data of years 2001 and 2011.
The population in some of the wards increased in this time periods, while the population in other
wards decreased. Wards 20, 23 and 27 are the most developed wards in the town.
1.4.2 Slum Wise Population of the last 5 Decades
As per the 2011 census, the total slum population in Nagaon town was 18,110 which decreased
by almost 50% compared to the 2001 census data. One of the reasons for the decrease in the
slum population may be economic growth of the people. Sanitation facilities in slum areas
consist mostly of community toilets, which are connected to a septic tank and soak pit. The
condition of these community toilets is bad.
City Sanitation Plan
12
Table 1-8: Ward wise population of Nagaon Municipal area (Source: Census of India).
Ward No
2001 2011
Households Total Population Household Total Population
1 350 2,085 350 1,705
2 838 4,591 974 4,587
3 686 3,143 1,035 4,151
4 497 2,728 510 2,725
5 922 4,351 1,038 4,456
6 1,331 6,704 1,565 6,873
7 679 2,931 748 3,022
8 829 3,811 970 3,858
9 565 2,565 583 2,429
10 389 1,883 449 1,831
11 1,009 5,109 1,108 4,989
12 926 4,963 1,138 4,991
13 373 2,118 487 2,327
14 654 3,311 706 3,117
15 451 3,489 567 2,641
16 757 3,417 861 3,563
17 938 4,690 1,013 4,583
18 1,000 5,262 1,199 5,414
19 581 2,751 815 3,377
20 2,513 12,524 3,221 15,240
21 407 2,196 561 2,564
22 930 4,504 1,200 5,149
23 918 4,201 1,753 7,308
24 1,010 5,605 1,335 6,485
25 677 3,643 1,207 5,336
26 962 5,092 1,090 5,001
27
608 2,917
28 229 989
Total 21,243 1,07,667 27,320 1,21,628
1.4.3 Population Projections as per the City Master Plan
Presently there is no City Master Plan for the Nagaon town. The base data used for population
projection were obtained from the Census of India, with detailed summaries for urban area
population and municipal ward for 2001 and the 2011. These data provided the numeric basis
for benchmarking of the actual population and its decadal growth for the past decades.
Different population projection methods (i.e., arithmetic, incremental increase, geometric, and
exponential methods) were used to calculate future population growth. As different methods
result in different projections, the averages of all methods were considered for the CSP
population projection. Projected populations by different methods are presented in Table 1-9
and Figure 1-6.
City Sanitation Plan
13
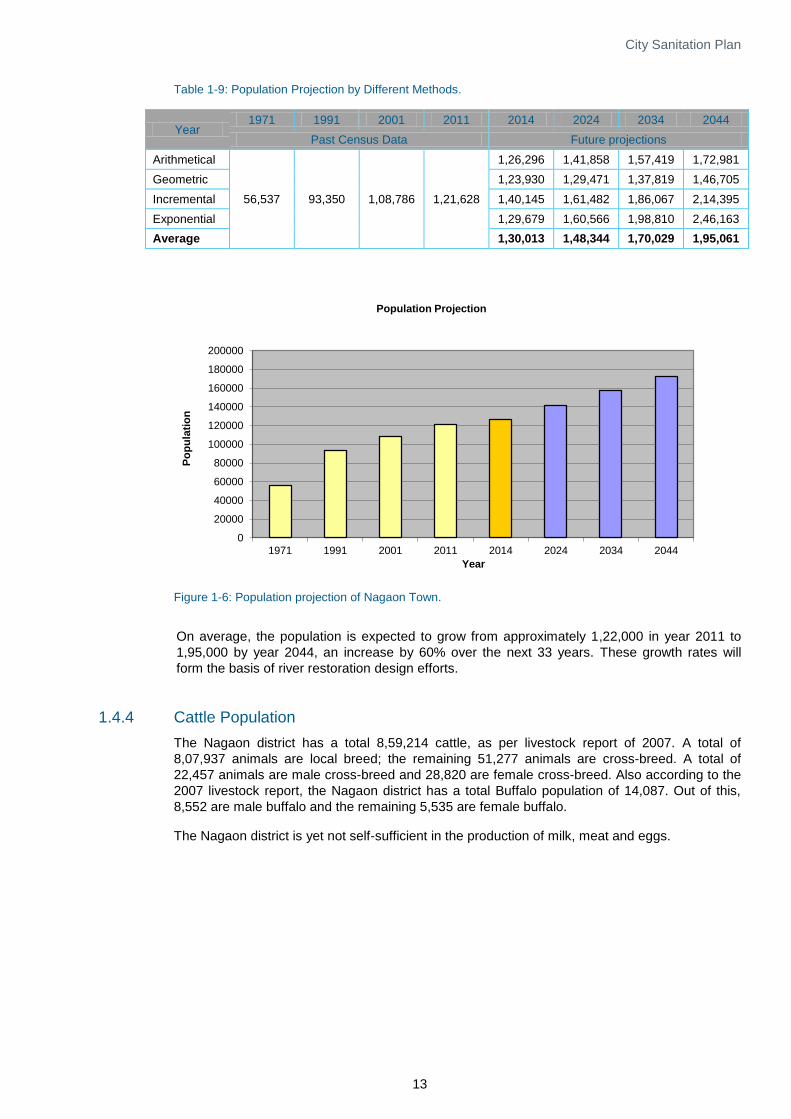
Table 1-9: Population Projection by Different Methods.
Year 1971 1991 2001 2011 2014 2024 2034 2044
Past Census Data Future projections
Arithmetical
56,537 93,350 1,08,786 1,21,628
1,26,296 1,41,858 1,57,419 1,72,981
Geometric 1,23,930 1,29,471 1,37,819 1,46,705
Incremental 1,40,145 1,61,482 1,86,067 2,14,395
Exponential 1,29,679 1,60,566 1,98,810 2,46,163
Average 1,30,013 1,48,344 1,70,029 1,95,061
Figure 1-6: Population projection of Nagaon Town.
On average, the population is expected to grow from approximately 1,22,000 in year 2011 to
1,95,000 by year 2044, an increase by 60% over the next 33 years. These growth rates will
form the basis of river restoration design efforts.
1.4.4 Cattle Population
The Nagaon district has a total 8,59,214 cattle, as per livestock report of 2007. A total of
8,07,937 animals are local breed; the remaining 51,277 animals are cross-breed. A total of
22,457 animals are male cross-breed and 28,820 are female cross-breed. Also according to the
2007 livestock report, the Nagaon district has a total Buffalo population of 14,087. Out of this,
8,552 are male buffalo and the remaining 5,535 are female buffalo.
The Nagaon district is yet not self-sufficient in the production of milk, meat and eggs.
0
20000
40000
60000
80000
100000
120000
140000
160000
180000
200000
1971 1991 2001 2011 2014 2024 2034 2044
Po
pu
lati
on
Year
Population Projection

City Sanitation Plan
14
2 Sewerage Work
2.1 Status of Water Supply
Water supply to Nagaon town is the responsibility of the Nagaon Municipal Corporation, but
presently the responsibility is held by the Public Health Engineering Department. People of
Nagaon get water through various sources, including piped water supply, dug wells, hand
pumps, tube and bore wells, and springs.
The piped water supply scheme was initiated in 1981. At the completion of the scheme, 4,477
households were covered by a tap connection, and 16 community taps were installed in 26
wards of the town. Ground water is pumped from six Deep Tube Wells (DTW; extending to
depth of 30 to 50 m) with the help of 12.5HP submersible pumps to a treatment plant. The
treated water is then stored in three underground reservoirs with capacities of 2.25 million liters
(ML), 1.75 ML and 1.25 ML. Water is then pumped to three Elevated Service Reservoirs (ESR)
with capacities of 1.8 ML, 1.2 ML and 0.9 ML (Figure 2-1) from where the water is supplied to
the consumers through the distribution network. Water is supplied for only one hour in the
morning.
Figure 2-1: Elevated service reservoirs in Zones 1, 2 and 3.
Presently, only 20% of the population is
supplied by treated water through the
distribution network. The remaining 80%
of the population uses different water
sources (Figure 2-2) primarily from the
ground. Most of the houses in the
outskirts have either tube or bore wells.
The health hazard of using ground water
is high because of elevated arsenic
concentration in several locations as well
as contamination from overflowing septic
tanks and soak pits. Some village
households use ponds as well to meet
certain types of water supply needs.
Figure 2-2: Example of water contamination by septic tank and water pump placed side by side by side.
City Sanitation Plan
15
2.1.1 Actual Water Supply from Different Sources
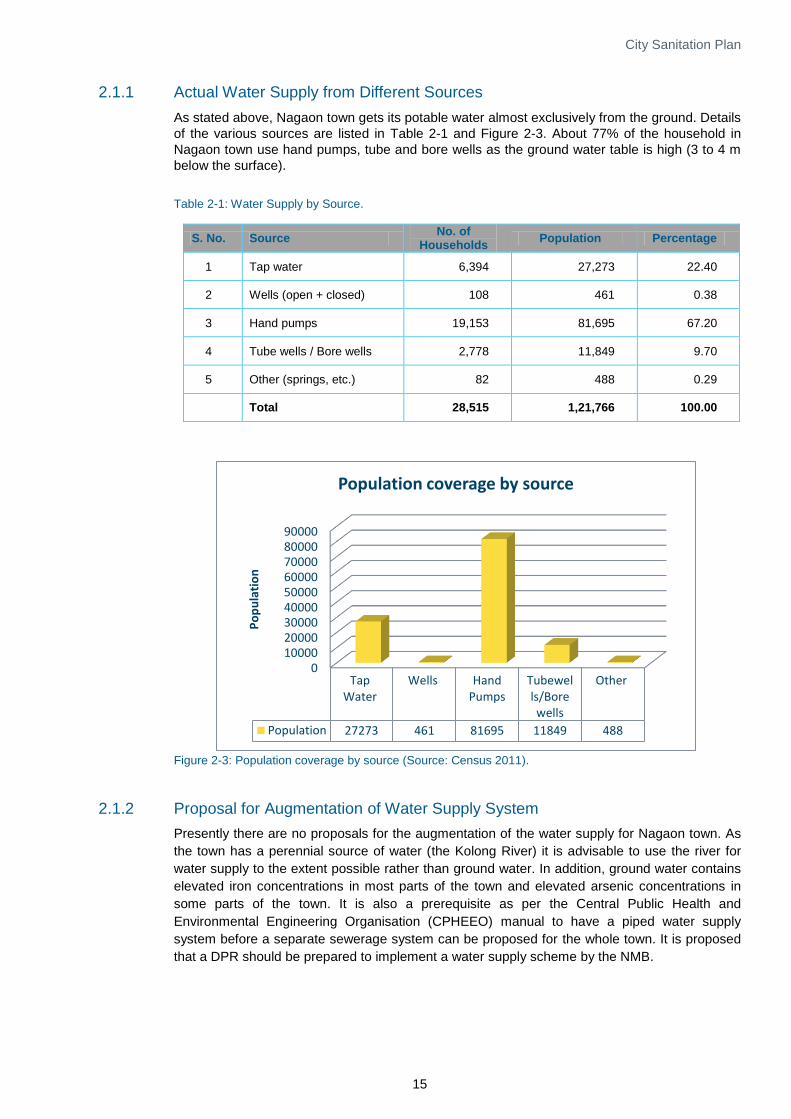
As stated above, Nagaon town gets its potable water almost exclusively from the ground. Details
of the various sources are listed in Table 2-1 and Figure 2-3. About 77% of the household in
Nagaon town use hand pumps, tube and bore wells as the ground water table is high (3 to 4 m
below the surface).
Table 2-1: Water Supply by Source.
S. No. Source No. of
Households Population Percentage
1 Tap water 6,394 27,273 22.40
2 Wells (open + closed) 108 461 0.38
3 Hand pumps 19,153 81,695 67.20
4 Tube wells / Bore wells 2,778 11,849 9.70
5 Other (springs, etc.) 82 488 0.29
Total 28,515 1,21,766 100.00
Figure 2-3: Population coverage by source (Source: Census 2011).
2.1.2 Proposal for Augmentation of Water Supply System
Presently there are no proposals for the augmentation of the water supply for Nagaon town. As
the town has a perennial source of water (the Kolong River) it is advisable to use the river for
water supply to the extent possible rather than ground water. In addition, ground water contains
elevated iron concentrations in most parts of the town and elevated arsenic concentrations in
some parts of the town. It is also a prerequisite as per the Central Public Health and
Environmental Engineering Organisation (CPHEEO) manual to have a piped water supply
system before a separate sewerage system can be proposed for the whole town. It is proposed
that a DPR should be prepared to implement a water supply scheme by the NMB.
0100002000030000400005000060000700008000090000
TapWater
Wells HandPumps
Tubewells/Borewells
Other
Population 27273 461 81695 11849 488
Po
pu
lati
on
Population coverage by source
City Sanitation Plan
16
2.2 Status of Existing Waste Water Disposal Works
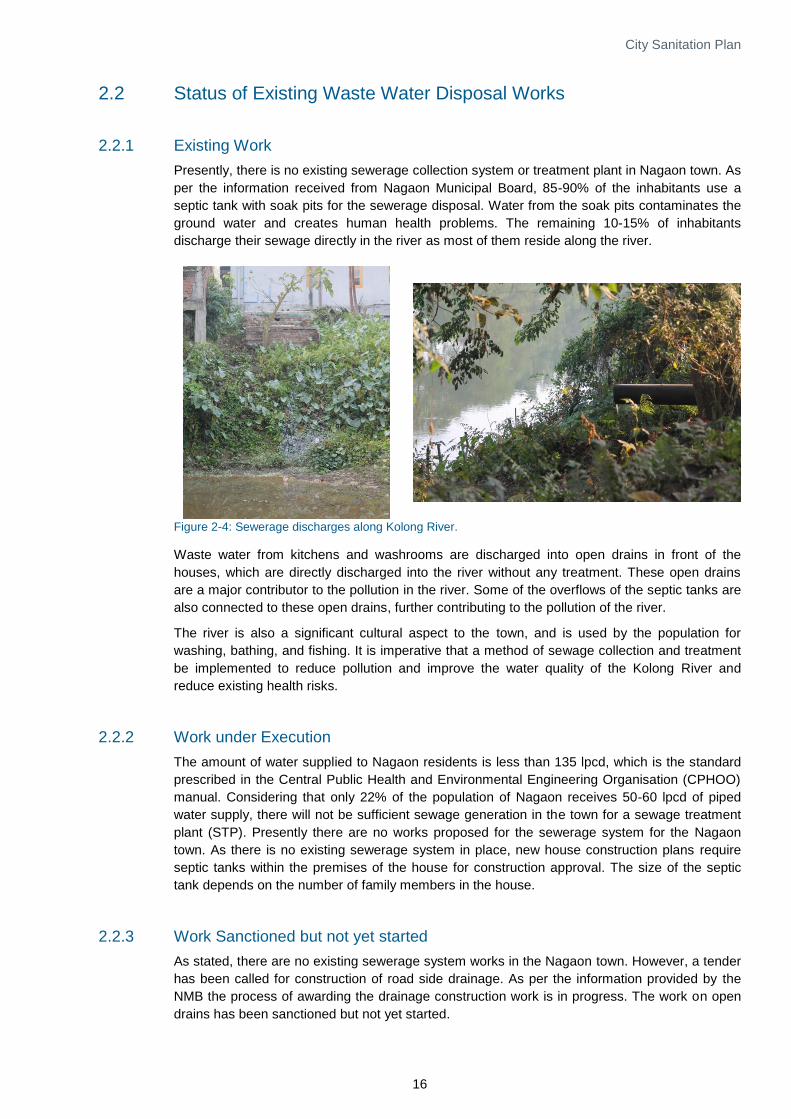
2.2.1 Existing Work
Presently, there is no existing sewerage collection system or treatment plant in Nagaon town. As
per the information received from Nagaon Municipal Board, 85-90% of the inhabitants use a
septic tank with soak pits for the sewerage disposal. Water from the soak pits contaminates the
ground water and creates human health problems. The remaining 10-15% of inhabitants
discharge their sewage directly in the river as most of them reside along the river.
Figure 2-4: Sewerage discharges along Kolong River.
Waste water from kitchens and washrooms are discharged into open drains in front of the
houses, which are directly discharged into the river without any treatment. These open drains
are a major contributor to the pollution in the river. Some of the overflows of the septic tanks are
also connected to these open drains, further contributing to the pollution of the river.
The river is also a significant cultural aspect to the town, and is used by the population for
washing, bathing, and fishing. It is imperative that a method of sewage collection and treatment
be implemented to reduce pollution and improve the water quality of the Kolong River and
reduce existing health risks.
2.2.2 Work under Execution
The amount of water supplied to Nagaon residents is less than 135 lpcd, which is the standard
prescribed in the Central Public Health and Environmental Engineering Organisation (CPHOO)
manual. Considering that only 22% of the population of Nagaon receives 50-60 lpcd of piped
water supply, there will not be sufficient sewage generation in the town for a sewage treatment
plant (STP). Presently there are no works proposed for the sewerage system for the Nagaon
town. As there is no existing sewerage system in place, new house construction plans require
septic tanks within the premises of the house for construction approval. The size of the septic
tank depends on the number of family members in the house.
2.2.3 Work Sanctioned but not yet started
As stated, there are no existing sewerage system works in the Nagaon town. However, a tender
has been called for construction of road side drainage. As per the information provided by the
NMB the process of awarding the drainage construction work is in progress. The work on open
drains has been sanctioned but not yet started.

City Sanitation Plan
17
2.2.4 Total Waste Water Generation
The Kolong River carries part of the town’s municipal and other wastes and also serves as the
natural drainage for storm water runoff. Based on an inquiry during the reconnaissance survey,
the average quantity of water used in the toilets is estimated as 30 lpcd at present. This is in line
with estimates by Green Building Brain (Canada) and the Government of New South Wales
which also suggest that the blackwater (sewage) percentage is 25-30% of total waste water
generated.
Table 2-2: Waste water Generation in Nagaon town.
Total Households in the Town
Total Waste Water Generated in the
Town (m3)
Total Households Connected to Septic
Tanks
Total Waste Water Collected in the
Septic Tanks (m3)
27,320 13,1351 23,905 3,196
2
Assumptions: (1) 80% of 135 lpcd supplied water; (2) 30 lpcd of waste water
When a water supply system is implemented the sewerage generation per capita will be:
Table 2-3: Calculation of per Capita Sewage Generation.
S. No. Description Demand (lpcd)
1 Net per capita water demand for Nagaon 135.00
2 Add 10% for ICI demand1 @ 10% 13.50
2 Add ground water infiltration @ 5% 6.75
Sub Total 155.25
3 Considering 80% for sewage generation 124.20
USE 125.00
As the town grows and develops, including the water supply system, the total waste water
generation will increase.
Table 2-4: Projection for Total Waste Water Generation for Nagaon town (Population projection can be found in Table 1-9).
Year Population Sewage Generation
(MLD)
2024 1,48,344 18.543
2034 1,70,029 21.254
2044 1,95,061 24.383
2.2.5 Industrial Flow
There are no major industries located in the communities along the Kolong River, particularly in
Nagaon town. There are only few car garages, which are contributing to the pollution of the river.
These establishments produce waste products which are often dumped into the river. This type
of indiscriminate dumping of establishment wastes have made the Kolong River water
contaminated and unfit either for human consumption or for the fish population that used to be
abundant in the river.
2.3 Status of Pollution of the River
2.3.1 Number and Details of Drainage Channel
There is no well-connected drainage system in Nagaon town, resulting in occasional flooding
particularly in the monsoon season. Drains along the side of roads exist in some areas but may
be blocked or not linked up properly. Flooding is of particular concern in the following areas:
City Sanitation Plan
18
Part of Panigaon
Hotelbar area
Teliapatti
Santipur
Lakshminagar
Islampatty
Area opposite to the Haibargaon railway station.
In recent times, improvement schemes for the drains have been proposed by the state
government with possible assistance from the Government of India. A road side drainage
improvement project has been sanctioned by the NMB but has not yet started.
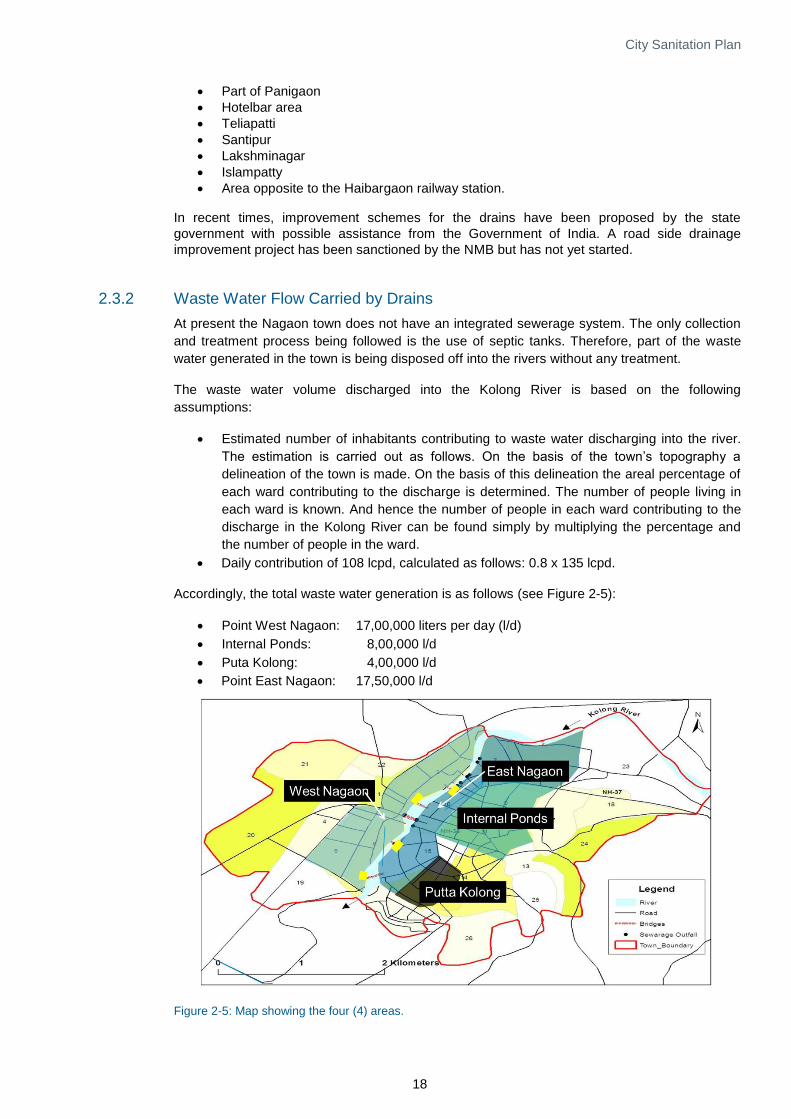
2.3.2 Waste Water Flow Carried by Drains
At present the Nagaon town does not have an integrated sewerage system. The only collection
and treatment process being followed is the use of septic tanks. Therefore, part of the waste
water generated in the town is being disposed off into the rivers without any treatment.
The waste water volume discharged into the Kolong River is based on the following
assumptions:
Estimated number of inhabitants contributing to waste water discharging into the river.
The estimation is carried out as follows. On the basis of the town’s topography a
delineation of the town is made. On the basis of this delineation the areal percentage of
each ward contributing to the discharge is determined. The number of people living in
each ward is known. And hence the number of people in each ward contributing to the
discharge in the Kolong River can be found simply by multiplying the percentage and
the number of people in the ward.
Daily contribution of 108 lcpd, calculated as follows: 0.8 x 135 lcpd.
Accordingly, the total waste water generation is as follows (see Figure 2-5):
Point West Nagaon: 17,00,000 liters per day (l/d)
Internal Ponds: 8,00,000 l/d
Puta Kolong: 4,00,000 l/d
Point East Nagaon: 17,50,000 l/d
Figure 2-5: Map showing the four (4) areas.

City Sanitation Plan
19
As the town along Kolong River grows and develops, including the water supply system, the
waste water flow carried by drains to the Kolong River will increase (see Table 2-4).
2.3.3 Measurement of Flows in Drains along with Copies of Test Report
The drains inside Nagaon town discharging into the Kolong River were visited and inspected
numerous times during the execution of the present project. During each visit the discharge from
the drains were either measured by simple floater methods or estimated from the water depth.
The estimates were used to evaluate the numbers provided in Section 2.3.2. The evaluation
proved that the numbers presented in Section 2.3.2 are reasonable.
2.3.4 Waste Water Characteristics of Different Drains
The sources that have been identified include the following:
Domestic sewage: Raw domestic sewage and partially treated sewerage in the form of
septic tank effluent drains are directly connected to the storm water drainage system.
The direct sewage discharges contribute heavy organic loads which affect water quality
and include bacteria, viruses, and other pollutants which are harmful to human and
ecological health. Similarly the septic tank effluent contributes organic loads but at a
much lower magnitude.
Municipal solid waste (MSW): MSW (i.e., garbage) is routinely dumped in town streets
and along the banks of the Kolong River. At numerous locations along the river bank,
MSW is strewn about in thin, non-contiguous layers, but in many locations, thicker,
contiguous fills exist on the river banks and lie in contact with the flowing water. In many
cases, metal, wood, and food wastes appear to be scavenged by local populations,
dogs, and other animals, and the resulting mixture is dominated by plastic wastes. As
these wastes slowly degrade, they release toxic pollution to the water.
Storm water: Storm water is directly discharged to the Kolong River via the surface
drainage system, and also as overland surface runoff. In both cases, this storm water
carries solids and pollution from the town streets into the river, In addition to domestic
sewage, this runoff likely includes particulates from combustion of diesel fuel and other
petroleum fuels, pollution from MSW, oils and greases from pavement areas, abraded
asphalt particulate, animal wastes, agricultural, and other pollution sources.
Industrial pollution: Industrial pollution sources may include automotive maintenance
areas, fuelling stations, and other industries indigenous to the area. These pollution
sources can be directly discharged to the drainage system, can flow overland, or can
infiltrate groundwater which ultimately discharges to the Kolong River.
Atmospheric deposition: The air quality in Nagaon town is affected by sources such as
the combustion of petrochemicals for transportation, energy, and industrial purpose and
regional air quality pollution. Particulates which contains toxic combustion by-products
and heavy metals such as mercury settle and dissolve into the town’s waterways.
Due to the density of the residential population in Nagaon, it is believe that the most significant
source of pollution to the Kolong River is the direct discharge of domestic sewage. Given the
prevalence and magnitude of the problem, MSW dumping may also be a significant source. It is
likely that the pollution loads from storm water, industry, and atmospheric deposition are less
significant, but there has been little study done to confirm this assertion.

City Sanitation Plan
20
2.3.5 Measurement of Waste Water Characteristics along with Copies of Test Reports
The water quality measurements are collected and analysed by:
Environmental Research & Evaluation Centre (EREC)
MPG Complex, R-2
Rupnagar, Guwahati
Assam
781032
India
Home-page: www.erec.in
EREC is a certified laboratory to collect and analyse water quality samples.
The water samples were collected at five locations on three consecutive days (Figure 2-6 and
Figure 2-7):
Upstream at the confluence with Misa River (river water)
Upstream of Nagaon town (river water)
Inside Nagaon town in the drain at the ATP bridge (drain water)
Inside Nagaon town in the drain at the jail (drain water)
Downstream of Nagaon town (river water).
Figure 2-6: Water sample collected from drain in Nagaon town.
NRCD water quality limits for effluent discharge into rivers are presented in Table 2-5.
Table 2-5: Effluent limits prescribed by NRCD (see Table 4.7 in NRCD).
Parameter Unit Limits
pH -- From 5.5 to 9.0
BOD mg/l < 20
TSS mg/l < 30
Faecal coliform MPN/100ml Desirable – < 1,000
Permissible – < 10,000
As part of the present project, water samples were collected from two drains inside Nagaon
town. The laboratory results are shown in Appendix A. The results confirm that the waste water
characteristics correspond to domestic waste water with high pollution levels.
The waste water discharging from Nagaon town into the Kolong River does not adhere to
present rules. The waste water is more polluted than allowed. Actions are required to lower the
pollution of the Kolong River and improve the environmental conditions of the water body.

City Sanitation Plan
21
Figure 2-7: Locations of water samples.
2.3.6 Water Quality of the River U/S, D/S and at Outfall of Drain discharging into River
The following description is based on historical water quality measurements. Some of them can
be found in Appendix C, D and E.
Based on the measurement in PCBA (1993) which has the most details inside the town it is
found:
The water quality levels do not vary much through the town (some more comments on
this issue is given below).
pH, BOD and DO levels are all higher during the pre-monsoon season than during the
monsoon season as expected.
Faecal coliform levels are generally lower during the pre-monsoon season than during
the monsoon season.
pH, BOD and DO levels satisfy the limits in NRCD guide (see section 2.3.9).
Faecal coliform levels are higher than the desired limit and close to the permissible limit
(see section 2.3.9).
The measurements show that the water quality levels do not change much throughout the town.
Of course if and when samples are taken too close to the source the values can be high, but it is
considered to be erroneous data (one such case is identified in the data). The downstream
water quality samples should not be collected closer to the drain than about 10 times the width
of the river to ensure that the sewerage is mixed over the river cross-section (else the data are
meaningless as it will be an undefined mixture of drainage and river water).
No signs are found in the historical measurements that indicate that the water quality of the
Kolong River has improved since the detailed measurements were collected in year 1993. On
the other hand, it is found that the situation has most probably deteriorated and that the river
today is more polluted than ever before.
The historical water quality data shows that the river is polluted with faecal coliform bacteria and
does not adhere to the NRCD guideline. Actions are required to clean up the Kolong River for
the benefit of the town’s inhabitants and well as the ecosystems in the river.

City Sanitation Plan
22
2.3.7 Measurement of the Quality of River Water along with copies of Test Report
Details on water samples collected can be found in Section 2.3.5. The actual water quality data
can be found in Appendix A.
Based on the collected and analysed water samples from the Kolong River and analysed as part
of the present project it is found:
pH and DO levels satisfy the limits in NRCD guide (see section 2.3.9).
BOD levels do not satisfy the limit in the NRCD guideline and faecal coliform levels are
higher than the desired limit and close to the permissible limit (see section 2.3.9).
The water quality data obtained in the present project shows that the Kolong River is polluted
with faecal coliform bacteria inside Nagaon town and does not adhere to the NRCD rules.
2.3.8 Methodology followed for Flow Measurement and Quality Characteristics
The laboratory methodology is shown in Appendix B.
2.3.9 Water Quality Standards of River Water Quality
NRCD specifies the following limits for water quality for rivers if used for bathing:
Table 2-6: NRCD water quality limits for rivers (designated best use bathing) (see Tables 2.3 and 4.5 in NRCD).
Parameter Unit Limits
pH --- From 6.5 to 8.5
BOD mg/l < 3
DO mg/l > 5
Faecal coliforms MPN/100ml Desirable – < 500
Permissible – < 2,500
For propagation of wildlife and fisheries, the following additional limits apply:
DO > 4 mg/l
Free ammonia (as N) < 1.2 mg/l.
2.4 Justification of the Project for Pollution abatement of the River
As stated in Section 1.3.2, the Central Pollution Control Board found that the Kolong River is
among the most polluted rivers in India, and the NRCD (2010) guidelines considered the Kolong
River as one of the rivers for conservation. The water quality measurement collected and
analysed as part of the present project confirm the high degree of pollution. Hence, the pollution
abatement is justified.
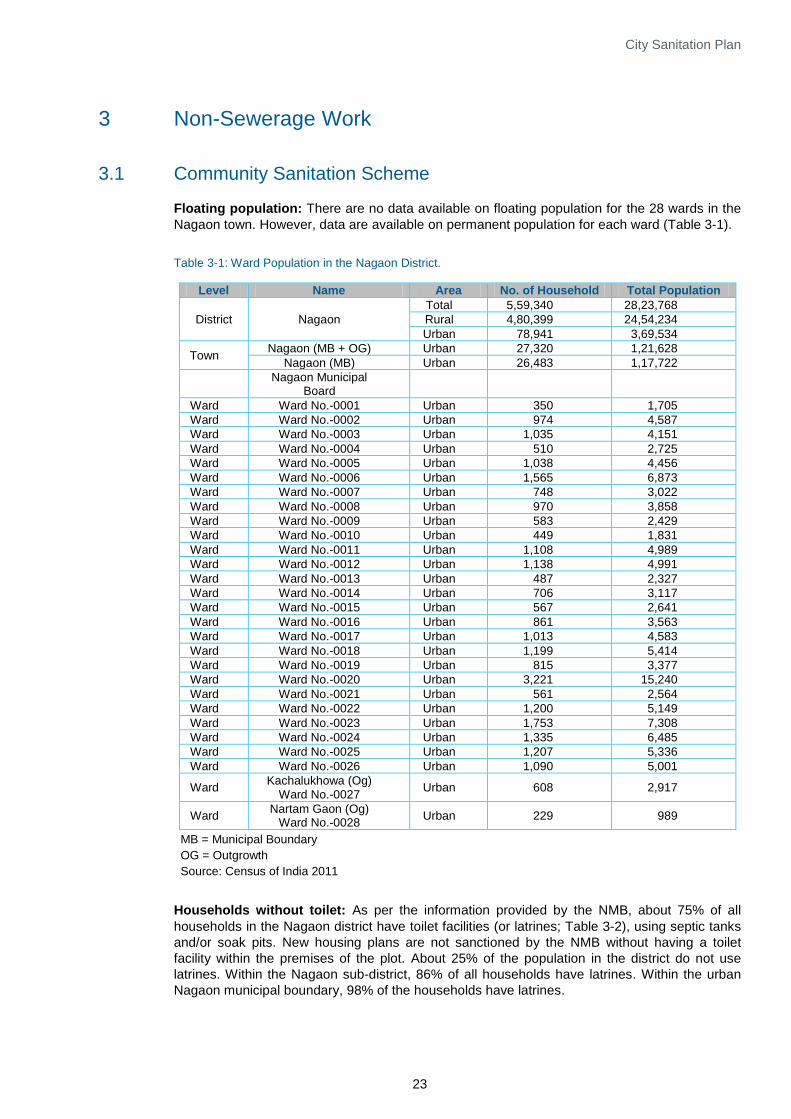
City Sanitation Plan
23
3 Non-Sewerage Work
3.1 Community Sanitation Scheme
Floating population: There are no data available on floating population for the 28 wards in the
Nagaon town. However, data are available on permanent population for each ward (Table 3-1).
Table 3-1: Ward Population in the Nagaon District.
Level Name Area No. of Household Total Population
District Nagaon
Total 5,59,340 28,23,768
Rural 4,80,399 24,54,234
Urban 78,941 3,69,534
Town Nagaon (MB + OG) Urban 27,320 1,21,628
Nagaon (MB) Urban 26,483 1,17,722
Nagaon Municipal
Board
Ward Ward No.-0001 Urban 350 1,705
Ward Ward No.-0002 Urban 974 4,587
Ward Ward No.-0003 Urban 1,035 4,151
Ward Ward No.-0004 Urban 510 2,725
Ward Ward No.-0005 Urban 1,038 4,456
Ward Ward No.-0006 Urban 1,565 6,873
Ward Ward No.-0007 Urban 748 3,022
Ward Ward No.-0008 Urban 970 3,858
Ward Ward No.-0009 Urban 583 2,429
Ward Ward No.-0010 Urban 449 1,831
Ward Ward No.-0011 Urban 1,108 4,989
Ward Ward No.-0012 Urban 1,138 4,991
Ward Ward No.-0013 Urban 487 2,327
Ward Ward No.-0014 Urban 706 3,117
Ward Ward No.-0015 Urban 567 2,641
Ward Ward No.-0016 Urban 861 3,563
Ward Ward No.-0017 Urban 1,013 4,583
Ward Ward No.-0018 Urban 1,199 5,414
Ward Ward No.-0019 Urban 815 3,377
Ward Ward No.-0020 Urban 3,221 15,240
Ward Ward No.-0021 Urban 561 2,564
Ward Ward No.-0022 Urban 1,200 5,149
Ward Ward No.-0023 Urban 1,753 7,308
Ward Ward No.-0024 Urban 1,335 6,485
Ward Ward No.-0025 Urban 1,207 5,336
Ward Ward No.-0026 Urban 1,090 5,001
Ward Kachalukhowa (Og)
Ward No.-0027 Urban 608 2,917
Ward Nartam Gaon (Og)
Ward No.-0028 Urban 229 989
MB = Municipal Boundary
OG = Outgrowth
Source: Census of India 2011
Households without toilet: As per the information provided by the NMB, about 75% of all
households in the Nagaon district have toilet facilities (or latrines; Table 3-2), using septic tanks
and/or soak pits. New housing plans are not sanctioned by the NMB without having a toilet
facility within the premises of the plot. About 25% of the population in the district do not use
latrines. Within the Nagaon sub-district, 86% of all households have latrines. Within the urban
Nagaon municipal boundary, 98% of the households have latrines.
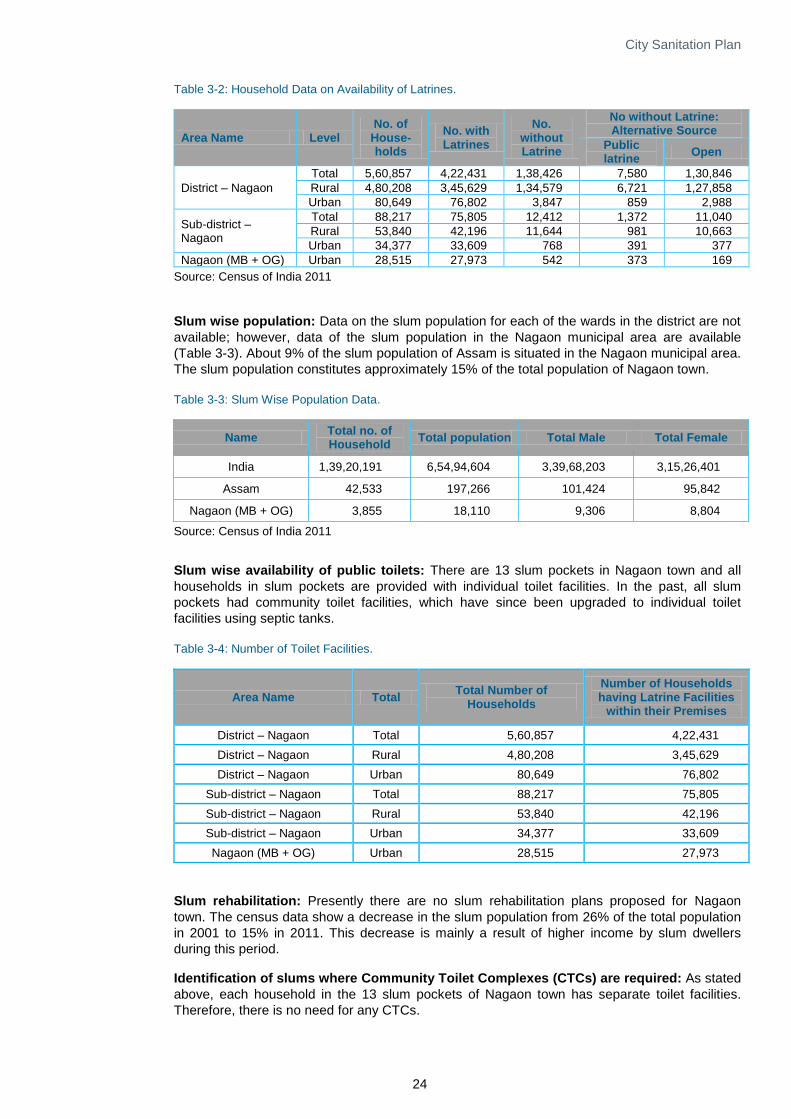
City Sanitation Plan
24
Table 3-2: Household Data on Availability of Latrines.
Area Name Level No. of House-holds
No. with Latrines
No. without Latrine
No without Latrine: Alternative Source
Public latrine
Open
District – Nagaon
Total 5,60,857 4,22,431 1,38,426 7,580 1,30,846
Rural 4,80,208 3,45,629 1,34,579 6,721 1,27,858
Urban 80,649 76,802 3,847 859 2,988
Sub-district – Nagaon
Total 88,217 75,805 12,412 1,372 11,040
Rural 53,840 42,196 11,644 981 10,663
Urban 34,377 33,609 768 391 377
Nagaon (MB + OG) Urban 28,515 27,973 542 373 169
Source: Census of India 2011
Slum wise population: Data on the slum population for each of the wards in the district are not
available; however, data of the slum population in the Nagaon municipal area are available
(Table 3-3). About 9% of the slum population of Assam is situated in the Nagaon municipal area.
The slum population constitutes approximately 15% of the total population of Nagaon town.
Table 3-3: Slum Wise Population Data.
Name Total no. of Household
Total population Total Male Total Female
India 1,39,20,191 6,54,94,604 3,39,68,203 3,15,26,401
Assam 42,533 197,266 101,424 95,842
Nagaon (MB + OG) 3,855 18,110 9,306 8,804
Source: Census of India 2011
Slum wise availability of public toilets: There are 13 slum pockets in Nagaon town and all
households in slum pockets are provided with individual toilet facilities. In the past, all slum
pockets had community toilet facilities, which have since been upgraded to individual toilet
facilities using septic tanks.
Table 3-4: Number of Toilet Facilities.
Area Name Total Total Number of
Households
Number of Households having Latrine Facilities
within their Premises
District – Nagaon Total 5,60,857 4,22,431
District – Nagaon Rural 4,80,208 3,45,629
District – Nagaon Urban 80,649 76,802
Sub-district – Nagaon Total 88,217 75,805
Sub-district – Nagaon Rural 53,840 42,196
Sub-district – Nagaon Urban 34,377 33,609
Nagaon (MB + OG) Urban 28,515 27,973
Slum rehabilitation: Presently there are no slum rehabilitation plans proposed for Nagaon
town. The census data show a decrease in the slum population from 26% of the total population
in 2001 to 15% in 2011. This decrease is mainly a result of higher income by slum dwellers
during this period.
Identification of slums where Community Toilet Complexes (CTCs) are required: As stated
above, each household in the 13 slum pockets of Nagaon town has separate toilet facilities.
Therefore, there is no need for any CTCs.
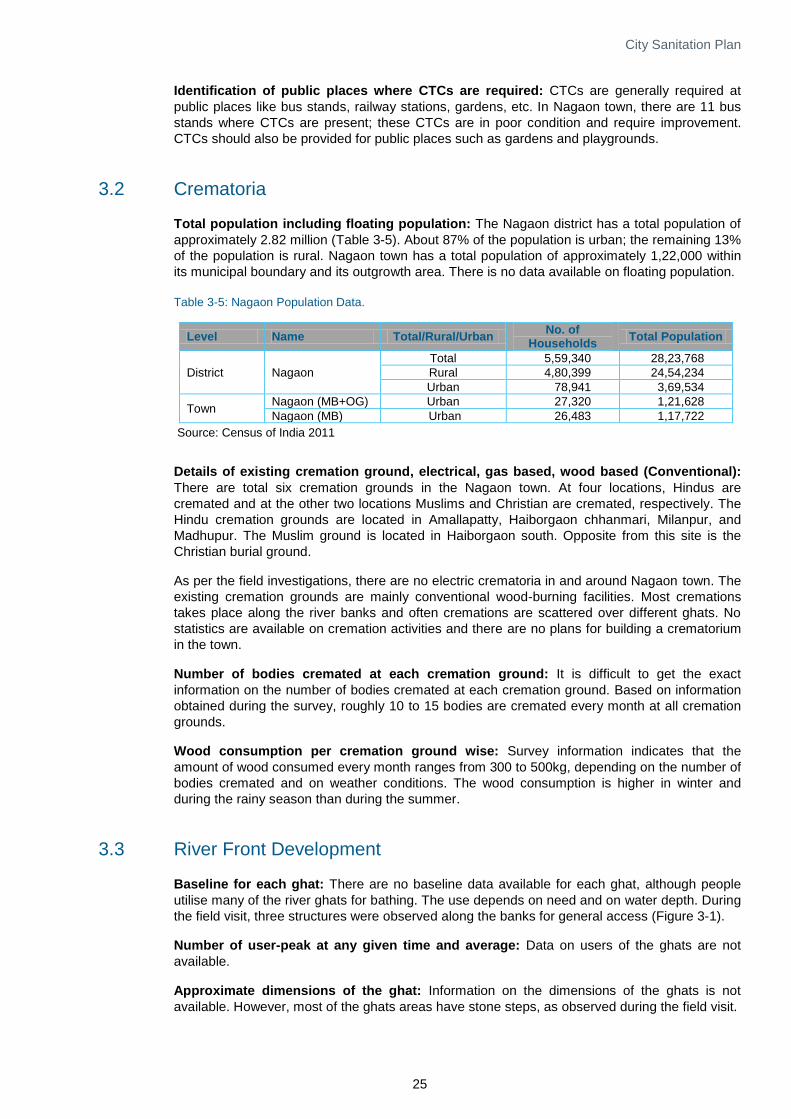
City Sanitation Plan
25
Identification of public places where CTCs are required: CTCs are generally required at
public places like bus stands, railway stations, gardens, etc. In Nagaon town, there are 11 bus
stands where CTCs are present; these CTCs are in poor condition and require improvement.
CTCs should also be provided for public places such as gardens and playgrounds.
3.2 Crematoria
Total population including floating population: The Nagaon district has a total population of
approximately 2.82 million (Table 3-5). About 87% of the population is urban; the remaining 13%
of the population is rural. Nagaon town has a total population of approximately 1,22,000 within
its municipal boundary and its outgrowth area. There is no data available on floating population.
Table 3-5: Nagaon Population Data.
Level Name Total/Rural/Urban No. of
Households Total Population
District Nagaon
Total 5,59,340 28,23,768
Rural 4,80,399 24,54,234
Urban 78,941 3,69,534
Town Nagaon (MB+OG) Urban 27,320 1,21,628
Nagaon (MB) Urban 26,483 1,17,722
Source: Census of India 2011
Details of existing cremation ground, electrical, gas based, wood based (Conventional):
There are total six cremation grounds in the Nagaon town. At four locations, Hindus are
cremated and at the other two locations Muslims and Christian are cremated, respectively. The
Hindu cremation grounds are located in Amallapatty, Haiborgaon chhanmari, Milanpur, and
Madhupur. The Muslim ground is located in Haiborgaon south. Opposite from this site is the
Christian burial ground.
As per the field investigations, there are no electric crematoria in and around Nagaon town. The
existing cremation grounds are mainly conventional wood-burning facilities. Most cremations
takes place along the river banks and often cremations are scattered over different ghats. No
statistics are available on cremation activities and there are no plans for building a crematorium
in the town.
Number of bodies cremated at each cremation ground: It is difficult to get the exact
information on the number of bodies cremated at each cremation ground. Based on information
obtained during the survey, roughly 10 to 15 bodies are cremated every month at all cremation
grounds.
Wood consumption per cremation ground wise: Survey information indicates that the
amount of wood consumed every month ranges from 300 to 500kg, depending on the number of
bodies cremated and on weather conditions. The wood consumption is higher in winter and
during the rainy season than during the summer.
3.3 River Front Development
Baseline for each ghat: There are no baseline data available for each ghat, although people
utilise many of the river ghats for bathing. The use depends on need and on water depth. During
the field visit, three structures were observed along the banks for general access (Figure 3-1).
Number of user-peak at any given time and average: Data on users of the ghats are not
available.
Approximate dimensions of the ghat: Information on the dimensions of the ghats is not
available. However, most of the ghats areas have stone steps, as observed during the field visit.

City Sanitation Plan
26
State of the ghats: There are no major ghats along the Kolong River. The existing ones are
mainly used for puja and for bathing.
Improvement required: Improvement in terms of fencing off the ghats, putting railings along the
steps of the ghats leading to river, and planting trees is required at most of the existing ghats.
Figure 3-1: Structures for access to the Kolong River in Nagaon.
3.4 Dhobi Ghat
Dhobi ghat information: As per field investigations, there are no specific organised Dhobi
ghats along the river at present. People access the river at different points for washing. Dhobi
ghats are based on convenience and shifts depending on the water level during the monsoon
season and the non-monsoon seasons.
Specific location: There are no specific locations available for dhobi ghats. People access the
river at different location depending on their needs and on available water depths.
Number of dhobis washing clothes: There is no information available on the number of Dhobi
ghat. Therefore, the number of dhobis washing clothes could not be found out.
Alternative locations: Since there is no information available on the number of organised
specific ghats location, it is difficult to identify if there is any alternative location suitable for a
Dhobi ghat.
3.5 Carcass Disposal
Number of cattle that die in the town: There are no records available on the number of cattle
that die in the town.
Existing arrangement for safe carcass disposal: As per the field investigations, there are no
existing arrangements for safe disposal of carcasses. There are no systematic records on the
number of carcasses disposed every day. No specific disposal location was reserved. Most of
the dead bodies of animals are disposed in the river due to the lack of other disposal locations.
Also, the Hindu population residing in villages near the banks of the river performs the last rites
of the deceased along the river bank; burnt residues are dumped in the river.
Identification of the need for carcass disposal: The necessity for identifying a carcass
disposal location should be assessed in more detail after obtaining reliable data on the number
of dead animals requiring disposal. Thereafter, arrangements should be made to evaluate and
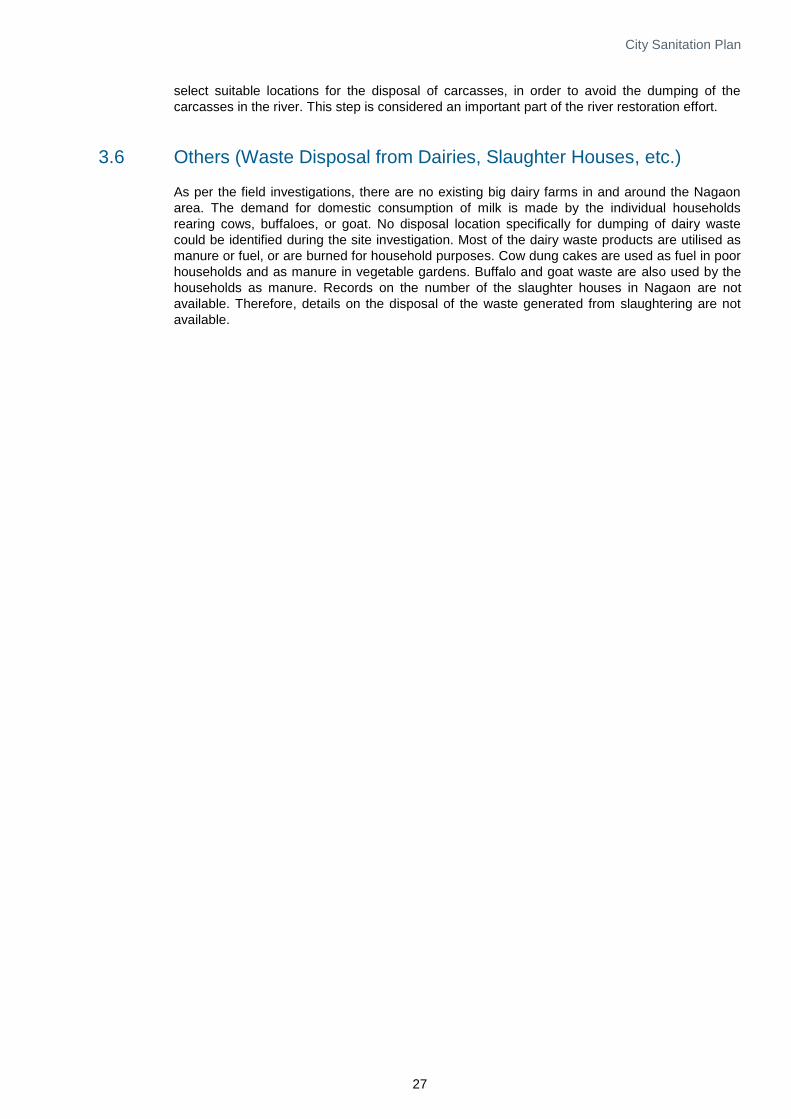
City Sanitation Plan
27
select suitable locations for the disposal of carcasses, in order to avoid the dumping of the
carcasses in the river. This step is considered an important part of the river restoration effort.
3.6 Others (Waste Disposal from Dairies, Slaughter Houses, etc.)
As per the field investigations, there are no existing big dairy farms in and around the Nagaon
area. The demand for domestic consumption of milk is made by the individual households
rearing cows, buffaloes, or goat. No disposal location specifically for dumping of dairy waste
could be identified during the site investigation. Most of the dairy waste products are utilised as
manure or fuel, or are burned for household purposes. Cow dung cakes are used as fuel in poor
households and as manure in vegetable gardens. Buffalo and goat waste are also used by the
households as manure. Records on the number of the slaughter houses in Nagaon are not
available. Therefore, details on the disposal of the waste generated from slaughtering are not
available.
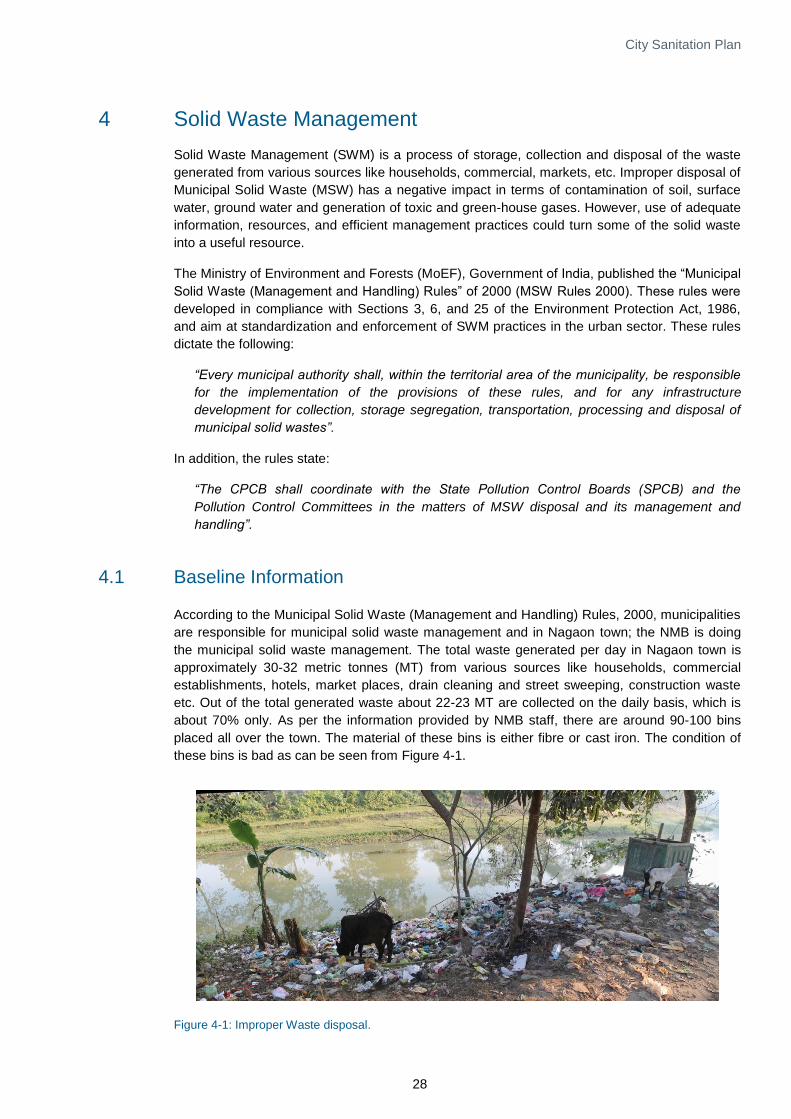
City Sanitation Plan
28
4 Solid Waste Management
Solid Waste Management (SWM) is a process of storage, collection and disposal of the waste
generated from various sources like households, commercial, markets, etc. Improper disposal of
Municipal Solid Waste (MSW) has a negative impact in terms of contamination of soil, surface
water, ground water and generation of toxic and green-house gases. However, use of adequate
information, resources, and efficient management practices could turn some of the solid waste
into a useful resource.
The Ministry of Environment and Forests (MoEF), Government of India, published the “Municipal
Solid Waste (Management and Handling) Rules” of 2000 (MSW Rules 2000). These rules were
developed in compliance with Sections 3, 6, and 25 of the Environment Protection Act, 1986,
and aim at standardization and enforcement of SWM practices in the urban sector. These rules
dictate the following:
“Every municipal authority shall, within the territorial area of the municipality, be responsible
for the implementation of the provisions of these rules, and for any infrastructure
development for collection, storage segregation, transportation, processing and disposal of
municipal solid wastes”.
In addition, the rules state:
“The CPCB shall coordinate with the State Pollution Control Boards (SPCB) and the
Pollution Control Committees in the matters of MSW disposal and its management and
handling”.
4.1 Baseline Information
According to the Municipal Solid Waste (Management and Handling) Rules, 2000, municipalities
are responsible for municipal solid waste management and in Nagaon town; the NMB is doing
the municipal solid waste management. The total waste generated per day in Nagaon town is
approximately 30-32 metric tonnes (MT) from various sources like households, commercial
establishments, hotels, market places, drain cleaning and street sweeping, construction waste
etc. Out of the total generated waste about 22-23 MT are collected on the daily basis, which is
about 70% only. As per the information provided by NMB staff, there are around 90-100 bins
placed all over the town. The material of these bins is either fibre or cast iron. The condition of
these bins is bad as can be seen from Figure 4-1.
Figure 4-1: Improper Waste disposal.
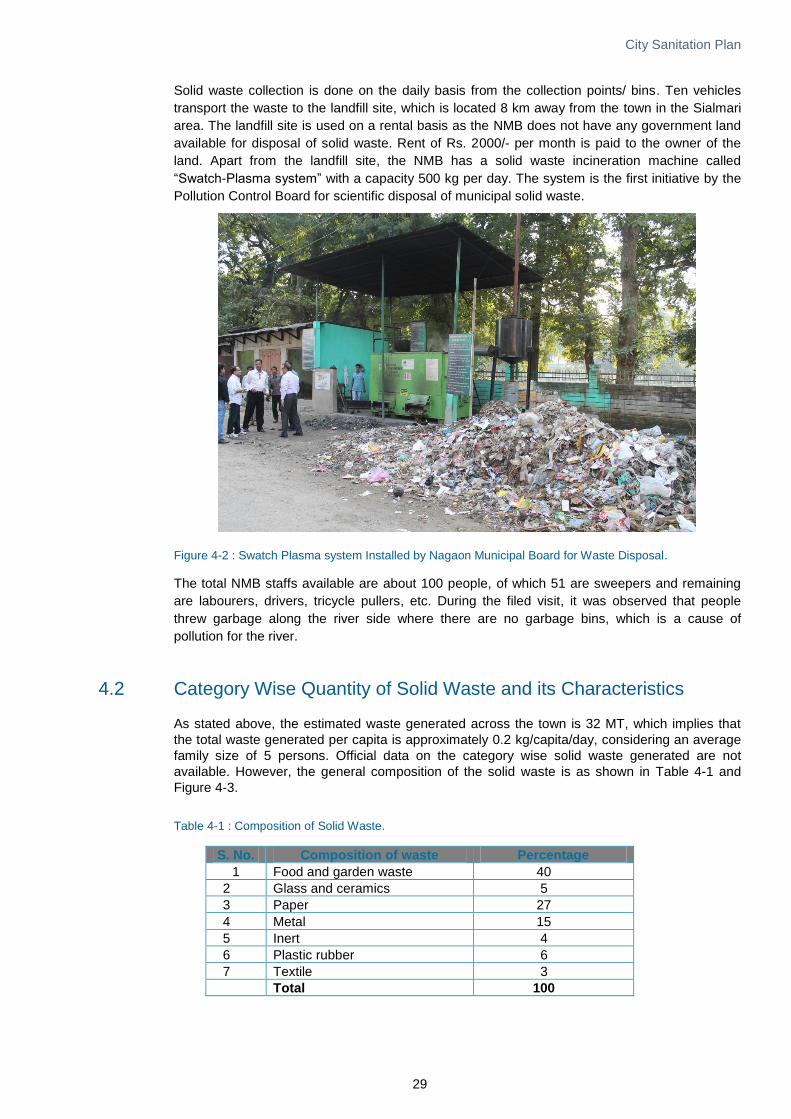
City Sanitation Plan
29
Solid waste collection is done on the daily basis from the collection points/ bins. Ten vehicles
transport the waste to the landfill site, which is located 8 km away from the town in the Sialmari
area. The landfill site is used on a rental basis as the NMB does not have any government land
available for disposal of solid waste. Rent of Rs. 2000/- per month is paid to the owner of the
land. Apart from the landfill site, the NMB has a solid waste incineration machine called
“Swatch-Plasma system” with a capacity 500 kg per day. The system is the first initiative by the
Pollution Control Board for scientific disposal of municipal solid waste.
Figure 4-2 : Swatch Plasma system Installed by Nagaon Municipal Board for Waste Disposal.
The total NMB staffs available are about 100 people, of which 51 are sweepers and remaining
are labourers, drivers, tricycle pullers, etc. During the filed visit, it was observed that people
threw garbage along the river side where there are no garbage bins, which is a cause of
pollution for the river.
4.2 Category Wise Quantity of Solid Waste and its Characteristics
As stated above, the estimated waste generated across the town is 32 MT, which implies that
the total waste generated per capita is approximately 0.2 kg/capita/day, considering an average
family size of 5 persons. Official data on the category wise solid waste generated are not
available. However, the general composition of the solid waste is as shown in Table 4-1 and
Figure 4-3.
Table 4-1 : Composition of Solid Waste.
S. No. Composition of waste Percentage
1 Food and garden waste 40
2 Glass and ceramics 5
3 Paper 27
4 Metal 15
5 Inert 4
6 Plastic rubber 6
7 Textile 3
Total 100

City Sanitation Plan
30
Figure 4-3 : Composition of Solid Waste.
4.3 Biodegradable and Non-Biodegradables Waste
Solid waste contains both biodegradable and non-biodegradable components. Based on the
primary survey, it is estimated that 70% of the total waste is biodegradable and 30% is non-
biodegradable. A major part of the waste is from households that generate a considerable part
of biodegradable waste such as food, fruit, paper, etc. Increasingly, the use of plastic and
packaged products contributes to non-biodegradable municipal waste.
4.4 Industrial Waste
There are no major industries in the Nagaon town, however there are some small rope-making
enterprises which contribute to the solid waste. in addition, there are motor garages, wood
furniture shops, etc. that contribute to the waste generation.
4.5 Bio-medical Waste
Bio-medical waste is generated by hospitals and other health services providers and consists of
discharged drugs, waste shapes, microbiological and biotechnological waste, human anatomical
waste, animal waste, etc.
There is no exclusive bio-medical waste management system for the Nagaon area.
According to the bio-medical waste (Management and Handling) Rules 1998, authorization by
the State Pollution Control Board is mandatory for each medical service provider including
research laboratories handling bio-medical waste. According to the Rules, the generator of the
bio-medical waste is responsible for safe handling & management of the waste.
The Nagaon district has the following healthcare facilities:
One (1) district hospital
Eleven (11) child health clinics
Seventy-one (71) public health clinics
40%
5% 15%
27%
4% 6% 3%
Composition of Solid waste
Food & GardenwasteGlass & Ceramic
Metal
Paper
Inert
Plastic rubber
Textile
City Sanitation Plan
31
Thirty-three (33) nursing homes/private hospitals and diagnostic centres/laboratories.
All of the above are handling and producing bio-medical waste.
According to the District Authority and the Joint Director, Health Services (Jt. DHS), Nagaon
does not have any information regarding authorization or a system for handling bio-medical
waste. However, information furnished by the Jt. DHS revealed that no organisation has an
incinerator for disposing bio-medical waste as per specified norms of the Board.
Thus, in absence of any mechanism for disposing bio-medical waste, its dumping in open
spaces creates air pollution and health hazards. The survey team found that the private
hospitals/nursing homes in the town are not segregating their waste and the bio-medical waste
generated from these institutions is dumped along with the MSW. Dumped waste from a hospital
was found on the river bank during the field visits (Figure 4-4).
Figure 4-4: Dumped waste from a hospital.
4.6 Segregation of the Solid Waste
In Nagaon town, there is no official process of the segregation of solid waste. Rag pickers
collect some of the waste produced for their livelihood and as such that can be considered an
unofficial segregation of the waste. But it is far from sufficient.
4.7 Collection and Storage System
The NMB is responsible for the collection, transport and disposal of municipal solid waste. For
the collection of solid waste in Nagaon town there are:
Ninety (90) to one-hundred (100) bins
Six (6) or seven (7) mechanical dumper placers.
To carry out the collection work, the town employs:

City Sanitation Plan
32
Fifty-one (51) sweepers
Forty-seven (47) drivers, labourers, tricycle pullers, etc.
About 22-23 MT of the solid waste is collected through fiber and cast iron bins. The system is
not sufficient and for that reason waste is also dumped at the following locations:
Unauthorised/random sites in the town
Open drains
Along the Kolong River bank
Directly into the Kolong River.
According to the field investigations conducted by team, there are more than 20 open dump
sites which were identified along the Kolong River in Nagaon town.
Figure 4-5 : Dumping of waste along and into the Kolong River.
Rag pickers collect the recyclable fraction of the waste produced and sell those for their
livelihood.
4.8 Transfer System
In some areas solid waste transportation vehicles come and collect the waste, but not in all
areas. Solid waste is carried in open carts and trucks and dumped at the landfill site in the
Sialmari area. There is no proper schedule or an integrated solid waste collection system
present in Nagaon town.
For the collection and transportation of the solid waste the town has 10 vehicles:
Five (5) tippers
Four (4) tractors and six (6) trolleys
One (1) TATA 407 truck.
For the collection of solid waste dumped on the ground the town has:
One (1) excavator/loader
One (1) loader skid.
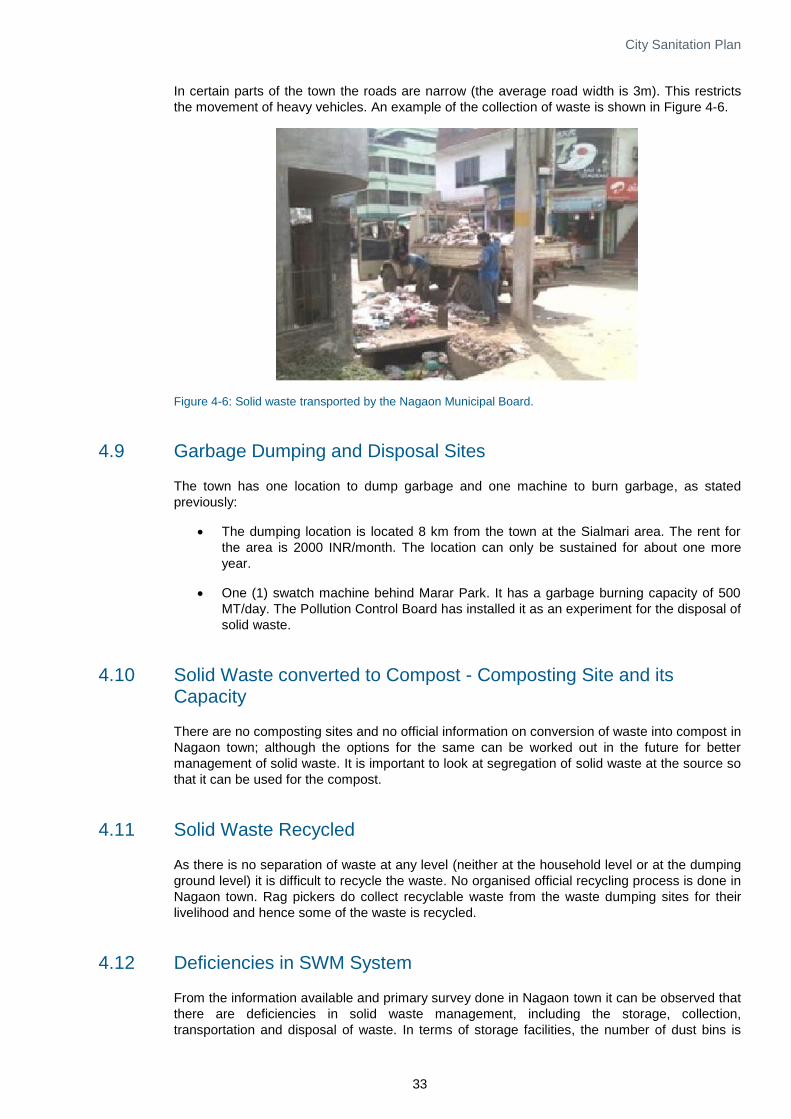
City Sanitation Plan
33
In certain parts of the town the roads are narrow (the average road width is 3m). This restricts
the movement of heavy vehicles. An example of the collection of waste is shown in Figure 4-6.
Figure 4-6: Solid waste transported by the Nagaon Municipal Board.
4.9 Garbage Dumping and Disposal Sites
The town has one location to dump garbage and one machine to burn garbage, as stated
previously:
The dumping location is located 8 km from the town at the Sialmari area. The rent for
the area is 2000 INR/month. The location can only be sustained for about one more
year.
One (1) swatch machine behind Marar Park. It has a garbage burning capacity of 500
MT/day. The Pollution Control Board has installed it as an experiment for the disposal of
solid waste.
4.10 Solid Waste converted to Compost - Composting Site and its Capacity
There are no composting sites and no official information on conversion of waste into compost in
Nagaon town; although the options for the same can be worked out in the future for better
management of solid waste. It is important to look at segregation of solid waste at the source so
that it can be used for the compost.
4.11 Solid Waste Recycled
As there is no separation of waste at any level (neither at the household level or at the dumping
ground level) it is difficult to recycle the waste. No organised official recycling process is done in
Nagaon town. Rag pickers do collect recyclable waste from the waste dumping sites for their
livelihood and hence some of the waste is recycled.
4.12 Deficiencies in SWM System
From the information available and primary survey done in Nagaon town it can be observed that
there are deficiencies in solid waste management, including the storage, collection,
transportation and disposal of waste. In terms of storage facilities, the number of dust bins is
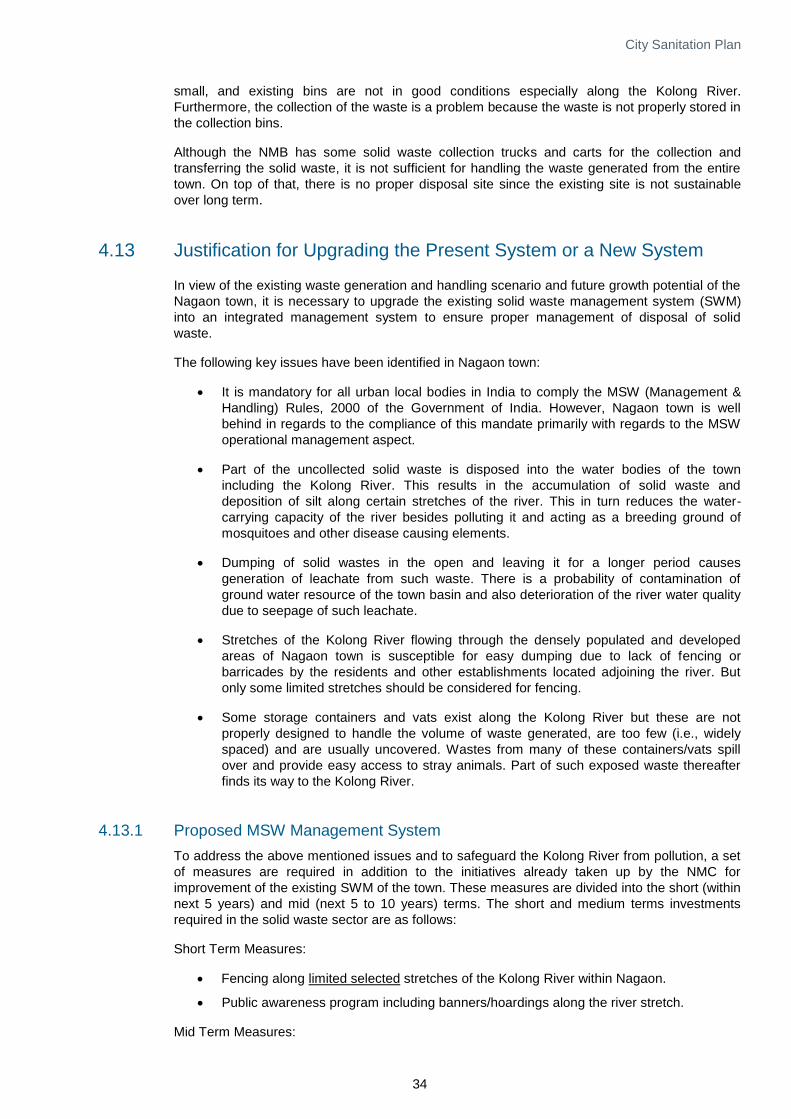
City Sanitation Plan
34
small, and existing bins are not in good conditions especially along the Kolong River.
Furthermore, the collection of the waste is a problem because the waste is not properly stored in
the collection bins.
Although the NMB has some solid waste collection trucks and carts for the collection and
transferring the solid waste, it is not sufficient for handling the waste generated from the entire
town. On top of that, there is no proper disposal site since the existing site is not sustainable
over long term.
4.13 Justification for Upgrading the Present System or a New System
In view of the existing waste generation and handling scenario and future growth potential of the
Nagaon town, it is necessary to upgrade the existing solid waste management system (SWM)
into an integrated management system to ensure proper management of disposal of solid
waste.
The following key issues have been identified in Nagaon town:
It is mandatory for all urban local bodies in India to comply the MSW (Management &
Handling) Rules, 2000 of the Government of India. However, Nagaon town is well
behind in regards to the compliance of this mandate primarily with regards to the MSW
operational management aspect.
Part of the uncollected solid waste is disposed into the water bodies of the town
including the Kolong River. This results in the accumulation of solid waste and
deposition of silt along certain stretches of the river. This in turn reduces the water-
carrying capacity of the river besides polluting it and acting as a breeding ground of
mosquitoes and other disease causing elements.
Dumping of solid wastes in the open and leaving it for a longer period causes
generation of leachate from such waste. There is a probability of contamination of
ground water resource of the town basin and also deterioration of the river water quality
due to seepage of such leachate.
Stretches of the Kolong River flowing through the densely populated and developed
areas of Nagaon town is susceptible for easy dumping due to lack of fencing or
barricades by the residents and other establishments located adjoining the river. But
only some limited stretches should be considered for fencing.
Some storage containers and vats exist along the Kolong River but these are not
properly designed to handle the volume of waste generated, are too few (i.e., widely
spaced) and are usually uncovered. Wastes from many of these containers/vats spill
over and provide easy access to stray animals. Part of such exposed waste thereafter
finds its way to the Kolong River.
4.13.1 Proposed MSW Management System
To address the above mentioned issues and to safeguard the Kolong River from pollution, a set
of measures are required in addition to the initiatives already taken up by the NMC for
improvement of the existing SWM of the town. These measures are divided into the short (within
next 5 years) and mid (next 5 to 10 years) terms. The short and medium terms investments
required in the solid waste sector are as follows:
Short Term Measures:
Fencing along limited selected stretches of the Kolong River within Nagaon.
Public awareness program including banners/hoardings along the river stretch.
Mid Term Measures:

City Sanitation Plan
35
Additional secondary storage containers and litter bins along the Kolong River,
specifically in the densely populated area of Nagaon town. The provision for these
additional storage facilities should be synchronized with the overall secondary storage
facilities of Nagaon town.
Procurement of additional collection and transport vehicles for removal of the waste
stored in the proposed secondary storage facilities.
4.14 Consultation with Stakeholders
4.14.1 Resolution of ULB’s for CSP Adoption
The Nagaon district has four municipal boards. They have all been contacted to obtain
information and to be informed about the present project.
4.14.2 Consultation with Community
A number of habitants in Nagaon town have been interviewed about their experience with the
solid water management system in the town and its impacts on their daily life.
The main objective of these interviews was to get first-hand information about the present waste
management systems adopted by the town and identification of major problem areas.
The following are the major points identified through the interviews:
The awareness regarding solid waste management is found to be low in the entire town.
The inhabitants do not place waste into designated bins. However, the inhabitants
defended themselves and claimed that since the waste management is not organised
and scheduled they do also not need to act responsibly.
Waste from the meat shops, etc. is mixed with the other solid waste from the town.

City Sanitation Plan
36
5 Consultation with Stakeholders
5.1 Resolution of ULB’ for CSP Adoption
During the course of the study, the consultant involved stakeholders into the integrated
management plan of the water bodies. The project components derived have been presented to
relevant government officials and stakeholders (Table 5-1) to obtain feedback on the pros and
cons of these options.
Table 5-1: List of Key Stakeholder.
S.No. Department/Authority
1 State Administration
2 Department of Forest
3 Assam Disaster Management Authority
4 District Administration, Nagaon
5 District Administration, Morigaon
6 Nagaon Municipal Board
7 Public Health Engineering Department
8 Water Resource Department
9 Town and Country Planning
10 Fishery Department
11 Water Supply and Sewerage Board Assam
12 Central Water Commission
13 NRCD
14 Pollution Control Board, Assam
15 Public Work Department, Nagaon
16 National Highway Authority of India
17 Traffic Police
18 Local NGO’s
19 Nagaon College
20 Ward members
21 Member Lok Sabha Assembly
22 Member of Parliament
23 Land and Revenue Department
Table 5-2 shows a partial list of officials and others consulted so far. Various community
members, who are concerned with the conditions of the Kolong River, were consulted at
different locations. They have been providing valuable suggestions on how the Kolong River
should be restored. The consultation is an on-going process during the course of the study and
therefore, the list will be updated later.
Table 5-2: Partial list of officials and others consulted so far.
S. No. Name & Designation Organisation
1 Mr. Gokul Bhuyan, Executive Engineer Pollution Control Board, Assam
1 Mr. Banjit Talulshade, Executive Engineer PHED
2 Mr. Rajesh Dash, Engineer NMB
3 Mr. Praful Hazarika, Dy. Director Town & Country Planning, Nagaon
4 Prof. Manik Kar Nagaon College
5 Mr. Dilip Sarmah, Executive Engineer WRD, Nagaon Division
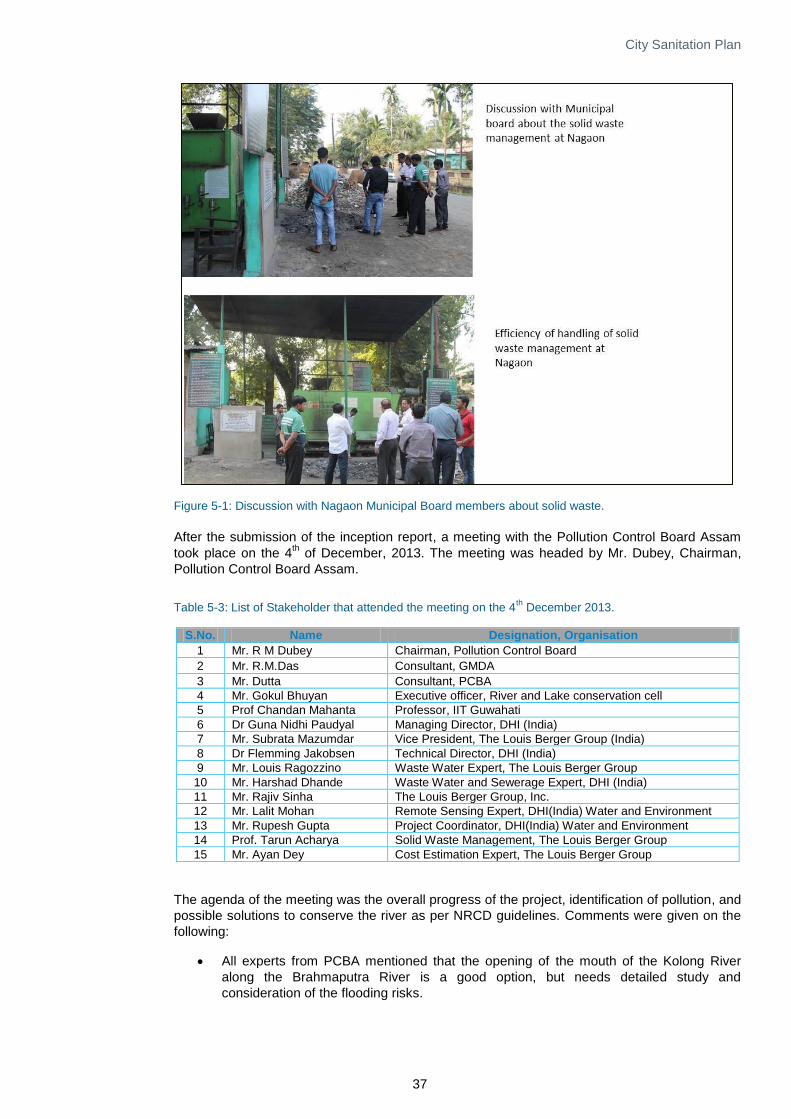
City Sanitation Plan
37
Figure 5-1: Discussion with Nagaon Municipal Board members about solid waste.
After the submission of the inception report, a meeting with the Pollution Control Board Assam
took place on the 4th of December, 2013. The meeting was headed by Mr. Dubey, Chairman,
Pollution Control Board Assam.
Table 5-3: List of Stakeholder that attended the meeting on the 4th
December 2013.
S.No. Name Designation, Organisation
1 Mr. R M Dubey Chairman, Pollution Control Board
2 Mr. R.M.Das Consultant, GMDA
3 Mr. Dutta Consultant, PCBA
4 Mr. Gokul Bhuyan Executive officer, River and Lake conservation cell
5 Prof Chandan Mahanta Professor, IIT Guwahati
6 Dr Guna Nidhi Paudyal Managing Director, DHI (India)
7 Mr. Subrata Mazumdar Vice President, The Louis Berger Group (India)
8 Dr Flemming Jakobsen Technical Director, DHI (India)
9 Mr. Louis Ragozzino Waste Water Expert, The Louis Berger Group
10 Mr. Harshad Dhande Waste Water and Sewerage Expert, DHI (India)
11 Mr. Rajiv Sinha The Louis Berger Group, Inc.
12 Mr. Lalit Mohan Remote Sensing Expert, DHI(India) Water and Environment
13 Mr. Rupesh Gupta Project Coordinator, DHI(India) Water and Environment
14 Prof. Tarun Acharya Solid Waste Management, The Louis Berger Group
15 Mr. Ayan Dey Cost Estimation Expert, The Louis Berger Group
The agenda of the meeting was the overall progress of the project, identification of pollution, and
possible solutions to conserve the river as per NRCD guidelines. Comments were given on the
following:
All experts from PCBA mentioned that the opening of the mouth of the Kolong River
along the Brahmaputra River is a good option, but needs detailed study and
consideration of the flooding risks.
City Sanitation Plan
38
The length of the river considered should only be the stretch inside the town for
immediate steps (first 5-10 years), but a longer stretch be considered later (20-30
years).
Nagaon town lacks power which should be considered in the planning.
Rain causing flooding in Nagaon town is also important.
5.2 Consultation with Community
During the field visits to Nagaon town, and in areas along the Kolong River upstream from
Nagaon town, the team interviewed and discussed with various local people the Kolong River
water quality, sanitation, drinking water supply, and solid waste (Figure 5-2). Two examples are:
Discussion with local people at the upstream mouth of the Kolong River.
Discussion with local people at Misa. Most of the people have soak pits and are not
discharging into the river. They use the Kolong River for bathing, washing, etc.
Figure 5-2: Interaction with local people during field trips in the town.

City Sanitation Plan
39
6 Schemes for City Sanitation Plan
6.1 Key Elements
As stipulated in the NRCD guidelines (2010), the DPR must include a CSP and be consistent
with the City Development Plan. As such, the following characteristics must be considered:
Adopt a holistic approach and provide for an integrated sewer network up to house-
property lines in place of drain interception and diversion to ensure full coverage of the
town and thereby transportation of entire sewage to treatment plants for optimal
utilization.
Incorporate dovetailing with projects if any under JNNURM/UIDSSMT/ State Plan to
ensure optimal utilization of resources on priority basis.
Adopt the Design, Build & Operate (DBO) model for efficient operation and maintenance
(O&M) of river conservation schemes.
Adopt a stakeholder-focused consultative approach at the stage of formulation and
implementation of the project, to ensure active involvement of various stakeholders and
the civil society to generate support and encourage ownership.
Use cutting-edge ICT tools and software for project planning and design.
Adopt innovative and best technology options for treatment of sewage, including
selection and analysis of technical and financial sustainability of created assets. For
this, a life cycle study of technology options along with detailed analysis in respect of
performance is mandatory at the FR stage.
6.2 Good Practices to be followed
In the development of the CSP, some good practices which should be followed include:
Incorporate rainwater harvesting in community sanitation schemes.
Promote solar energy for community sanitation schemes.
Improve the sanitation scheme based on higher user charges where applicable.
Upgrade the existing community sanitation and sewerage infrastructure.
Consider innovative River Front Development (RFD) projects.
Introduce “river festival” and “river runs” under the public participation, Information,
Education & Communication (IEC) activities.
Consider design parameters of STPs based on actual measurement and analysis, and
also land requirements.
6.3 Proposed Actions
The restoration and conservation of the Kolong River is an important goal to Assam and the
Nagaon town. To achieve this goal, in a sustainable manner, several actions are necessary.
These actions focus on addressing pollution from the major sources – raw domestic sewage and
MSW – and improving the hydraulic conditions. Actions are also proposed to provide human use
benefits for the citizens of Nagaon. By providing these benefits, and connecting people to an
improved waterway, the stewardship of the river can be shared by all and achieve lasting
conservation success. The framework of the proposed restoration solution with specific action
and target results is shown in Figure 6-1 and described further below.

City Sanitation Plan
40
Figure 6-1: Schematic of Conservation Framework.
6.3.1 Proposed Actions that Comprise the Restoration Solution
To remain consistent with the framework, the proposed actions which comprise the restoration
of the Kolong River include:
Sewage collection and treatment.
Solid waste collection and management.
Disposal location for animal carcasses.
Removal of legacy pollution.
Hydraulic improvement (including uptake of water from the Brahmaputra River to revive
proper flow of Kolong River).
Improving hygiene and sanitation conditions.
Community access and benefits.
Setting of monitoring system.
Each of these actions is described in more detail below:
Sewerage collection and treatment: Presently there is no centralised sewerage
collection and treatment facility in Nagaon largely because most households have either
a septic tank or soak pit. A new sewage collection system is proposed to collect all
sewage and transport it to a centralised place for treatment. The system, if properly
implemented, will significantly reduce pollution loads to the river. Another option which
may be considered is to have multiple decentralized STPs located at strategic locations
throughout the catchment area. This option will be evaluated in the Feasibility Report.
Solid waste collection and management: As the Nagaon town does not have any
existing solid waste collection and management plan, it is proposed to have an
Integrated Solid Waste Management Plan for the catchment area, which will also cover
the entire town. As the town will implement a MSW collection and management system,
waste will be collected from primary and secondary locations, and transported off-site to
a disposal or reclamation facility. This system will require many years to become
effective as the population learns to use and value the system over current litter and
dumping practices.
Disposal location for animal carcasses: Nagaon has a disposal site 8 km away from the
Nagaon town which is presently used for the disposal of animal carcasses. During the
primary survey, signs of disposal of carcasses in the Kolong River were not observed,
but are known to take place.

City Sanitation Plan
41
Removal of legacy pollution: Due to current practices, there is significant pollution in the
Kolong River from sewage and MSW sources. Although this pollution could be allowed
to naturally attenuate following sewage and MSW source control measures described
above, the restoration of the river can be significantly accelerated by removing this
legacy pollution. This action would involve dredging and bank clean-up to remove this
legacy pollution.
Hydraulic improvements: Regular flooding of the Nagaon town due to Kolong River in
the past has resulted in closer connectivity of the Kolong River with the Brahmaputra
River by the water resources department. This has resulted in less flow in the Kolong
River, although the river is also connected to the Misa River and Diju River (Figure 1-2).
The pollution in these rivers also contributes to the pollution of the upstream stretch of
the Kolong River. A morphological study for the off-take at Brahmaputra River should be
studied to find solutions for hydraulic improvement of Kolong River.
Improving hygiene and sanitation conditions: A number of community toilet complexes
are required in gardens and playground areas along the river. Solid waste collection
bins and proper washing and bathing facilities are required at ghats along the river.
Community access and benefits: One of the keys to river conservation success is to
provide human connections to the waterway. When these connections are established,
everyone becomes a steward of the river and the restoration will be more likely to
succeed. Examples of community benefits include the establishment of greenways
along the waterfront and points of interest to educate the community on conservation
features and ecological resources.
Setting of monitoring systems: An on-line system can be designed and proposed to be
implemented to monitor the water flow as well as water quality of the Kolong River
system. The on-line information will be used by decision makers to avoid flooding in the
town.
Figure 6-2: Example of location where dredging is required.
6.4 Sewage Collection and Treatment Options
The most important aspect of preparation of the CSP is to concentrate on sanitation solutions
which are required for the restoration of the Kolong River. In absence of a development plan for
the Nagaon town, and in light of continuous contamination of the Kolong River, four potential
options have been worked out.

City Sanitation Plan
42
Option 1 is full separation of the domestic waste in a separate sanitary sewer collection system
that conveys the collected waste to a centralised sewerage treatment plant of 11 MLD capacity
for the projected population of the catchment area. But as per the guidelines of CPHEEO
"Manual on Sewerage and Sewage Treatment" second edition, one of the prerequisites is to
have a piped water supply network in the town before proposing a separate sewerage system.
This is a long-term solution for tapping the pollution of the Kolong River, which has to be
implemented after having a piped water supply system for the whole town.
Option 2 is based on the same principle as Option 1 for having a separate sewerage collection
system but instead of conveying the collected waste to a central STP, multiple decentralised
STPs would be located throughout the town, along the river and possibly on government-owned
land as availability of land along the river is scarce. If a minimum 1 MLD decentralised STP is
considered, eight decentralised plants will be required to treat 11 MLD sewage generated from
the projected population for the design year. This option should be used as immediate solution
for prevention of direct pollution from the outfall drains along the Kolong River.
Option 3 consists of the collection of existing sewage and storm water drains in interceptor pipes
which would run parallel on both sides of the Kolong River. Intercepted flow would be conveyed
to an 11 MLD treatment plant, which should be constructed. The interceptor system would be
sized to collect and convey the full capacity of a separated system, but would not be able to
convey storm water drainage during wet weather, which would overflow into the Kolong River.
This is a less desirable option as during wet weather; the combined sewage overflow would add
diluted sewage to the river.
Option 4 also intercepts the sewage and storm drainage in interceptor sewers along the river but
this flow would be treated at numerous decentralized STPs located throughout the town as
indicated in Option 2. If a minimum 1 MLD decentralised STP is considered, eight decentralised
plants will be required to treat 11 MLD sewage generated from the projected population for the
design year.
The proposed sewerage system to be developed by the NMB should consist of a conventional
sewerage system comprising of:
Collection system with sewers (trunk mains, branch, and laterals) and sewer
appurtenances.
Conveyance system (pumping stations and rising/gravity main).
STP(s) of sufficient capacity to cater the projected population of Nagaon town.
The location of the treatment plant has to be finalized so that the treated effluent can be
discharged to the water body.
Any STP is generally located downstream of the intake point for water supply.
Any STP is to be built at an elevation above the High Flood Level.
The treatment processes have to be selected based on raw sewage quality, techno-economic
feasibility and suggestion from the approving authority. Selection is also based on availability of
government-owned land. For the waste water collection system design, the parameters and
guidelines of CPHEEO "Manual on Sewerage and Sewage Treatment" second edition have to
be adopted. The sewerage system will be designed for the peak flow for design year. The
present and projected population have to be considered with reference to the population
projection and the same should be adopted for the design of the sewerage system.
The waste water collection system has been considered a "Separate System".
The waste water generated within the catchment area will be collected by means of trunk
mains/sub mains. The trunk mains and laterals will preferably be laid along the side / centre the
road and has to be routed based on the topographical data. Provisions are made for separate
connection for each household which will be done under a separate project. Trunk mains have
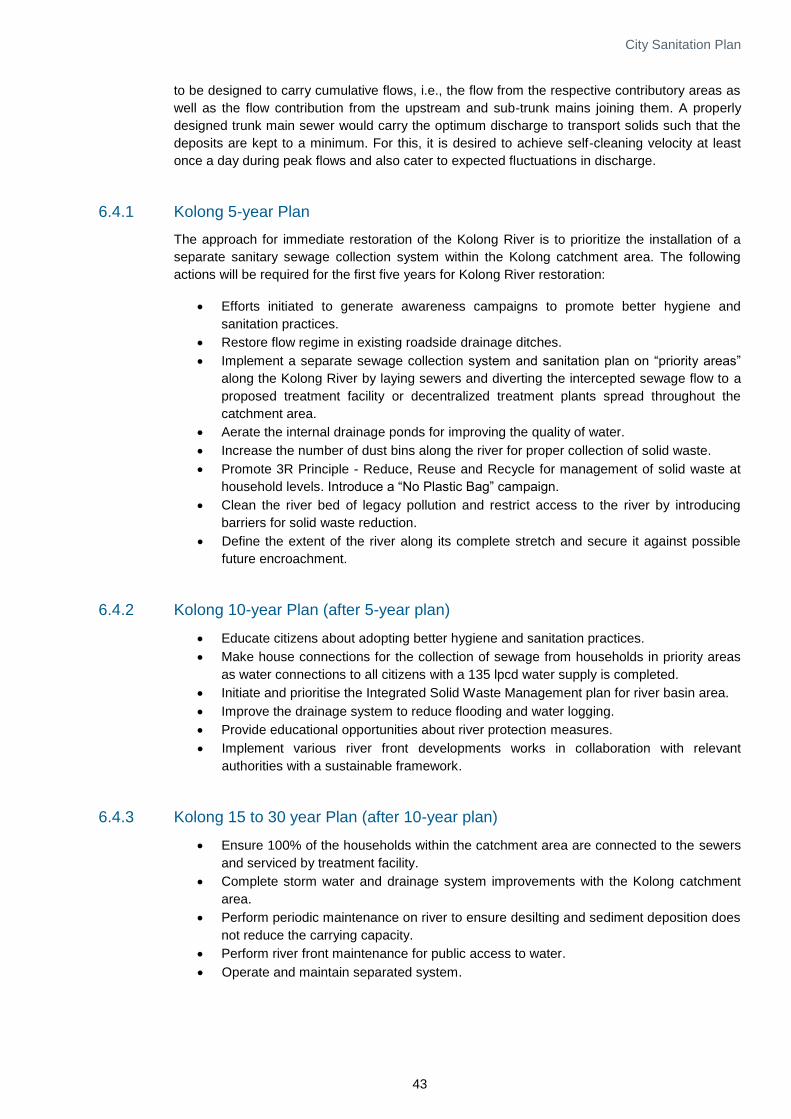
City Sanitation Plan
43
to be designed to carry cumulative flows, i.e., the flow from the respective contributory areas as
well as the flow contribution from the upstream and sub-trunk mains joining them. A properly
designed trunk main sewer would carry the optimum discharge to transport solids such that the
deposits are kept to a minimum. For this, it is desired to achieve self-cleaning velocity at least
once a day during peak flows and also cater to expected fluctuations in discharge.
6.4.1 Kolong 5-year Plan
The approach for immediate restoration of the Kolong River is to prioritize the installation of a
separate sanitary sewage collection system within the Kolong catchment area. The following
actions will be required for the first five years for Kolong River restoration:
Efforts initiated to generate awareness campaigns to promote better hygiene and
sanitation practices.
Restore flow regime in existing roadside drainage ditches.
Implement a separate sewage collection system and sanitation plan on “priority areas”
along the Kolong River by laying sewers and diverting the intercepted sewage flow to a
proposed treatment facility or decentralized treatment plants spread throughout the
catchment area.
Aerate the internal drainage ponds for improving the quality of water.
Increase the number of dust bins along the river for proper collection of solid waste.
Promote 3R Principle - Reduce, Reuse and Recycle for management of solid waste at
household levels. Introduce a “No Plastic Bag” campaign.
Clean the river bed of legacy pollution and restrict access to the river by introducing
barriers for solid waste reduction.
Define the extent of the river along its complete stretch and secure it against possible
future encroachment.
6.4.2 Kolong 10-year Plan (after 5-year plan)
Educate citizens about adopting better hygiene and sanitation practices.
Make house connections for the collection of sewage from households in priority areas
as water connections to all citizens with a 135 lpcd water supply is completed.
Initiate and prioritise the Integrated Solid Waste Management plan for river basin area.
Improve the drainage system to reduce flooding and water logging.
Provide educational opportunities about river protection measures.
Implement various river front developments works in collaboration with relevant
authorities with a sustainable framework.
6.4.3 Kolong 15 to 30 year Plan (after 10-year plan)
Ensure 100% of the households within the catchment area are connected to the sewers
and serviced by treatment facility.
Complete storm water and drainage system improvements with the Kolong catchment
area.
Perform periodic maintenance on river to ensure desilting and sediment deposition does
not reduce the carrying capacity.
Perform river front maintenance for public access to water.
Operate and maintain separated system.

City Sanitation Plan
44
6.5 River Front Development
The success of the river front restoration scheme is dependent upon the acceptance and
ownership of the project by authorities and the public. Currently the Kolong River is considered a
resource to the citizens of Nagaon and has an economic value to the community, as many
inhabitants are using the river for fisheries purpose. Some of the citizens are also using the river
front for recreational activities although the river has the potential for a considerable aesthetic
value. The Kolong river extends through the heart of the town and by improving the water quality
of the river, removing the solid waste, providing adequate resources and collection point for
waste deposit, removing the legacy contamination within the river, and restoring flow, the Kolong
River has the potential to attract both commercial and residential development opportunities.
Figure 6-3: People using the river front for recreational activities.
As part of the river restoration scheme, the first step will be to define the extent of the river along
its complete stretch and secure it against possible future encroachment, and prevent landslides
along the river banks. The next step is to provide proper embankment/stone pitching, which the
NMB has already started along the RKB bridge stretch of the Kolong River.
Figure 6-4: Stone pitching done along the RKB Bridge.
Some of the locations identified for the river front development are Nehru ground, Pranab
Baruah Children Park and the Lord Shiva temple near the Haibargaon bazaar road. At Nehru
ground an amphitheatre is proposed where social functions can be organised like music
concerts, plays, etc. The proposed plan for the development of amphitheatre is as shown in
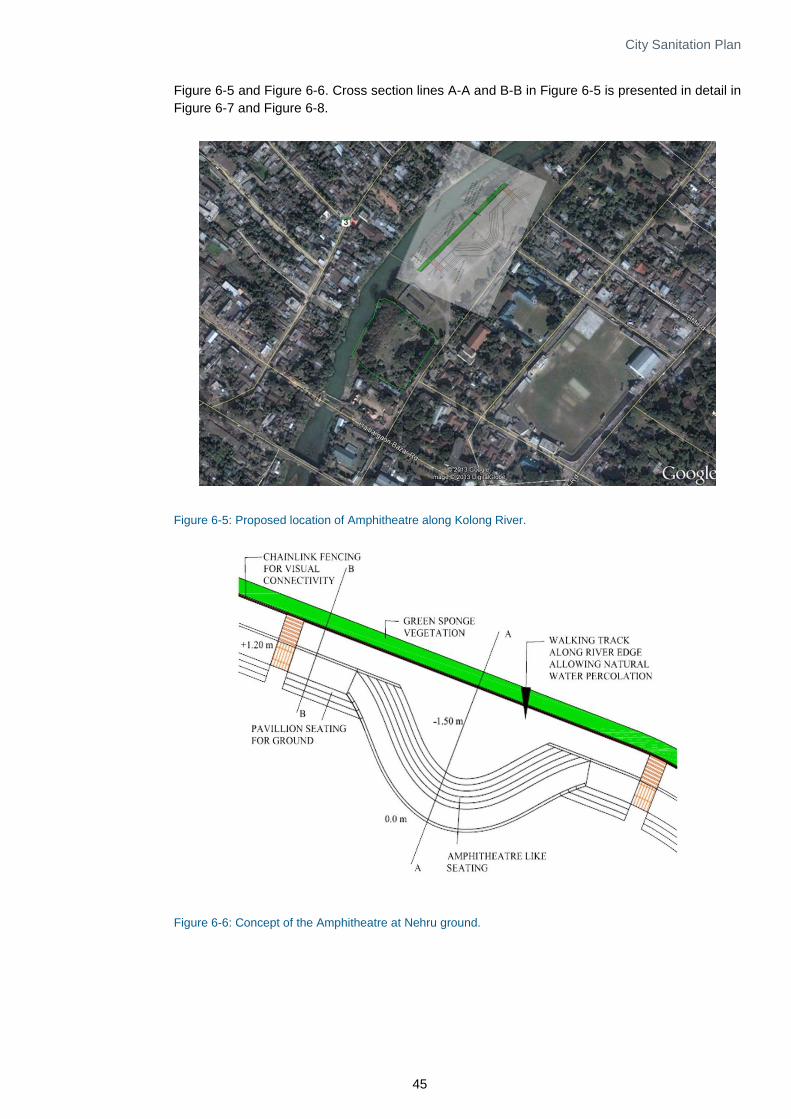
City Sanitation Plan
45
Figure 6-5 and Figure 6-6. Cross section lines A-A and B-B in Figure 6-5 is presented in detail in
Figure 6-7 and Figure 6-8.
Figure 6-5: Proposed location of Amphitheatre along Kolong River.
Figure 6-6: Concept of the Amphitheatre at Nehru ground.
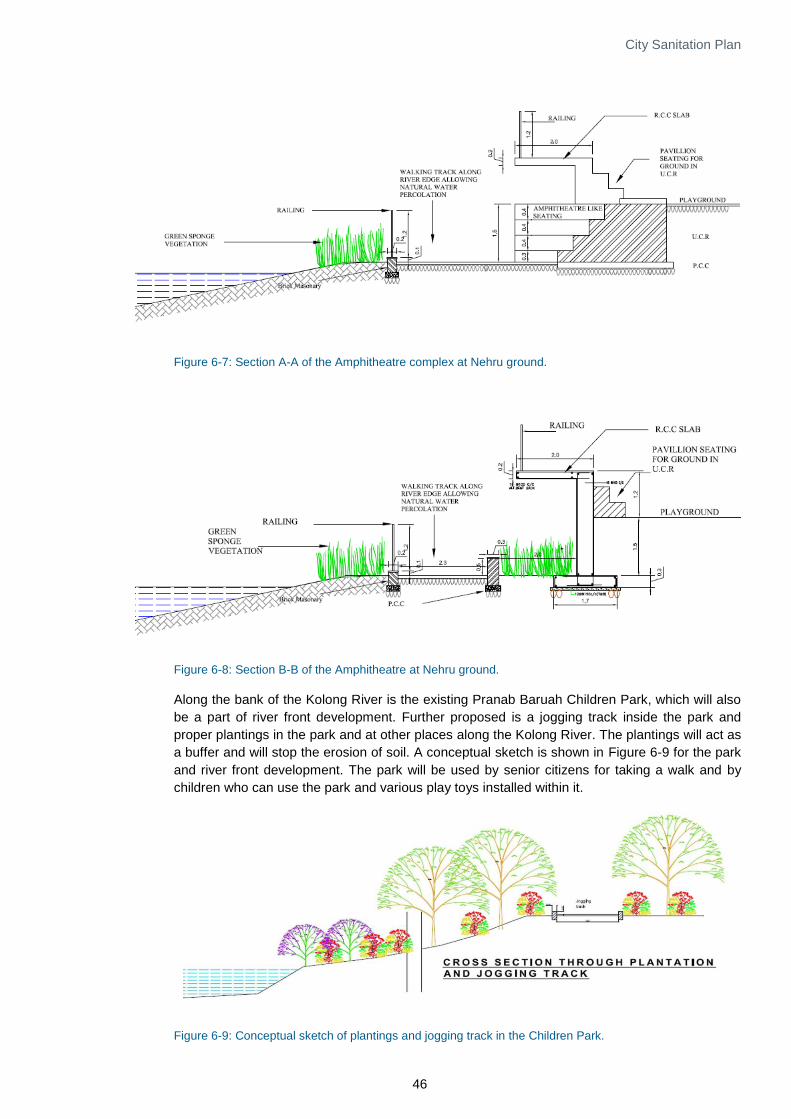
City Sanitation Plan
46
Figure 6-7: Section A-A of the Amphitheatre complex at Nehru ground.
Figure 6-8: Section B-B of the Amphitheatre at Nehru ground.
Along the bank of the Kolong River is the existing Pranab Baruah Children Park, which will also
be a part of river front development. Further proposed is a jogging track inside the park and
proper plantings in the park and at other places along the Kolong River. The plantings will act as
a buffer and will stop the erosion of soil. A conceptual sketch is shown in Figure 6-9 for the park
and river front development. The park will be used by senior citizens for taking a walk and by
children who can use the park and various play toys installed within it.
Figure 6-9: Conceptual sketch of plantings and jogging track in the Children Park.
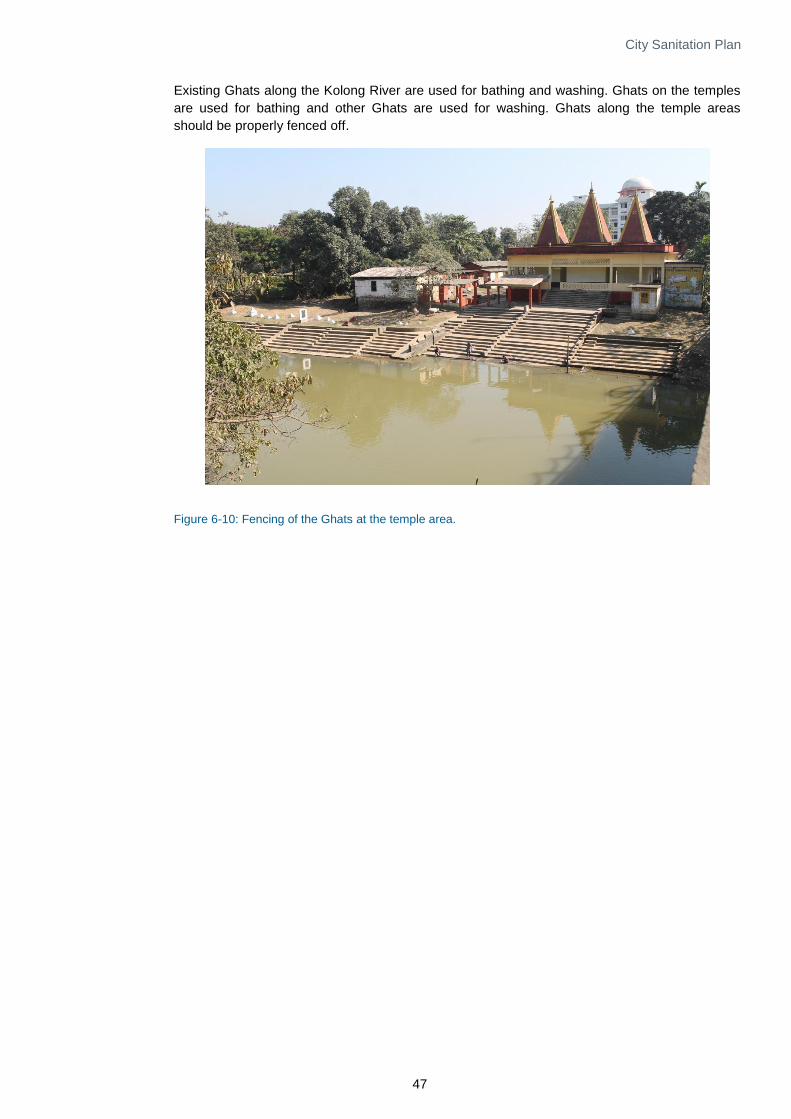
City Sanitation Plan
47
Existing Ghats along the Kolong River are used for bathing and washing. Ghats on the temples
are used for bathing and other Ghats are used for washing. Ghats along the temple areas
should be properly fenced off.
Figure 6-10: Fencing of the Ghats at the temple area.
City Sanitation Plan
48
7 Financial Strategy for Executing the Different Components
The State Sanitation Strategy, like the National Urban Sanitation Policy developed at the
national level, envisions making all cities sanitized and liveable. Implementing sanitation, being
a state subject, has to be dealt with the utmost care. The state sanitation strategy supports the
sanitation plans of the cities by duly acknowledging the financial constraints a ULB goes
through. The state strategy urges the local government bodies to make the public aware of the
financial constraints it goes through and helps in providing basic necessities in an appropriate
way by making provisions for the timely payment of taxes. In addition, the government bodies
should facilitate numerous IEC activities in the town, using audio-visuals and video
documentaries, to promote awareness among the public towards a sanitized town.
Measures to strengthen the revenue streams include the following:
E-Governance to be implemented and computerization of all systems and records.
Surcharge on holdings totally / partially used for commercial purpose.
Initiation of detailed survey to identify un-assessed and under-assessed properties.
Strengthening of Assessment Department with adequate staffing.
Lobbying with the State Government and Central Government (through the State
Government) for settlement and subsequent regular payment of tax dues to Central and
State Government agencies.
Leverage on idle assets.
Restructuring and re-evaluation of balance sheet.
Valuation of assets under the corporation.
Levy of reasonable tariffs and intense recovery.
Increase water connections.
A graded approach to revisions may have to be worked out so that cost recoveries
increase over time.
Change over the basis for property tax from annual rental value to an area-based
system.
Develop a system of tax assessment, reassessment, systems for serving demand
notice, collection, developing information base.
Encourage public private partnerships with part/full cost recovery principle, project
structuring support for parking, terminals and solid waste management.
Reform property tax system to firstly ensure total coverage of properties in the town.
Shift from single entry system to double entry accrual based system.
Provide training and capacity building measures in area of debt financing.
7.1 Planning
ULB level: CSPs need to be prepared in a participatory manner through consultations with
urban citizens, especially the poor and women. The goal of making communities open

City Sanitation Plan
49
defecation free and moving towards a safe disposal system for sewage are the main thrust of a
CSP. The phasing of the plan, its operational elements, choice of technology options and
finances are included in the plan. This plan integrates the overall development plan of the ULB
and is reviewed by the District Urban Sanitation Committee (DUSC) to dovetail it with other
urban infrastructure development initiatives. CSPs need to be readied within a definite time
frame.
State level: The State Sanitation Nodal Agency (SSNA) consolidates CSPs into a state level
plan specifying the time frame, finances, operational components and guideline-sets for these
components, to enable the state to earmark resources. The ULB aligns to the State plan.
Special emphasis needs to be given to urban centres that attract floating populations seasonally
(tourism) or sporadically (religious/cultural occasions) for planning. Also, appropriate
environment-friendly solutions need to be incorporated for these locations.
7.2 Investment Requirements and Financing Options
A dedicated State Urban Sanitation Fund (SUSF) may be set up under the budget of the
Housing and Urban Development Department with outlay from the state budget, supplemented
by any provisions from Ministry of Urban Development (MoUD), Government of India (GoI). The
proposed SUSF will be utilized for urban sanitation, and will focus on assisting the ULBs in the
management (planning, communication, monitoring, etc.) of the sanitation programme.
Guidelines for access and use of this fund will be framed and the State Urban Sanitation
Committee (SUSC) will advise the department on the approval and sanction of ULB proposals. It
will be mandatory for ULBs to commit to prepare the CSP for accessing this fund, and
subsequent fund flows will be conditional with the implementation of the CSP.
The consolidation of ULB City Sanitation Plans at the state level will indicate financing
requirements for implementing total sanitation in the urban areas of the state.
Table 7-1: Schemes within the area of responsibility of government or public agencies.
Scheme Implementing Agency Likely Funding Agency
Interception and diversion of waste water
PHED or any other agency implementing such projects in the
State NRCD
Sewage treatment Do NRCD
Community toilet complexes ULB NRCD
Crematoria ULB NRCD
Municipal solid waste directly polluting river water
ULB NRCD
Other municipal solid waste management
ULB MoUD
Dairies ULB MoUD and MNRE
(Energy Generation)
Other non-point sources, e.g., washing vehicles, dhobi ghats, etc.
ULB MoUD
River front development Irrigation/water resources NRCD
A portfolio of funding sources (such as funds available through schemes like JnNURM, MoUD;
funds committed through externally aided projects; PPP options with private or corporate sector)
and potential partnerships with NGOs, the private sector, and other sanitation sector participants
will be explored by the SSNA and guidelines will be issued to the ULB on the nature and
modalities for accessing these.

City Sanitation Plan
50
7.3 Strategic Planning
The reconnaissance survey and baseline data indicate that the proportion of the population in
Nagaon town fully served by adequate sanitation is relatively low, especially in poor urban areas
in the river catchment. In addition, a relatively low portion of the town’s population has access to
municipal piped water supply, and access to door to door collection or municipal bins for solid
waste disposal.
It has also been observed that the urban sewerage and drainage systems have inadequate
coverage (where they exist), and are degraded. Mainly domestic waste water from houses is
directly discharged to the open drains and then flows to the receiving river either directly or
indirectly without any treatment. In consequence, the self-purification capacity of receiving water
bodies is overloaded, causing surface and ground water pollution, significant health and
economic risks, and reduced environmental quality.
This section on river restoration strategy takes a holistic approach to the pollution problem and
looks beyond immediate concerns to consider the wider environmental impacts of proposed
initiatives and activities and shall deal with sanitation problems in an integrated way rather than
in isolation.
Schedule
The system shall be designed under the broad framework as per the guidelines for a design
period of 30 years; however, the planning shall entail the implementation of the design in an
organised and phased manner to meet the ultimate goals of this CSP. In this regard, the
planning horizon has been taken with respect to the base year for which the Proposed
Sewerage System Master Plan has been prepared for the entire Nagaon town to make this plan
compatible with that project. The other phases of this project are proposed to be framed up to
converge to an ultimate design year, again to be compatible with the Sewerage Plan.
Consultants have proposed a 3-phase approach to implement the plan proposed in this report,
namely immediate, short-term, and long-term benefits to ameliorate the degrading river water
quality and its restoration. Each term would be spread over a certain number of years to
complete the targeted tasks. Under this, it has been adopted that financial approval of the
scheme would probably be completed by year 2014 and construction tenders for implementation
works would also be floated by 2014. This has been referred to as “immediate phase” having a
projected time period of 5 years when the initial works are expected to be completed. The next
phase of development over another 10 years from 2020 till 2030 is referred to as “short-term”
and the remaining works to be taken up over the remaining 15 years is referred as “long-term”.
This phased approach aims to navigate through the challenges posed by the limitations in
investments, existing administrative framework, institutional capacities, and community
engagement in a proficient manner. The phases, corresponding timelines, and activities are
defined in Table 7-2 and Table 7-3.
Table 7-2: Phased implementation of the CSP. The years shown are an example that may be changed during actual implementation.
Phase Year
Immediate 2014 – 2019
Short-Term 2020 – 2030
Long-Term 2031 – 2044
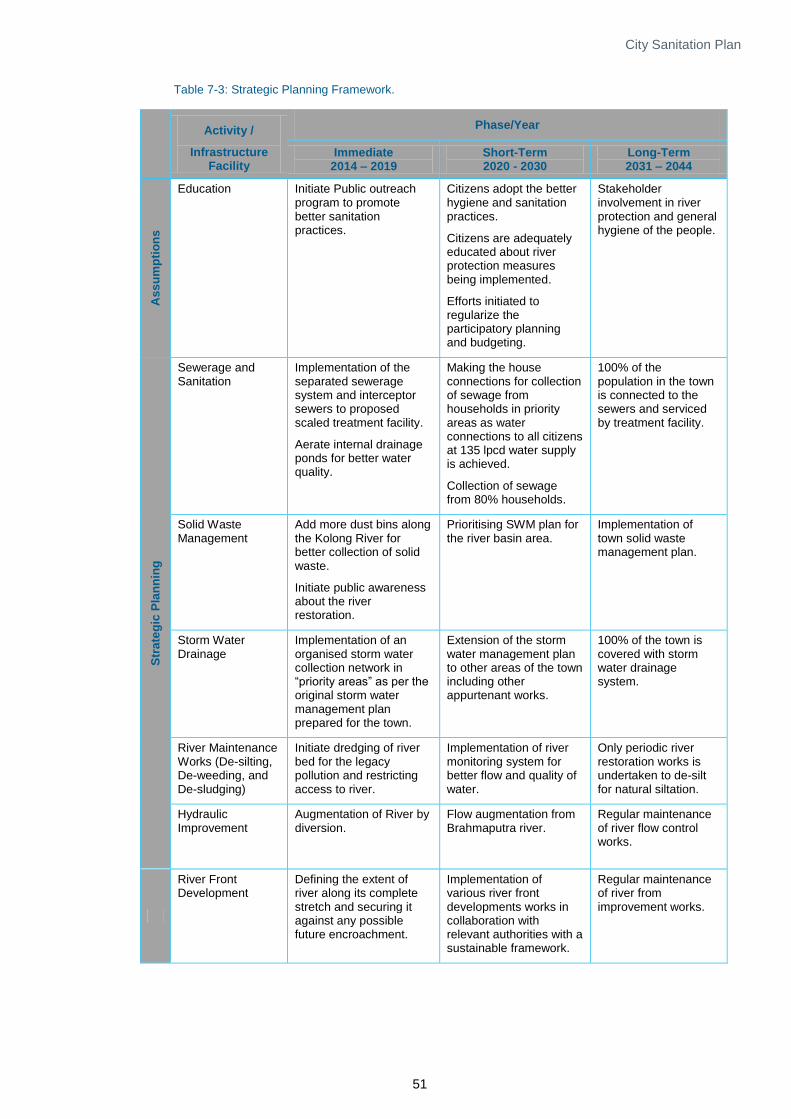
City Sanitation Plan
51
Table 7-3: Strategic Planning Framework.
Activity /
Infrastructure Facility
Phase/Year
Immediate 2014 – 2019
Short-Term 2020 - 2030
Long-Term 2031 – 2044
As
su
mp
tio
ns
Education Initiate Public outreach program to promote better sanitation practices.
Citizens adopt the better hygiene and sanitation practices.
Citizens are adequately educated about river protection measures being implemented.
Efforts initiated to regularize the participatory planning and budgeting.
Stakeholder involvement in river protection and general hygiene of the people.
Str
ate
gic
Pla
nn
ing
Sewerage and Sanitation
Implementation of the separated sewerage system and interceptor sewers to proposed scaled treatment facility.
Aerate internal drainage ponds for better water quality.
Making the house connections for collection of sewage from households in priority areas as water connections to all citizens at 135 lpcd water supply is achieved.
Collection of sewage from 80% households.
100% of the population in the town is connected to the sewers and serviced by treatment facility.
Solid Waste Management
Add more dust bins along the Kolong River for better collection of solid waste.
Initiate public awareness about the river restoration.
Prioritising SWM plan for the river basin area.
Implementation of town solid waste management plan.
Storm Water Drainage
Implementation of an organised storm water collection network in “priority areas” as per the original storm water management plan prepared for the town.
Extension of the storm water management plan to other areas of the town including other appurtenant works.
100% of the town is covered with storm water drainage system.
River Maintenance Works (De-silting, De-weeding, and De-sludging)
Initiate dredging of river bed for the legacy pollution and restricting access to river.
Implementation of river monitoring system for better flow and quality of water.
Only periodic river restoration works is undertaken to de-silt for natural siltation.
Hydraulic Improvement
Augmentation of River by diversion.
Flow augmentation from Brahmaputra river.
Regular maintenance of river flow control works.
River Front Development
Defining the extent of river along its complete stretch and securing it against any possible future encroachment.
Implementation of various river front developments works in collaboration with relevant authorities with a sustainable framework.
Regular maintenance of river from improvement works.

City Sanitation Plan
52
8 Maps
Maps created for this CSP are summarized in Table 8-1.
Table 8-1: List of maps.
S.No. Maps Description
1 India States of India, with Assam highlighted as the project
location.
2 Assam
District map of Assam; it includes the Nagaon district where
the Kolong River passes through and where the river is most
polluted.
3 Map of Kolong River Basin Kolong River and its tributaries. Also marks the location
where the river flows through the Nagaon district.
4 Satellite image of the area Satellite image (AWiFS) of the area.
5 Ward map of Nagaon Municipal Wards, Slums and Roads
6 Digital Elevation Model Digital Elevation Model(DEM) of Kolong river basin including
Kopili, Digaru, Jamuna and Digaru rivers.
7 Sewerage Outfall Map Municipal wards, sewerage outfall, water bodies.
8 Solid Waste Map Municipal Wards, Soild Waste Dumping Sites and with water
bodies in Nagaon town.
9 Bathing Ghat Municipal Ward, Water Body with Bathing ghat in Nagaon
Town.
10 Dredging Stretch Municipal Ward, Kolong River with Dredging stretches
11 Sampling Location Kolong river basin and Sapling location.
12 River Front Development Map includes municipal wards and location of proposed river
front development site.

City Sanitation Plan
53
9 References
1. Municipal Solid Waste (Management and Handling) Rules, 2000.
2. Census of India 1991 data.
3. Census of India 2001 data.
4. Census of India 2011 data.
5. Ministry of Minority Affairs Government of India (20xx) “Baseline Survey of Minority
Concentrated Districts, District Report, Nagaon”, Prepared by Omeo Kumar Das
Institute of Social Change and Development: Guwahati.
6. Department of Environment & Forest, Government of Assam (2012) “Assam State Plan on
Climate Change, 2012-2017”. 101 pages.
7. Pollution Control Board, Assam (1993) “A report on Polluted river stretches in India: The
Kalong system along Nagaon town, Assam. May – June, 1993”, Prepared by Pollution
Control Board Assam for Central Pollution Control Board, June 1993. 87 pages.
8. Pollution Control Board, Assam (2010) “DPR for Restoration and Conservation of the
Kolong River, Assam”, Prepared by Centre for the Environment, Indian Institute of
Technology, Guwahati, October 2010. 207 pages.
9. Pollution Control Board, Assam (2013) Personal communication, Water quality data for
Kolong in the period 2008-2013.
10. Khan, I.I. and Arup, K.H. (2012) “Study of some water quality parameters of Kolong riverine
system of Nagaon, India”. The Clarion Volume 1 Number 2, pp 121-129.
11. Nagaon Official Website: http://nagaon.nic.in/econ.html.
12. Department of Animal Husbandry and Veterinary, Nagaon official website:
http://www.nagaonvety.org/.
13. NRCD (Ministry of Environment & Forests, National River Conservation Directorate, New
Delhi). 2010. Guidelines for Preparation of Project Reports under National River
Conservation Plan and National Ganga River Basin Authority. Prepared by Alternate
Hydro Energy Centre, Indian Institute of Technology (December 2010)

City Sanitation Plan
54
Appendix A: Water Quality Data (Present project)

City Sanitation Plan
55

City Sanitation Plan
56
Appendix B: Water Quality Methodology (Present project)

City Sanitation Plan
57
City Sanitation Plan
58
Appendix C: Water Quality Data (PCBA, 2013)
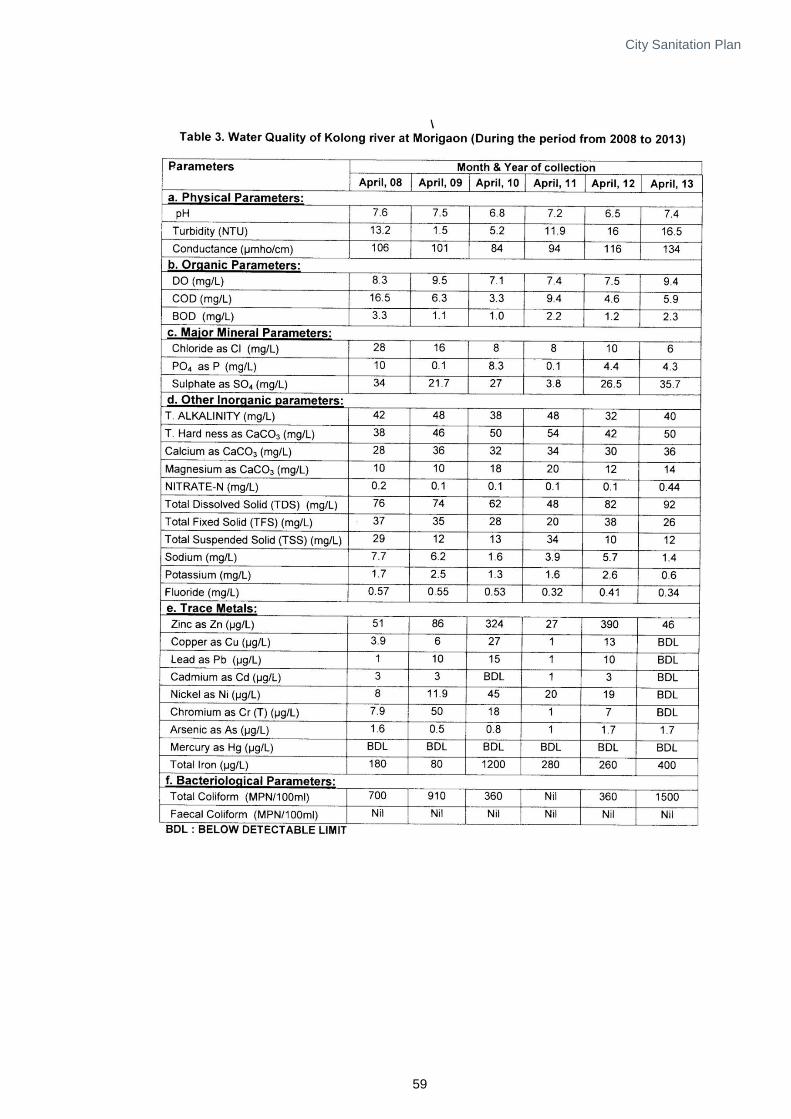
City Sanitation Plan
59

City Sanitation Plan
60

City Sanitation Plan
61
Appendix D: Water Quality Data (Khan & Arup, 2012)

City Sanitation Plan
62

City Sanitation Plan
63
Appendix E: Water Quality Data (PCBA, 2010)
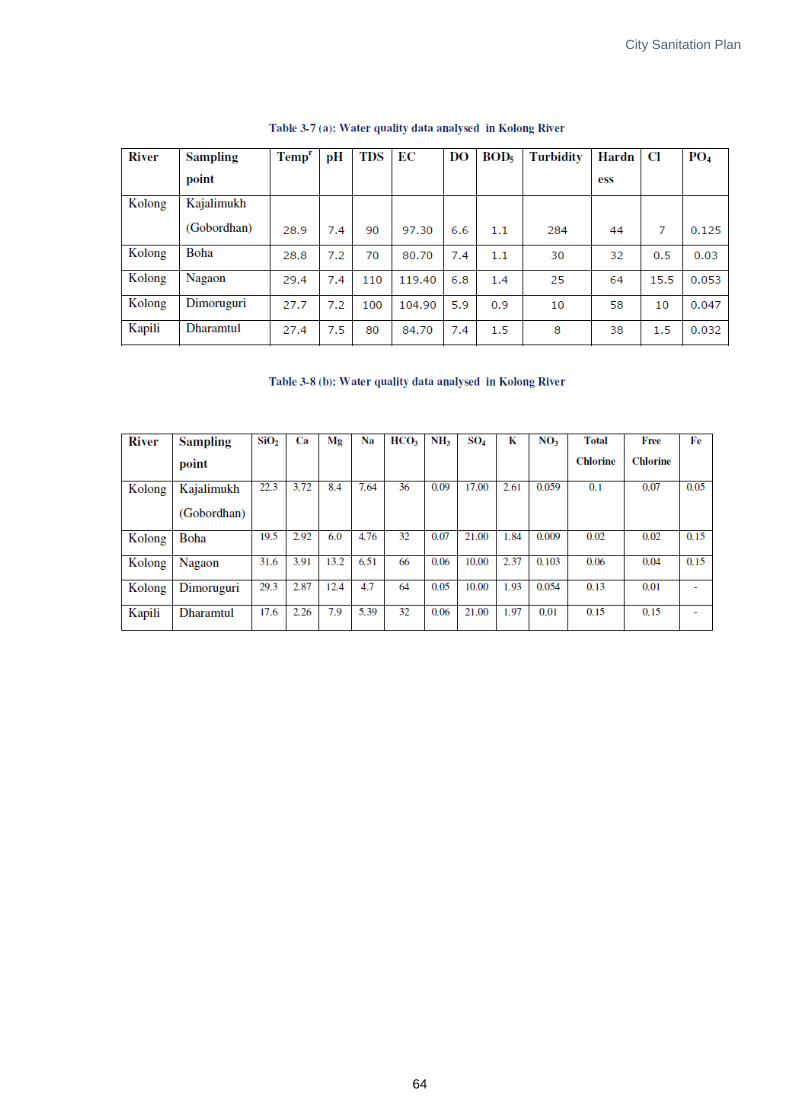
City Sanitation Plan
64
Top Related