


Languages
Pages
Legal

CITY OF PORTLAND
BUREAU OF PLANNING AND SUSTAINABILITY
PORTLAND
INFRASTRUCTURE
INVESTMENT
PILOT STUDY
March 23, 2011
FCS GROUP 4380 SW Macadam Ave. Suite 220
Portland, OR 97239
T: 503.841.6543 | F: 503.841.6573
This report was funded in part by a Periodic Review
Grant provided by the Oregon Department of Land
Conservation and Development.
City of Portland Bureau of
Planning and SustainabilitySam Adams, Mayor | Susan Anderson, Director

www.fcsgroup.com FCS GROUP
ACKNOWLEDGEMENTS
This report was funded in part from a Periodic Review Grant provided by the Oregon Department of Land
Conservation and Development, with in-kind support from the City of Portland Bureau of Planning and
Sustainability. We sincerely appreciate all the input that has been provided by City staff, Portland
Development Commission staff, and local community ―stakeholders‖ and real estate brokers that
participated in this study.
Bureau of Planning and Sustainability (BPS)
Mayor Sam Adams, Commissioner-in-charge
Susan Anderson, Director
Joe Zehnder, Chief Planner
Steve Dotterrer, Principal Planner
Eric Engstrom, Principal Planner
Portland Bureau of Planning and Sustainability Manager and Staff
Michelle Kunec, Study Manager/Management Analyst, BPS
Gary Odenthal, Technical Services Manager, BPS
FCS GROUP Consultant Staff
Todd Chase, AICP, LEED AP, Senior Project Manager/Economist
Angie Sanchez Virnoche, Principal
Tim Wood, Technical Support
Amy Florence, Technical Support
Bob Yakas, AIA, Technical Support
Additional project consultant team members included:
Cogan Owens Cogan (community outreach and graphic support)
Harper Houf Peterson Righellis (civil engineering and cost estimating)
Real Urban Geographics (local ESB firm specializing in GIS analysis)
Report produced by FCS GROUP; March 2011
This entire report is made of readily recyclable materials,
including the bronze wire binding and the front and
back cover, which are made from post-consumer
recycled plastic bottles.

page i
www.fcsgroup.com FCS GROUP
TABLE OF CONTENTS
SECTION I: SUMMARY.................................................................................................................... 1
A. Introduction ........................................................................................................................................... 1
B. Case Study Typology Areas ................................................................................................................ 1
C. Approach ............................................................................................................................................... 2
D. Findings ................................................................................................................................................... 4
SECTION II: STUDY METHOD AND APPROACH ........................................................................... 8
A. Work Completed .................................................................................................................................. 8
B. Background Studies ............................................................................................................................. 8
C. Stakeholder Interview Findings ........................................................................................................... 8
D. Bus and Walking Tour ........................................................................................................................... 9
E. Infrastructure Assessment .................................................................................................................. 10
E.1 Water and Sewer ........................................................................................................................ 11
E.2 Stormwater .................................................................................................................................. 11
E.3 Roadway, Pedestrian, Bicycle and Transit Facilities ............................................................ 12
E.4 Parks and Community Facilities ............................................................................................... 14
E.5 Schools .......................................................................................................................................... 16
F. Development Readiness Indicators ................................................................................................ 18
F.1 Vacant and Underutilized Land Area .................................................................................... 18
F.2 Current Market Lease Rates and Sales Prices ....................................................................... 19
F.3 Recent Private Development Activity .................................................................................... 21
F.4 Demographic and Socioeconomic Overview ..................................................................... 22
F.5 Land Use Patterns ....................................................................................................................... 19
F.6 Local Growth Forecasts ............................................................................................................ 23
SECTION III: AREA ASSESSMENTS .................................................................................................. 1
A. Outer Tabor Area .................................................................................................................................. 1
A.1 SWOT Analysis ................................................................................................................................ 2
A.2 Development Readiness Report Card ..................................................................................... 3
A.3 Infrastructure Report Card .......................................................................................................... 3
A.4 Planned Infrastructure Improvements ...................................................................................... 4
A.5 Public Facility Gaps and Priorities .............................................................................................. 5
B. Lents Town Center ................................................................................................................................ 6

page ii
www.fcsgroup.com FCS GROUP
B.1 SWOT Analysis ................................................................................................................................ 6
B.2 Development Readiness Report Card ..................................................................................... 7
B.3 Infrastructure Report Card .......................................................................................................... 8
B.4 Planned Infrastructure Improvements ...................................................................................... 8
B.5 Public Facility Gaps and Priorities .............................................................................................. 9
C. Powellhurst-Gilbert Area .................................................................................................................... 11
C.1 SWOT Analysis .............................................................................................................................. 11
C.2 Development Readiness Report Card ................................................................................... 12
C.3 Infrastructure Report Card ........................................................................................................ 13
C.4 Planned Infrastructure Improvements .................................................................................... 14
C.5 Public Facility Gaps and Priorities ............................................................................................ 15
D. Outer Division Corridor ....................................................................................................................... 15
D.1 SWOT Analysis .............................................................................................................................. 16
D.2 Development Readiness Report Card ................................................................................... 17
D.3 Infrastructure Report Card ........................................................................................................ 18
D.4 Planned Infrastructure Improvements .................................................................................... 19
D.5 Public Facility Gaps and Priorities ............................................................................................ 20
E. Return on Investment Considerations ............................................................................................. 20
E.1 Potential Capital Costs .............................................................................................................. 20
E.2 Potential Development Activity and Fiscal Revenues ........................................................ 21
E.3 Comparison of Fiscal Revenues and Capital Costs ............................................................ 24
F. Buildable Land Inventory Considerations ...................................................................................... 24
BIBLIOGRAPHY
APPENDICES
A. Infrastructure Investment Pilot Study - Interview Summary - January 19, 2011
B. Portland Infrastructure Investment Pilot Study Bus Tour
C. Walk-Score and Transit-Score Methodology
D. Maps
E. Report Card Methodology
F. Cost Data
G. Potential Revenues

City of Portland Bureau of Planning and Sustainability Portland Infrastructure Pilot Study
March 2011 page 1
www.fcsgroup.com FCS GROUP
SECTION I: SUMMARY
Public infrastructure serves as the ―backbone‖ for urban areas. All people who live, work and
recreate in cities depend on infrastructure for mobility, water, education, health , and human safety.
The Portland Infrastructure Investment Pilot Study documents existing infrastructure conditions and
potential public investments that can leverage desired private investment and can help enhance
community livability.
A. INTRODUCTION
The City of Portland is in the process of preparing the Portland Plan and an update to the City’s
Comprehensive Plan to guide land use and development patterns over the coming decades. In
recognition that each neighborhood within Portland is unique, this Infrastructure Investment Pilot
Study (Study) provides a methodology and approach that can be applied to any neighborhood or
designated opportunity area to better understand infrastructure conditions and infrastructure return on
investment (ROI) potential.
Infrastructure may be defined to include local, community, regional and national public facilities and
services. This Study focuses only on local (neighborhood) and community infrastructure facilities,
including: streets, transit, water, stormwater, sanitary sewer, parks, and school facilities . While the
scope of this study reflects infrastructure capacity and capital cost issues, a local or regional
government may desire to expand the infrastructure investment analysis to also include regional
transportation facilities (airport, railroads, and bridges); police and fire; energy/power; solid waste;
and public housing; and infrastructure operating and maintenance costs.
Key objectives for this study include:
Document existing local infrastructure conditions;
Document existing land use conditions and key demographic and socio-economic indicators;
Review local redevelopment and growth assumptions for housing and employment;
Summarize planned infrastructure improvements and related capital costs; and
Document potential measures of public infrastructure return on investment (ROI), including potential
property tax revenues and state shared tax revenues that could result following new public
infrastructure investment.
B. CASE STUDY TYPOLOGY AREAS
All urban areas evolve with time. Over the past century, Portland has dramatically expanded in
population, business activity, and economic and cultural diversity. Today, Portland is a regional and
international center for commerce with dozens of established neighborhoods, centers, and corridors.
The Portland Plan recognizes that the city’s neighborhoods located outside the Central City area fall
generally into urban typologies, such as Inner-Ring Streetcar era; Mixed-Era ―Mosaic‖; Mixed-Form
Hillside; Postwar Uniform Suburban; Clustered Topographical; and Mountainside.

City of Portland Bureau of Planning and Sustainability Portland Infrastructure Pilot Study
March 2011 page 2
www.fcsgroup.com FCS GROUP
The city selected four case study areas in Southeast Portland for this infrastructure pilot study that
represent two primary typologies, including the Inner Ring Streetcar Era and the Mixed Era
―Mosaic.‖ The four selected areas (depicted in Figure S-1) include:
1. Outer Tabor (Division to Holgate/82nd
to 92nd
). This is an example of a Mixed Era ―Mosaic‖
neighborhood with excellent transit service (MAX Greenline station opened in 2009), and a mix
of large commercial ―big box‖ and smaller business centers. Development patterns primarily
include low-density, single-story commercial buildings, single family homes, and apartments.
Local residential streets generally lack sidewalks and there are many substandard (unpaved)
alleys.
2. Lents Town Center/SE Foster Corridor. This area includes a redeveloping ―historic‖
neighborhood center with excellent transit service (MAX Greenline station opened in 2009) and
established street grids block patterns. The majority of this area is located west of I-205, and has
streetcar era development patterns, with consistent street grids, mature street trees, and street-
oriented buildings.
3. Powellhurst-Gilbert (Powell to Harold/122nd
to 136th
). This is an outer Mixed Era ―Mosaic‖
neighborhood with a planned high-capacity transit corridor. Development patterns and lot sizes
are highly variable. Local streets generally have poor connectivity with substandard design and
missing sidewalks and bicycle facilities.
4. Outer Division Corridor (I-205 to 122nd
). This is also an outer Mixed Era ―Mosaic‖
neighborhood with a planned high-capacity transit corridor. Development patterns and lot sizes
are highly variable, but there are some relatively large tracts of vacant land. Local streets
generally have poor connectivity and substandard design, with inadequate or missing sidewalks
and bicycle facilities.
Figure S-1. Southeast Case Study Areas Location Map
SE Portland Case Study Areas
City of Portland Bureau of Planning and Sustainability Portland Infrastructure Pilot Study
March 2011 page 3
www.fcsgroup.com FCS GROUP
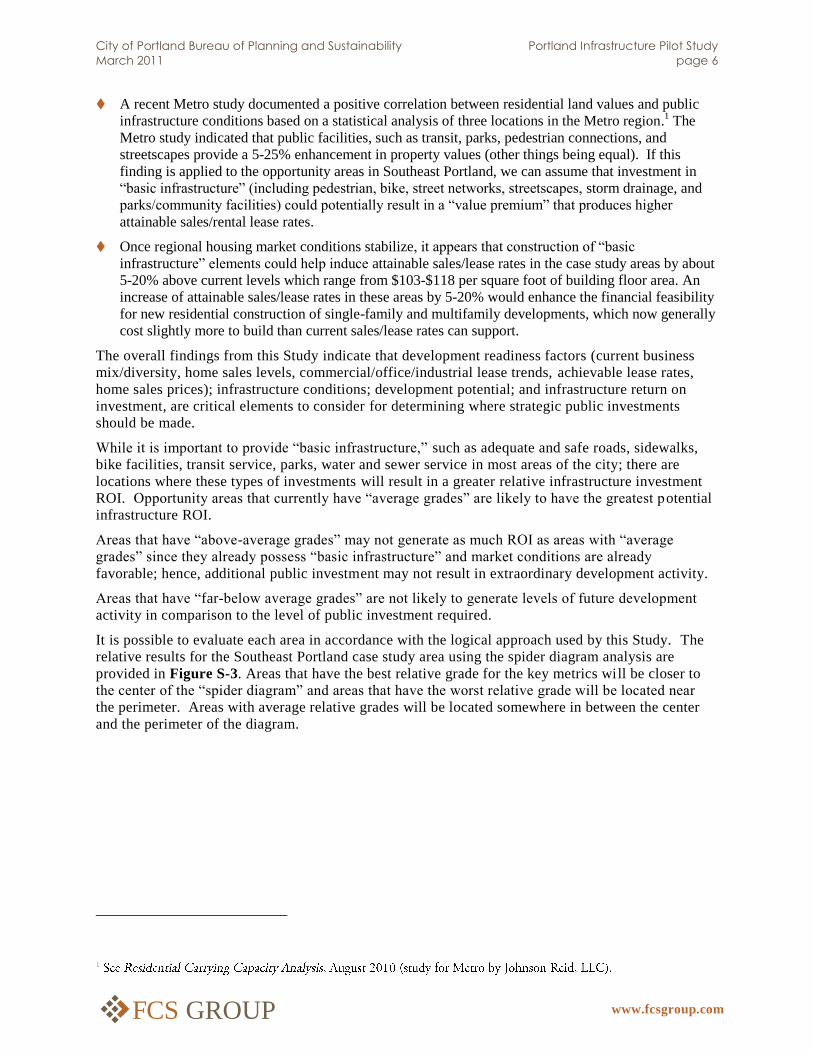
C. APPROACH
This study builds upon several local and regional plans and studies that document land use patterns,
land needs, growth forecasts, infrastructure requirements, and related community development issues
for the Southeast Portland area. The consultant team supplemented the background studies with
additional local community and regional agency outreach, which included interviews and a
bus/walking tour of the four case study areas.
Project team members, urban planners, and civil engineers compiled local capital improvement
programs and long-range public facility plans to document planned infrastructure improvements and
related capital construction cost estimates. The infrastructure capacity/condition for each area was
evaluated using available GIS data provided by the City of Portland. The data was supplemented
with site visits (by civil engineers) to prepare an ―Infrastructure Report Card‖ for each area. Grades
are given for: transit service/facilities; roads, bicycle facilities; pedestrian facilities; water systems;
sanitary sewer systems; storm water management systems; parks facilities; community center
facilities; and public school capacity levels.
Economists and land use planners documented ―development readiness‖ indicators, including:
housing mix/diversity; residential and non-residential absorption (sales) levels; attainable rent/sales
prices; business mix; long-term residential and non-residential growth forecasts (prepared by Metro);
lease rates; vacancy rates; public and private investment levels; and redevelopment potential. A
―development readiness report card‖ is prepared for each area using available data to measure these
market indicators.
The project team prepared capital cost estimates for providing ―basic infrastructure‖ that is needed to
make each case study area a ―complete community.‖ Basic infrastructure elements include: street,
bicycle, and pedestrian facilities (improved to city standards); streetscape enhancements on collector
and arterial roads (street illumination, street trees, benches); and a new indoor community center (or
comparable local public gathering place or amenity).
Potential fiscal and infrastructure revenues to the City of Portland were determined based on the 25-
year development forecasts for each area (using Metro growth forecasts) and existing development
system development charge and property tax rates.
An infrastructure return on investment (ROI) analysis compares the potential cost of providing ―basic
infrastructure‖ with the fiscal benefits that would be generated if new jobs/households were attracted
to each area consistent with Metro’s long-range growth forecasts.
The Infrastructure Investment Pilot Study analysis results in separate overall grades (or scores) given
to each case study area for each of the following measures:
Infrastructure capacity and condition (overall grade from more detailed infrastructure assessment);
Development readiness (overall grade from development readiness assessment);
Infrastructure return on investment (relative indication of the number of years it would take for the
future fiscal revenues to equal the cost of providing basic infrastructure improvements);
Growth forecast (combined number of jobs and housing units expected to occur over next 25 years,
based on Metro’s growth forecast assumptions); and
Build-out potential (Portland BPS estimate of potential development floor area that is allowed in
comparison to the existing level of development floor area).
As indicated in Table S-1, the overall results of the analysis indicate that each case study area has
relative strengths and weaknesses. The highest overall grade (B) was given to the Lents Town
Center/SE Foster Road Corridor case study area. The lowest overall grade (C+) was given to the
Outer Division Corridor area.

City of Portland Bureau of Planning and Sustainability Portland Infrastructure Pilot Study
March 2011 page 4
www.fcsgroup.com FCS GROUP
Table S-1 Summary of Overall Grades for Each Case Study Area
1. Outer Tabor
Area 2. Lents Town
Center 3. Powellhurst-
Gilbert 4. Outer Division
Corridor
Infrastructure Capacity & Condition B B C- C-
Development Readiness C+ C+ C- D
Infrastructure Return on Investment Potential C+ C+ A- A
Jobs & DU Growth Forecast (25-year) B- B A+ D
Build-out Potential (Development Capacity) A- A- C A-
Overall Grade B- B B- C+
Please refer to the technical Appendices for a summary of the detailed metrics used to create the
grading system used in this analysis.
D. FINDINGS
This study provides a consistent infrastructure investment analysis methodology that can be used to
document infrastructure conditions, development readiness, and public return on investment
measures to be used for evaluating areas for infrastructure investment.
Future infrastructure investment decisions and priorities should take into account prior infrastructure
investments and the current conditions/capacity of public facilities. Since public facilities are usually
constructed to last 50 to 100 years (with proper maintenance), a long-term (20+ year) infrastructure
investment strategy should be considered when prioritizing capital funding projects.
A systematic infrastructure analysis approach can be applied to specific neighborhoods or
―opportunity areas‖ to provide a relative comparison among diverse areas. Analysis factors should
take into account quantitative measures: infrastructure conditions/capacity levels; development
readiness; growth forecasts (usually measured in jobs or dwellings); development capacity (at build-
out); and overall infrastructure return-on-investment (which compares expected local public revenues
to potential infrastructure costs over a 20-30 year time frame).
The Southeast Portland study areas were found to have adequate water and sewer infrastructure and
adequate school facility capacity, but inadequate pedestrian, bike, street, stormwater and parks
(indoor community facilities). Strategic public investment that is targeted at providing ―basic
infrastructure‖ including pedestrian, bicycle, street network and indoor community recreation
facilities, would likely have a measurable net positive fiscal impact for the City, while also improving
the level of public health, safety and livability for neighborhoods.
Qualitative considerations regarding infrastructure conditions and development readiness should be
provided using information gleaned from local community stakeholder interviews, and site visits by
civil engineers, planners, and real estate brokers, and business owners/developers.

City of Portland Bureau of Planning and Sustainability Portland Infrastructure Pilot Study
March 2011 page 5
www.fcsgroup.com FCS GROUP
A+ A A- B+ B B- C+ C C- D+ D D- F
Rel
ativ
e In
fras
tru
ctu
re R
etu
rn o
n
Inve
stm
ent
Overall Grade for Opportunity Area
The combination of quantitative and qualitative measures of local infrastructure conditions,
development readiness, growth forecasts; development capacity; and fiscal revenue potential, provide
a basis for documenting infrastructure ROI.
This study utilizes a ―grading system‖ for evaluating infrastructure conditions, development
readiness, infrastructure ROI, and development potential for each opportunity area. A grading system
approach could be used to apply a ―triage‖ approach for determining if an area is likely to achieve
positive growth and community livability benefits with or without additional public infrastructure
investment.
The findings in this study generally indicates that an area can be given an overall grade (or score)
that places it into one of three groupings, as follows (see Figure S-2):
1. Most likely to succeed without major additional public investment (overall grade of A or B);
2. In need of additional public investment to succeed (overall grade of C or D);
3. Less likely to succeed even after additional public investment (overall grade of D- or F).
Figure S-2. Expected Infrastructure Return on Investment by Opportunity Area
(long-term public fiscal revenues compared to infrastructure capital cost outlays)
Source: FCS GROUP.
Areas with Overall Grade of D+ to B+ are expected to
have higher upside infrastructure ROI
potential than other areas
City of Portland Bureau of Planning and Sustainability Portland Infrastructure Pilot Study
March 2011 page 6
www.fcsgroup.com FCS GROUP
A recent Metro study documented a positive correlation between residential land values and public
infrastructure conditions based on a statistical analysis of three locations in the Metro region.1 The
Metro study indicated that public facilities, such as transit, parks, pedestrian connections, and
streetscapes provide a 5-25% enhancement in property values (other things being equal). If this
finding is applied to the opportunity areas in Southeast Portland, we can assume that investment in
―basic infrastructure‖ (including pedestrian, bike, street networks, streetscapes, storm drainage, and
parks/community facilities) could potentially result in a ―value premium‖ that produces higher
attainable sales/rental lease rates.
Once regional housing market conditions stabilize, it appears that construction of ―basic
infrastructure‖ elements could help induce attainable sales/lease rates in the case study areas by about
5-20% above current levels which range from $103-$118 per square foot of building floor area. An
increase of attainable sales/lease rates in these areas by 5-20% would enhance the financial feasibility
for new residential construction of single-family and multifamily developments, which now generally
cost slightly more to build than current sales/lease rates can support.
The overall findings from this Study indicate that development readiness factors (current business
mix/diversity, home sales levels, commercial/office/industrial lease trends, achievable lease rates,
home sales prices); infrastructure conditions; development potential; and infrastructure return on
investment, are critical elements to consider for determining where strategic public investments
should be made.
While it is important to provide ―basic infrastructure,‖ such as adequate and safe roads, sidewalks,
bike facilities, transit service, parks, water and sewer service in most areas of the city; there are
locations where these types of investments will result in a greater relative infrastructure investment
ROI. Opportunity areas that currently have ―average grades‖ are likely to have the greatest potential
infrastructure ROI.
Areas that have ―above-average grades‖ may not generate as much ROI as areas with ―average
grades‖ since they already possess ―basic infrastructure‖ and market conditions are already
favorable; hence, additional public investment may not result in extraordinary development activity.
Areas that have ―far-below average grades‖ are not likely to generate levels of future development
activity in comparison to the level of public investment required.
It is possible to evaluate each area in accordance with the logical approach used by this Study. The
relative results for the Southeast Portland case study area using the spider diagram analysis are
provided in Figure S-3. Areas that have the best relative grade for the key metrics will be closer to
the center of the ―spider diagram‖ and areas that have the worst relative grade will be located near
the perimeter. Areas with average relative grades will be located somewhere in between the center
and the perimeter of the diagram.

City of Portland Bureau of Planning and Sustainability Portland Infrastructure Pilot Study
March 2011 page 7
www.fcsgroup.com FCS GROUP
Figure S-3. Relative Comparison of Case Study Areas
(areas near center have higher relative grade/potential)
Area 1: Outer Tabor (Division to Holgate/82nd
to 92nd
)
Area 2: Lents Town Center/SE Foster Corridor
Area 3: Powellhurst-Gilbert (Powell to Harold/122nd
to 136th
)
Area 4: Outer Division Corridor (I-205 to 122nd
)
This infrastructure investment analysis approach used in this study can create a better understanding
of the dynamic interaction between local infrastructure needs, potential infrastructure ROI, and
relative priorities for making future public facility investments.
The approach used in this Study can be modified or expanded in the future to include additional types
of public facilities/services, or new data sources. Local governments should aspire to understand
infrastructure conditions in each neighborhood, conduct long-term (25-50 year) infrastructure life-
cycle cost analyses, and consider local health, safety and livability benefits, when prioritizing the use
of scarce public investment dollars.

City of Portland Bureau of Planning and Sustainability Portland Infrastructure Pilot Study
March 2011 page 8
www.fcsgroup.com FCS GROUP
SECTION II: STUDY METHOD AND APPROACH
The City of Portland and the Portland Development Commission (PDC) have been focused on
helping the East Portland area redevelop and improve neighborhood livability for several years. As
the greater Portland region continues to add population and business investment, the city is also
working with Metro (the regional government) and other local jurisdictions and infrastructure service
providers to ensure that local neighborhoods redevelop over time with a mix of housing, jobs and
recreational uses that create ―complete communities.‖
A. WORK COMPLETED
What makes a complete community? Addressing this question requires attention to environmental,
social, cultural, economic, and scientific/technical considerations. The method applied by the project
consultant team and the City staff assigned to this pilot study incorporated a mix of subjective and
objective input. Team members included planners, economists, engineers, and community
development experts. In addition to relying upon background data and studies, the project team
worked ―on the ground‖ with local community and business members to better understand local
issues and current priorities.
The review of background plans/studies, combined with stakeholder interviews and a local
bus/walking tour of each case study area helped determine overall strengths, weaknesses,
opportunities, and threats for each study area (SWOT Analysis).
B. BACKGROUND STUDIES
This study builds upon several local and regional plans and studies that document changing land use
patterns, land needs, growth forecasts, infrastructure requirements, and related community
development issues for the East Portland area. These plans and studies were conducted primarily by
the City of Portland, the PDC, and Metro. Key background documents are referenced in the
bibliography of this report.
The consultant team supplemented the background studies with additional local community and
regional agency outreach, which included interviews and a ―bus and walking tour‖ of the four case
study areas. A summary of the stakeholder interviews is provided in Appendix A, and results from
the bus and walking tour is provided in Appendix B, and further summarized in this section.
C. STAKEHOLDER INTERVIEW FINDINGS
Stakeholder interviews were conducted with representatives from TriMet, Portland Public Schools,
David Douglas Public Schools, and neighborhood and business organizations located in the study
area. All interviewees were asked to identify and discuss all local and community infrastructure
investments that may be needed in the area. Key interview findings included:
Future public investments should try to increase density and activity around transit modes. This
approach could leverage the substantial regional investment in the MAX (light rail transit), which
City of Portland Bureau of Planning and Sustainability Portland Infrastructure Pilot Study
March 2011 page 9
www.fcsgroup.com FCS GROUP
includes the Greenline service (opened in 2009), Eastside MAX (operating since 1987), and
extensive frequent-bus service that serves the area.
A complete pedestrian network is also needed to help facilitate access to/from transit stops and local
neighborhoods. Safe pedestrian and bicycle routes to/from schools should also be a consideration.
The most dangerous intersections cited by interview participants included:
Powell at SE 82nd
Avenue (Area 1)
Powell at SE 92nd
Avenue (Area 1)
Powell at SE 122nd
Avenue (Area 3)
Powell at SE 136th
Avenue (Area 3)
Division at SE 82nd
Avenue (Area 1)
Division at SE 122nd
Avenue (Area 4)
Foster at SE 82nd
Avenue (Area 2)
Improved streetscapes and bicycle networks would also help enhance community image and mobility
in the area. Sidewalks were requested along Powell and along SE 122nd
Avenue.
Potential voter-approved school bonds by Portland Public Schools and David Douglas School District
could result in noticeable school facility upgrades and improve energy efficiency.
Additional parks and indoor recreational facilities would provide needed amenities to the area.
Particular park deficiencies were noted east of SE 112th Avenue. Creative ideas included providing
new ―pocket parks,‖ small-scale farming, and an equestrian center near Powell Butte.
Enhanced access is needed for unique local amenities, such as Zenger Farms.
New housing developments should be constructed near transit stops and should be marketed to a mix
of incomes and ages, with a mix of housing and open space (e.g., Russellville).
A better, more complete mix of local neighborhood-scale businesses and stores (within close
proximity to neighborhoods) would provide local alternatives for goods and services.
Localized flooding is another concern, particularly in the southern portions of the study area near
Johnson Creek. Other areas of concern include the need to enhance swales along 122nd
Avenue from
Foster Road to Holgate to address standing water issues.
Several ―eyesore‖ buildings and PGE substations were noted by the stakeholder participants.
Poor telecommunication service was noted in the area with poor or non-existent cell phone reception
and limited computer service.
Innovative ways to assist the retention and growth of small businesses were requested including a
small business development center, which could assist small businesses with planning, marketing and
business permitting.
Higher utilization of the industrial area south of Foster Road (east of I-205) could generate more
business activity and commerce in the area.
Redevelopment of Marshall High School presents an opportunity for the community, but also creates
new challenges in light of recent education program funding cuts.
Please refer to Appendix A for a more complete list of the interview results.
D. BUS AND WALKING TOUR
Project team members conducted a Study site tour on November 2, 2010. The objective of the half-day
tour was to ascertain subjective opinions from real estate brokers, planners, engineers, and

City of Portland Bureau of Planning and Sustainability Portland Infrastructure Pilot Study
March 2011 page 10
www.fcsgroup.com FCS GROUP
development experts regarding the relative redevelopment potential for the four targeted areas in
Southeast Portland. The site tour focused on areas within Southeast Portland that generally depict
prototypical areas and neighborhoods that offer significant redevelopment opportunities.
Each area was evaluated by the site tour participants with regard to its perceived relative advantages
and disadvantages in regard to:
General Land Use Perceptions (i.e., neighborhood character, compatibility of surrounding land
uses, existing zoning, and the appearance of any development standards)
Local Market Perceptions (i.e., recent private or public investments, planned public or private
developments, site visibility, perceived safety or crime issues, and vacancy rates)
Development and Infrastructure Readiness (i.e., infrastructure capacity and condition,
development issues, site ownership/assembly issues, and site condition/preparation)
Transportation Perceptions (i.e., road access, road capacity, transit, multimodal including
pedestrian and bicycle connections/safety, and parking availability and proximity)
Environmental Perceptions (i.e., proximity to sensitive areas, site orientation and topography, noise
or heat islands, greenfield or infill development potential, potential brownfield/site cleanup issues)
The results from the Study site tour provide important information about the perceived ―first
impressions‖ for each case study area. While there are many redevelopment opportunities within
each area, the areas with the greatest number of positive attributes identified by bus tour participants
are:
Lents Town Center/Foster Corridor (Area 2)
SE Division Corridor (I-205 to SE 122nd
Ave.) (Area 4)
It appears that these two areas offer the greatest perceived near- and mid-term (1 to 10 years)
redevelopment potential and have the fewest overall infrastructure needs. Recent and ongoing public
facility and transit investments within these areas have already begun to leverage private investment,
and it appears that these areas present significant new private employment, residential and mixed-use
development opportunities in the near future.
The other two case study areas were deemed by the bus/walking tour participants to offer longer-term
redevelopment potential (years 10+) and would likely require significant investments in roads,
transit, pedestrian, bicycle and stormwater facilities before major private investment occurs.
Please refer to Appendix B for a more detailed summary of the bus/walking tour.
E. INFRASTRUCTURE ASSESSMENT
In addition to the visual assessment of infrastructure conditions, the project team utilized available
background research by the City of Portland Bureau of Planning and Sustainability and other city
departments, and conducted additional research and analysis to document measures of infrastructure
conditions.
The Portland Plan includes an Infrastructure Condition and Capacity background report that
documents and maps infrastructure conditions (listed in alphabetical order) for:
City of Portland Bureau of Planning and Sustainability Portland Infrastructure Pilot Study
March 2011 page 11
www.fcsgroup.com FCS GROUP
Average Daily Traffic Flow
Bicycle Classifications
Bicycle Network
Bridges (City of Portland)
Emergency Classifications
Freight Classifications
Freight System
High Crash Locations (Automobile)
Improved and Unimproved Streets
Priority Pavement Projects
Portland Water Bureau Water System Inventory
Rights- of-Way and Route Jurisdictions
Signalized Intersections
Stormwater Constraints and Soils
Traffic Classifications
Transit Classifications
Transit Ridership
Transit System
E.1 Water and Sewer
Results from the Infrastructure Condition and Capacity (ICC) report (Fall 2009) were reviewed by
the project team. Key findings from this work determined that all of the case study areas are currently
connected to public sewer and public water service, with the exception of a small area located south
of Area 3 near Johnson Creek.
The ICC report found that approximately 30% of the City is served by combined storm/sanitary pipe
system. The Portland Bureau of Environmental Services has recently completed inspections of 55 -
60% of its combined sewers and 25-30% of its sanitary sewer pipes. Of the inspected pipes, the vast
majority are in good to very good condition. A significant percentage of the Lents combined sewer
pipes have not been inspected and over 60% of the Johnson Creek sanitary sewer pipes have not been
inspected. Assuming the Johnson Creek and Lents areas follow suit, the pipes are expected to be in
fair or better condition. The City is continuing to invest in both water quality and sanitary sewer
upgrades in East and Southeast Portland, but those investments are intended to provide increased or
redundant capacity and help meet new federal and state environmental standards.
Over half of the City’s water distribution pipes are over 50 years old and over half of those are i n
poor to very poor condition. Most of the City’s terminal storage facilities are classified as ―open
reservoirs‖ and must be closed or covered as part of the Federal LT2 regulations. Terminal storage
replacement is very expensive and requires transmission upgrades as well. The majority of the case
study areas are located within the Tabor 411 and Powell Valley 415 service areas, which have been
identified as passing preliminary screening for pumping, fire flow, storage, and outage service goals.
The Powell Valley Raymond service area (located in Southeast Portland) has no storage and relies on
pumping to meet demand for domestic and fire flows, but no specific deficiencies were noted in these
service areas. Overall the water systems within the study areas have minor needs and can handle
projected flows through 2030.
E.2 Stormwater
The Infrastructure Condition and Capacity report identifies stormwater deficient locations north of
Powell Boulevard in Area 3, and in vicinity of Johnson Creek along Foster Road (within Area 3).
These areas have inadequate storm drainage facilities and/or soils deemed unsuitable for water
infiltration. However, the majority of stormwater in the Johnson Creek area is directed to
underground injection systems (i.e., drywells and cisterns). In the long-run this could be an issue, as
injection regulations require stormwater treatment prior to injection.
The City is currently working with the Portland Development Commission on major Johnson Creek
restoration efforts that are being designed to enhance wetlands and conservation areas south of the

City of Portland Bureau of Planning and Sustainability Portland Infrastructure Pilot Study
March 2011 page 12
www.fcsgroup.com FCS GROUP
case study areas. The Johnson Creek project includes purchasing properties within the Johnson
Creek floodplain and developing flood control, habitat restoration and water quality facilities. The
City is also retrofitting ―green streets‖ with stormwater management facilities throughout the city.
E.3 Roadway, Pedestrian, Bicycle and Transit Facilities
The Infrastructure Condition and Capacity report identified the following intersections as high crash
locations:
Powell Boulevard at SE 92nd (Area 1)
Powell Boulevard at SE 122nd (Area 3)
Holgate Boulevard at SE 82nd (Area 1)
Foster Road at SE 82nd (Area 2)
Foster Road at SE 92nd (Area 2)
Foster Road at SE 96th (Area 2)
Foster Road at SE 122nd (Area 3)
I-205 on-ramps on Foster Road (Area 2)
In addition to these intersection locations, the Infrastructure Condition and Capacity report also
indicates that all of the case study areas exhibited some level of street system constraints, including
deficient street networks and inadequate bicycle and pedestrian networks.
FCS GROUP conducted supplemental analysis of the roadway and pedestrian network using GIS
information provided by the City of Portland. The GIS analysis determined the amount of
substandard streets (as a percentage of total street length) and the percentage of street edges that do
not include sidewalks. These findings are shown in Table 1.

City of Portland Bureau of Planning and Sustainability Portland Infrastructure Pilot Study
March 2011 page 13
www.fcsgroup.com FCS GROUP
Table 1. Analysis of Substandard Roadways by Case Study Area
Street Classification
Linear Feet Percent
Substandard Total Substandard
1. Outer Tabor Area
Arterial 10,629 981 9%
Minor Arterial 13,316 - 0%
Local 49,976 12,096 24%
Private 15,398 - 0%
Unimproved ROW 3,065 3,065 100%
Total 92,385 16,143 17%
2. Lents Town Center
Arterial 29,677 1,533 5%
Minor Arterial 9,758 - 0%
Local 99,980 11,752 12%
Private 118 - 0%
Unimproved ROW 3,962 3,962 100%
Total 143,496 17,247 12%
3. Powellhurst-Gilbert Area
Arterial 15,265 3,484 23%
Minor Arterial 14,632 - 0%
Local 70,672 22,069 31%
Private 13,015 - 0%
Unimproved ROW 3,962 3,962 100%
Total 117,545 29,515 25%
4. Outer Division Corridor
Arterial 9,682 - 0%
Minor Arterial 826 - 0%
Local 16,253 1,842 11%
Private 4,215 - 0%
Unimproved ROW - - -
Total 30,976 1,842 6%
Source: Real Urban Geographics and City of Portland.
The project team also conducted a similar analysis of streets with ―missing‖ sidewalks to ascertain
the adequacy of existing sidewalk facilities. The sidewalk facility analysis summarized in Table 2
indicates that far more sidewalks are provided within the Lents Town Center than the other case
study locations. The percentage of ―missing‖ sidewalks along streets in the Lents Town Center area
is 39 percent (based on the linear feet of roadways in the area). In comparison, sidewalks are non-
existent along 77 percent of the roadways in Powellhurst-Gilbert Area.

City of Portland Bureau of Planning and Sustainability Portland Infrastructure Pilot Study
March 2011 page 14
www.fcsgroup.com FCS GROUP
Table 2. Analysis of Substandard Sidewalks by Case Study Area
Location
Total
Street
Length
(LF)
Length of
Street Edge
(Both Sides
of Street in
LF)
Existing
Sidewalk
Length (LF)
Existing
Sidewalks as
Percent of
Street Length
(Both Sides of
Street)
"Missing"
Sidewalks
as Percent
of Street
Length
(Both Sides
of Street)
1. Outer Tabor Area 89,320 178,640 81,706 46% 54%
2. Lents Town Center 139,534 279,068 171,313 61% 39%
3. Powellhurst-Gilbert Area 113,583 227,167 52,617 23% 77%
4. Outer Division Corridor 30,976 61,952 28,226 46% 54%
LF = linear feet.
Source: City of Portland Bureau of Planning and Sustainability; GIS analysis by Real Urban Geographics.
FCS GROUP conducted additional analysis of the local pedestrian and transit environment using data
provided by www.walkscore.com. Specific local intersections were evaluated in each case study area
and compared against citywide statistics to ascertain the relative level of pedestrian and transit access
in each location. The results of this analysis are summarized in Table 3. Please refer to Appendix C
for the methodology used for the pedestrian and transit walk score analysis.
The walk scores generally indicate that the Outer Tabor Area, Lents Town Center, and Outer
Division Corridor have slightly above average walk scores, while the Powellhurst-Gilbert Area has
very poor walk scores in comparison with the citywide average for all neighborhoods outside the
Central City. The transit scores were found to be higher for areas inside the I-205 freeway, with the
Outer Tabor Area and Lents Town Center receiving much higher transit scores than the Powellhurst-
Gilbert Area and Outer Division Corridor.
Table 3. Walk and Transit Scores by Case Study Area
Area for Comparison Avg. WalkScore
Avg. Transit
Score
Number of
Intersections
in Talley
1. Outer Tabor Area 71.9 (fair) 54.9 (good) 10
2. Lents Town Center 76.5 (good.) 55.8 (good) 8
3. Powellhurst-Gilbert Area 41.8 (poor) 41.6 (poor) 15
4. Outer Division Corridor 77.0 (good) 46.7 (fair) 3
Citywide Average (outside Central City) 71.0 (city avg.) n/a n/a
Portland Top 10% Neighborhoods Score 95.0 (top 10% in city) n/a n/a
Source: Based on analysis from Appendix C. Compiled by FCS GROUP using data from
www.walkscore.com.
E.4 Parks and Community Facilities
Parks and community facilities (such as indoor recreation centers and community gardens) are
important public facilities and provide wonderful neighborhood amenities and help promote health,
education and social interaction among people that live and work in an area. To help understand the
level of service of local park facilities, the project team documented existing parks, trails, community
facilities, and open space areas within each of the case study areas using the City’s GIS system. The
GIS data was supplemented with a review of local parks and recreational amenities in the Southeast
Portland area, including recently completed parks projects by the City, the PDC, and Metro.
City of Portland Bureau of Planning and Sustainability Portland Infrastructure Pilot Study
March 2011 page 15
www.fcsgroup.com FCS GROUP
Parks and open spaces are one of the relative strengths of Southeast Portland. The area contains
several large regional parks and is served by the Springwater Corridor trail system. Selected park
facilities within close proximity to the case study areas include:
Brookside Park
Kelly Butte Natural Area
Lents Park
Mt. Tabor City Park
Powell Butte
Recently completed parks and community center projects in the Southeast Portland area include:
Brookside wetland restoration
Bloomington Park lighting project
Boys and Girls Club remodel
Earl Boyles park
Ed Benedict Skate Plaza
Glenwood Park lighting project
Lents Park lighting project
Lents Park Little League improvements
Portland Youth Builders on 92nd
Avenue
Raymond Park
Zenger Farm renovation
Ongoing projects by the City and PDC also include Springwater wetland restoration and Johnson
Creek Flood mitigation work.
In order to evaluate the relative sufficiency of local parks, the project team analyzed existing GIS
data to identify the amount of parks acres within each of the case study areas, and compared the
findings with the City’s Parks and Recreation level of service (LOS) standards. The City’s current
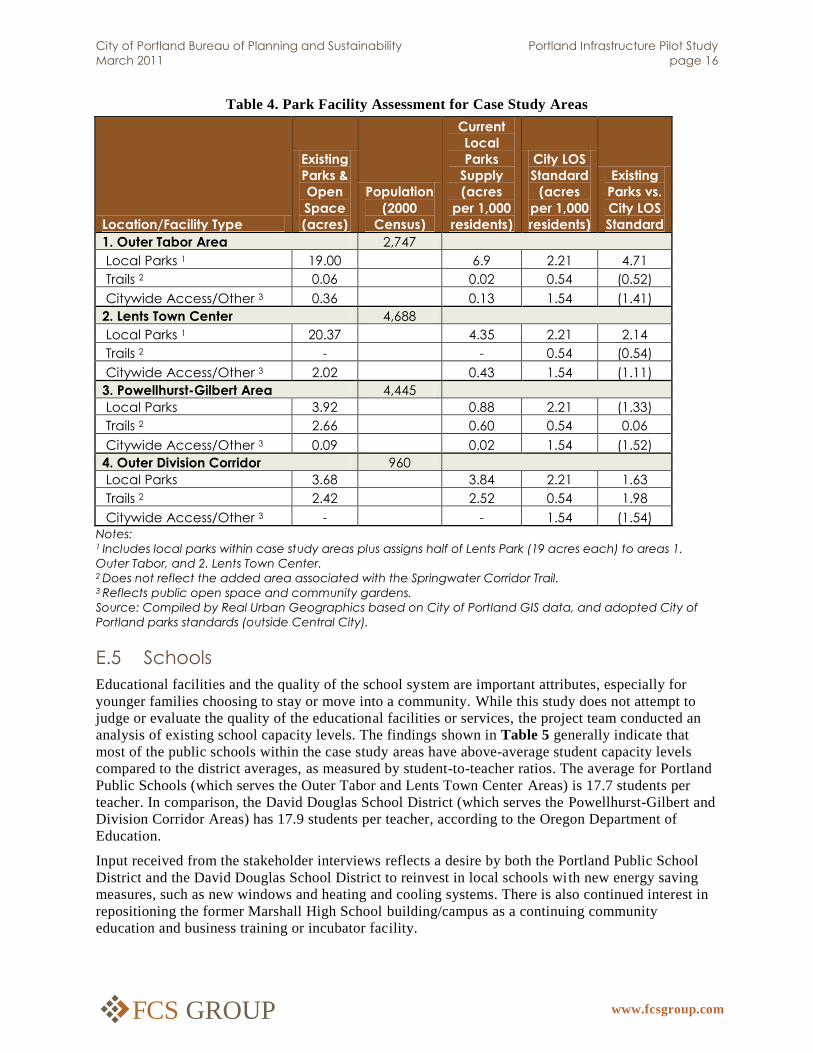
LOS standard equates to 2.21 acres per 1,000 persons.2 A comparison of park facilities within ½ mile
of the case study areas generally indicates that local parks are sufficient, but there may be an
additional unmet need for ―citywide access facilities‖ like community gardens and indoor recreation
centers, particularly in the outer case study areas east of I-205 (see Table 4).
City of Portland Bureau of Planning and Sustainability Portland Infrastructure Pilot Study
March 2011 page 16
www.fcsgroup.com FCS GROUP
Table 4. Park Facility Assessment for Case Study Areas
Location/Facility Type
Existing
Parks &
Open
Space
(acres)
Population
(2000
Census)
Current
Local
Parks
Supply
(acres
per 1,000
residents)
City LOS
Standard
(acres
per 1,000
residents)
Existing
Parks vs.
City LOS
Standard
1. Outer Tabor Area 2,747
Local Parks 1 19.00
6.9 2.21 4.71
Trails 2 0.06
0.02 0.54 (0.52)
Citywide Access/Other 3 0.36
0.13 1.54 (1.41)
2. Lents Town Center 4,688
Local Parks 1 20.37
4.35 2.21 2.14
Trails 2 -
- 0.54 (0.54)
Citywide Access/Other 3 2.02
0.43 1.54 (1.11)
3. Powellhurst-Gilbert Area 4,445
Local Parks 3.92
0.88 2.21 (1.33)
Trails 2 2.66
0.60 0.54 0.06
Citywide Access/Other 3 0.09
0.02 1.54 (1.52)
4. Outer Division Corridor 960
Local Parks 3.68
3.84 2.21 1.63
Trails 2 2.42
2.52 0.54 1.98
Citywide Access/Other 3 -
- 1.54 (1.54)
Notes: 1 Includes local parks within case study areas plus assigns half of Lents Park (19 acres each) to areas 1.
Outer Tabor, and 2. Lents Town Center. 2 Does not reflect the added area associated with the Springwater Corridor Trail. 3 Reflects public open space and community gardens.
Source: Compiled by Real Urban Geographics based on City of Portland GIS data, and adopted City of
Portland parks standards (outside Central City).
E.5 Schools
Educational facilities and the quality of the school system are important attributes, especially for
younger families choosing to stay or move into a community. While this study does not attempt to
judge or evaluate the quality of the educational facilities or services, the project team conducted an
analysis of existing school capacity levels. The findings shown in Table 5 generally indicate that
most of the public schools within the case study areas have above-average student capacity levels
compared to the district averages, as measured by student-to-teacher ratios. The average for Portland
Public Schools (which serves the Outer Tabor and Lents Town Center Areas) is 17.7 students per
teacher. In comparison, the David Douglas School District (which serves the Powellhurst-Gilbert and
Division Corridor Areas) has 17.9 students per teacher, according to the Oregon Department of
Education.
Input received from the stakeholder interviews reflects a desire by both the Portland Public School
District and the David Douglas School District to reinvest in local schools with new energy saving
measures, such as new windows and heating and cooling systems. There is also continued interest in
repositioning the former Marshall High School building/campus as a continuing community
education and business training or incubator facility.

City of Portland Bureau of Planning and Sustainability Portland Infrastructure Pilot Study
March 2011 page 17
www.fcsgroup.com FCS GROUP
Table 5. School Facility Assessment for Case Study Areas
Location/School Name Grades School District
Student
to
Teacher
Ratio
%
Deviation
From
District
Average*
Relative
Capacity
1. Outer Tabor Area
Harrison Park K to 8
Portland Public
Schools 15.2 -16%
Above
Average
Lent K to 8
Portland Public
Schools 16.3 -10%
Above
Average
Marysville @ Rose City
Park K to 8
Portland Public
Schools 15.5 -14%
Above
Average
Madison High School 8 to 12
Portland Public
Schools 15.2 -16%
Above
Average
Franklin High School 9 to 12
Portland Public
Schools 17.0 -6% Average
2. Lents Town Center
Kelly K to 5
Portland Public
Schools 15.0 -17%
Above
Average
Marysville @ Rose City
Park K to 8
Portland Public
Schools 15.5 -14%
Above
Average
Woodmere K to 5
Portland Public
Schools 17.1 -5% Average
Lane 6 to 8
Portland Public
Schools 12.7 -30%
Above
Average
Franklin 9 to 12
Portland Public
Schools 17.0 -6% Average
3. Powellhurst-Gilbert Area
Gilbert Park K to 5 David Douglas 19.0 5% Average
Earl Boyles K to 5 David Douglas 17.5 -3% Average
Gilbert Heights K to 5 David Douglas 20.0 11%
Below
Average
West Powellhurst K to 5 David Douglas 17.7 -2% Average
Mill Park K to 5 David Douglas 17.2 -4% Average
Ron Russell 6 to 8 David Douglas 16.6 -8% Average
Alice Ott 6 to 8 David Douglas 16.6 -8% Average
David Douglas 9 to 12 David Douglas 17.6 -2% Average
4. Outer Division Corridor
Mill Park K to 5 David Douglas 17.2 -4% Average
West Powellhurst K to 5 David Douglas 17.7 -2% Average
Cherry Park K to 5 David Douglas 15.8 -12%
Above
Average
Ron Russell 6 to 8 David Douglas 16.6 -8% Average
Floyd Light 6 to 8 David Douglas 15.8 -12%
Above
Average
David Douglas 9 to 12 David Douglas 17.6 -2% Average
Source: Oregon Department of Education; compiled by FCS GROUP, reflects 2009 school year.
* In comparison to the combined districts average of 17.8 students per teacher.
City of Portland Bureau of Planning and Sustainability Portland Infrastructure Pilot Study
March 2011 page 18
www.fcsgroup.com FCS GROUP
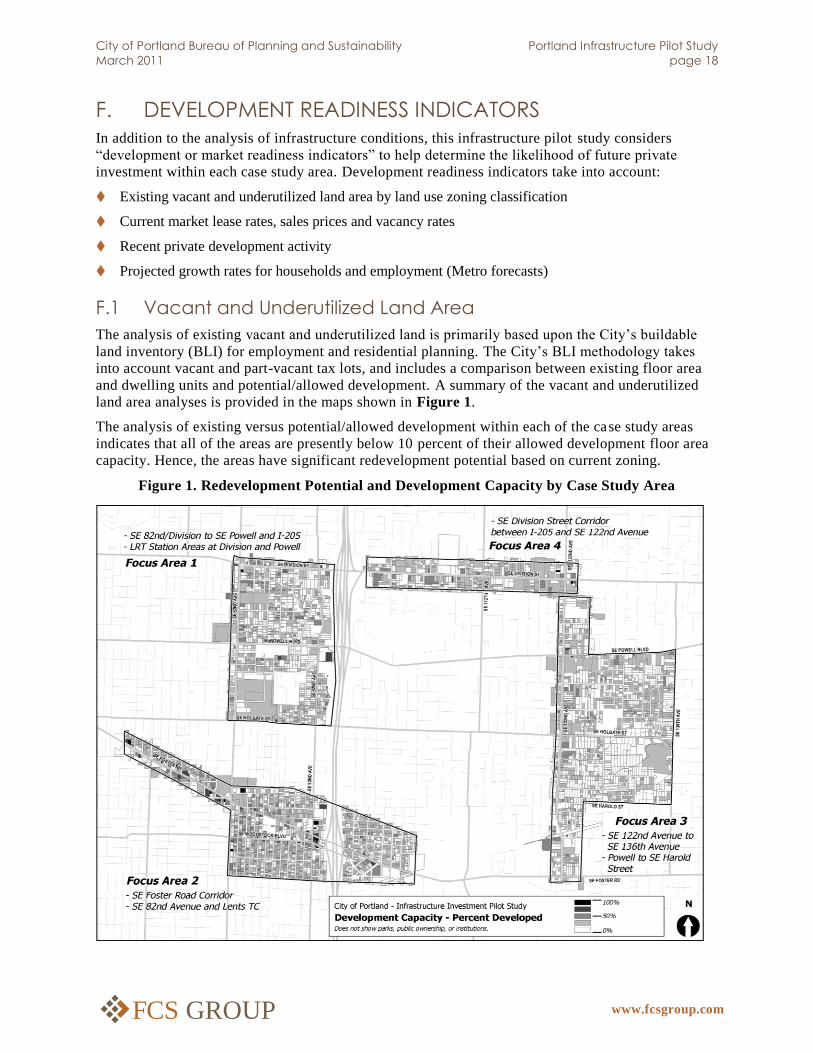
F. DEVELOPMENT READINESS INDICATORS
In addition to the analysis of infrastructure conditions, this infrastructure pilot study considers
―development or market readiness indicators‖ to help determine the likelihood of future private
investment within each case study area. Development readiness indicators take into account:
Existing vacant and underutilized land area by land use zoning classification
Current market lease rates, sales prices and vacancy rates
Recent private development activity
Projected growth rates for households and employment (Metro forecasts)
F.1 Vacant and Underutilized Land Area
The analysis of existing vacant and underutilized land is primarily based upon the City’s buildable
land inventory (BLI) for employment and residential planning. The City’s BLI methodology takes
into account vacant and part-vacant tax lots, and includes a comparison between existing floor area
and dwelling units and potential/allowed development. A summary of the vacant and underutilized
land area analyses is provided in the maps shown in Figure 1.
The analysis of existing versus potential/allowed development within each of the case study areas
indicates that all of the areas are presently below 10 percent of their allowed development floor area
capacity. Hence, the areas have significant redevelopment potential based on current zoning.
Figure 1. Redevelopment Potential and Development Capacity by Case Study Area

City of Portland Bureau of Planning and Sustainability Portland Infrastructure Pilot Study
March 2011 page 19
www.fcsgroup.com FCS GROUP
F.2 Land Use Patterns
The land use mix (as reflected by existing comprehensive plan land use designation) within the four
study areas is dominated by low density single family residential housing. As indicated in Figure 2,
multifamily accounts for about 11 to 14 percent of the total land area within the case study areas.
Combined single-family and multifamily land area accounts for between 51 percent and 84 percent of
the land area, as reflected in Table 10. Vacant land area only accounts for 5 percent to 8 percent of
the land area. Commercial is most prevalent within the Outer Tabor case study area, with significant
highway commercial and community shopping centers along SE 82nd
Avenue and along SE Division
Street.
Figure 2. Land Use Percent Distribution, Case Study Areas
Table 10. Land Use Percent Distribution, Case Study Areas
Land Use Type
Outer Tabor
Area
Lents Town
Center
Powellhurst-
Gilbert Area
Outer Division
Corridor
Commercial 33% 11% 5% 19%
Multifamily 13% 11% 13% 14%
Single Family 43% 56% 71% 37%
Industrial 0% 7% 1% 5%
Vacant 5% 6% 8% 5%
Other (parks, etc.) 6% 8% 2% 20%
Total 100% 100% 100% 100% Source: City of Portland; GIS analysis by Real Urban Geographics. Data reflects percent distribution of
2010 general land use classifications (acres).

City of Portland Bureau of Planning and Sustainability Portland Infrastructure Pilot Study
March 2011 page 20
www.fcsgroup.com FCS GROUP
F.3 Current Market Lease Rates and Sales Prices
The case study areas are generally reflected by two Southeast Portland housing submarkets that are
tracked by Zillow.com, including the Lents Town Center market area and the Powellhurst-Gilbert
submarket. As indicated in Table 6, these market areas each reported about 235 dwellings sold over
the past 12 months (as of December 15, 2010) with an average home sales price of about $145,000.
The average home sales price in these submarkets is $101 per square foot of building floor area for
the Lents Town Center area and $114 per square foot for the Powellhurst-Gilbert area. The achieved
average home sales prices in these market areas are currently about 30 to 40 percent below the
citywide average in Portland.
Table 6. Home Sales Statistics for Residential Market Areas
Lents Town
Center Area
Powellhurst-
Gilbert Area Portland
Homes Sold Year-to-Date* 234 235 6,424
Average Sale Price $143,914 $145,000 $282,100
Average Square Feet 1,422 1,272 1,741
Average Lot Size 5,942 5,870 N/A
Average Sales Price per Square Foot $101 $114 $162
Median Sales Price per Square Foot $106 $107 $162
* Reflects 12 months prior to December 15, 2010.
Compiled by FCS GROUP based on Zillow.com data.
In light of the fact that current development costs for basic new residential construction for wood
frame construction in Portland (excluding land cost) typically ranges from $90 to $125 per square
foot, the current achievable market sales prices for homes in the case study areas are generally below
what is needed to construct high quality new housing at this time. The market readiness for
residential construction appears to be relatively stronger in the Lents Town Center and Outer
Division Corridor Areas based on the current average home sales prices per square foot data
presented in Table 7.
Table 7. Home Sales Statistics for Case Study Areas
Average
Sales Price Building SF
Average
Sales Price
Per SF
Average
Lot Size
Year Built
(Avg.)
1. Outer Tabor Area $143,624 1,481 $103 6,392 1957
2. Lents Town Center $139,658 1,309 $111 4,502 1941
3. Powellhurst-Gilbert Area $154,589 1,438 $106 6,911 1979
4. Outer Division Corridor $200,375 1,792 $118 6,694 1973
Source: Analysis by FCS GROUP based on Zillow.com data, reflects year-to-data trends as of January 11,
2011.
The project team also evaluated commercial and industrial lease rates based on current COSTAR data
for each area. The results are based on the detailed building lease inventory provided in Appendix D.
Absorption estimates reflect the amount of business expansion or contraction that is taking place in
an area. A summary of findings is provided for each case study area in Table 8. The results indicate
that the current market for retail, office and industrial development in the broader Southeast Portland
market area is relatively strong with overall vacancy rates at 5.7 percent for retail, 8.2 percent for
office and 7.0 percent for industrial buildings. Overall net absorption in the broader Southeast

City of Portland Bureau of Planning and Sustainability Portland Infrastructure Pilot Study
March 2011 page 21
www.fcsgroup.com FCS GROUP
Portland market area for the year-to-date (as of 3rd
quarter 2010) reflects a positive absorption of
21,460 square feet for retail space, but a negative absorption of -20,119 square feet for office and -
34,145 square feet for industrial floor area.3
The vacancy rates were found to be much higher within the four case study areas than in the larger
Southeast Portland market area. Lease rates, with the exception of retail space in the Outer Tabor
Area, were much lower than the Southeast Portland average.
Hence, the market readiness indicators for commercial development appear to be relatively higher for
the Outer Tabor Area than the other areas.
F.4 Recent Private Development Activity
In light of the recent economic recession that began in December 2007, there has been little new
private investment within the four case study areas in recent years. However, significant public
investment by the PDC is beginning to leverage private business and development investment
activity within the Lents Town Center Urban Renewal Area. The Lents Town Center Urban Renewal
Area includes three of the four case study areas (Areas 1, 2 and 3). Selected accomplishments that
have occurred in this urban renewal area include:
Several completed streetscape, paving, and safety projects
Several parks upgrades, a new community garden, and the Zenger Farm renovation
Establishment of the Lents Tech Center at Marshall High School
MAX light rail station area facilities and access enhancements
Provision of about 115 storefront grants
Provision of about 37 business loans
Development of the ROSE multi-family housing project (24 affordable dwellings with onsite
daycare)
Days Theater Project (public/private development underway focused on key sites, storefronts, and
buildings including the former Days Theater along Foster Road in the Lents Town Center)
Redevelopment at SE 92nd
and Harold (public/private mixed-use residential and commercial
redevelopment underway in Lents Town Center)
The Southeast Market Region is defined by Co-Star primarily includes: Mall 205, SE Close-In, and
Clackamas/Milwaukie areas.

City of Portland Bureau of Planning and Sustainability Portland Infrastructure Pilot Study
March 2011 page 22
www.fcsgroup.com FCS GROUP
Table 8. Retail, Office and Industrial Statistics by Case Study Area
Buildings
Listed
Rentable
Building
Area (SF) Vacant SF
Vacancy
Rate
Net
Absorption
(year to
date)
Median
Rent
(asking)
1. Outer Tabor Area
Retail 11 196,879 68,908 35% - $26
Office 2 6,392 3,196 50% - $10.70
Industrial - - - - - -
2. Lents Town Center
Retail 8 163,701 109,680 67% - $14
Office 1 10,049 10,049 100% - $9.80
Industrial 1 5,000 -- -- - $10.80
3. Powellhurst-Gilbert Area
Retail 4 214,661 32,199 15% - $12
Office - - - - - -
Industrial - - - - - -
4. Outer Division Corridor
Retail - - - - - -
Office 5 76,774 18,272 23.80% - $9
Industrial - - - - - -
Southeast Market Region*
Retail 1,961 19,783,892 19,783,892 5.70% 21,460 $15.83
Office 751 7,115,843 581,721 8.20% -20,119 $17.46
Industrial 1,186 29,672,411 2,084,795 7% -34,145 $5.14
Source: Capacity Commercial Group and CoStar, 3rd Quarter 2010. Note, the Southeast Market Region
is defined by Co-Star primarily includes: Mall 205, SE Close-In, and Clackamas/Milwaukie areas.
F.5 Demographic and Socioeconomic Overview
Demographic findings indicate that there is a relatively high (above average) home ownership within
all of the case study areas, with the exception of the Outer Tabor area, where home ownership is
below the citywide average. As indicated in Table 9. Median household income levels were
significantly below the citywide average in all of the case study areas based on 2000 Census data.
Low income levels persist today in the case study areas, but new mixed-income housing
developments are underway to help attract new mixed-income residents into the Lents Town Center
Urban Renewal area.
Table 9. Resident Tenancy, Vacancy and Income, Case Study Areas
Dwelling Unit/
Tenancy Distribution
Outer Tabor
Area
Lents Town
Center
Powellhurst-
Gilbert Area
Outer Division
Corridor
Portland City
Avg.
Vacant Units 5% 5% 6% 7% 6%
Owner Occupied 49% 57% 54% 55% 53%
Renter Occupied 46% 38% 40% 39% 42%
Total 100% 100% 100% 100% 100%
Median HH Income $ 34,099 $ 36,275 $ 33,908 $ 34,794 $ 40,146
Source: US Census data (2000); reflects median household income levels in 1999 dollars.
City of Portland Bureau of Planning and Sustainability Portland Infrastructure Pilot Study
March 2011 page 23
www.fcsgroup.com FCS GROUP
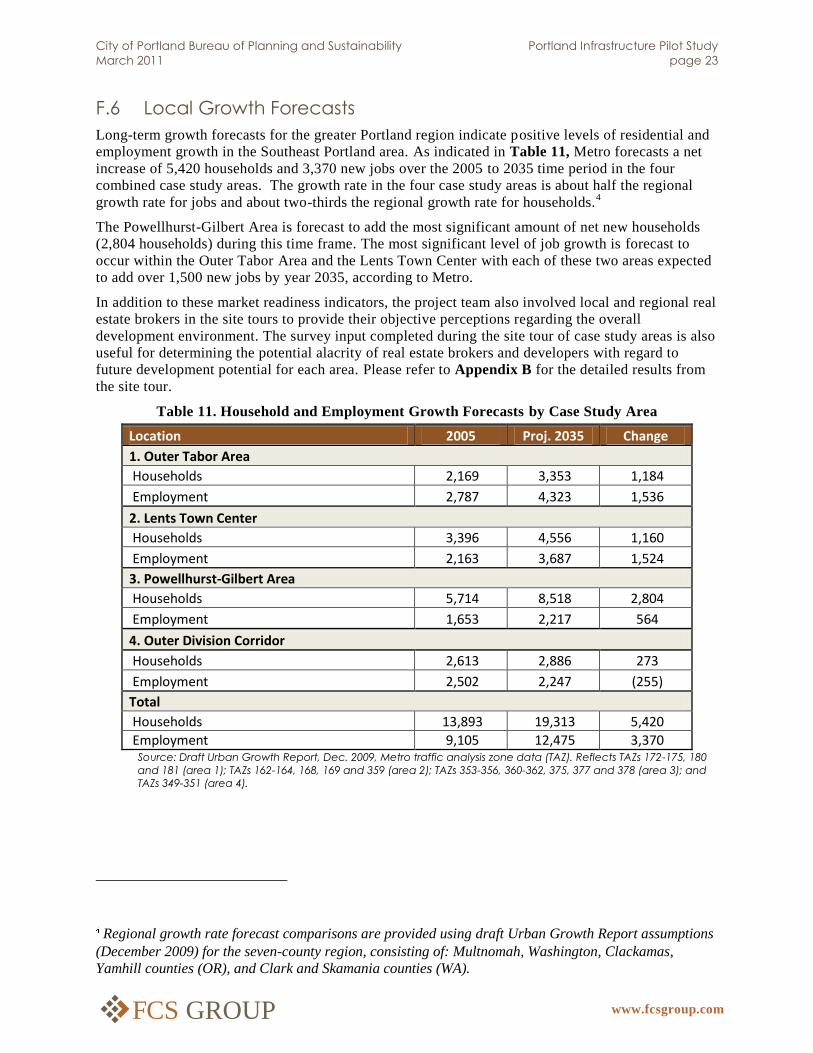
F.6 Local Growth Forecasts
Long-term growth forecasts for the greater Portland region indicate positive levels of residential and
employment growth in the Southeast Portland area. As indicated in Table 11, Metro forecasts a net
increase of 5,420 households and 3,370 new jobs over the 2005 to 2035 time period in the four
combined case study areas. The growth rate in the four case study areas is about half the regional
growth rate for jobs and about two-thirds the regional growth rate for households.4
The Powellhurst-Gilbert Area is forecast to add the most significant amount of net new households
(2,804 households) during this time frame. The most significant level of job growth is forecast to
occur within the Outer Tabor Area and the Lents Town Center with each of these two areas expected
to add over 1,500 new jobs by year 2035, according to Metro.
In addition to these market readiness indicators, the project team also involved local and regional real
estate brokers in the site tours to provide their objective perceptions regarding the overall
development environment. The survey input completed during the site tour of case study areas is also
useful for determining the potential alacrity of real estate brokers and developers with regard to
future development potential for each area. Please refer to Appendix B for the detailed results from
the site tour.
Table 11. Household and Employment Growth Forecasts by Case Study Area
Location 2005 Proj. 2035 Change
1. Outer Tabor Area
Households 2,169 3,353 1,184
Employment 2,787 4,323 1,536
2. Lents Town Center
Households 3,396 4,556 1,160
Employment 2,163 3,687 1,524
3. Powellhurst-Gilbert Area
Households 5,714 8,518 2,804
Employment 1,653 2,217 564
4. Outer Division Corridor
Households 2,613 2,886 273
Employment 2,502 2,247 (255)
Total
Households 13,893 19,313 5,420
Employment 9,105 12,475 3,370 Source: Draft Urban Growth Report, Dec. 2009, Metro traffic analysis zone data (TAZ). Reflects TAZs 172-175, 180
and 181 (area 1); TAZs 162-164, 168, 169 and 359 (area 2); TAZs 353-356, 360-362, 375, 377 and 378 (area 3); and
TAZs 349-351 (area 4).
Regional growth rate forecast comparisons are provided using draft Urban Growth Report assumptions
(December 2009) for the seven-county region, consisting of: Multnomah, Washington, Clackamas,
Yamhill counties (OR), and Clark and Skamania counties (WA).

City of Portland Bureau of Planning and Sustainability Portland Infrastructure Pilot Study
March 2011 page 1
www.fcsgroup.com FCS GROUP
Population (Metro est. for 2005) 5,242
Jobs (Census est. for 2007) 3,952
Miles from downtown Portland 6
Median home value (Zillow est. Dec. 2010) $143,914
Land area (in acres) 299
Outer Tabor Area at a Glance
SECTION III: AREA ASSESSMENTS
After compiling and evaluating the data described in Section II, the project team prepared
assessments for each case study area to document their strengths, weaknesses, opportunities and
threats (SWOT analysis). The analysis of existing infrastructure conditions also resulted in an
―infrastructure report card‖ for each area. Next, listings of the long term planned infrastructure
improvements were compiled (from background studies and plans) to determine if there are potential
public facility ―gaps‖ or needs for the areas. Appendix E provides a more detailed description of the
metrics used for the grading systems. Please refer to separate area brochures for more detailed
information for each case study area.
A. OUTER TABOR AREA
The Outer Tabor Area includes the portion of the
Tabor Neighborhood located west of I-205 between
SE Division Street and SE Holgate Street and
between SE 82nd
Avenue and I-205 (SE 92nd
Avenue). The Outer Tabor Area is shown in
Figure 3.
Figure 3. Outer Tabor Area (looking north)

City of Portland Bureau of Planning and Sustainability Portland Infrastructure Pilot Study
March 2011 page 2
www.fcsgroup.com FCS GROUP
Source: Google Maps.
A.1 SWOT Analysis
The findings from the SWOT analysis for the Outer Tabor area are provided in Table 12. This area
was found to have several strengths and opportunities that could outweigh local weaknesses over
time. Potential public infrastructure investment that helps remove the ―threats‖ in the area, such as
the need to address high-accident locations and need to provide alternative mode pedestrian and
bicycle facilities (to address the current weaknesses and threats caused by auto orientation), could
make this a more attractive location to live and work.
As part of the Lents Town Center Urban Renewal Area, there is the opportunity to leverage tax
increment financing (TIF) for public facilities, such as intersection crossing and pedestrian
improvements. The potential reuse of Marshall High School campus presents an exciting new
opportunity to address small business job creation and work force training, and could help fill the
need for additional indoor recreation and community meeting facilities that enhance ―social
infrastructure.‖
Table 12. Outer Tabor Area SWOT Analysis
STRENGTHS WEAKNESSES
Established neighborhoods Low land use Intensity
MAX Greenline Station (Powell & Holgate) Inadequate pedestrian environment
Frequent bus transit (3 bus routes) Incomplete local street network
I-205 freeway access Lack of neighborhood commercial
Portland Community College proximity Low attainable home sales prices
Favorable student-teacher ratios in PPS Lack of indoor recreation facilities
Seven nearby parks
Community shopping centers (2)
Diverse small businesses in area
Dozens of large national chain stores
OPPORTUNITIES THREATS
Well organized business groups Deferred maintenance on some properties
Well organized neighborhood groups Automobile domination
Urban Renewal District High retail vacancy rates
8 storefront grants awarded (TIF & Non-TIF) High accident intersections (2)
1 business loan (Non TIF) Negative office & industrial absorption
Infill & redevelopment potential
Recent planning around MAX station
Lents Park Master Plan
Recent public streetscape investments
Potential reuse of Marshall High School
High commercial lease rates in the area
Positive housing sales absorption
Cultural and ethnic social diversity

City of Portland Bureau of Planning and Sustainability Portland Infrastructure Pilot Study
March 2011 page 3
www.fcsgroup.com FCS GROUP
A.2 Development Readiness Report Card
The project team compiled a ―development readiness report card‖ for each case study area taking into
account the existing market conditions, trends and development indicators, such as amount of
absorption, attainable sales/lease rates, vacancy rates, and amount of private development completed
or underway. Information from the interviews and case study tours (with broker input) was
considered along with the data presented in Section II.
The results of the development readiness report card for the Outer Tabor Area are provided in Table
13 and indicate favorable grades for: residential absorption trends, business mix, non-residential
lease/vacancy rates, public investment activity, and residential and employment growth forecasts
(grades of B or better).
Average grades are given for non-residential (commercial and office) absorption trends, private
investment activity and vacant land/redevelopment areas.
Below average grades are given for: housing mix/diversity, and attainable residential sales/lease
rates.
Overall grade: C+
Table 13. Outer Tabor Area Development Readiness Report Card
Infrastructure Grade Notes
Housing Mix/Diversity C Limited housing options near transit areas
Residential Absorption
Trends C+ The local area continues to attract homebuyers
Residential Attainable
Sales/Lease & Vacancy
Rates
D+ Home prices are very low, making new
construction less feasible
Residential Growth
Forecast C
Expected to add over 1,180 dwellings over 20
years
Business Mix B There are several local and national “corporate
chain store” businesses
Non-Residential Absorption
Trends C-
Positive retail absorption but negative office
absorption levels
Non-Residential Attainable
Lease & Vacancy Rates B-
Relatively high commercial lease rates and
average office lease rates, but high vacancy rates
Employment Growth
Forecast B Forecast to add about 1,540 jobs over 20 years
Public Investment Activity A- Recent investment in MAX Greenline by TriMet and
Urban Renewal Area initiatives by PDC
Private Investment Activity C-
Not much private housing or commercial
development activity since 2007, except for retail
centers
Vacant Land &
Redevelopment Sites C+
Opportunities exist with Marshall High School
property and near MAX Station
Overall Grade C+
Source: analysis by FCS GROUP.
A.3 Infrastructure Report Card
The project team compiled an overview of infrastructure conditions for the Outer Tabor Area, using a
combination of qualitative and quantitative information that was described in Section II. A summary

City of Portland Bureau of Planning and Sustainability Portland Infrastructure Pilot Study
March 2011 page 4
www.fcsgroup.com FCS GROUP
of selected infrastructure conditions can be compared with regional or national standards to derive an
―infrastructure report card‖ which is based in-part on the methods advocated by the American
Council of Engineering Companies (ACEC) of Oregon (see Appendix E).
The results of the infrastructure report card for the Outer Tabor Area are summarized in Table 14.
The results include favorable grades for transit, roads, water, sewer, stormwater, parks, and public
schools (grades of B or better).
Average grades are given for bicycle network, pedestrian network, and community centers.
No below average grades were given.
Overall infrastructure grade: B-
Table 14. Outer Tabor Area Infrastructure Report Card
Infrastructure Facility Grade Notes
Transit B
Served by MAX Green line at Powell & Holgate
Station. Bus service provided along 82nd Avenue,
Holgate Boulevard and Powell Boulevard
Roads B-
East-west access along Powell Boulevard is near
capacity during peak travel times. One high
automobile collision intersection exists at 92nd and
Powell and an area of SE 82nd Ave. does have a
high rate of pedestrian collisions. Several local
streets are substandard and unpaved.
Bicycle: On Street C Bicycle facilities are in fair condition on major
roads
Pedestrian C- Sidewalks are in fair condition, but missing along
key routes to MAX station and schools.
Water B No constraints identified
Sanitary Sewer B No constraints indentified
Stormwater B- Some standing water along substandard streets
Parks A- Good proximity to local and regional parks and
trails
Community Centers C- Indoor library and community facilities are
needed
Public Schools (Capacity) B Favorable student-teacher ratios
Overall Grade B-
Source: FCS GROUP and Harper Houf Peterson Righellis.
A.4 Planned Infrastructure Improvements
Local agencies have already identified several important infrastructure project improvements as part
of capital facility plans. As indicated in Table 15, the current identified list of project improvements
in the Outer Tabor Area include a mix of pedestrian, bicycle, transit, roadway and parks facility
improvements. These projects are anticipated to be completed by year 2035. Total known costs for
these projects are estimated to exceed $25 million, with the Bus Rapid Transit project accounting for
the majority of the estimated costs.
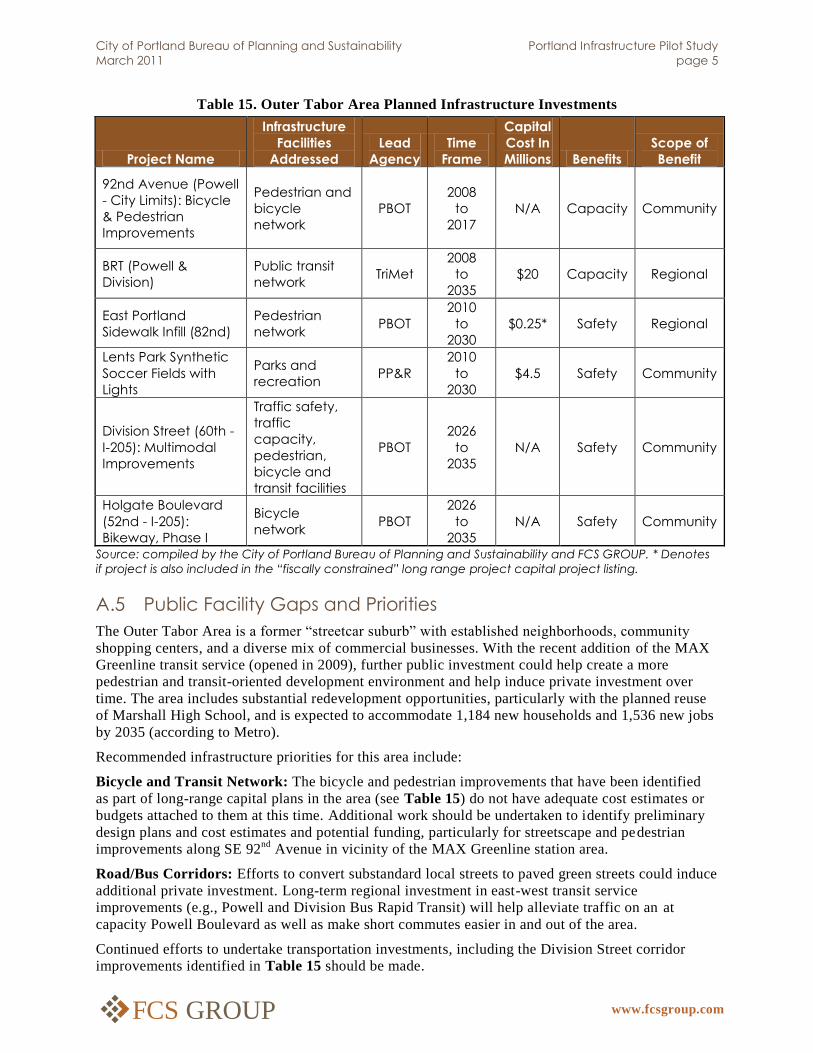
City of Portland Bureau of Planning and Sustainability Portland Infrastructure Pilot Study
March 2011 page 5
www.fcsgroup.com FCS GROUP
Table 15. Outer Tabor Area Planned Infrastructure Investments
Project Name
Infrastructure
Facilities
Addressed
Lead
Agency
Time
Frame
Capital
Cost In
Millions Benefits
Scope of
Benefit
92nd Avenue (Powell
- City Limits): Bicycle
& Pedestrian
Improvements
Pedestrian and
bicycle
network
PBOT
2008
to
2017
N/A Capacity Community
BRT (Powell &
Division)
Public transit
network TriMet
2008
to
2035
$20 Capacity Regional
East Portland
Sidewalk Infill (82nd)
Pedestrian
network PBOT
2010
to
2030
$0.25* Safety Regional
Lents Park Synthetic
Soccer Fields with
Lights
Parks and
recreation PP&R
2010
to
2030
$4.5 Safety Community
Division Street (60th -
I-205): Multimodal
Improvements
Traffic safety,
traffic
capacity,
pedestrian,
bicycle and
transit facilities
PBOT
2026
to
2035
N/A Safety Community
Holgate Boulevard
(52nd - I-205):
Bikeway, Phase I
Bicycle
network PBOT
2026
to
2035
N/A Safety Community
Source: compiled by the City of Portland Bureau of Planning and Sustainability and FCS GROUP. * Denotes
if project is also included in the “fiscally constrained” long range project capital project listing.
A.5 Public Facility Gaps and Priorities
The Outer Tabor Area is a former ―streetcar suburb‖ with established neighborhoods, community
shopping centers, and a diverse mix of commercial businesses. With the recent addition of the MAX
Greenline transit service (opened in 2009), further public investment could help create a more
pedestrian and transit-oriented development environment and help induce private investment over
time. The area includes substantial redevelopment opportunities, particularly with the planned reuse
of Marshall High School, and is expected to accommodate 1,184 new households and 1,536 new jobs
by 2035 (according to Metro).
Recommended infrastructure priorities for this area include:
Bicycle and Transit Network: The bicycle and pedestrian improvements that have been identified
as part of long-range capital plans in the area (see Table 15) do not have adequate cost estimates or
budgets attached to them at this time. Additional work should be undertaken to identify preliminary
design plans and cost estimates and potential funding, particularly for streetscape and pedestrian
improvements along SE 92nd
Avenue in vicinity of the MAX Greenline station area.
Road/Bus Corridors: Efforts to convert substandard local streets to paved green streets could induce
additional private investment. Long-term regional investment in east-west transit service
improvements (e.g., Powell and Division Bus Rapid Transit) will help alleviate traffic on an at
capacity Powell Boulevard as well as make short commutes easier in and out of the area.
Continued efforts to undertake transportation investments, including the Division Street corridor
improvements identified in Table 15 should be made.

City of Portland Bureau of Planning and Sustainability Portland Infrastructure Pilot Study
March 2011 page 6
www.fcsgroup.com FCS GROUP
Population (Metro est. for 2005) 8,979
Jobs (Census est. for 2007) 2,479
Miles from downtown Portland 6.5
Median home value (Zillow est. Dec. 2010) $146,000
Land area (in acres) 291
Lents Town Center Area at a Glance
Additional public investment in the Lents Tech Center at Marshall High School could help serve as a
local business incubator for the city and help stimulate job growth in the area. PDC should work with
the city and local stakeholders to make the Marshall High School campus a focal point for the
community to help foster greater civic involvement and provide missing indoor community
recreation and meeting facilities. The fact that current land/home values are well below the city
average means that there is significant upside for future residents and businesses.
B. LENTS TOWN CENTER
The Lents Town Center/SE Foster Corridor
Area includes the Town Center core area (Lents
Park to the north and SE Duke Street to the
south) and extends along Foster Road from
about SE Holgate (to the west) to SE 104th
Avenue (to the east). Please refer to Figure 4.
Figure 4. Lents Town Center Area (looking north)
Source: Google Maps.
B.1 SWOT Analysis
The SWOT Analysis for the Lents Town Center area is provided in Table 16. Similar to the Outer
Tabor Area, the Lents Town Center Area was found to have several strengths and opportunities that
could outweigh local weaknesses overtime. Recent and ongoing public investment is helping to
address the ―weaknesses‖ and ―threats‖ in the area, such as the need to address high-accident
locations and provide alternative mode pedestrian and bicycle facilities.
The Lents Town Center Urban Renewal Area has created the opportunity to leverage tax increment
financing (TIF) for investment in public facilities, public/private mixed-use developments, and local
business/storefront improvements.

City of Portland Bureau of Planning and Sustainability Portland Infrastructure Pilot Study
March 2011 page 7
www.fcsgroup.com FCS GROUP
Table 16. Lents Town Center Area SWOT Analysis
STRENGTHS WEAKNESSES
Established neighborhoods Low land use Intensity
MAX Greenline station (Lents Town Center Station) Inadequate pedestrian environment
Good bus transit (4 bus routes) Incomplete local street network
Five nearby parks Lack of neighborhood commercial
Springwater Corridor trail nearby Low attainable home sales prices
Boys & Girls Club community center Lack of neighborhood library
I-205 freeway access
Streetcar Era street grid
Favorable student-teacher ratios
Unique "historic" buildings in town center
Diverse mix of small businesses
OPPORTUNITIES THREATS
Well organized business groups Deferred maintenance on some properties
Well organized neighborhood groups Automobile domination
Urban Renewal District High retail vacancy rates
40 storefront grants awarded High accident intersections (2)
14 business loans Negative office & industrial absorption
Underutilized industrial land near Johnson Ck. High perceived crime rates
Recent planning in Town Center
Lents Park Master Plan
Recent public streetscape investments
Positive housing sales absorption
25 storefront grants awarded by PDC
Cultural and ethnic social diversity
Positive housing sales absorption
Streetcar planning study underway
B.2 Development Readiness Report Card
The ―development readiness report card‖ takes into account the existing market conditions, trends
and development indicators, such as amount of absorption, attainable sales/lease rates, vacancy rates,
and amount of private development completed or underway. Information from the interviews and
case study tours (with broker input) was considered along with the data presented in Section II.
The results of the development readiness report card for the Lents Town Center Area are provided in
Table 17 and indicate favorable grades for: residential and employment growth forecasts, public
investment activity, and vacant land/redevelopment sites (grades of B or better).
Average grades are given for residential and non-residential (commercial and office) absorption
trends, attainable lease/sales prices, business mix, and private investment activity.
No below average grades are given.
Overall grade: C+

City of Portland Bureau of Planning and Sustainability Portland Infrastructure Pilot Study
March 2011 page 8
www.fcsgroup.com FCS GROUP
Table 17. Lents Town Center Area Development Readiness Report Card
Infrastructure Facility Grade Notes
Housing Mix/Diversity C+ PDC is working with developers to create new
mixed-income housing developments
Residential Absorption
Trends C+ Area continues to attract homebuyers
Residential Attainable
Sales/Lease & Vacancy
Rates
C+
Home prices and attainable rent levels are
beginning to increase relative to other areas in SE
Portland
Residential Growth
Forecast C
Expected to add over 1,160 dwellings over 20
years
Business Mix C- There are unique local owned businesses but not
much neighborhood retail development yet
Non-Residential Absorption
Trends C-
Positive retail absorption but negative office and
industrial absorption, and very high vacancy rates
Non-Residential Attainable
Lease & Vacancy Rates C+
Relatively low commercial & office but relatively
high industrial lease rates
Employment Growth
Forecast B Forecast to add about 1,524 jobs over 20 years
Public Investment Activity A Recent investment in MAX Greenline by TriMet and
Urban Renewal Area initiatives by PDC
Private Investment Activity C+
Recent housing & commercial investment and
business lending as part of public/private
development strategy
Vacant Land &
Redevelopment Sites B
Opportunities exist with PDC as part of Days
Theater project and 92nd/Harold project and in
underutilized Johnson Creek industrial area
Overall Grade C+
Source: Analysis by FCS GROUP.
B.3 Infrastructure Report Card
The project team compiled an overview of infrastructure conditions for the Lents Town Center Area
using a combination of qualitative and quantitative information that was described in Section II.
Results of the infrastructure report card for the Lents Town Center Area are provided in Table 18.
Favorable grades are given for: transit, roads, water, sewer, parks, community centers, and public
schools (grades of B or better).
Average grades are given for bicycle network, pedestrian network, and stormwater facilities.
No below average grades were given.
Overall infrastructure grade: B
B.4 Planned Infrastructure Improvements
As indicated in Table 19, the current identified list of project improvements in the Lents Town
Center Area includes a mix of pedestrian, bicycle, transit, roadway, and stormwater improvements.
These projects are anticipated to be completed by year 2035. Total known costs for these projects are
estimated to exceed $145 million, with the bicycle/pedestrian network improvements and Johnson
Creek restoration improvements the highest cost items.
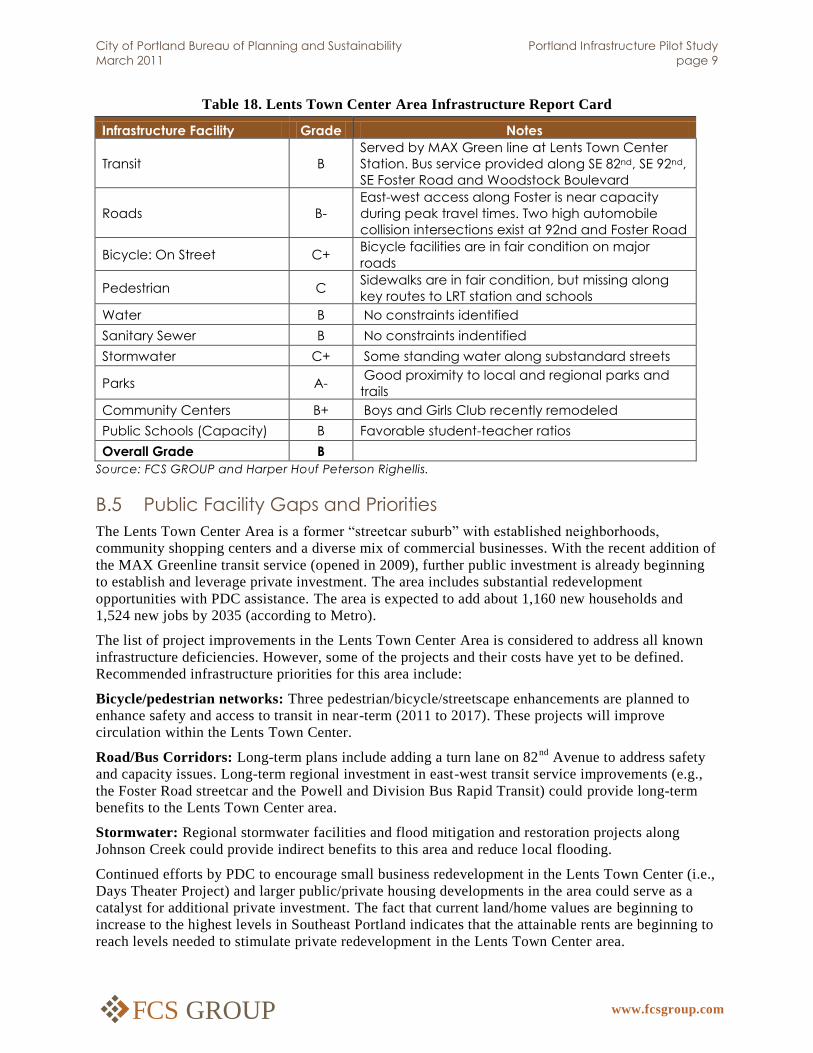
City of Portland Bureau of Planning and Sustainability Portland Infrastructure Pilot Study
March 2011 page 9
www.fcsgroup.com FCS GROUP
Table 18. Lents Town Center Area Infrastructure Report Card
Infrastructure Facility Grade Notes
Transit B
Served by MAX Green line at Lents Town Center
Station. Bus service provided along SE 82nd, SE 92nd,
SE Foster Road and Woodstock Boulevard
Roads B-
East-west access along Foster is near capacity
during peak travel times. Two high automobile
collision intersections exist at 92nd and Foster Road
Bicycle: On Street C+ Bicycle facilities are in fair condition on major
roads
Pedestrian C Sidewalks are in fair condition, but missing along
key routes to LRT station and schools
Water B No constraints identified
Sanitary Sewer B No constraints indentified
Stormwater C+ Some standing water along substandard streets
Parks A- Good proximity to local and regional parks and
trails
Community Centers B+ Boys and Girls Club recently remodeled
Public Schools (Capacity) B Favorable student-teacher ratios
Overall Grade B
Source: FCS GROUP and Harper Houf Peterson Righellis.
B.5 Public Facility Gaps and Priorities
The Lents Town Center Area is a former ―streetcar suburb‖ with established neighborhoods,
community shopping centers and a diverse mix of commercial businesses. With the recent addition of
the MAX Greenline transit service (opened in 2009), further public investment is already beginning
to establish and leverage private investment. The area includes substantial redevelopment
opportunities with PDC assistance. The area is expected to add about 1,160 new households and
1,524 new jobs by 2035 (according to Metro).
The list of project improvements in the Lents Town Center Area is considered to address all known
infrastructure deficiencies. However, some of the projects and their costs have yet to be defined.
Recommended infrastructure priorities for this area include:
Bicycle/pedestrian networks: Three pedestrian/bicycle/streetscape enhancements are planned to
enhance safety and access to transit in near-term (2011 to 2017). These projects will improve
circulation within the Lents Town Center.
Road/Bus Corridors: Long-term plans include adding a turn lane on 82nd
Avenue to address safety
and capacity issues. Long-term regional investment in east-west transit service improvements (e.g.,
the Foster Road streetcar and the Powell and Division Bus Rapid Transit) could provide long-term
benefits to the Lents Town Center area.
Stormwater: Regional stormwater facilities and flood mitigation and restoration projects along
Johnson Creek could provide indirect benefits to this area and reduce local flooding.
Continued efforts by PDC to encourage small business redevelopment in the Lents Town Center (i.e.,
Days Theater Project) and larger public/private housing developments in the area could serve as a
catalyst for additional private investment. The fact that current land/home values are beginning to
increase to the highest levels in Southeast Portland indicates that the attainable rents are beginning to
reach levels needed to stimulate private redevelopment in the Lents Town Center area.
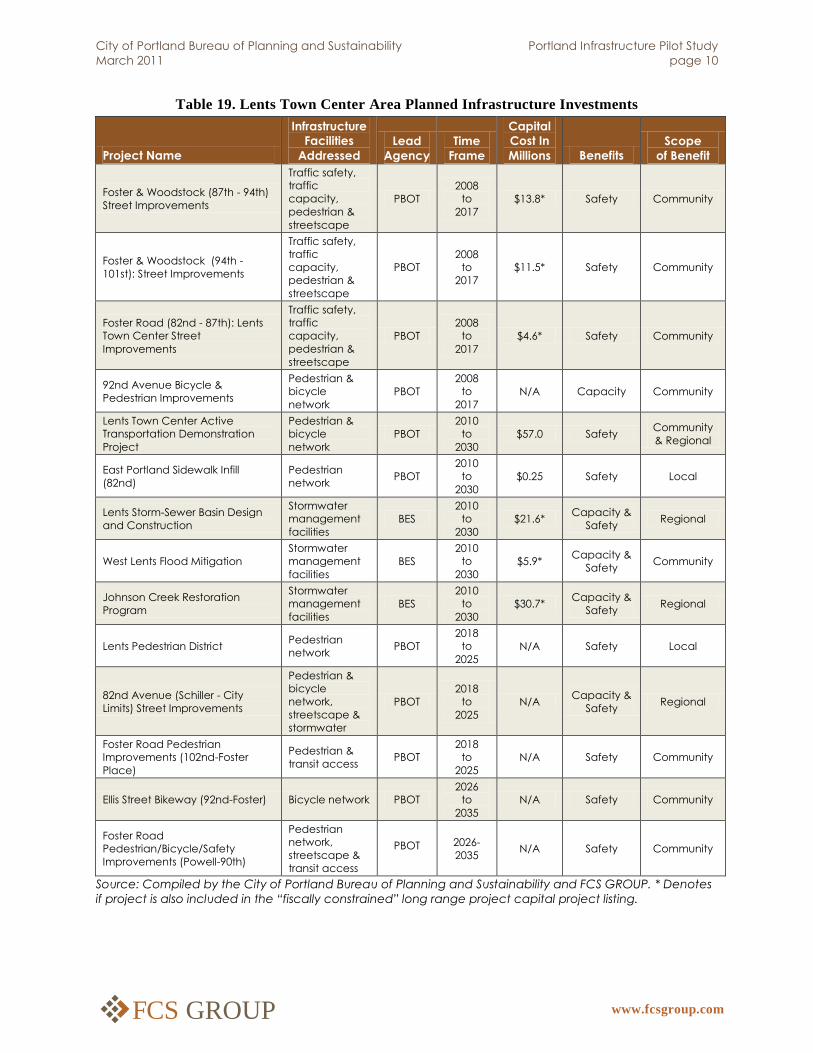
City of Portland Bureau of Planning and Sustainability Portland Infrastructure Pilot Study
March 2011 page 10
www.fcsgroup.com FCS GROUP
Table 19. Lents Town Center Area Planned Infrastructure Investments
Project Name
Infrastructure
Facilities
Addressed
Lead
Agency
Time
Frame
Capital
Cost In
Millions Benefits
Scope
of Benefit
Foster & Woodstock (87th - 94th)
Street Improvements
Traffic safety,
traffic
capacity,
pedestrian &
streetscape
PBOT
2008
to
2017
$13.8* Safety Community
Foster & Woodstock (94th -
101st): Street Improvements
Traffic safety,
traffic
capacity,
pedestrian &
streetscape
PBOT
2008
to
2017
$11.5* Safety Community
Foster Road (82nd - 87th): Lents
Town Center Street
Improvements
Traffic safety,
traffic
capacity,
pedestrian &
streetscape
PBOT
2008
to
2017
$4.6* Safety Community
92nd Avenue Bicycle &
Pedestrian Improvements
Pedestrian &
bicycle
network
PBOT
2008
to
2017
N/A Capacity Community
Lents Town Center Active
Transportation Demonstration
Project
Pedestrian &
bicycle
network
PBOT
2010
to
2030
$57.0 Safety Community
& Regional
East Portland Sidewalk Infill
(82nd)
Pedestrian
network PBOT
2010
to
2030
$0.25 Safety Local
Lents Storm-Sewer Basin Design
and Construction
Stormwater
management
facilities
BES
2010
to
2030
$21.6* Capacity &
Safety Regional
West Lents Flood Mitigation
Stormwater
management
facilities
BES
2010
to
2030
$5.9* Capacity &
Safety Community
Johnson Creek Restoration
Program
Stormwater
management
facilities
BES
2010
to
2030
$30.7* Capacity &
Safety Regional
Lents Pedestrian District Pedestrian
network PBOT
2018
to
2025
N/A Safety Local
82nd Avenue (Schiller - City
Limits) Street Improvements
Pedestrian &
bicycle
network,
streetscape &
stormwater
PBOT
2018
to
2025
N/A Capacity &
Safety Regional
Foster Road Pedestrian
Improvements (102nd-Foster
Place)
Pedestrian &
transit access PBOT
2018
to
2025
N/A Safety Community
Ellis Street Bikeway (92nd-Foster) Bicycle network PBOT
2026
to
2035
N/A Safety Community
Foster Road
Pedestrian/Bicycle/Safety
Improvements (Powell-90th)
Pedestrian
network,
streetscape &
transit access
PBOT 2026-
2035 N/A Safety Community
Source: Compiled by the City of Portland Bureau of Planning and Sustainability and FCS GROUP. * Denotes
if project is also included in the “fiscally constrained” long range project capital project listing.
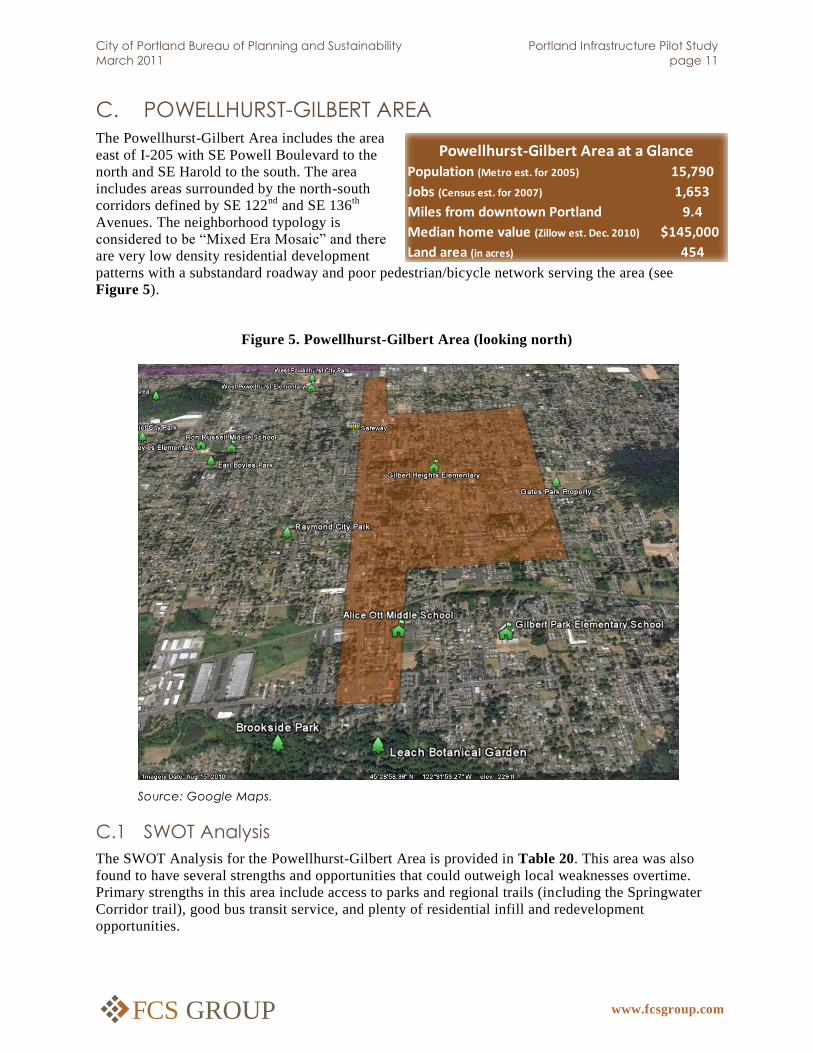
City of Portland Bureau of Planning and Sustainability Portland Infrastructure Pilot Study
March 2011 page 11
www.fcsgroup.com FCS GROUP
Population (Metro est. for 2005) 15,790
Jobs (Census est. for 2007) 1,653
Miles from downtown Portland 9.4
Median home value (Zillow est. Dec. 2010) $145,000
Land area (in acres) 454
Powellhurst-Gilbert Area at a Glance
C. POWELLHURST-GILBERT AREA
The Powellhurst-Gilbert Area includes the area
east of I-205 with SE Powell Boulevard to the
north and SE Harold to the south. The area
includes areas surrounded by the north-south
corridors defined by SE 122nd
and SE 136th
Avenues. The neighborhood typology is
considered to be ―Mixed Era Mosaic‖ and there
are very low density residential development
patterns with a substandard roadway and poor pedestrian/bicycle network serving the area (see
Figure 5).
Figure 5. Powellhurst-Gilbert Area (looking north)
Source: Google Maps.
C.1 SWOT Analysis
The SWOT Analysis for the Powellhurst-Gilbert Area is provided in Table 20. This area was also
found to have several strengths and opportunities that could outweigh local weaknesses overtime.
Primary strengths in this area include access to parks and regional trails (including the Springwater
Corridor trail), good bus transit service, and plenty of residential infill and redevelopment
opportunities.

City of Portland Bureau of Planning and Sustainability Portland Infrastructure Pilot Study
March 2011 page 12
www.fcsgroup.com FCS GROUP
In light of the fact that this area is located within the Lents Town Center Urban Renewal Area, there
is the long-term benefit of providing TIF for investment in public facilities, public/private mixed-use
developments, and local business/storefront improvements.
Table 20. Powellhurst-Gilbert Area SWOT Analysis
STRENGTHS WEAKNESSES
Established neighborhoods Low land use Intensity
Good bus transit service (4 bus routes) Inhospitable pedestrian environment
Recent infill housing developments Incomplete local street network
Established community shopping center Lack of neighborhood commercial
Five nearby parks Low attainable home sales prices
Springwater Corridor trail nearby Lack of indoor recreation & library facilities
Favorable student-teacher ratios
I-205 freeway access & nearby MAX service
Large vacant and part vacant lots
OPPORTUNITIES THREATS
Urban Renewal District (south of Powell Blvd.) Localized flooding around Johnson Creek
6 storefront grants awarded Automobile domination
1 business loans High office vacancy rates
Recent park & streetscape investments High accident intersection at Division & SE 122nd
Vacant land, infill & redevelopment potential Negative office & industrial absorption
Streetcar planning study underway High percent of very low income residents
Positive housing sales absorption
Johnson Creek could become attractive
amenity
High capacity transit planning for Division
underway
C.2 Development Readiness Report Card
The ―development readiness report card‖ takes into account the existing market conditions, trends
and development indicators, such as amount of absorption, attainable sales/lease rates, vacancy rates,
and amount of private development completed or underway. Information from the interviews and
case study tours (with broker input) was considered along with the data presented in Section II.
The results of the development readiness report card for the Powellhurst-Gilbert Area are provided in
Table 21 and indicate favorable grades for residential growth forecasts (B or better)
Average grades are given for residential and non-residential (commercial and office) absorption
trends, attainable lease/sales prices, employment growth forecast, and public and private investment
activity.
Below average grades are given for housing mix/diversity and business mix.
Overall grade: C-
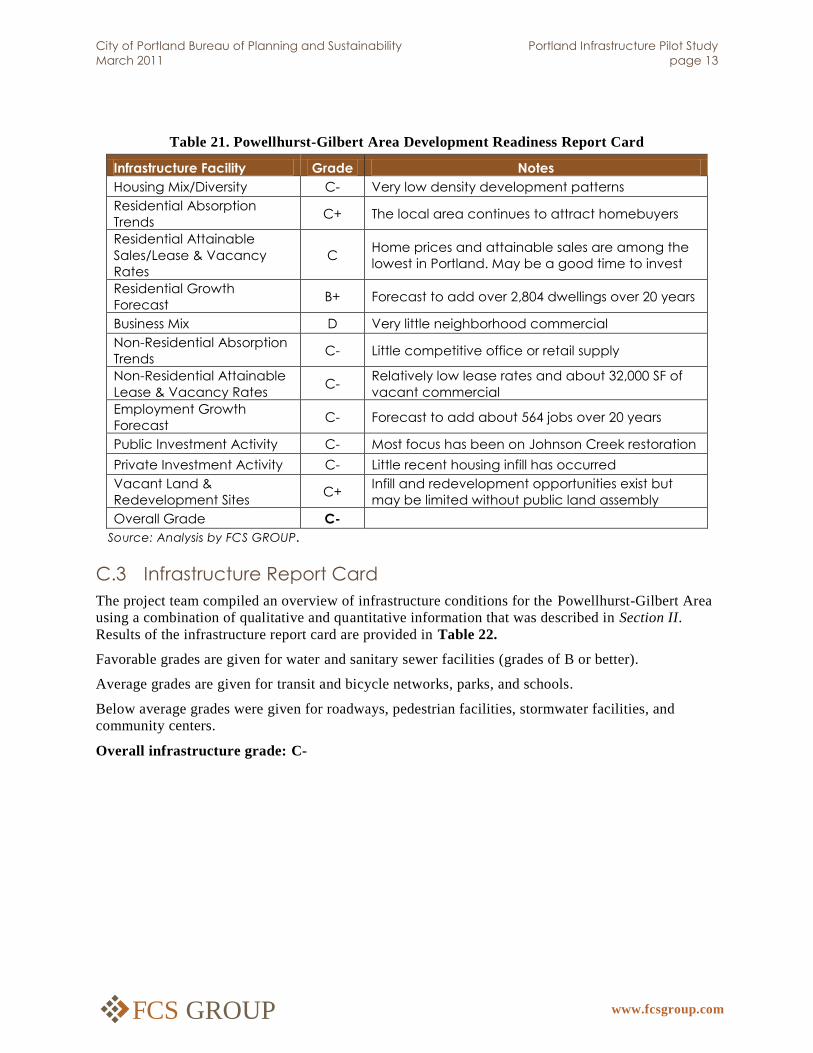
City of Portland Bureau of Planning and Sustainability Portland Infrastructure Pilot Study
March 2011 page 13
www.fcsgroup.com FCS GROUP
Table 21. Powellhurst-Gilbert Area Development Readiness Report Card
Infrastructure Facility Grade Notes
Housing Mix/Diversity C- Very low density development patterns
Residential Absorption
Trends C+ The local area continues to attract homebuyers
Residential Attainable
Sales/Lease & Vacancy
Rates
C Home prices and attainable sales are among the
lowest in Portland. May be a good time to invest
Residential Growth
Forecast B+ Forecast to add over 2,804 dwellings over 20 years
Business Mix D Very little neighborhood commercial
Non-Residential Absorption
Trends C- Little competitive office or retail supply
Non-Residential Attainable
Lease & Vacancy Rates C-
Relatively low lease rates and about 32,000 SF of
vacant commercial
Employment Growth
Forecast C- Forecast to add about 564 jobs over 20 years
Public Investment Activity C- Most focus has been on Johnson Creek restoration
Private Investment Activity C- Little recent housing infill has occurred
Vacant Land &
Redevelopment Sites C+
Infill and redevelopment opportunities exist but
may be limited without public land assembly
Overall Grade C-
Source: Analysis by FCS GROUP.
C.3 Infrastructure Report Card
The project team compiled an overview of infrastructure conditions for the Powellhurst-Gilbert Area
using a combination of qualitative and quantitative information that was described in Section II.
Results of the infrastructure report card are provided in Table 22.
Favorable grades are given for water and sanitary sewer facilities (grades of B or better).
Average grades are given for transit and bicycle networks, parks, and schools.
Below average grades were given for roadways, pedestrian facilities, stormwater facilities, and
community centers.
Overall infrastructure grade: C-
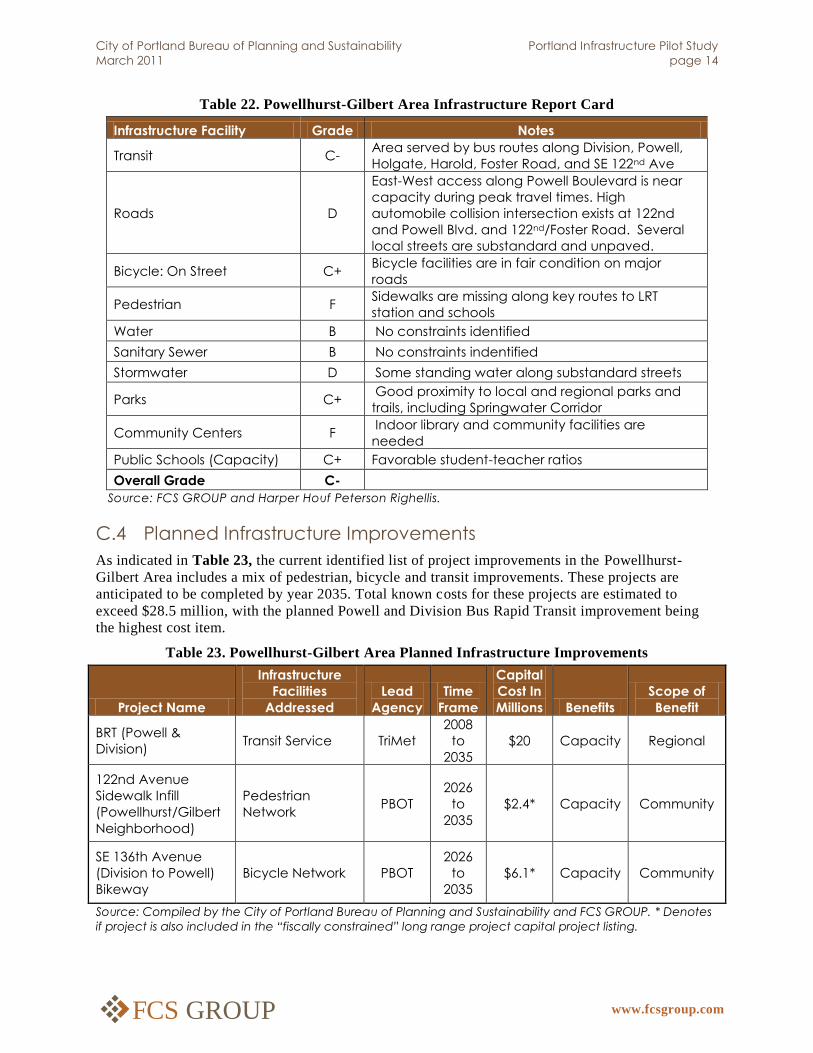
City of Portland Bureau of Planning and Sustainability Portland Infrastructure Pilot Study
March 2011 page 14
www.fcsgroup.com FCS GROUP
Table 22. Powellhurst-Gilbert Area Infrastructure Report Card
Infrastructure Facility Grade Notes
Transit C- Area served by bus routes along Division, Powell,
Holgate, Harold, Foster Road, and SE 122nd Ave
Roads D
East-West access along Powell Boulevard is near
capacity during peak travel times. High
automobile collision intersection exists at 122nd
and Powell Blvd. and 122nd/Foster Road. Several
local streets are substandard and unpaved.
Bicycle: On Street C+ Bicycle facilities are in fair condition on major
roads
Pedestrian F Sidewalks are missing along key routes to LRT
station and schools
Water B No constraints identified
Sanitary Sewer B No constraints indentified
Stormwater D Some standing water along substandard streets
Parks C+ Good proximity to local and regional parks and
trails, including Springwater Corridor
Community Centers F Indoor library and community facilities are
needed
Public Schools (Capacity) C+ Favorable student-teacher ratios
Overall Grade C-
Source: FCS GROUP and Harper Houf Peterson Righellis.
C.4 Planned Infrastructure Improvements
As indicated in Table 23, the current identified list of project improvements in the Powellhurst-
Gilbert Area includes a mix of pedestrian, bicycle and transit improvements. These projects are
anticipated to be completed by year 2035. Total known costs for these projects are estimated to
exceed $28.5 million, with the planned Powell and Division Bus Rapid Transit improvement being
the highest cost item.
Table 23. Powellhurst-Gilbert Area Planned Infrastructure Improvements
Project Name
Infrastructure
Facilities
Addressed
Lead
Agency
Time
Frame
Capital
Cost In
Millions Benefits
Scope of
Benefit
BRT (Powell &
Division) Transit Service TriMet
2008
to
2035
$20 Capacity Regional
122nd Avenue
Sidewalk Infill
(Powellhurst/Gilbert
Neighborhood)
Pedestrian
Network PBOT
2026
to
2035
$2.4* Capacity Community
SE 136th Avenue
(Division to Powell)
Bikeway
Bicycle Network PBOT
2026
to
2035
$6.1* Capacity Community
Source: Compiled by the City of Portland Bureau of Planning and Sustainability and FCS GROUP. * Denotes
if project is also included in the “fiscally constrained” long range project capital project listing.
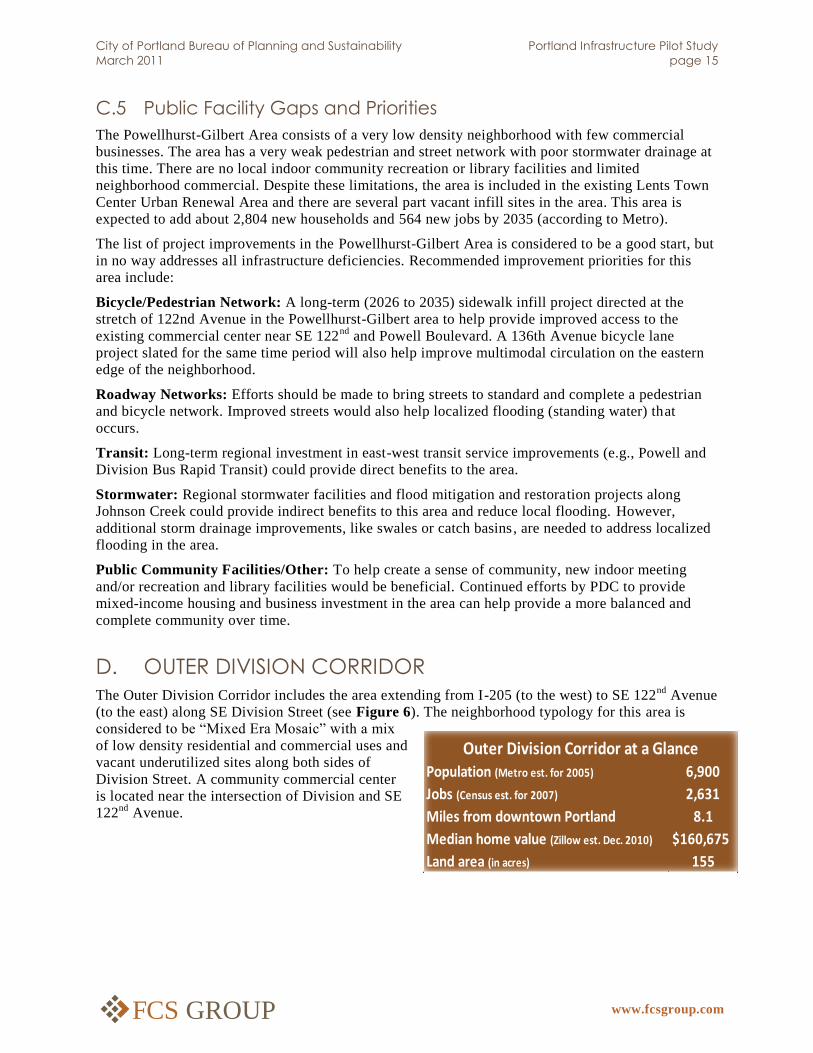
City of Portland Bureau of Planning and Sustainability Portland Infrastructure Pilot Study
March 2011 page 15
www.fcsgroup.com FCS GROUP
Population (Metro est. for 2005) 6,900
Jobs (Census est. for 2007) 2,631
Miles from downtown Portland 8.1
Median home value (Zillow est. Dec. 2010) $160,675
Land area (in acres) 155
Outer Division Corridor at a Glance
C.5 Public Facility Gaps and Priorities
The Powellhurst-Gilbert Area consists of a very low density neighborhood with few commercial
businesses. The area has a very weak pedestrian and street network with poor stormwater drainage at
this time. There are no local indoor community recreation or library facilities and limited
neighborhood commercial. Despite these limitations, the area is included in the existing Lents Town
Center Urban Renewal Area and there are several part vacant infill sites in the area. This area is
expected to add about 2,804 new households and 564 new jobs by 2035 (according to Metro).
The list of project improvements in the Powellhurst-Gilbert Area is considered to be a good start, but
in no way addresses all infrastructure deficiencies. Recommended improvement priorities for this
area include:
Bicycle/Pedestrian Network: A long-term (2026 to 2035) sidewalk infill project directed at the
stretch of 122nd Avenue in the Powellhurst-Gilbert area to help provide improved access to the
existing commercial center near SE 122nd
and Powell Boulevard. A 136th Avenue bicycle lane
project slated for the same time period will also help improve multimodal circulation on the eastern
edge of the neighborhood.
Roadway Networks: Efforts should be made to bring streets to standard and complete a pedestrian
and bicycle network. Improved streets would also help localized flooding (standing water) that
occurs.
Transit: Long-term regional investment in east-west transit service improvements (e.g., Powell and
Division Bus Rapid Transit) could provide direct benefits to the area.
Stormwater: Regional stormwater facilities and flood mitigation and restoration projects along
Johnson Creek could provide indirect benefits to this area and reduce local flooding. However,
additional storm drainage improvements, like swales or catch basins, are needed to address localized
flooding in the area.
Public Community Facilities/Other: To help create a sense of community, new indoor meeting
and/or recreation and library facilities would be beneficial. Continued efforts by PDC to provide
mixed-income housing and business investment in the area can help provide a more balanced and
complete community over time.
D. OUTER DIVISION CORRIDOR
The Outer Division Corridor includes the area extending from I-205 (to the west) to SE 122nd
Avenue
(to the east) along SE Division Street (see Figure 6). The neighborhood typology for this area is
considered to be ―Mixed Era Mosaic‖ with a mix
of low density residential and commercial uses and
vacant underutilized sites along both sides of
Division Street. A community commercial center
is located near the intersection of Division and SE
122nd
Avenue.

City of Portland Bureau of Planning and Sustainability Portland Infrastructure Pilot Study
March 2011 page 16
www.fcsgroup.com FCS GROUP
Figure 6. Outer Division Corridor (looking north)
Source: Google Maps.
D.1 SWOT Analysis
The SWOT Analysis for the Outer Division Corridor Area is provided in Table 24. This area was
also found to have several strengths and opportunities that could outweigh local weaknesses over
time. Primary strengths in this area include access to parks, good bus transit service, and plenty of
residential infill and redevelopment opportunities.
The fact that this area is not located within an Urban Renewal Area may limit the level of public
investment that is available to help construct infrastructure that leverages private development.

City of Portland Bureau of Planning and Sustainability Portland Infrastructure Pilot Study
March 2011 page 17
www.fcsgroup.com FCS GROUP
Table 24. Outer Division Corridor SWOT Analysis
STRENGTHS WEAKNESSES
Established neighborhoods Low land use Intensity
Good bus transit service (2 bus routes) Inhospitable pedestrian environment
Recent infill housing developments Incomplete local street network
Several local businesses Lack of neighborhood commercial
Five nearby parks Low attainable home sales prices
Established community shopping center at
122nd & Division
Lack of indoor recreation & library facilities
Not located in an Urban Renewal Area
I-205 freeway access & nearby MAX service
Large vacant and part vacant lots
Powell Blvd. "Mainstreet" designation
Favorable student-teacher ratios
OPPORTUNITIES THREATS
Well organized neighborhood groups Presence of "eyesore" buildings
Recent park and streetscape investments Localized flooding (inadequate storm drainage)
Vacant land, infill, and redevelopment potential Automobile domination
High capacity transit planning for Powell Blvd. High office vacancy rates
Powell Blvd. "Mainstreet" designation Negative office & industrial absorption
Low retail vacancy rates High percent of very low income residents
Relatively high attainable housing sales price
levels
High accident intersection at Division and SE
122nd
Positive housing sales absorption levels
D.2 Development Readiness Report Card
The ―development readiness report card‖ takes into account the existing market conditions, trends
and development indicators, such as amount of absorption, attainable sales/lease rates, vacancy rates,
and amount of private development completed or underway. Information from the interviews and
case study tours (with broker input) was considered along with the data presented in Section II.
The results of the development readiness report card for the Outer Division Corridor Area are
provided in Table 25 and indicate favorable grades for vacant land and infill/redevelopment sites (B
or better).
Average grades are given for residential and non-residential (commercial and office) absorption
trends and attainable lease/sales prices.
Below average grades are given for housing mix/diversity, residential and employment growth
forecasts, and public and private investment activity.
Overall grade: D+

City of Portland Bureau of Planning and Sustainability Portland Infrastructure Pilot Study
March 2011 page 18
www.fcsgroup.com FCS GROUP
Table 25. Outer Division Corridor Development Readiness Report Card
Infrastructure Facility Grade Notes
Housing Mix/Diversity C Primarily low-density detached housing
Residential Absorption
Trends C The local area continues to attract homebuyers
Residential Attainable
Sales/Lease & Vacancy
Rates
C+ Home prices and attainable sales are among the
lowest in Portland. May be a good time to invest
Residential Growth
Forecast D Forecast to add only 273 dwellings over 20 years
Business Mix C- Some neighborhood commercial and office
Non-Residential Absorption
Trends C- Little competitive office or retail supply
Non-Residential Attainable
Lease & Vacancy Rates C-
The area has relatively low lease rates and about
18,000 SF of vacant office, but few retail vacancies
Employment Growth
Forecast F
Forecast by Metro to lose jobs over the next 20
years
Public Investment Activity D- Most public investment has been to south and
west
Private Investment Activity D Little recent housing or commercial infill has
occurred
Vacant Land &
Redevelopment Sites B-
Infill and redevelopment opportunities exist but
may be limited without public land assembly
Overall Grade D+
Source: Analysis by FCS GROUP.
D.3 Infrastructure Report Card
The project team compiled an overview of infrastructure conditions for the Outer Division Corridor
Area using a combination of qualitative and quantitative information that was described in Section II.
Results of the infrastructure report card are provided in Table 26.
A favorable grade is given for water facilities (grades of B or better).
Average grades are given for transit, bicycle network, parks, and schools.
Below average grades were given for roadways, pedestrian facilities, stormwater facilities, and
community centers.
Overall infrastructure grade: C-

City of Portland Bureau of Planning and Sustainability Portland Infrastructure Pilot Study
March 2011 page 19
www.fcsgroup.com FCS GROUP
Table 26. Outer Division Corridor Infrastructure Report Card
Infrastructure Facility Grade Notes
Transit C+
Served by MAX Green line at SE Division Station.
Bus service provided along 82nd Avenue, Holgate
Boulevard and Powell Boulevard.
Roads D+
East-west access along Division Street is not at
capacity, but local street network is poor. No high
collisions, but many pedestrian-related accidents
along Division. Several local streets are
substandard and unpaved.
Bicycle: On Street C- Bicycle facilities are in fair condition on major
roads
Pedestrian D+ Sidewalks are intermittent or missing along street
sections
Water B No constraints identified
Sanitary Sewer C No constraints indentified
Stormwater D Some standing water along substandard streets
Parks C Good proximity to local and regional parks and
trails
Community Centers F Indoor library and community facilities are
needed
Public Schools (Capacity) C+ Favorable student-teacher ratios
Overall Grade C-
Source: FCS GROUP and Harper Houf Peterson Righellis.
D.4 Planned Infrastructure Improvements
As indicated in Table 27, the current identified list of project improvements in the Outer Division
Corridor Area includes a mix of pedestrian, bicycle and transit improvements. These projects are
anticipated to be completed by year 2035. Total known costs for these projects are estimated to
exceed $20 million, with the planned Powell and Division Bus Rapid Transit improvement being the
only item with a cost at this time.
Table 27. Outer Division Corridor Infrastructure Report Card
Project Name
Infrastructure
Facility Addressed
Lead
Agency
Time
Frame
Capital
Cost In
Millions Benefits
Scope of
Impact
BRT (Powell &
Division) Transit service TriMet
2008
to
2035
$20 Capacity Regional
Division Street (I-
205 - 174th):
Multimodal
Improvements
Bicycle,
pedestrian and
streetscape
PBOT
2018
to
2025
N/A Safety &
Capacity Community
111th/112th
Avenue Bicycle &
Pedestrian
Improvements
Pedestrian and
Bicycle network PBOT
2026
to
2035
N/A Capacity Community
Source: Compiled by the City of Portland Bureau of Planning and Sustainability and FCS GROUP.

City of Portland Bureau of Planning and Sustainability Portland Infrastructure Pilot Study
March 2011 page 20
www.fcsgroup.com FCS GROUP
D.5 Public Facility Gaps and Priorities
The Outer Division Corridor Area consists of a very low density neighborhood and one community
shopping center and a few scattered small businesses. The area has a very weak pedestrian and street
network with poor stormwater drainage facilities. There are no local indoor community recreation or
library facilities and limited neighborhood commercial. The area does have some vacant infill and
redevelopment sites, and relatively high housing sales prices (relative to the other case study areas).
This area is expected to add only 273 new households but lose 253 jobs by 2035 (according to
Metro).
The list of project improvements in the Outer Division Corridor Area is considered to be a good start,
but in no way addresses all infrastructure deficiencies. Recommended improvement priorit ies for this
area include:
Bicycle/Pedestrian Network: Division Street is slated to be improved from I-205 eastward,
including improvements to sidewalks, crossings and bus shelters. This will help increase foot traffic
on Division Street, but no cost estimates have been provided at this time.
Street Network: The existing street network is lacking with no formal street grid or block pattern.
As the area develops in the future, it would benefit from a local street network plan that could
include special sources of funding, such as SDC overlays and/or urban renewal district expansion
areas. A more formalized street network would also help facilitate non-auto mobility for pedestrians
and bicycles and help address the localized flooding that currently occurs in this area.
Transit Service: Long-term regional investment in east-west transit service improvements (e.g.,
Powell and Division Bus Rapid Transit) looks to make Division Street an important part of the transit
mix going forward.
Stormwater: Localized flooding (with standing water) occurs along the south side of Division Street
today. There are no current projects identified by the city to address this issue. It is recommended
that the Division Street project be planned as a green street improvement project to help mitigate
local flooding.
Public Community Facilities/Other: To help create a sense of community, new indoor meeting
and/or recreation and library facilities would be beneficial. Without the benefit of an urban renewal
district, this are may be dependent upon local public investment in new local library facilities.
The development of a greater community aesthetic is an important step in this process. BRT and
streetscape improvements in the near future give this area significant upside in the coming years.
Property values are far lower than the rest of the city, which is favorable since a majority of the land
is along Division Street, an area that has excellent exposure.
E. RETURN ON INVESTMENT CONSIDERATIONS
This section includes a comparison of the long-term fiscal revenues and capital costs that may be
realized from development of these case study areas.
E.1 Potential Capital Costs
The potential public facility improvements needed to optimize development within each of the case
study areas are expected to consist primarily of local pedestrian, street, and bicycle facility
enhancements with stormwater and/or greenstreet elements. Preliminary capital cost estimates were
developed by Harper Houf Peterson Righellis (consulting engineers) based on results from actual
construction bid results for Portland roadway projects. Unit construction cost estimates are provided
in Appendix F, and include separate estimates for interim versus full street improvements.

City of Portland Bureau of Planning and Sustainability Portland Infrastructure Pilot Study
March 2011 page 21
www.fcsgroup.com FCS GROUP
Using the City’s GIS coverage layers, the project team calculated the linear feet of substandard
streets by roadway classification and amount of unimproved roadway rights-of-way (missing street
network).
Additional cost estimates were prepared for a prototypical indoor recreation center or library fac ility,
since such facilities were determined to be lacking in the case study areas. The analysis for each area
includes a range of potential capital costs that vary from small incremental projects to larger full
roadway and streetscape projects. The potential capital costs for streetscapes (lighting, benches,
street trees), roadways (pedestrian, bicycle and stormwater facilities), and community facilities are
shown in Table 28. While these findings reflect full-street improvements for existing substandard
roadways and new roadways inside each case study area, a more incremental project-phasing strategy
could be considered (see results shown in Appendix F).
Table 28. Potential Streetscape, Roadway and Community Facility
Infrastructure Cost Elements by Case Study Area
Case Study Area
Streetscapes
(lighting,
benches,
tree, etc.)*
Roadways
(bike, ped. &
stormwater
included)*
Community
Facilities
(adding new) Total
1. Outer Tabor Area $2,302,212 $8,129,001 $ 3,125,000 $13,556,213
2. Lents Town Center $2,338,676 $8,519,339 $ 3,125,000 $13,983,015
3. Powellhurst-Gilbert Area $4,498,317 $15,074,290 $ 3,125,000 $22,697,607
4. Outer Division Corridor $324,187 $898,771 $ 3,125,000 $4,347,958 Source: derived from City of Portland GIS data; analysis by Real Urban Geographics; unit-cost assumptions by Harper
Houf Peterson Righellis; compiled by FCS GROUP. Derived from Appendix E. * Reflects improvements to existing and
new collector and arterial streets. Costs stated in 2011 dollars, and exclude land acquisition, and extra-ordinary
construction requirements (e.g., retaining walls, wetland permitting, etc.)
It should be noted that the potential infrastructure capital costs shown above are considered to be
what is necessary to deliver the basic level of key infrastructure to the case study areas. Some of the
roadway, bicycle, pedestrian, and streetscape elements included in Table 28 are already reflected in
the long-range planned infrastructure improvements described earlier in this section. It is likely that
additional infrastructure investment will be needed in the form of transit service and facilities. The
benefits from additional transit service investments would only be optimized if such investments
were made after the basic infrastructure investments described in Table 28 are made.
E.2 Potential Development Activity and Fiscal Revenues
The development readiness indicators described previously indicates that the private real estate
markets are generally more favorable inside the I-205 freeway than outside the freeway. However, a
long-term view is needed to ascertain the relative benefit from public facility investments since most
public facilities are constructed to last 50 to 100 years (or longer with proper maintenance). For
comparison purposes, FCS GROUP utilized the recent Metro 2005 to 2035 household and
employment forecasts that were provided as part of the 2009 Metro Urban Growth Report and
Regional Transportation Plan assumptions (shown earlier in Table 11).
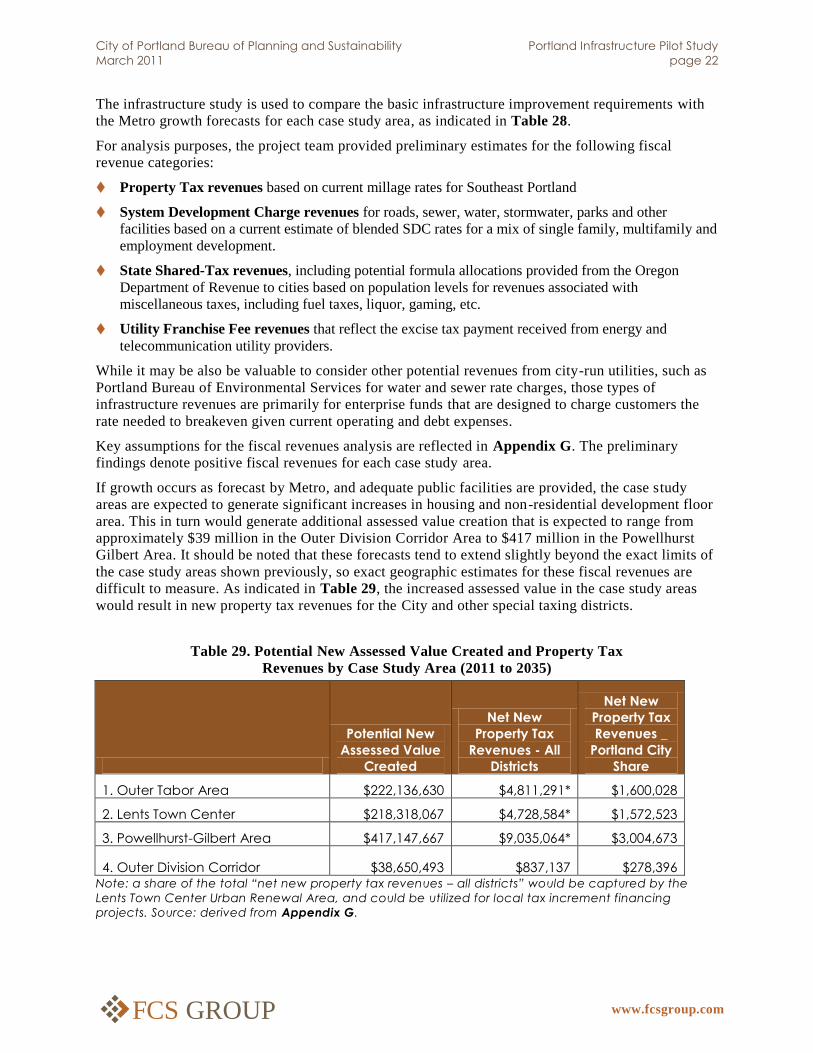
City of Portland Bureau of Planning and Sustainability Portland Infrastructure Pilot Study
March 2011 page 22
www.fcsgroup.com FCS GROUP
The infrastructure study is used to compare the basic infrastructure improvement requirements with
the Metro growth forecasts for each case study area, as indicated in Table 28.
For analysis purposes, the project team provided preliminary estimates for the following fiscal
revenue categories:
Property Tax revenues based on current millage rates for Southeast Portland
System Development Charge revenues for roads, sewer, water, stormwater, parks and other
facilities based on a current estimate of blended SDC rates for a mix of single family, multifamily and
employment development.
State Shared-Tax revenues, including potential formula allocations provided from the Oregon
Department of Revenue to cities based on population levels for revenues associated with
miscellaneous taxes, including fuel taxes, liquor, gaming, etc.
Utility Franchise Fee revenues that reflect the excise tax payment received from energy and
telecommunication utility providers.
While it may be also be valuable to consider other potential revenues from city-run utilities, such as
Portland Bureau of Environmental Services for water and sewer rate charges, those types of
infrastructure revenues are primarily for enterprise funds that are designed to charge customers the
rate needed to breakeven given current operating and debt expenses.
Key assumptions for the fiscal revenues analysis are reflected in Appendix G. The preliminary
findings denote positive fiscal revenues for each case study area.
If growth occurs as forecast by Metro, and adequate public facilities are provided, the case study
areas are expected to generate significant increases in housing and non-residential development floor
area. This in turn would generate additional assessed value creation that is expected to range from
approximately $39 million in the Outer Division Corridor Area to $417 million in the Powellhurst
Gilbert Area. It should be noted that these forecasts tend to extend slightly beyond the exact limits of
the case study areas shown previously, so exact geographic estimates for these fiscal revenues are
difficult to measure. As indicated in Table 29, the increased assessed value in the case study areas
would result in new property tax revenues for the City and other special taxing districts.
Table 29. Potential New Assessed Value Created and Property Tax
Revenues by Case Study Area (2011 to 2035)
Potential New
Assessed Value
Created
Net New
Property Tax
Revenues - All
Districts
Net New
Property Tax
Revenues _
Portland City
Share
1. Outer Tabor Area $222,136,630 $4,811,291* $1,600,028
2. Lents Town Center $218,318,067 $4,728,584* $1,572,523
3. Powellhurst-Gilbert Area $417,147,667 $9,035,064* $3,004,673
4. Outer Division Corridor $38,650,493 $837,137 $278,396 Note: a share of the total “net new property tax revenues – all districts” would be captured by the
Lents Town Center Urban Renewal Area, and could be utilized for local tax increment financing
projects. Source: derived from Appendix G.

City of Portland Bureau of Planning and Sustainability Portland Infrastructure Pilot Study
March 2011 page 23
www.fcsgroup.com FCS GROUP
If growth occurs per the Metro forecasts, the level of potential SDC revenues that would be realized
by the City is expected to range from approximately $3.8 million in the Outer Division Corridor to
$4.2 million in the Outer Tabor Area and Lents Town Center area (each), and $16.3 million in the
Powellhurst-Gilbert Area, as indicated in Table 30.
Table 30. Potential SDC Revenues by Case Study Area (2011 to 2035)
Potentia
l New
ERUs*
Added
Misc.
Constructio
n Fees
Road
SDCs
Water
SDCs
Sewer
SDCs
Stormwater
SDCs
Parks
SDCs Total SDCs
1. Outer Tabor Area
1,243 $952,469 $564,553 $438,832 $943,507 $66,023 $1,278,165 $4,243,550
2. Lents Town Center
1,221 $945,078 $560,167 $435,420 $936,185 $65,500 $1,268,250 $4,210,600
3. Powellhurst-Gilbert Area
2,430 $3,666,292 $2,171,558 $1,687,126 $3,631,760 $250,602 $4,921,277 $16,328,616
4. Outer Division Corridor
227 $844,854 $500,410 $388,778 $836,897 $57,748 $1,134,051 $3,762,739
Source: based on the preliminary analysis and assumptions provided in Appendix G.
* For analysis purposes, one equivalent residential unit (ERU) is equal to one household or five jobs
added to the area.
If growth occurs as forecast, the level of potential cumulative state-shared revenues and utility
franchise fee revenues that would be realized by the City is expected to range from approximately
$50,404 in the Outer Division Corridor to $604,427 in the Powellhurst-Gilbert Area, as indicated in
Table 31.
Table 31. Potential State Shared Tax Revenues and Utility Franchise Fee
Revenues by Case Study Area (2011 to 2035)
State Shared Tax
Revenues
Utility Franchise
Fee Revenues Total
1. Outer Tabor Area $49,608 $240,907 $290,515
2. Lents Town Center $48,603 $236,550 $285,153
3. Powellhurst-Gilbert Area $117,471 $486,956 $604,427
4. Outer Division Corridor $11,432 $38,973 $50,404 Source: based on the preliminary analysis and assumptions provided in Appendix G.

City of Portland Bureau of Planning and Sustainability Portland Infrastructure Pilot Study
March 2011 page 24
www.fcsgroup.com FCS GROUP
E.3 Comparison of Fiscal Revenues and Capital Costs
For relative comparison purposes, the results from the preliminary estimate of capital costs can be
compared with the potential long-term (year 2011 to 2035) fiscal revenues to determine a relative
fiscal return on public investment for each case study areas. In light of the fact that the Lents Urban
Renewal District has been established to capture the incremental tax revenues that would accrue for
properties located in three of the four areas, the potential revenues shown in Table 32 are considered
to be lower than the amount that the city (Portland Development Commission) would receive if the
Metro 2035 development forecasts occur as projected.
This preliminary analysis generally indicates that the level of public investment for the two case
study areas located inside the I-205 freeway area would be expected to yield a fiscal return that is
about one-half the cost of the basic infrastructure public investments required for those areas.
However, if we add in the additional tax increment revenues that would be captured by the Lents
Urban Renewal Area, another $3 million of revenue could be counted and the expected level of fiscal
revenues would more closely match the basic infrastructure requirements.
The case study areas located outside the I-205 freeway could yield a favorable long-term return on
public infrastructure investment. As indicated below, the two outer areas could provide significant
new redevelopment potential that exceeds the basic infrastructure investment levels. This potential
return on investment would be reduced if additional project cost items (like right of way purchases)
are included in the cost estimates. Even without the added potential benefit of additional tax
increment revenues (a large portion of area 3 (Powellhurst-Gilbert) is contained within the Lents
Urban Renewal District boundary yet those added revenues are not counted below), these two areas
show a positive fiscal return on investment over the long-term.
Table 32. Comparison of Potential Fiscal Revenues and Basic
Infrastructure Costs by Case Study Area (2011 to 2035)
Total Potential
Fiscal & SDC
Revenues 1
(years 2011to
2035)
Potential Basic
Infrastructure
Construction
Costs 2
Potential
Revenues as
Share of Capital
Costs
Potential
Payback
Period 3
1. Outer Tabor Area $6,134,093 $13,556,213 45% 53 years
2. Lents Town Center $6,068,276 $13,983,015 43% 55 years
Combined Areas 1 & 2 $12,202,369 $27,539,228 44% 54 years
3. Powellhurst-Gilbert
Area $19,937,716 $22,697,607 88% 27 years
4. Outer Division
Corridor $4,091,539 $4,347,958 94% 26 years
Combined Areas 3 & 4 $24,029,255 $27,045,565 89% 27 years
Notes: 1 Derived from Table 28. 2 Derived from Tables 29-31. Only reflects the City of Portland share of property tax revenues. 3 Reflects number of years it will take before local fiscal revenues exceed infrastructure capital costs.
Source: preliminary comparison compiled by FCS GROUP. Costs are in 2011 dollars.
F. BUILDABLE LAND INVENTORY CONSIDERATIONS
The Portland Bureau of Planning and Sustainability has created a factual basis for evaluating the
buildable land supply and unique methodology for evaluating the potential development capacity for
all land area within the City of Portland. The approach used by the City currently complies with

City of Portland Bureau of Planning and Sustainability Portland Infrastructure Pilot Study
March 2011 page 25
www.fcsgroup.com FCS GROUP
Oregon state requirements for conducting a Buildable Land Inventory (BLI) and is useful for
determining the available residential (dwelling unit) capacity and employment capacity that exists.5
After analyzing the Southeast Portland case study areas and related data/assumptions provided by the
City of Portland and Metro, the project consultant team offers the following suggested methodology
refinements during future periodic review estimates of buildable land development capacity.
1. Consider tax lots smaller than ½ acre in the BLI. While the Oregon state requirement for
conducting buildable land inventories does not require cities to consider vacant lands on tax lots
smaller than ½ acre in size; there are probably hundreds or thousands of vacant tax lots below ½
acre that are potentially developable for housing or employment uses. The city may desire to
count or at least keep track of the vacant land areas on tax lots between ¼ and ½ acre in size in
addition to the other larger tax lots, especially for medium and high density locations, such as
Central City, corridors, centers and light rail station areas.
2. Take into account minimum site dimensions (site length and width) in the BLI analysis. It is not
apparent whether the city’s existing BLI requires minimum site dimensions as it considers parcel
development constraints. In some instances, a GIS analysis of vacant lands can create small
―slivers‖ of vacant or part-vacant land area (especially after deducting various physical or
environmental constraints) that are not suitable for development.
3. Consider applying a ―low or medium‖ capacity reduction for employment zones if located in
slopes over 25%. The current BLI methodology has a 0% capacity reduction for employment
zones when located on slopes over 25%, noting that there is ―an insignificant amount of
commercial/employment land coincident with these steep slopes.‖ While, it appears that this type
of methodology adjustment may have little potential impact on the city’s BLI or development
capacity assumptions, employers or developers rarely consider building on steep slopes (with the
exception of OHSU campus which could be inventoried and counted as a special planning or
PUD area). This change in methodology may enhance overall credibility for the City’s BLI
methodology.
4. For ―public land ownership‖ it is recommended that the city include separate categories for
public parks, public right-of-way, and other public-owned parcels to refine the level of capacity
reduction that is likely. For parks and unimproved public right-of-ways, a 100% capacity
reduction is recommended.
5. It is recommended that the city further define subjective measures used to ascertain whether an
unconstrained parcel is either ―likely‖ or ―unlikely‖ to develop. The current Development
Capacity Analysis GIS model appears to allow BPS staff to ―manually‖ flag a parcel as either
―likely‖ or ―unlikely‖ to develop, but does not include objective measures for doing so.
6. For non-vacant parcels, the Development Capacity Analysis GIS model includes single-family
and multifamily zoned parcels if they are at 20% or less of their zoned development capacity.
This assumption should be monitored in the future to ascertain whether it tends to undercount
underutilized residential land area. As the City continues to build out over time, a combination
of factors will likely come into play to determine if an area should be counted as underutilized,
including percent of remaining development capacity, land area (larger vacant tax lots tend to be
developed more economically/efficiently than smaller tax lots), and some measure of
―development readiness.‖
5 Detailed buildable land inventory methodology is provided in the Portland Plan, Appendix C: Buildable Lands
Inventory Constraints Methodology. Refer to the City of Portland Bureau of Planning and Sustainability, Portland
Development Capacity Analysis GIS Model for additional detail on methods used to estimated development capacity
on buildable lands in the city of Portland.

City of Portland Bureau of Planning and Sustainability Portland Infrastructure Pilot Study
March 2011 page 26
www.fcsgroup.com FCS GROUP
7. For the development capacity calculations, the City currently assumes there to be a ―low
constraint‖ for parcels that are immediately adjacent to substandard or unimproved streets or
right-of-ways. Findings from a recent Metro study (Appendix 2: How Public Investments
Stimulate Private Development, August 2010), also support similar findings, but go a bit further
in defining the scope of the impacts. The recent Metro study generally indicates that the impact
is not limited to adjacent parcels, but also parcels that are ―proximate‖ or ―close to‖ ―pedestrian
environment and streetscapes‖ and ―transit and connectivity‖ that receive ―value premiums.‖ For
analysis, purposes, it is recommended that the City’s BLI methodology be refined to include a
―low constraint‖ for areas that are within ¼ mile of locations deemed to have a ―substandard or
unimproved‖ pedestrian environment.
8. An additional consideration for determining whether residential lands are relatively constrained
could focus on transit accessibility, including distance from ―high capacity‖ transit service.
Parcels that are outside ¼ mile distance from high capacity transit may receive a ―low constraint‖
relative to tax lots that are closer to such transit service.
9. Another consideration for determining development constraints includes proximity to ―citywide
access facilities‖ such as indoor parks and recreation centers and community gardens and
community libraries. It appears that the lack of such facilities in Southeast Portland is one
limitation on development there today. It is recommended that the city BLI methodology be
refined to include a ―low constraint‖ for parcels that are located more than one mile from such
facilities.
The existing BLI and development capacity methodology utilized by the City of Portland complies
with Oregon state requirements and is likely one of the most scientific and comprehensive methods
utilized in the Pacific Northwest. The various refinements suggested above are intended to enhance
the accuracy and credibility of the city’s methodology even further. As cit ies face the continued
challenge of attracting private investment and job creation, the ability to accurately determine where
public infrastructure investments have the most beneficial impact becomes even more critical. The
analysis, findings and recommendations included in this Portland Infrastructure Investment Pilot
Study can help inform public investment decisions and prioritize facility investments on the specific
types of infrastructure as part of targeted-area redevelopment strategies.

City of Portland Bureau of Planning and Sustainability Portland Infrastructure Pilot Study
March 2011
www.fcsgroup.com FCS GROUP
BIBLIOGRAPHY

City of Portland Bureau of Planning and Sustainability Portland Infrastructure Pilot Study
March 2011 Bibliography - page 1
www.fcsgroup.com FCS GROUP
Area-Wide
Metro 2040 Growth Concept (http://www.oregonmetro.gov/index.cfm/go/by.web/id=29882)
Metro Centers and Corridors Report
(http://www.oregonmetro.gov/index.cfm/go/by.web/id=31931/level=4)
Metro Efficiency Study
(http://library.oregonmetro.gov/files//2010_growth_management_assessment-ap_2.pdf)
Metro Regional Infrastructure Analysis
(http://library.oregonmetro.gov/files/regionalinfrastructureanalysis.pdf)
Portland Plan & Comprehensive Plan Update (http://www.pdxplan.com/)
Infrastructure Condition and Capacity Report
(http://portlandonline.com/portlandplan/index.cfm?c=51427&a=270882)
Ec. Dev. #1: Trends, Opportunities, & Market Factors
(http://library.oregonmetro.gov/files/regionalinfrastructureanalysis.pdf)
Ec. Dev. #4: Alternative Choices
(http://www.portlandonline.com/portlandplan/index.cfm?c=51427&a=270873)
Draft Economic Opportunities Analysis
(http://www.portlandonline.com/index.cfm?mode=search&search_action=SearchResults&filter_categ
ory_tree_id=25777&search_words=draft+economic+opportunities+Analysis)
City of Portland Economic Development Strategy (http://pdxeconomicdevelopment.com/)
East Portland Action Plan (http://www.portlandonline.com/shared/cfm/image.cfm?id=214221)
Corridors
Division Street/Main Street Plan (http://portlandonline.com/bps/index.cfm?c=41524&)
Foster Corridor Exploratory Study (no Web site available)
Metro High Capacity Transit System Plan
(http://www.oregonmetro.gov/index.cfm/go/by.web/id=26680)
Portland Streetcar Development Oriented Transit
(http://www.portlandstreetcar.org/pdf/development.pdf)
SE 122nd
Avenue Enhancement Study
(http://www.portlandonline.com/bps/index.cfm?c=38978&a=203123)
SE 122nd
Ave Study (http://www.portlandonline.com/bps/index.cfm?c=50636)
82nd
Ave Corridor Retail Market Analysis
(http://scholarsbank.uoregon.edu/xmlui/bitstream/handle/1794/8912/Portland_82nd_Avenue_Co
mmercial_Corridor_Retail_Market_Analysis_207.pdf?sequence=1)
82nd
Ave of Roses High Crash Corridor Safety Plan
(http://222.portlandonline.com/Transportation/index.cfm?a=176656&c=44634)
Inner Powell Streetscape Plan
(http://www.portlandoregon.gov/transportation/index.cfm?c=44307)
Foster Streetcar Feasibility Study (no Web site available)
Outer Powell Boulevard Concept Plan (no Web site available)
Division RFF/MTIP Project (no Web site available)
Industrial Areas
Freeway Lands Property Industrial Site Assessment
(http://www.pdc.us/pdf/ura/lents_town_center/Lents-Industrial-Site-Analysis.pdf)
Station Communities
Foster-Lents Integration Partnership (no Web site available)
Metro TOD Typology Study (no Web site available)

City of Portland Bureau of Planning and Sustainability Portland Infrastructure Pilot Study
March 2011 Bibliography - page 2
www.fcsgroup.com FCS GROUP
Lents Town Center
Lents Town Center – General (http://www.pdc.us/pubs/type_list.asp?id=6)
Lents TC Redevelopment Feasibility Study
(http://www.pdc.us/pdf/ura/lents_town_center/urac/2009/2009-11-10/LTC-Redevelopment-
Feasibility-Study.pdf)
Lents TC Market Analysis (http://www.pdc.us/pubs/inv_detail.asp?id=832&ty=6)
Lents Economic Development Strategy
(http://www.pdc.us/pdf/ura/lents_town_center/lents_ecdev_strategy_adopted.pdf)
Parks and Greenspaces
Powell Butte Master Plan
(http://www.portlandoregon.gov/parks/index.cfm?a=279979&c=51822)
Powell Butte Park Improvement Project
(http://www.portlandoregon.gov/parks/index.cfm?c=50003)
Natural Area Acquisition Strategy
(http://www.portlandonline.com/parks/index.cfm?c=43222&a=130583)
Metro Intertwine (http://theintertwine.org/)
Bi-State Regional Trails System Plan (http://theintertwine.org/BiStateTrails/)
Transportation
Regional Transportation Plan (http://www.oregonmetro.gov/index.cfm/go/by.web/id=25038)
Transportation System Plan (http://www.portlandonline.com/transportation/index.cfm?c=52495)
Streetcar System Plan
(http://www.portlandonline.com/transportation/index.cfm?c=49304&a=252726)
Portland Bicycle Plan for 2030
(http://www.portlandonline.com/transportation/index.cfm?c=44597)
Sewer and Stormwater
BES System Plan (no Web site available)
Johnson Creek Watershed Management Projects
(http://www.portlandoregon.gov/bes/index.cfm?c=33212)
Grey to Green Initiative (http://www.portlandonline.com/bes/index.cfm?c=47203)

City of Portland Bureau of Planning and Sustainability Portland Infrastructure Pilot Study
March 2011
www.fcsgroup.com FCS GROUP
APPENDIX A. INFRASTRUCTURE INVESTMENT
PILOT STUDY
INTERVIEW SUMMARY

City of Portland Bureau of Planning and Sustainability Portland Infrastructure Pilot Study
March 2011 Appendix A - page 1
www.fcsgroup.com FCS GROUP
City of Portland Bureau of Planning and Sustainability
Infrastructure Investment Pilot Study Interview Summary
January 19, 2011
Introduction
Cogan Owens Cogan, LLC, conducted nine interviews with representatives from
TriMet, Portland Public Schools, David Douglas Public Schools, and
neighborhood and business organizations located in the study area of southeast
Portland bounded by Division Street on the north, Foster road on the south, 82nd
Avenue on the west and 136th Avenue on the east. All interviewees were asked
about infrastructure investments needed in the study area. Additionally, TriMet
and the school districts were asked about their existing and planned
infrastructure improvements.
The purpose of the interviews was twofold: 1) to learn more about planned
infrastructure projects in the study area, and 2) to ascertain attitudes and points
of view among those who live and work in the study area about infrastructure
needs, how critical those needs are and what might motivate needed public or
private investment.
In each interview it was necessary to explain what is meant by infrastructure. For
the purposes of these interviews it was defined as streets and roads, sewer and
water lines, curbs, sidewalks and stormwater facilities as well as
telecommunication systems, schools, parks and playgrounds, community
centers, police stations and other publicly financed projects or measures that
are generally needed to support modern urban life.
TriMet
Existing Infrastructure
Eastside MAX since 1987
Greenline since 2009
Extensive bus service
Planned Improvements
No major projects planned.
Needed Study Area Investments
Focus new investments on increasing density and activity at transit nodes. For
TriMet the key to stable and improving service is ridership. The better the
development intensity, the better the service.
A new model is needed for the area with a mix of incomes, ages, housing
and open space (e.g., Russellville)

City of Portland Bureau of Planning and Sustainability Portland Infrastructure Pilot Study
March 2011 Appendix A - page 2
www.fcsgroup.com FCS GROUP
Focus on amenity values – schools and open space and streetscape
A complete pedestrian network accessing mass transit
Streetscape improvements and biking networks
Quality middle class housing quality and mixed use areas
Connectivity of systems
In-fill development with a mix of ages and incomes
Other Comments
TriMet will need intense coordination with the City if the streetcar system is
expanded and streetscapes are improved in station and other areas.
Portland Public Schools (PPS)
Existing Infrastructure
Marshall High School
Marysville k-8
Planned Improvements
The context for the school district is PPS’ proposed bond issue with new projects
every six years.
PPS will be developing a Master Plan for the closed Marshall High School
that provides opportunities for coordination with the City.
Reconstruction of Marysville after fire damage is a high priority of the
proposed bond issue.
Other school improvements:
http://www.pps.k12.or.us/files/schoolmodernization/Work_by_School_01_1
2_11.pdf
Other study area improvements:
http://www.pps.k12.or.us/files/schoolmodernization/CS-
Neighorhood_Work-Southeast.pdf
Needed Study Area Investments
Safe Routes to Schools
Other Comments
PPS welcomes City collaboration.
David Douglas Public Schools (DDPS)
Existing Infrastructure DDPS has multiple school buildings with limited investments being made due to funding
limits and low property valuations in the area. DDPS is extremely constrained by their tax
base. They are poor and getting poorer with 78 percent of students on free or reduced
lunch programs.

City of Portland Bureau of Planning and Sustainability Portland Infrastructure Pilot Study
March 2011 Appendix A - page 3
www.fcsgroup.com FCS GROUP
Planned Improvements DDPS is preparing a major capital needs study that will be brought to the Board of
Education in March or April. The outcome will be a comprehensive list of needs. At this
time, DDPS is considering taking out a $15 million interest-free loan to focus on
immediate needs such as boilers and repairs internal to the schools. Other DDPS needs
include:
Solar hot water heating
Replacement of roofs
HVAC combined heating and cooling (especially for cooling)
Window replacements (for heat loss and solar gain problems)
Plumbing system upgrades (water is brown in some schools although it
does not appear to be dangerous)
Needed Study Area Investments
Need to attract middle class housing and opportunities for purchase not just for
rent. There are many poor quality housing projects in the community
constructed. There have been instances in which permits were granted but
sidewalks were not completed (e.g. housing at 122nd and Ramona). Other
needed investments include:
Expand activities and links to Zenger Farms as a place for learning
Sidewalks and streetscapes for kids
Parks
Walkable bus service connections
Zoning changes to encourage more commercial and employment
activity
Housing quality and mixed use areas
More neighborhood business and complete walkable neighborhoods –
not just housing projects
Other Comments DDPS needs help with innovative finance ideas, perhaps in the form of public/private
tax increment or incentives financing for school improvements.
Neighborhood and Business Organizations
Expand the supply of strategically located commercially zoned lots. There is a lot
of multi-family zoning throughout the study area and very little commercial
properties for convenient grocery stores or other services.
“Property along Powell is mostly multi-family zoning adding to further
congestion.”
Improve mobility. The poor condition of streets and sidewalks makes it difficult for
pedestrians, people in wheelchairs and bicyclists to get around; particularly in
wet weather. Wide arterials have few cross walks making them difficult to cross.
Transit service is limited to a few arterials with infrequent runs and muddy bus
stops. Some bike lanes seem to be discontinuous and not well thought out (e.g.
City of Portland Bureau of Planning and Sustainability Portland Infrastructure Pilot Study
March 2011 Appendix A - page 4
www.fcsgroup.com FCS GROUP
bike lanes on Holgate). Suggested improvements include street cars in select
locations, improved ability to cross barriers like I-205, paving key local roads and
establishing a continuous sidewalk network.
“The most dangerous intersections for pedestrians are on Powell at 82nd,
92nd, 122nd and 136th and on Division at 82nd and 122nd.”
“Foster at 82nd and east of 82nd is particularly bad for wheelchairs and
pedestrians. The sidewalks are narrow and utility poles disrupt the
pathway.”
“Powell has no curbs or sidewalks and few cross walks.”
“Sidewalks are needed on 122nd from Foster to Holgate.”
Address flooding. Flooded streets or high water are frequent occurrences during
the rainy season, especially on the south side of the study area. Flood insurance
premiums are apparently quite high. Develop an overall plan for dealing with
frequent flooding from Johnson Creek and find a way to reduce flood insurance
premiums.
“Swales to deal with standing water are needed on 122nd from Foster to
Holgate.”
Improve local aesthetics. Minimize eyesores such as the unoccupied building at
93rd Avenue on the south side of Woodstock Blvd. which is two or three stories,
occupies one-half block and wrapped in plastic. Another is the “ugly” PGE
substation at 104th and Foster for which neighbors have requested visual
improvement. More careful treatment of streetscapes and landscaping is
needed.
Invest in telecommunications infrastructure. Cell phone reception and computer
usage is limited and grows worse toward the eastern part of the study area.
Take steps to improve cell phone reception and computer usage. There are
many ugly overhead wires, transformers and power substations that could be
placed underground.
Provide more public gathering spaces. There are less than 40 acres of parkland
in the study area, but many unimproved sites that could be reserved for parks.
Small scale farming should be encouraged in some parts of the study area
similar to Zenger Farms. More branch libraries are needed as the nearest one is
east of 122nd. In addition, a community center would be helpful as the closest
one is at Mt. Scott.
“More parks are needed east of 112th Avenue.”
“Gates Park at 136th could be converted into an equestrian center, next
to Powell Butte and operated on a year-round basis.”
Support local businesses. Many business owners in the study area are very small
and unsophisticated. They need financial and business advice and assistance
including better access to financing. The storefront improvement program along

City of Portland Bureau of Planning and Sustainability Portland Infrastructure Pilot Study
March 2011 Appendix A - page 5
www.fcsgroup.com FCS GROUP
82nd has been successful and extending it to businesses along Powell, Division
and Foster would improve the neighborhood environment and climate for other
businesses to grow.
Because of the difficult ground conditions and infrastructure issues, many land
owners and small businesses are reluctant to invest in their properties. Political
leaders and planners should talk to local business owners and landlords to find
out why vacant and underutilized properties are not used well. City needs to see
area as an opportunity like they have with east side west of 82nd.
The permit process to allow upgrading building and redevelopment, particularly
along 82nd Avenue, and Powell and Division east of 82nd, is causing problems
and confusion for property owners and developers. Either the process needs to
be re-examined or better explained to allow efficient processing of permit
requests.
“Holgate at 122nd is a pedestrian zone which requires parking behind the
businesses instead of in front. Many stores are unable to do that as it
creates financial and circulation problems.”
Other opportunities:
The industrial area south of Foster has potential, but needs updated
design to allow effective utilization.
The closure of Marshall High School presents an opportunity for
redevelopment of the site, but also creates new challenges for filling the
education cutback.
Interviewees
TriMet – Jilian Detweiler, Manager of Property Development
Portland Public Schools – Tony Magliano, Director of Facilities
David Douglas Public Schools – Annette Mattson, School Board Member
Powellhurst/Gilbert Neighborhood Association – Mark White, President
Lents Neighborhood Association – Nick Christensen, President
Foster-Powell Neighborhood Association – Erica Bjerning, President
Foster Area Business Association – Nancy Chapin, Past President and
former staff
Lents Urban Renewal Area Advisory Board – Cora Potter, Chair
82nd Ave. Business Association – Gary Sargent, Sr., Board Member and
Founding Member

www.fcsgroup.com FCS GROUP
APPENDIX B. PORTLAND INFRASTRUCTURE
INVESTMENT PILOT STUDY
BUS TOUR
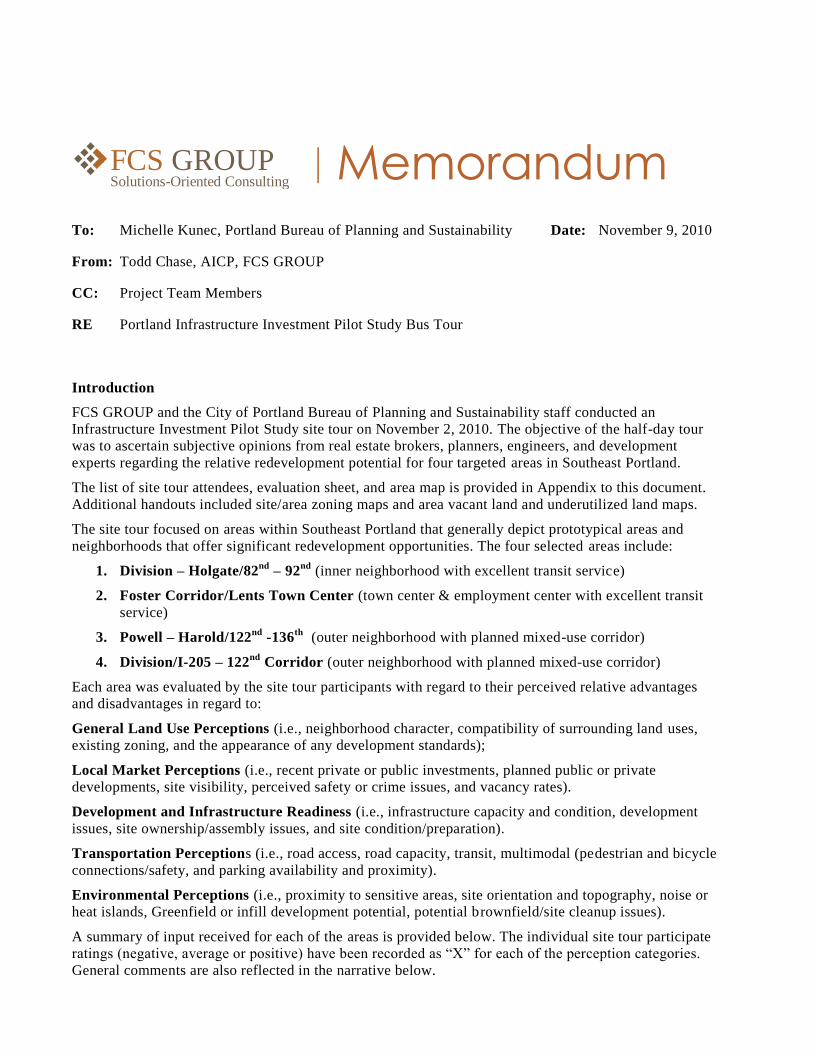
Memorandum
To: Michelle Kunec, Portland Bureau of Planning and Sustainability Date: November 9, 2010
From: Todd Chase, AICP, FCS GROUP
CC: Project Team Members
RE Portland Infrastructure Investment Pilot Study Bus Tour
Introduction
FCS GROUP and the City of Portland Bureau of Planning and Sustainability staff conducted an
Infrastructure Investment Pilot Study site tour on November 2, 2010. The objective of the half-day tour
was to ascertain subjective opinions from real estate brokers, planners, engineers, and development
experts regarding the relative redevelopment potential for four targeted areas in Southeast Portland.
The list of site tour attendees, evaluation sheet, and area map is provided in Appendix to this document.
Additional handouts included site/area zoning maps and area vacant land and underutilized land maps.
The site tour focused on areas within Southeast Portland that generally depict prototypical areas and
neighborhoods that offer significant redevelopment opportunities. The four selected areas include:
1. Division – Holgate/82nd
– 92nd
(inner neighborhood with excellent transit service)
2. Foster Corridor/Lents Town Center (town center & employment center with excellent transit
service)
3. Powell – Harold/122nd
-136th
(outer neighborhood with planned mixed-use corridor)
4. Division/I-205 – 122nd
Corridor (outer neighborhood with planned mixed-use corridor)
Each area was evaluated by the site tour participants with regard to their perceived relative advantages
and disadvantages in regard to:
General Land Use Perceptions (i.e., neighborhood character, compatibility of surrounding land uses,
existing zoning, and the appearance of any development standards);
Local Market Perceptions (i.e., recent private or public investments, planned public or private
developments, site visibility, perceived safety or crime issues, and vacancy rates).
Development and Infrastructure Readiness (i.e., infrastructure capacity and condition, development
issues, site ownership/assembly issues, and site condition/preparation).
Transportation Perceptions (i.e., road access, road capacity, transit, multimodal (pedestrian and bicycle
connections/safety, and parking availability and proximity).
Environmental Perceptions (i.e., proximity to sensitive areas, site orientation and topography, noise or
heat islands, Greenfield or infill development potential, potential brownfield/site cleanup issues).
A summary of input received for each of the areas is provided below. The individual site tour participate
ratings (negative, average or positive) have been recorded as ―X‖ for each of the perception categories.
General comments are also reflected in the narrative below.
FCS GROUPSolutions-Oriented Consulting

November 9, 2010 Memorandum
Portland Infrastructure Investment Pilot Study
Site Tour Notes
www.fcsgroup.com FCS GROUP
Area 1 – Division-Holgate/SE82nd
to SE9nd
There seemed to be a consensus that Area 1 has a limited potential for major development opportunities.
The largest primary large scale private development opportunity area is on land already occupied by the
Bowling alley at Powell and 92nd
, and an adjacent ODOT maintenance yard (both sites are adjacent to the
MAX Greenline station. According to the City of Portland Bureau of Planning and Sustainability staff,
the owners of the bowling alley site are not inclined to redevelop this site in the near term. There is also a
small parcel of vacant land across the street from the bowling alley site that could provide additional
near-term development. There are several parcels along the Division corridor – a corridor designated as a
suburban ―mainstreet‖ – that could, conceivably, be developed with housing and mixed use. The area
could benefit from some infrastructure improvements to sidewalks and pedestrian crosswalks, and loca l
street paving projects. Another major unknown variable in Area 1 is the future plan for the former
Marshall High School site, which could serve as a future public or private secondary school and
community center.
Perceptions Negative Average Positive General Land Use X X Local Market X X Development/Infrastructure Readiness X X Transportation X X Environmental X X
Area 2 – SE Foster Corridor/Lents Town Center
This area was among the top two areas identified as having the most positive (least negative) issues
among the four areas. The greatest potential in Area 2 is within the Lents Town Center and adjacent
industrial/employment area east of I-205; where PDC has dedicated considerable effort to development
and redevelopment projects over the past several years. There are large underdeveloped industrial sites
along Johnson Creek that could potentially serve as a new employment or mixed-use redevelopment
opportunity sites. There are ongoing stormwater and open space improvements along Johnson Creek (by
Portland BES and PDC) and some underutilized existing industrial/flex buildings east of I-205. PDC is
actively pursuing a public/private housing and mixed-use project on the former little league field, and is
attempting to work with existing property owners in the Lents Town Center to rehabilitate older
buildings. Site tour participants cited local crime rates as a perception that hurts this area’s market image.
The local Boys and Girls Club and MAX Greenline LRT access, and tight-knit urban buildings, were also
identified as important community assets that help overcome weak market conditions.
Perceptions Negative Average Positive General Land Use X X Local Market X X Development/Infrastructure Readiness X X Transportation X X Environmental X X

November 9, 2010 Memorandum
Portland Infrastructure Investment Pilot Study
Site Tour Notes
www.fcsgroup.com FCS GROUP
Area 3 – SE Powell-Harold/SE 122nd
to SE 136th
Area 3 was viewed as a potentially good residential in-fill area. This area has already attracted significant
in-fill residential development over the past decade, adding to the population density of this area. There
is an effort by the City of Portland to plan SE 122nd
as a mixed use corridor and help facilitate the
―transition‖ of development by allowing a mix of multifamily housing and commercial uses along the
corridor, and in-fill multifamily housing developments where feasible – such as intersection ―nodes‖ that
are within walking distance of transit. There are considerable ―internal‖ redevelopment areas, but large -
scale development may present conflicts with lower-density neighborhoods. There appears to be a need
for significant infrastructure here in terms of roads, stormwater facilities, bicycle lanes and sidewalks.
Perceptions Negative Average Positive General Land Use X X Local Market X X Development/Infrastructure Readiness X X Transportation X X Environmental X X
Area 4 – SE Division Corridor – I 205 to SE 122nd
Avenue
This area was among the top two areas identified as having the most positive (least negative) issues
among the four areas. This corridor is designated as an outer ―mainstreet‖ by the City of Portland. There
is some development/redevelopment potential here with a couple of major ―green -field‖ vacant
development parcels along Division. There was some discussion about the possibility of widening
sidewalks and thus reducing travel lane widths and on-street parking. There is a need for pedestrian
crossings and refuge areas along Division. Division and SE 122nd
is the major activity node with some
redevelopment possibilities on the SE and NE corners of 122nd
and Division.
Perceptions Negative Average Positive General Land Use X X Local Market X X Development/Infrastructure Readiness X X Transportation X X Environmental X X
Summary and Next Steps
The results from the infrastructure investment pilot study site tour provide important information about
the perceived ―first impressions‖ for each area. While there are many redevelopment opportunities within
each area, the areas with the greatest number of positive attributes include Area 2: Lents Town Center
and SE Foster Corridor; and Area 4: SE Division Corridor (I-205 to SE 122nd
Ave.). It appears that these
two areas offer the most near- and mid-term (1-10 years) for redevelopment potential and have the least
negative perceptions. Recent and ongoing public facility and transit investments within these areas have
already begun to leverage private investment, and it appears that these areas present significant new
private employment, residential and mixed-use development opportunities in the near future. The other
two areas appear to offer longer-term redevelopment potential (years 10+) and would likely require
significant investments in roads, transit, pedestrian, bicycle and storm water facilities before major
private investment occurs.

November 9, 2010 Memorandum
Portland Infrastructure Investment Pilot Study
Site Tour Notes
www.fcsgroup.com FCS GROUP
These finding will be supplemented with actual planned public infrastructure capacity and cost data, and
information regarding redevelopment and market potential for each area. A more complete comparison of
infrastructure return on investment will be made for each area after this additional information is
collected and analyzed.
Site Tour Attendees
Michelle Kunec Portland Bureau of Planning and Sustainability (Project Manager)
Barry Manning Portland Bureau of Planning and Sustainability
Matt Wickstrom Portland Bureau of Planning and Sustainability
Bob Glasscock Portland Bureau of Planning and Sustainability
Kevin Cronin Portland Development Commission
Charlotte Larson UrbanWorks (commercial and residential broker)
Eric Turner CapacityCommercial Group (commercial and industrial broker)
Ken Valentine, PE Harper Houf Peterson Righellis (consultant team member)
Robert Yakas, AIA FCS GROUP (consultant team member)
Steve Faust, AICP Cogan Owens Cogan (consultant team member)
Todd Chase, AICP FCS GROUP (consultant team project manager)

www.fcsgroup.com FCS GROUP

City of Portland Bureau of Planning and Sustainability Portland Infrastructure Pilot Study
March 2011
www.fcsgroup.com FCS GROUP
APPENDIX C. WALKSCORE AND
TRANSIT SCORE METHODOLOGY
City of Portland Bureau of Planning and Sustainability Portland Infrastructure Pilot Study
March 2011 Appendix C - page 1
www.fcsgroup.com FCS GROUP
WalkScore and Transit Score Methodology
The following methodology is derived from www.walkscore.com and is intended to provide a
relative comparison of the ―walkability‖ and level of transit service at any given location.
WalkScore is not a measure of how pleasant a walk is in a given area, rather, it measures the ease
with which a resident of a particular address can access area facilities without a car (e.g. walk to the
store, school or community center). The WalkScore algorithm awards points based on the distance to
amenities in each category. If an amenity is within .25 miles (or .4 km), the maximum number of
points is assigned. The number of points declines as the distance approaches 1 mile (or 1.6 km)—no
points are awarded for amenities further than 1 mile. The points are summed and normalized to yield
a score from 0—100. The number of nearby amenities is the leading predictor of whether people
walk.
Transit Score is a measure of how well a location is served by public transit. Transit Scores are based
on schedule data released in a standard format by public transit agencies. To calculate a Transit
Score, a "usefulness" value is assigned to nearby transit routes based on the frequency, type of route
(rail, bus, etc.), and distance to the nearest stop on the route.
The "usefulness" of all nearby routes is summed and we normalize this to a score between 0 - 100.
Transit Score works in any city where the transit agencies publish data in the GTFS format. To
calculate a raw Transit Score, we sum the value of all of the nearby routes. The value of a route is
defined as the service level (frequency per week) multiplied by the mode weight (heavy/light rail is
weighted 2X, ferry/cable car/other are 1.5X, and bus is 1X) multiplied by a distance penalty. The
distance penalty calculates the distance to the nearest stop on a route and then uses the same distance
decay function as the WalkScore algorithm.
The amount of transit infrastructure can vary by several orders of magnitude. Scales for measuring
things that have an extremely large range of normal values (sound volume, earthquake intensity, etc)
are typically logarithmic - a bus stop in a small town might see three trips a day, whereas downtown
Manhattan might see tens of thousands. If Manhattan had a Transit Score of 100, then on a linear
scale a small town's downtown might have a Transit Score of 0.01, whereas a logarithmic score
might rate Manhattan as 100 and a small town as 10. The logarithmic score matches a rider's
experience better: the added utility of one additional bus in a small town may exceed the addition of
10 new routes in downtown Manhattan.
In order to normalize from 0 to 100, there must be a "perfect score" location. To accomplish this, the
average Transit Score of the center of a five U.S. cities where full transit data existed (San Francisco,
Chicago, Boston, Portland, and Washington, D.C.) translated to a canonical 100 Transit Score.
For additional information involving WalkScore and Transit Score visit www.walkscore.com.

City of Portland Bureau of Planning and Sustainability Portland Infrastructure Pilot Study
March 2011
www.fcsgroup.com FCS GROUP
APPENDIX D. COMMERCIAL, OFFICE AND
INDUSTRIAL BROKERAGE PROPERTIES

City of Portland Bureau of Planning and Sustainability Portland Infrastructure Pilot Study
March 2011 Appendix D - page 1
www.fcsgroup.com FCS GROUP

City of Portland Bureau of Planning and Sustainability Portland Infrastructure Pilot Study
March 2011 Appendix D - page 2
www.fcsgroup.com FCS GROUP

City of Portland Bureau of Planning and Sustainability Portland Infrastructure Pilot Study
March 2011 Appendix D - page 3
www.fcsgroup.com FCS GROUP

City of Portland Bureau of Planning and Sustainability Portland Infrastructure Pilot Study
March 2011 Appendix D - page 4
www.fcsgroup.com FCS GROUP

City of Portland Bureau of Planning and Sustainability Portland Infrastructure Pilot Study
March 2011
www.fcsgroup.com FCS GROUP
APPENDIX E. REPORT CARD
METHODOLOGY
City of Portland Bureau of Planning and Sustainability Portland Infrastructure Pilot Study
March 2011
www.fcsgroup.com FCS GROUP
Infrastructure Report Card Methodology
The following methodology is derived from the ASCE ―Report Card for America’s Infrastructure‖. It
is intended to provide a general overview of infrastructure needs versus current capacity.
The Report Card section estimates each area’s infrastructure in ten vital areas— Public Transit, Road
Capacity, On Street Bicycle Capacity, Pedestrian Capacity, Access to Drinking Water, Sanitary
Sewer Facilities, Ability to Cope with Stormwater, Access to Nearby Parks, Community Centers and
Public Schools. Overall grades were given to each category, and supporting information on existing
conditions, trends and concerns, and policy options were provided, as well as recommendations for
future action. The Report Card was modeled after the Report Card for America’s Infrastructure
released by ASCE National in 2005 (www.infrastructurereportcard.org).
FCS GROUP collected data from several sources on each area and element of infrastructure,
reviewed and evaluated the information to develop the grades. FCS GROUP also consulted with a
professional engineer on these evaluations in order to assure that the data and conclusions were
sound.
Grades were allocated taking into account condition and capacity as well as funding verses need—
generally following a traditional grading scale (e.g., if only 77 percent of roads were found to be in
good condition or better, a grade of C assigned). The following grading scale was used for the overall
category assessments: A = Exceptional; B = Good; C = Fair; D = Poor; and F = Inadequate.
In some cases, category grades were adjusted if measures of sensibility identified glaring weaknesses
(e.g. if an area has sidewalks on local streets but neglects major arterials) Due to the many factors
that can impact infrastructure’s overall performance, some categories were given individual grades in
multiple areas of assessment, which were then averaged to create the overall category grade. In
addition to numeric data, qualitative information was also used to make modifications to the grades.
Also, for several infrastructure categories, hard data was not readily available in all areas, which
required more subjective assessments to be made.
Table E-1 depicts specific metrics, sources and grading parameters used in for evaluating
infrastructure conditions and capacity.
Development Readiness Report Card Methodology
The following methodology was formulated by FCS GROUP. It is intended to provide an overview of an
area’s relative potential for attracting new development and private investment.
The development readiness report card measures 11 different metrics of an area’s potential for retaining
or attracting future growth. The metrics include: Housing Mix and Diversity; Residential Absorption
Trends (sales); Residential Attainable Sales and Lease Rates; Vacancy Rates; Long-term Household
Growth Forecast (provided by Metro); Business Mix; Non-Residential Absorption Trends; (change in
leased floor area); Non-Residential Attainable Lease and Vacancy Rates; Long-term Employment Growth
Forecast (provided by Metro); Public Investment Activity; Private Investment Activity; and Vacant
Land/Redevelopment Potential.
FCS Group developed grades by compiling relevant information and created grading parameters which
corresponded to a letter grade. Grades were organized based upon a traditional grading scale (A =
Exceptional; B = Good; C = Fair; D = Poor; and F = Inadequate). In some instances a category had
multiple possible metrics so the overall grade reflects an average for that category. In other cases, actual
data were not readily available, so objective assessments were made using results from the stakeholder
interviews and site visits (with brokers, planners, and others). Table E-2 depicts specific metrics, sources
and grading parameters used in for evaluating development readiness conditions.

City of Portland Bureau of Planning and Sustainability Portland Infrastructure Pilot Study
March 2011
www.fcsgroup.com FCS GROUP
Table E-1A. Infrastructure Conditions Report Card Grading Methodology
A B C D F
Transit Scorewww.walkscore.co
m
Average score
between 100 and 80
Average score
between 79 and 60
Average score
between 59 and 40
Average score
between 39 and
20
Average score
between 19 and 0
LRT Proximity Trimet LRT stop in areaLRT stop within 1/4
mileLRT stop within 1/2 mile
LRT stop
between 1/2
and 1 mile away
No LRT stops a mile +
Bus Service Trimet5+ frequent bus
routes in area
2 to 4 frequent bus
routes in area
One frequent bus route
in area
Infrequent bus
serviceNo bus service
Intersection
Volume/Capacity
Ratio
PBOT
No major streets are
within 10% of
capacity at peak
travel times
One major street is
within 10% of
capacity at peak
travel times
All major streets are
within 10% of capacity
at peak travel times
One major street
is at or beyond
capacity at
peak travel
times
All major streets are
at or beyond
capacity at peak
travel times
Local Street
ConnectionsPBOT
Excellent block grid
network
Fair block grid
network
Average block grid
network
Poor block grid
network
Non-existent block
grid network
Linear Feet of Streets
that are Below City
Standards or
unimproved
PBOT 0-10% 10-20% 20-30% 30-40% 40%+
Level of Constraint BPS
Study area
experiences no
constraint
Study area
experiences limited
constraint around
major streets during
peak travel times
Study area experiences
constraint around all
major streets but not
further into residential
streets during peak
travel times
Study area is
constrained on
80% of all streets
during peak
travel times
Study area is 100%
constrained during
peak travel times
Crash Frequency PBOTNo high frequency
crash locations
One high frequency
crash location
Two high frequency
crash locations
Three high
frequency crash
locations
Four or more high
frequency crash
locations
% of Linear Feet of
Streets Without Bike
Lanes
PBOT 0% 1-5% 5-20% 20-35% 35%+
Crash Frequency PBOTNo high frequency
crash locations
One high frequency
crash location
Two high frequency
crash locations
Three high
frequency crash
locations
Four or more high
frequency crash
locations
Walk Scorewww.walkscore.co
m
Average score
between 100 and 90
Average score
between 89 and 80
Average score
between 79 and 70
Average score
between 69 and
60
Average score
between 59 and 0
% of Linear Feet of
Streets With SidewalksPBOT 100-80% 80-60% 60-40% 40-20% 20-0%
Pedestrian Related
Crash FrequencyPBOT
No high frequency
crash locations
One high frequency
crash location
Two high frequency
crash locations
Three high
frequency crash
locations
Four or more high
frequency crash
locations
Pedestrian
MetricsInfrastructure
Element
Grading Data Source
Transit
Roads
Bike
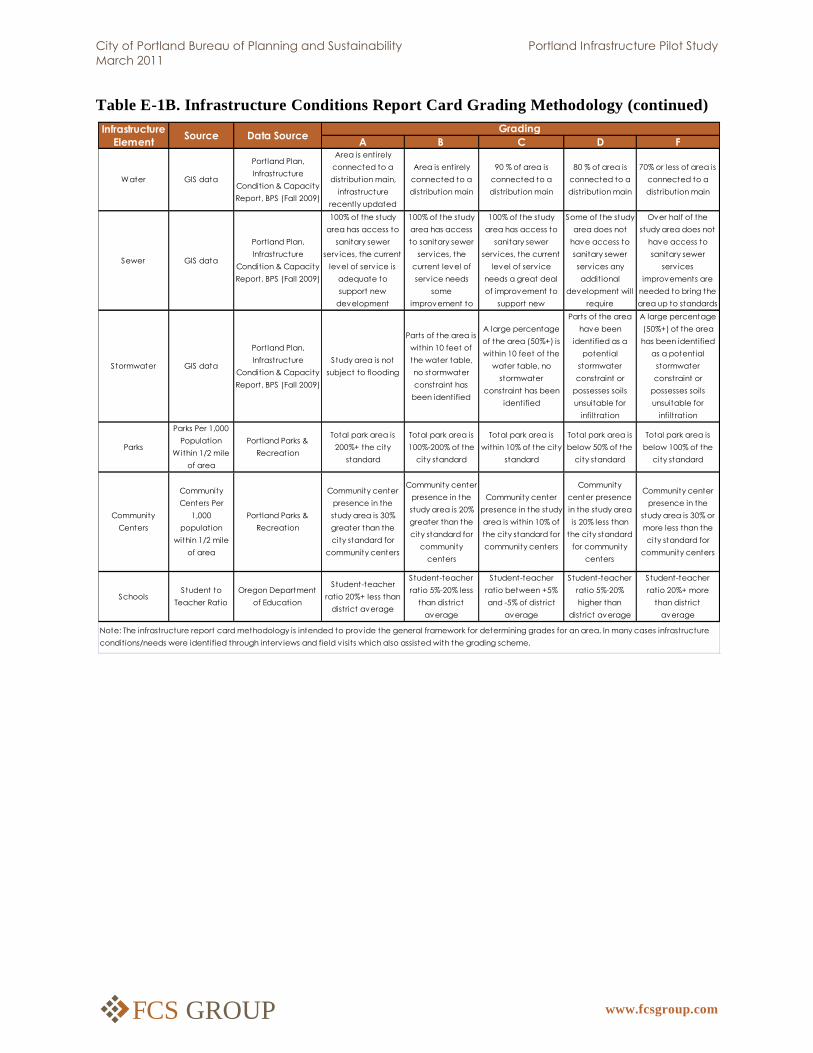
City of Portland Bureau of Planning and Sustainability Portland Infrastructure Pilot Study
March 2011
www.fcsgroup.com FCS GROUP
Table E-1B. Infrastructure Conditions Report Card Grading Methodology (continued)
A B C D F
Water GIS data
Portland Plan,
Infrastructure
Condition & Capacity
Report, BPS (Fall 2009)
Area is entirely
connected to a
distribution main,
infrastructure
recently updated
Area is entirely
connected to a
distribution main
90 % of area is
connected to a
distribution main
80 % of area is
connected to a
distribution main
70% or less of area is
connected to a
distribution main
Sewer GIS data
Portland Plan,
Infrastructure
Condition & Capacity
Report, BPS (Fall 2009)
100% of the study
area has access to
sanitary sewer
serv ices, the current
level of serv ice is
adequate to
support new
development
100% of the study
area has access
to sanitary sewer
serv ices, the
current level of
serv ice needs
some
improvement to
support new
100% of the study
area has access to
sanitary sewer
serv ices, the current
level of serv ice
needs a great deal
of improvement to
support new
development
Some of the study
area does not
have access to
sanitary sewer
serv ices any
additional
development will
require
improvements
Over half of the
study area does not
have access to
sanitary sewer
serv ices
improvements are
needed to bring the
area up to standards
Stormwater GIS data
Portland Plan,
Infrastructure
Condition & Capacity
Report, BPS (Fall 2009)
Study area is not
subject to flooding
Parts of the area is
within 10 feet of
the water table,
no stormwater
constraint has
been identified
A large percentage
of the area (50%+) is
within 10 feet of the
water table, no
stormwater
constraint has been
identified
Parts of the area
have been
identified as a
potential
stormwater
constraint or
possesses soils
unsuitable for
infiltration
A large percentage
(50%+) of the area
has been identified
as a potential
stormwater
constraint or
possesses soils
unsuitable for
infiltration
Parks
Parks Per 1,000
Population
Within 1/2 mile
of area
Portland Parks &
Recreation
Total park area is
200%+ the city
standard
Total park area is
100%-200% of the
city standard
Total park area is
within 10% of the city
standard
Total park area is
below 50% of the
city standard
Total park area is
below 100% of the
city standard
Community
Centers
Community
Centers Per
1,000
population
within 1/2 mile
of area
Portland Parks &
Recreation
Community center
presence in the
study area is 30%
greater than the
city standard for
community centers
Community center
presence in the
study area is 20%
greater than the
city standard for
community
centers
Community center
presence in the study
area is within 10% of
the city standard for
community centers
Community
center presence
in the study area
is 20% less than
the city standard
for community
centers
Community center
presence in the
study area is 30% or
more less than the
city standard for
community centers
SchoolsStudent to
Teacher Ratio
Oregon Department
of Education
Student-teacher
ratio 20%+ less than
district average
Student-teacher
ratio 5%-20% less
than district
average
Student-teacher
ratio between +5%
and -5% of district
average
Student-teacher
ratio 5%-20%
higher than
district average
Student-teacher
ratio 20%+ more
than district
average
Note: The infrastructure report card methodology is intended to prov ide the general framework for determining grades for an area. In many cases infrastructure
conditions/needs were identified through interv iews and field v isits which also assisted with the grading scheme.
Infrastructure
ElementSource Data Source
Grading

City of Portland Bureau of Planning and Sustainability Portland Infrastructure Pilot Study
March 2011
www.fcsgroup.com FCS GROUP
Table E-2. Development Readiness Report Card Grading Methodology
A B C D F
Mix of existing multi and single
family dwellings
BPS or census
estimatesOver 80%+ MF 60-80% MF 40-60% MF 20-40% MF 0-20% MF
Proximity of housing to transit
stops (within 1,200 feet)Field observations
Residents have transit stops
located close to the home
Residents are within a
moderate distance from
transit service
Residents are within
walking distance of
transit service
Residents are within walking
distance of transit service but
service is inconsistent
Residents must drive to have
access to transit services
Residential Absorption
Trends
Months until existing inventory is
absorbed
Zillow.com or
RMLSUnder 10 months 10-12 months 12-14 months 14-18 months 18+ months
Average home prices VS
Portland average (dollars per SF
of floor area)
Zillow.com or
RMLS
Within 10 % of non-central
city average
Within 20 % of non-central city
average
Within 30 % of the non-
central city average
within 40% of the non-central
city average
A 41 % + deviation from the
non-central city average
Housing Vacancy rates Census 0-2% 3-4% 5-6% 7-8% 9%+
Jobs in areaCensus - On The
Map5,000+ jobs 3,500-5,000 jobs 2,000-3,500 jobs 1,000-2,000 jobs 0-1,000 jobs
Number and type of businesses Field observationsWide mix of neighborhood
and regional establishments
Good mix of neighborhood
and regional establishments
Some mix of
neighborhood and
regional
establishments
Inconsistent mix of
neighborhood and regional
establishments
Poor mix of neighborhood
and regional establishments
Non-Residential
Absorption Trends
Commercial, office and
industrial absorption
Broker data
(Costar)
positive absorption in
industrial, retail and office
(I/R/O)
Positive absorption in two of
three categories (I/R/O)
Positive absorption in
one of three
categories (I/R/O)
Negative absorption in all
three categories (I/R/O)
Very negative absorption and
chronic vacancy rates (I/R/O)
Public Investment Activity List of projects over the past 5+
years
Private Investment ActivityList of projects and loans/grants
over past 5+ years
Development Readiness
Very few projects have
occurred over the past 10
years
Non-residential lease rates
compared to submarket
average & commercial, office
and industrial absorption
PDC and BPS
Several projects have started
or have obtained funding
over the last 5 years
Few projects have started
and are funded over the last
5 years
Few projects have
started in the last 10
years
No projects have started over
the past 10 years
Either favorable ratio
of local lease rates or
low vacancy rates
compared to
submarket
Unfavorable ratio of local
lease rates or high vacancy
rates
Very unfavorable (low) ratio
of local lease rates and
relatively high vacancy rates
compared to submarket
Business Mix
Development
Indicator Metrics
Relatively favorable ratio of
local lease rates and
somewhat low vacancy rates
compared to the submarket
Data SourceGrading Parameters
Housing Mix/Diversity
Residential Attainable
Sales/Lease & Vacancy
Rates
Non-Residential
Attainable Lease &
Vacancy Rates
Broker data
(Costar)
Favorable (high) ratio of
local lease rates and
somewhat low vacancy
rates compared to
submarket

City of Portland Bureau of Planning and Sustainability Portland Infrastructure Pilot Study
March 2011
www.fcsgroup.com FCS GROUP
Table E-2. Development Readiness Report Card Grading Methodology (continued)
A B C D F
Residential Growth
Forecast
Projected dwelling growth over
20 yearsMetro data 100+ D.U.s per year 70-100 D.U.s per year 40-70 D.U.s per year 10-40 D.U.s per year Less than 10 D.U.s per year
Employment Growth
Forecast
Projected job growth over 20
yearsMetro data
Metro projects a growth of
60 + jobs per year
Metro projects a growth of
between 40-60 jobs per year
Metro projects a
growth of between 20-
40 jobs per year
Metro projects a growth of
between 0-20 jobs per year
Metro projects negative job
growth
Remaining development
capacityPDC and BPS 90%+ 60%-90% 30%-60% 1%-30% 0%
Redevelopment FAR (potential
square feet)BPS 20,000,000+ 15-20,000,000 10-15,000,000 5-10,000,000 Less than 5,000,000
Basic Infa. Capital Cost
Requirements
Cost estimates
(see Table 28)
Capital cost: less than $10
millionCapital cost: $11-20 million
Capital cost: $21-30
millionCapital cost: $31-40 million Capital cost: $41+ million
Potential Payback Period (years
until city revenue exceeds
capitla cost)
Payback
estimates (see
Table 32)
Payback: Less than 30 years Payback: 31-40 years Payback: 41-50 years Payback: 51-60 years Payback: 61 + years
Buildout Potential
Infrastructure Return on Investment
Growth Forecast
Source: compiled by FCS GROUP.
Buildout Potential
Infrastructure Return on
Investment
Development
Indicator Metrics Data Source
Grading Parameters
City of Portland Bureau of Planning and Sustainability Portland Infrastructure Pilot Study
March 2011
www.fcsgroup.com FCS GROUP
APPENDIX F. COST DATA

City of Portland Bureau of Planning and Sustainability Portland Infrastructure Pilot Study
March 2011 Appendix F – page 1
www.fcsgroup.com FCS GROUP

City of Portland Bureau of Planning and Sustainability Portland Infrastructure Pilot Study
March 2011 Appendix F – page 2
www.fcsgroup.com FCS GROUP

City of Portland Bureau of Planning and Sustainability Portland Infrastructure Pilot Study
March 2011 Appendix F – page 3
www.fcsgroup.com FCS GROUP

City of Portland Bureau of Planning and Sustainability Portland Infrastructure Pilot Study
March 2011 Appendix F – page 4
www.fcsgroup.com FCS GROUP

www.fcsgroup.com FCS GROUP
APPENDIX G. POTENTIAL REVENUES

City of Portland Bureau of Planning and Sustainability Portland Infrastructure Pilot Study
March 2011 Appendix G – page 1
www.fcsgroup.com FCS GROUP
Potential Fiscal Revenue Forecasts, Case Study Subareas, 2011 to 2035
Total
2011 2035 2011-35
Net New Dwellings*
1. Outer Tabor Subarea 39 39 987
2. Lents Town Center 39 39 967
3. Powellhurst-Gilbert Subarea 93 93 2,336
4. Outer Division Corridor 9 9 227
Net New Employment* 2011-35
1. Outer Tabor Subarea 51 51 1,280
2. Lents Town Center 51 51 1,270
3. Powellhurst-Gilbert Subarea 19 19 470
4. Outer Division Corridor (8) (8) (212)
Net New Non-Res. Building SF** 2011 2035 2011-35
1. Outer Tabor Subarea 20,484 20,484 512,100
2. Lents Town Center 20,325 20,325 508,133
3. Powellhurst-Gilbert Subarea 7,520 7,520 187,994
4. Outer Division Corridor - - -
Notes:
* based on Metro growth forecasts from Draft Urban Growth Report, December 2009.
** assumes average of 400 square feet of building floor area per new employee.
Years 2012 to 2034 not shown
Potential Annual Net New Assessed Value Created Total
Residential 2011 2035 2011-35
1. Outer Tabor Subarea $6,709,039 $6,709,039 $167,725,967
2. Lents Town Center $6,573,158 $6,573,158 $164,328,938
3. Powellhurst-Gilbert Subarea $15,886,931 $15,886,931 $397,173,268
4. Outer Division Corridor $1,546,020 $1,546,020 $38,650,493
Non-Residential 2011 2035 2011-35
1. Outer Tabor Subarea $2,176,427 $2,176,427 $54,410,663
2. Lents Town Center $2,159,565 $2,159,565 $53,989,130
3. Powellhurst-Gilbert Subarea $798,976 $798,976 $19,974,398
4. Outer Division Corridor $0 $0 $0
Notes: assumes net new market value of $200,000 per
dwelling unit and $125 per square foot of non-residential
floor area, and 85% assessed to market value ratio.
Years 2012 to 2034 not shown
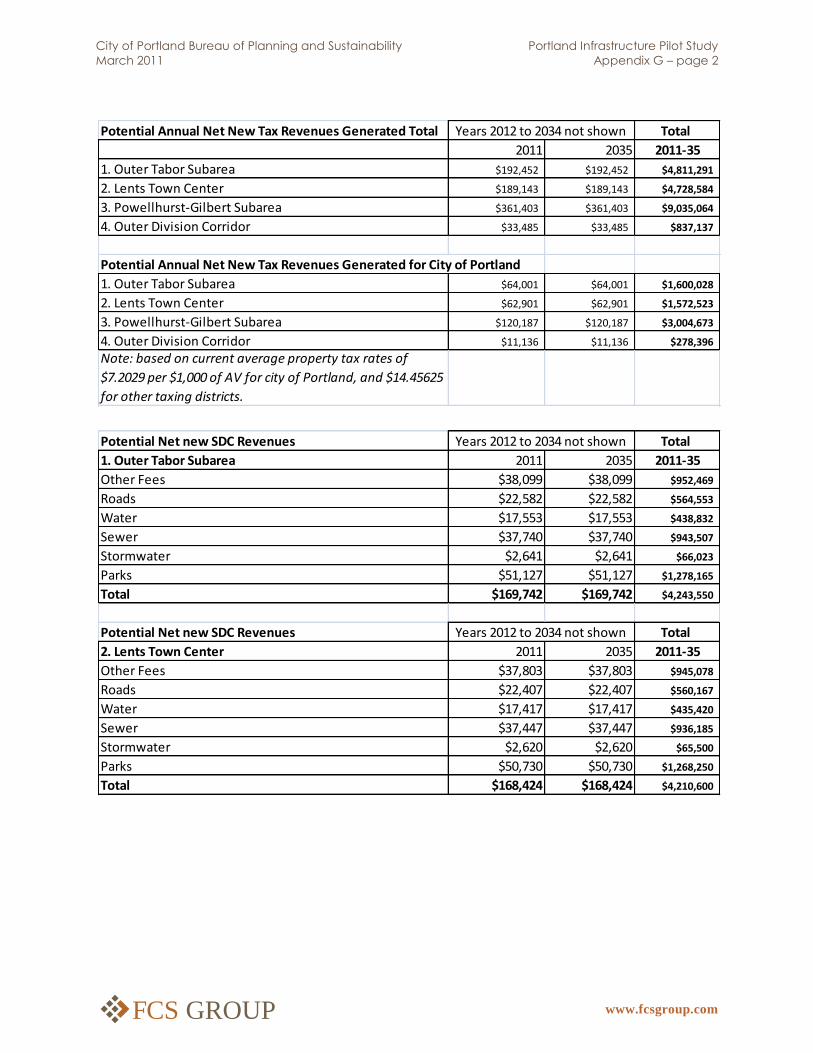
City of Portland Bureau of Planning and Sustainability Portland Infrastructure Pilot Study
March 2011 Appendix G – page 2
www.fcsgroup.com FCS GROUP
Potential Annual Net New Tax Revenues Generated Total Total
2011 2035 2011-35
1. Outer Tabor Subarea $192,452 $192,452 $4,811,291
2. Lents Town Center $189,143 $189,143 $4,728,584
3. Powellhurst-Gilbert Subarea $361,403 $361,403 $9,035,064
4. Outer Division Corridor $33,485 $33,485 $837,137
Potential Annual Net New Tax Revenues Generated for City of Portland
1. Outer Tabor Subarea $64,001 $64,001 $1,600,028
2. Lents Town Center $62,901 $62,901 $1,572,523
3. Powellhurst-Gilbert Subarea $120,187 $120,187 $3,004,673
4. Outer Division Corridor $11,136 $11,136 $278,396
Note: based on current average property tax rates of
$7.2029 per $1,000 of AV for city of Portland, and $14.45625
for other taxing districts.
Years 2012 to 2034 not shown
Potential Net new SDC Revenues Total
1. Outer Tabor Subarea 2011 2035 2011-35
Other Fees $38,099 $38,099 $952,469
Roads $22,582 $22,582 $564,553
Water $17,553 $17,553 $438,832
Sewer $37,740 $37,740 $943,507
Stormwater $2,641 $2,641 $66,023
Parks $51,127 $51,127 $1,278,165
Total $169,742 $169,742 $4,243,550
Potential Net new SDC Revenues Total
2. Lents Town Center 2011 2035 2011-35
Other Fees $37,803 $37,803 $945,078
Roads $22,407 $22,407 $560,167
Water $17,417 $17,417 $435,420
Sewer $37,447 $37,447 $936,185
Stormwater $2,620 $2,620 $65,500
Parks $50,730 $50,730 $1,268,250
Total $168,424 $168,424 $4,210,600
Years 2012 to 2034 not shown
Years 2012 to 2034 not shown

City of Portland Bureau of Planning and Sustainability Portland Infrastructure Pilot Study
March 2011 Appendix G – page 3
www.fcsgroup.com FCS GROUP
Potential Net new SDC Revenues Total
3. Powellhurst-Gilbert Subarea 2011 2035 2011-35
Other Fees $146,652 $146,652 $3,666,292
Roads $86,862 $86,862 $2,171,558
Water $67,485 $67,485 $1,687,126
Sewer $145,270 $145,270 $3,631,760
Stormwater $10,024 $10,024 $250,602
Parks $196,851 $196,851 $4,921,277
Total $653,145 $653,145 $16,328,616
Potential Net new SDC Revenues Total
4. Outer Division Corridor 2011 2035 2011-35
Other Fees $33,794 $33,794 $844,854
Roads $20,016 $20,016 $500,410
Water $15,551 $15,551 $388,778
Sewer $33,476 $33,476 $836,897
Stormwater $2,310 $2,310 $57,748
Parks $45,362 $45,362 $1,134,051
Total $150,510 $150,510 $3,762,739
Potential Franchise Fee Revenues Total
2011 2035 2011-35
1. Outer Tabor Subarea $9,636 $9,636 $240,907
2. Lents Town Center $9,462 $9,462 $236,550
3. Powellhurst-Gilbert Subarea $19,478 $19,478 $486,956
4. Outer Division Corridor $1,559 $1,559 $38,973
Notes:
Utility Franchise Fee Per Capita
Utility Franchise Fee Per EDR
Persons Per Household
Potential State Shared Tax Revenues Total
2011 2035 2011-35
1. Outer Tabor Subarea $1,984 $1,984 $49,608
2. Lents Town Center $1,944 $1,944 $48,603
3. Powellhurst-Gilbert Subarea $4,699 $4,699 $117,471
4. Outer Division Corridor $457 $457 $11,432
Notes:
Persons Per Household
State Shared Tax Revenues Per Capita
Years 2012 to 2034 not shown
Years 2012 to 2034 not shown
Years 2012 to 2034 not shown
Years 2012 to 2034 not shown
Top Related