


Languages
Pages
Legal

NOAA Technical Memorandum ERL PMEL-28
CIRCULATION IN THE LOWER COOK INLET, ALASKA
R. D. MuenchJ. D. SchumacherC. A. Pearson
Pacific Marine Environmental LaboratorySeattle, WashingtonJuly 1981
UNITED STATESDEPARTMENT OF COMMERCE
Malcolm Baldrige.Secretary
NATIONAL OCEANIC ANDATMOSPHERIC ADMINISTRATION
John V. Byrne,Administrator
EnVIronmental Researchlaboratories
Joseph O. Fletcher,Acting Director
NOTICE
The Environmental Research Laboratories do not approve, recommend, norendorse any proprietary product or proprietary material mentioned in thispublication. No reference shall be made to the Environmental ResearchLaboratories or to this publication furnished by the Environmental ResearchLaboratories in any advertising or sales promotion which would indicate orimply that the Environmental Research Laboratories approve, recoDDDend, orendorse any proprietary product or proprietary material mentioned herein,or which has as its purpose an intent to cause directly or indirectly theadvertised product to be used or purchased because of this EnvironmentalResearch Laboratories publication.
ii

CONTENTS
Page
Abstract 1
1. Introduction 11.1 Geographical Setting 11.2 Oceanographic and Meteorological Setting 2
2. Past Research 5
3. Observation Program 63.1 Current Meter Moorings 63.2 Satellite-Tracked Drifters 63.3 Wave Radar (CODAR) Observations 83.4 Temperature and Salinity Observations 8
4. Discussion 84.1 Mean Circulation and Annual
Seasonal Variations 84.2 Low-Frequency Current Fluctuations 154.3 Tidal Currents 18
5. Summary 18
6. Acknowledgements 23
7. References 24
iii

FIGURES
Figure 1. Geographical locations and bathymetry of the lowerCook Inlet region (depths in m). 3
Figure 2. Schematic of near-surface currents in the northwestGulf of Alaska region (from Muench and Schumacher,1980), with currents in the lower Cook Inlet regionderived from Muench, Mofjeld, and Charnell (1978).Numbers in parentheses give approximate range ofcurrent speeds at that location in cm/s; see textfor relation between maximum/minimum valuesand season. 4
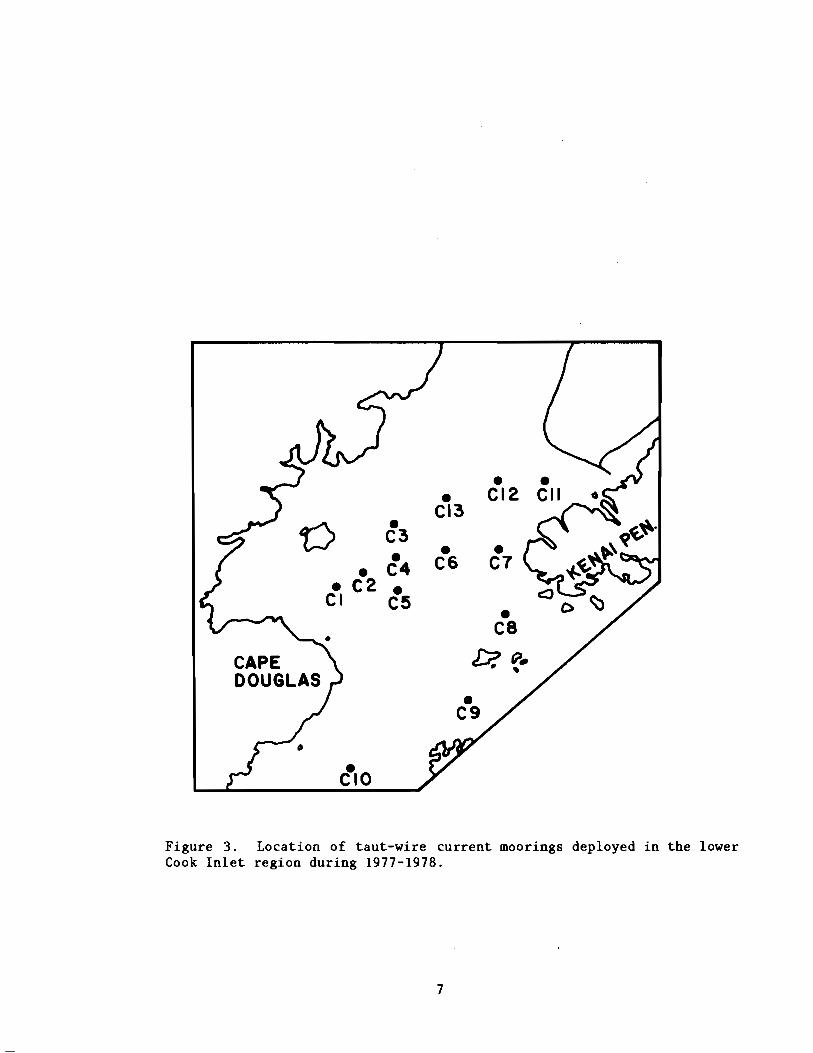
Figure 3. Locations of taut-wire current moorings deployed inthe lower Cook Inlet region during 1977-1978. 7
Figure 4. Mean current vectors for October 1977 through March1978. Lengths of arrows indicate current speeds,orientation indicates direction, and numbers neararrowheads indicate observation depths in m. 9
Figure 5. Mean current vectors for June through October 1978.Lengths of arrows indicate current speeds, orientation indicates direction, and numbers near arrow-heads indicate observation depths in m. 12
Figure 6. Seven-day mean current speeds at middepths (65-70 m)and near-surface (20-25 m) in northern Shelikof Straitat mooring C10 (after Schumacher and Reed, 1980).Mooring location is indicated on figure 3. 14
Figure 7. Representative segments of low-pass (35-hr) filtered currents from six locations at 20-m depth.Mooring locations are indicated on figure 3. 16
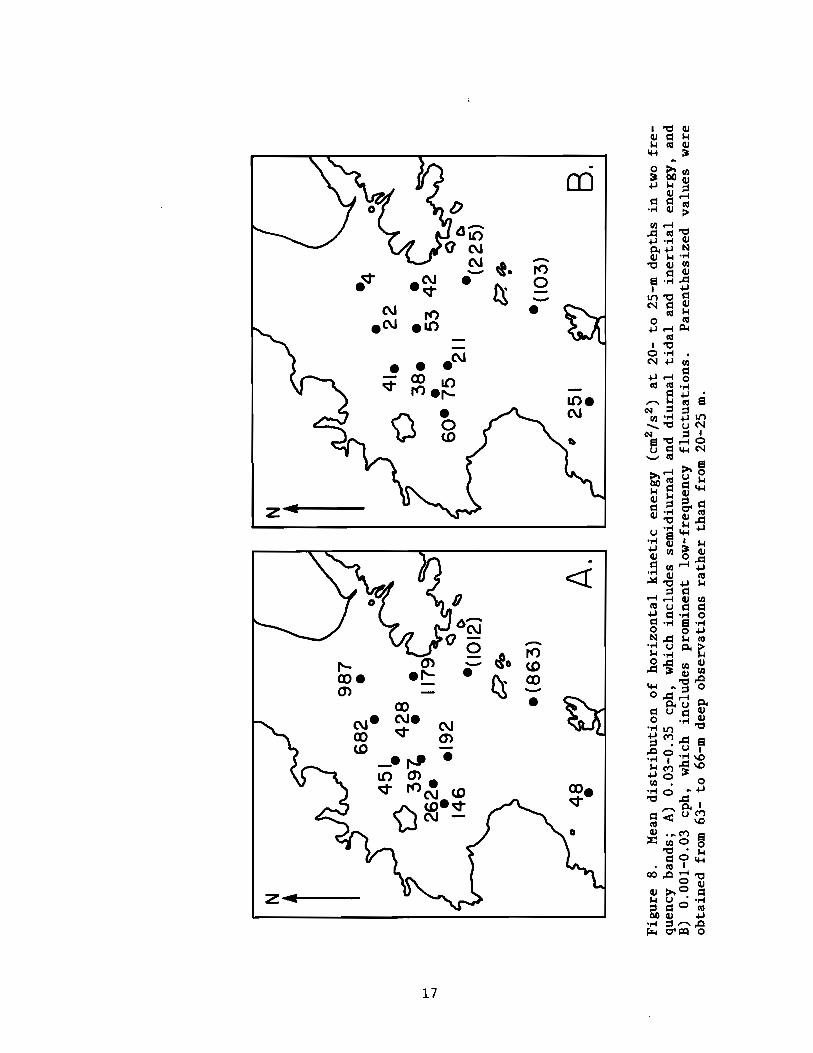
Figure 8. Mean distribution of horizontal kinetic energy(cm2/s2 ) at 20- to 25-m depths in two frequencybands; A) 0.03-0.35 cph, which includes semidiurnal and diurnal tidal anq inertial energy, andB) 0.001-0.03 cph, which includes prominent low-frequency fluctuations. Parenthesized values were obtained from 63- to 66-m deep observations ratherthan from 20-25 m. 17
Figure 9. Trajectories of drogued, satellite-tracked buoys deployed in 1978. Locations are plotted at I-day in-tervals. 19
Figure 10. Example of 24-hr mean surface currents observed inJuly 1978 using the doppler-shift radar unit discussedby Barrick, Evans, and Weber (1977). Data are courtesy of Dr. A.S. Frisch (Wave Propagation Laboratory,NOAA). 20
iv

TABLES
Table 1. Data for lower Cook Inlet current moorings. 10
Table 2. Tidal current components for four major species derivedfrom current data using the Hunk-Cartwright responsemethod (Hunk and Cartwright, 1966); H is amplitude(cm/s), G is phase relative to Greenwich (0), D isdirection of major axis (OT), and R is sense of ro-tation (C for clockwise, A for anticlockwise). 22
v

CIRCULATION IN THE LOWER COOK INLET, ALASKAI2R. D. Muench, J. D. Schumacher, and C. A. Pearson
Abstract
Circulation in the lower Cook Inlet region has been described anddiscussed utilizing current observations obtained during October 1977October 1978. The major circulation feature was a mean westerly flowwhich entered the region via Kennedy and Stevenson entrances, paralleledthe 100-m isobath through the lower Inlet then exited the system viaShelikof Strait. Summer mean current speeds in this flow were 10-15cm/s; winter speeds were 25-30 cm/s. A secondary circulation featurewas present as southward flow which occupied the western portion of thelower Inlet. Summer current speeds here were 15-20 cm/s, while winterspeeds were of order 10 cm/s. The westerly flow is driven in summerprimarily by a baroclinic field consequent to coastal freshwater input(the Kenai Current), while in winter this flow is driven to a greaterextent by wind-driven coastal convergence and possibly by an alongshorepressure gradient set up by the Alaskan Stream. The southward flow,driven by freshwater input into upper Cook Inlet, therefore is larger insummer when this input is greater. Mean flow in the eastern lower Inletwas weak and variable in all seasons.
Low-frequency and tidal flow fluctuations were superposed upon themean flow and in regions of low mean speeds controlled the instantaneousflow. The low-frequency fluctuations were associated with westerly flowthrough the system, and probably originated through meteorologicaldisturbances on the continental shelf outside the Inlet. Tidal currentswere large (70-100 cm/s) and primarily semidiurnal in the eastern portion of the lower Inlet and in Kennedy and Stevenson entrances. In thewestern Inlet, tidal currents were only half this magnitude, and inShelikof Strait they were very small due to presence of an antinode nearthe mooring in northern Shelikof Strait. Tidal currents were alignedwith the local channel bathymetry.
1. Introduction
This paper presents and discusses new data which have allowed abetter definition of the regional flow field in the lower Cook Inletregion. These data include current observations from taut-wire moorings, drogued surface buoy trajections, doppler-shift radar surfacecurrent observations, and hydrographic measurements, and were obtainedduring an intensive field program in 1977-78. This field program wasconceived primarily to aid in prediction of spilled contaminant fatesand trajectories in light of the projected petroleum exploration anddevelopment in lower Cook Inlet.
1.1. Geographical Setting
Cook Inlet is a broad (70-90 km), shallow (mean depth about 60 m),elongate embayment protruding northeastward from the confluence of
lContribution No. 531 from the NOAA Pacific Marine Environmental Laboratory2Science Applications, Inc., Bellevue, Washington

Shelikof Strait and Kennedy and Stevenson entrances (fig. 1). Theportion which we refer to as lower Cook Inlet is bounded on the north bythe Forelands and on the south by Kennedy and Stevenson entrances andnorthern Shelikof Strait. At the northern end of this region, KalginIsland and its associated shoals inhibit water flow. In the centralportion of the lower Inlet, bottom depths are 60-80 mj depths decreasegradually toward the coastline to the east and west. Depth increases tothe south in regular fashion except for a prominent ramplike featurewhich traverses the Inlet from east to west in arcuate fashion approximately along the 100-m isobath. Maximum depths in the lower Inlet occurin a depression just west of Stevenson Entrance.
The coastline surrounding lower Cook Inlet is extremely mountainousand rises abruptly to elevations of 2000-3000 m along the northernshores of Cook Inlet and Shelikof Strait. The coastal mountains aretransected by numerous valleys, many of which contain glaciers or snowfields at their heads.
1.2 Oceanographic and Meteorological Setting
The major oceanic circulation feature in the northwest Gulf ofAlaska is the Alaskan Stream, a southwestward-flowing current which liesalong the shelf break southeast of Kodiak Island (fig. 2). This flowhas been characterized by Favorite (1967) on the basis of temperatureand salinity data as a western boundary current, which acts as thereturn flow for the Gulf of Alaska subarctic gyre, and by Thomson (1972)based upon theoretical considerations. Reed (1980) has verified theclosed circulation in the Gulf of Alaska gyre using tracks from satellite-tracked, drogued buoys. Peak surface speeds in the Alaskan Streamare of order 100 cm/s, and Reed and Taylor (1965) have presented someevidence that the flow is in geostrophic equilibrium. Ohtani (1970) andFavorite (1974) concluded that there was little seasonal variation inbaroclinic transport in the Stream, while Reed, Muench, and Schumacher(1980) came to a similar conclusion and derived a mean annual baroclinicvolume transport of 12 x 106 m3 /s.
The prominent shelf circulation feature is the Kenai Current, a 20to 30-km wide westerly baroclinic coastal flow which is driven by freshwater input from continental drainage (Schumacher and Reed, 1980). Thisflow originates in the vicinity of the Copper River, east of the lowerCook Inlet region, enters primarily via Kennedy Entrance, and exits tothe southwest via Shelikof Strait. It has a large seasonal signal,unlike the Alaskan Stream, varying from a winter low baroclinic volumetransport of about 0.3 x 10⁶ m3 /s to an autumn high of about 1.0 x 10⁶
m3 /s with corresponding surface speeds of 15-30 cm/s to more than 100cm/s.
The shelf region between the Alaskan Stream and the Kenai Currentis occupied by Kodiak Island and adjacent banks and is characterized byweak and variable circulation. Despite the intervention of this band ofsluggish circulation, Muench, Mofjeld, and Charnell (1978) have speculated that the alongshore pressure gradient associated with the AlaskanStream drives a significant barotropic volume transport through thelower Cook Inlet system. It now appears, in addition, that at certain
2

SCalE \ 1'0,000
153·
60·
152·153·
JO NOullCQI Mil,.
Ii! I,1°
~(l
~
CONTOUR INTfftYAL - ~ "ETER,
10
\r.,~
'\. '7 ALASICA~-
• 0
LOWER COOK INLET. ALASKABATHYMETRY
so..rc•• : "Itt, 11o, Geo,tl,.1H1 Diw'lion U S"'''ieD! I.,.' ....', C.....n.lI... OI.. IIIOIl,Alle_ I••~o, use. Q S."'OO,.. S , •• Illd .''i Soa SOU"GI'1t7. Cni.. Dati.
'01011110, A..... Ka"' .. l ... , ...... Oil' h ••I, T p.A,rll.1177, U $. G.OIOGiCOI aur.,.,. ,"OCltk:Arctic ',o!'le" ., ".rilll GOOlot'. "."10Par'. COlj'O"IICl
60·
Figure 1. Geographical locations and bathymetry of the lower Cook Inletregion (depths in m).
3

GULF OFALASKA
o 50 100, , ,
Ki lometers
Figure 2. Schematic of near-surface currents in the northwest Gulf ofAlaska region (from Muench and Schumacher, 1980), with currents in thelower Cook Inlet region derived from Muench, Mofjeld, and Charnell(1978). Numbers in parentheses give approximate range of current speedsat that location in cm/s; see text for relation between maximum/minimumvalues and season.
4

times of the year an appreciable flow occurs through lower Cook Inlet asthe Kenai Current (Schumacher and Reed, 1980).
Regional meteorology is dominated by the Aleutian atmosphericlow-pressure system. Winter intensification of this system results innortheasterly migration of intense low-pressure cells, manifested ascyclonic storms, along the shelf break region southeast of Kodiak Island. These storms lead to easterly winds along the coast. Weakeningof the Aleutian Low in summer leads to a decrease in storm frequency andintensity; consequently local winds become weak and variable. Airtemperatures are frequently below OOC in winter, but rise to well abovefreezing in summer. A summary of climatological data for the northernGulf of Alaska has been prepared by Brower and others (1977).
Within the lower Cook Inlet region, rugged land topography exerts amarked control over local winds and leads to complex flow patterns(Macklin and others, 1979). Winds in lower Cook Inlet show preferreddirectional channeling through gaps in the surrounding mountains formedby Cook Inlet-Shelikof Strait and Kamichak Bay (and an associated gap inthe mountains to the west), and Kennedy and Stevenson entrances. It isimpossible, as a consequence of the complex interactions between windand topography, to predict winds in lower Cook Inlet on the basis ofknowledge of the large-scale wind field.
Freshwater input affecting lower Cook Inlet is derived both fromcoastal runoff east of Kennedy Entrance, as discussed by Schumacher andReed (1980), and from river input into upper Cook Inlet. Gauged riverinput to upper Cook Inlet attains a maximum mean value in excess of 2500m3 /s in June-August and is an order of magnitude smaller during thewinter months of November-April (Muench et al., 1978).
Sea ice does not appear to play a significant role in the physicaloceanography of lower Cook Inlet. It forms primarily in the upperInlet, where low winter air temperatures and a relatively high freshwater content combine to create conditions favorable to ice formation.This ice is then advected southward in the western lower Inlet by thecurrents, sometimes being found as far south as Cape Douglas. Duringparticularly severe winters, ice may additionally form locally in embayments such as Kachemak and Kamishak bays.
2. Past Research
Previous knowledge of the water circulation in Cook Inlet has beenlimited because measurements were insufficient to define the mean flowfield. Early field observational efforts were related to pollution fromindustrial activities and were confined primarily to the upper portionof the Inlet (e.g., Kinney and others, 1970a; 1970b). Studies relatedto fisheries resources have used surface drifter trajectories to estimate the near-surface circulation in Kachemak Bay (Knull andWilliamson, 1969) and in the lower Inlet (Burbank, 1977). Landsat data,which can qualitatively indicate the presence of suspended sediments insurface waters, have led to estimates of surface circulation patterns inCook Inlet (Wright and others, 1973 j Gatto, 1976). A numerical modelwas constructed for the tides in Cook Inlet by Matthews and Mungall
5

(1972); this model focused, however, upon the upper Inlet and did notprovide adequate resolution of tidal currents in the lower Inlet. Mostrecently Muench, Mofjeld, and Charnell (1978) used current, temperature,and salinity data obtained in 1973 by the National Ocean Survey of NOAAto qualitatively discuss nontidal circulation and hydrography in thelower Inlet. They characterized mean circulation as dominated by twoprimary currents: a westerly flow inward through Kennedy and Stevensonentrances across the lower Inlet and out through Shelikof Strait, and asoutherly flow in the western lower Inlet driven by freshwater input tothe upper Inlet (see fig. 2). Outside these two major flows, meancurrents were characterized as weak and variable. The mean currents hadlarge superposed fluctuations with time scales of several days, but thedata were inadequate to define the nature and source of these fluctuations.
3. Observation Program
3.1 Current Meter Moorings
Our analysis utilizes current data obtained from taut-wire moorings(fig. 3). Geographical coordinates of each mooring, observation depths,deployment dates, record lengths, and basic record statistics are givenin table 1. Aanderaa Model RCM-4 current meters with sampling intervals of 15 or 20 minutes were used. Raw data were filtered to removehigh-frequency noise; this filter passed more than 99% of the amplitudeat periods greater than 5 hrs, 50% at 2.86 hrs and less than 0.5% at 2hrs. The resulting series were then either used for tidal analyses asdicussed below or further filtered to remove the tidal energy. Thesecond filter passed more than 99% of the amplitude at periods greaterthan 55 hrs, 50% at 35 hrs and less than 0.5% at 25 hrs. Details ofthis processing are discussed in Charnell and Krancus (1976).
Surface wave-induced contamination of the uppermost current recordson each mooring, as discussed by Halpern and Pillsbury (1976) and Mayer,Hansen, and Ortman (1979) did not appear to be significant in our records. Consecutive 29-day tidal analyses were run for several mooringsin the northern Gulf of Alaska (Pearson, Schumacher, and Muench, 1981)Computed M2 speeds showed a statistically insignificant summer-winterdifference, implying that the seasonally averaged, low-frequency currents were not significantly affected by wave-induced mooring noise.
3.2 Satellite-Tracked Drifters
Surface buoys having subsurface window-shade drogues were deployedupstream from (to the east of) lower Cook Inlet and tracked through theInlet. The buoys were fiberglass spars about 5 m long attached to 2-m x10-m window-shade drogues by 30-m nylon tethers to yield a center ofdrogue resistance near a depth of 35 m. Location was determined towithin about 4 km by means of the Random Access Measurements System ofthe Nimbus-6 satellite (Levanon, 1975). Because of ambiguities in thelocating mechanism and additional errors such as fluctuations in satellite orbit, the positions were passed through a subjective analysisroutine (Royer et aI., 1979) which resulted in a set of trajectoriesretaining time scales of about two days but in which tidal, inertial,and other rapid accelerations were suppressed.
6
•• CI2Cl3
0 •C3• •• C6 C1• C4
• C2 •CI C5 •C8
l:i? ~.,
Figure 3. Location of taut-wire current moorings deployed in the lowerCook Inlet region during 1977-1978.
7

3.3. Wave Radar (CODAR) Observations
Surface currents were investigated using a doppler-shift radarmethod which was described in detail by Barrick. Evans. and Weber(1977). This method utilized the doppler shift of surface waves underthe effect of a current to derive an instantaneous picture of surfacecurrents over a wide area. an observation virtually impossible by othermeans. These observations encompassed the region just off Kachemak Bayand the area between Cape Douglas and Augustine Island. They were shortin duration compared to the moored current measurements. one week orless. and provided both instantaneous and daily mean values of surfacecurrents.
3.4 Temperature and Salinity Observations
Temperature and salinity data were obtained from shipboard usingPlessey Model 9040 conductivity/temperature/depth profiling systems.Data were recorded during the downcast. and descent rate was held to 0.5m/s to minimize error due to thermal sensor lag. The data were calibrated at frequent intervals using reversing thermometers and a portable shipboard salinometer calibrated with standard seawater.
4. Discussion
4.1 Mean Circulation and Seasonal Variations
Mean current speeds and directions have been computed for eachdeployment period using the low-pass (35-hr) filtered data (table 1 andfigs. 4-5). It is apparent upon comparison between figures 4-5 andfigure 2 that these observations support the circulation pattern proposed. based upon limited data obtained in sununer 1973. by Muench.Mofjeld. and Charnel! (1978). In addition. they provide speeds whichcan be used to quantify the lower Inlet flow regimes.
The prominent circulation feature was the westerly current enteringthe lower Inlet via Kennedy and Stevenson entrances. roughly parallelingthe 100-m isobath across the lower Inlet. then exiting the Inlet throughShelikof Strait. The highest mean current speeds observed in the lowerInlet (20-30 cm/s) occurred in this current during winter 1977-78 (fig.4); speeds were only slightly less during sununer (fig. 5). In additionto the westward flow. a well-defined secondary circulation feature waspresent throughout the year as a southward current in the western lowerInlet; SUDDller speeds in this current were about 20 cm/s. while winterspeeds were about half this value. Compared with these two currentsystems. circulation in the eastern half of the lower Inlet off KachemakBay and the Kenai Peninsula was sluggish. with current speeds of 14 cm/sand a weakly defined northward drift at the easternmost moorings.Currents showed a pronounced tendency to parallel isobaths and thusconserve potential vorticity, as hypothesized by Muench. Mofjeld, andCharnell (1978).
The data were inadequate to observe vertical shear, because at allmoorings except C10B the lower meter was sufficiently close to thebottom to place it within the influence of the benthic boundary layer(cf. Bowden, 1978). These near-bottom current observations probablyreflected a frictional influence not related to forcing mechanisms for
8

Augustine I.
o
Shuyak I.
N
-/ -... .......
"\100
em/secIii iii
o 10 20 30Depths in meters
Figure 4. Mean current vectors for October 1977 through March 1978.Lengths of arrows indicate current speeds, orientation indicates direction, and numbers near arrowheads indicate observation depths in ID.
9
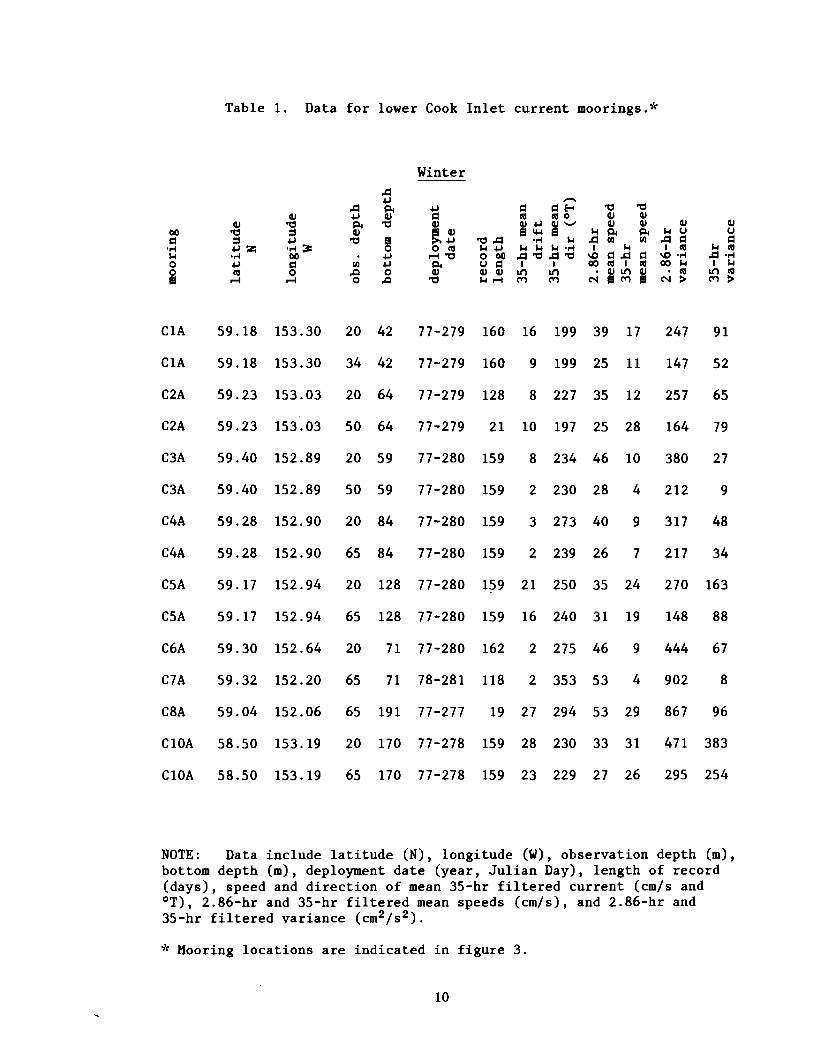
Table 1. Data for lower Cook Inlet current moorings.*
Winter.c:loIoJ ,.....
.c:l !=lo. oIoJ l:l l:lf-t "1:l "1:l~ oIoJ ~ l:l III III 0 ~ ~
~ "1:l !=lo. "1:l ~ ~oIoJ ~'-' ~ ~ ~ ~
00 "1:l ::s ~~~
Ell+-l Iol !=lo. !=lo. Iol (J (J
l:l ::s oIoJ "1:l~
"1:l.c:l '.-1 Iol .c:l u:l u:l .c:l l:l l:l'.-1 oIoJ:Z; '.-1 ~ o III lololoJ Iol Iol Iol '.-1 I Iol I III Iol IIIIol •.-1 00 oIoJ r-l"1:l o 00 .c:l"1:l.c:l"1:l \Cl l:l.c:l l:l \0 '.-1 .c:l '.-10 oIoJ l:l u:l oIoJ !=lo. (J l:l I I CIO III I III CIO Iol I Iol0 III 0 ,Q 0 ~ ~ ~ tI'l tI'l . ~tI'l ~ • III tI'l IIIEl r-l r-l 0 ,Q "1:l Iolr-l M M C'l ElM El C'l > M >
CIA 59.18 153.30 20 42 77-279 160 16 199 39 17 247 91
CIA 59.18 153.30 34 42 77-279 160 9 199 25 11 147 52
C2A 59.23 153.03 20 64 77-279 128 8 227 35 12 257 65
C2A 59.23 153.03 50 64 77-279 21 10 197 25 28 164 79
C3A 59.40 152.89 20 59 77-280 159 8 234 46 10 380 27
C3A 59.40 152.89 50 59 77-280 159 2 230 28 4 212 9
C4A 59.28 152.90 20 84 77-280 159 3 273 40 9 317 48
C4A 59.28 152.90 65 84 77-280 159 2 239 26 7 217 34
C5A 59.17 152.94 20 128 77-280 159 21 250 35 24 270 163
C5A 59.17 152.94 65 128 77-280 159 16 240 31 19 148 88
C6A 59.30 152.64 20 71 77-280 162 2 275 46 9 444 67
C7A 59.32 152.20 65 71 78-281 118 2 353 53 4 902 8
C8A 59.04 152.06 65 191 77-277 19 27 294 53 29 867 96
C10A 58.50 153.19 20 170 77-278 159 28 230 33 31 471 383
C10A 58.50 153.19 65 170 77-278 159 23 229 27 26 295 254
NOTE: Data include latitude (N), longitude (W), observation depth (m),bottom depth (m), deployment date (year, Julian Day), length of record(days), speed and direction of mean 35-hr filtered current (cm/s and°T), 2.86-hr and 35-hr filtered mean speeds (cm/s), and 2.86-hr and35-hr filtered variance (cm2/s 2 ).
* Mooring locations are indicated in figure 3.
10

Table 1. Continued Summer
28
GJUc:l
~ co..cl ....I ~
I/") CO('f) >
'0GJGJ GJPo. ~ uII) ..c c:l
I co\0 ....00 ~
·coN >
9 204 32 10 1638778-148
lIJ,.Qo
18 40
GJ'0::s+J....oo~c:lo
...-I
153.31
GJ'0::s+J·... z+Jco
...-I
59.18
00c:l....~
ooe
CIB
CIB 59.18 153.31 35 40 78-148 143 4 193 18 6 84 15
C2B 59.23 153.13 18 62 78-148 143 15 218 41 17 416 84
C3B 59.41 152.89 25 64 78-148 143 17 232 52 19 604 55
C3B 59.41 152.89 55 64 78-148 97 1 95 25 4 180 8
C4B 59.28 152.92 19 83 78-150 138 3 246 26 6 552 27
C4B 59.28 152.92 64 83 78-150 141 1 158 27 7 199 29
C5B 59.17 152.90 27 135 78-148 115 19 252 45 23 797 258
C5B 59.17 152.90 127 135 78-148 123 2 200 15 6 85 23
C6B 59.31 152.63 26 77 78-148 142 1 256 46 7 519 39
C6B 59.31 152.63 71 77 78-148 143 3 119 25 5 193 12
C7B 59.31 152.18 17 68 78-148 142 4 310 72 7 1505 42
C7B 59.31 152.18 62 58 78-148 142 2 237 39 4 598 5
C8B 59.03 152.06 63 190 78-149 138 22 287 62 24 1608 354
C8B 59.03 152.06 179 190 78-149 138 8 259 40 9 262 20
C9B 58.78 152.27 66 124 78-149 138 11 300 53 13 966 103
C9B 58.78 152.27 114 124 78-149 138 11 301 34 12 363 75
CI0B 58.50 153.20 25 175 78-148 134 14 222 20 18 183 118
CI0B 58.50 153.20 70 175 78-148 134 12 221 17 15 120 94
CI0B 58.50 153.20 165 175 78-148 134 4 200 11 9 67 49
CIIA 59.56 151.66 82 87 78-149 20 1 334 10 2 14 1
C12A 59.53 152.23 20 50 78-148 81 4 42 55 5 991 4
C12A 59.53 152.23 46 50 78-148 141 4 30 43 5 652 4
C13A 59.47 152.68 26 68 78-148 141 5 189 60 9 704 22
11

Augustine I.
CO
L,16525 70
Shuyak I.
/-- .......
"\100
em/sec1111111o 10 20 30
Depths in meters
N
Figure 5. Mean current vectors for June through October 1978. Lengthsof arrows indicate current speeds, orientation indicates direction, andnumbers near arrowheads indicate observation depths in m.
12

the flow. Variations in flow direction with depth appeared to be small,at locations where mean speeds were high, except at moorings C5B, C8B,and CI0B where near-bottom currents were rotated 2050° to the left ofthe overlying flow. These directional deviations were in the correctsense to be a combination of veering caused by the benthic boundarylayer and bathymetric steering. There appeared to be no consistentdirectional relationship between upper- and lower-level currents in theeastern lower Inlet, where flow was sluggish.
Seasonal variations in the currents in lower Cook Inlet were pronounced. The westerly mean flow through the region was about twice asgreat in winter as during summer at mooring CI0 in northern ShelikofStrait, but this difference was not evident within the same flow regimefarther east either in central lower Cook Inlet (C5). Summer currentspeeds at the latter location are probably heavily influenced by thesummer flow maximum in the Kenai Current. This current is baroclinicand attains peak speeds in September-October (Schumacher and Reed,1980). It is also only 1015 km wide, and would not necessarily be fullyreflected at mooring CI0 in the center of Shelikof Strait, about 20 kmoffshore. The large winter mean current speed resulted from midwinterwind-driven coastal convergence and possibly from increased barotropicflow in the Gulf of Alaska gyre which would be expected, through itsassociated alongshore sealevel slope. A similar mechanism has beensuggested for mean flow in the mid-Atlantic Bight (Beardsley and Winant,1979) . The bimodal nature of the winter and late summer flow peaksshows clearly in figure 6, which presents the 7-day averaged currentspeeds from mooring CI0; the October runoff-driven peak is evident inboth 1977 and 1978, as is the February-March 1978 peak driven by increased alongshore wind stress (Schumacher and Reed, 1980). A period ofrelatively low current speeds (1520 cm/s) occurred during the NovemberDecember 1977 period between the two maxima. Minimum speeds of 510 cm/soccurred during June-August 1978, a period during which both baroclinicand barotropic forcing of the southwestward, alongshore flow were small.
Seasonal variations were present also in the southerly flow whichoccupied the western lower Inlet. Just seaward of the 50-m isobath(moorings C2 and C3), summer current speeds were nearly twice as greatas in winter (about 16 as compared to 8 cm/s). The inverse was trueshoreward of 50 m (mooring Cl). Increased summer flow at C2 and C3 wasa consequence of larger freshwater input to the upper Inlet duringsummer and autumn than during winter. It is unclear why the summerspeed increase at C2 and C3 was not reflected at Cl. The increase mayreflect an offshore migration of the core of the southerly flowingcurrent, so that Cl during summer fell shoreward of the locus of maximumcurrent speeds. Moorings C2 and C3 behaved similarly because they layalong the same isobath (about 69 m).
Data from the area of sluggish flow in the eastern lower Inlet wereinadequate to define seasonal differences because too few data wereobtained there during winter. Observations from the upper layer (17-26m, depending upon the specific mooring) suggest, however, that speedswere higher by about a factor of two in summer than during winter. Thiswould be consonant with higher current speeds during summer caused bythe Kenai Current.
13

CR
OS
S-S
HE
LF
o5O
::J CL
_U
I" • ...~
25
zE
I&J
..1
1:_
II:
::J
oU
IO
CT
IS
EP
TIA
UG
IJU
LY
.".
~
~--o
CIO
:70
mS
he
liko
fS
tra
it..
....
...C
I0:2
5m
•...-
-.L\.
....
.4
,,
II
I
"v'~
.,,/,'7"·
IJU
NE
~-OC8B:
84
mK
llllle
d,
Ent
ranc
e"'C
.:
66
mS
t..e
ftlO
llE
lltra
nce
e'\
0--0
."0
.,0
,r
~"e...-~
IlIA
..F
EB
JAN
1.7
8D
EC
II
II
I
NOV
19
77
7S
0 I&J
I&J
A~~50 ..
...' zE ~~25
II:
::J U
0
2.0 1.0 0
NE
-1.0
~4
.0c ,... ~
BU
I3
.0U
II&
JII
:
......
...~
UI
2.0
0 z ~1.
0 0
-1.0
-2.0
Fig
ure
6.
Sev
en-d
aym
ean
curr
ent
spee
ds
at
mid
dep
ths
(65-
70m
)an
dn
ear-
surf
ace
(20-
25m
)in
no
rth
ern
Sh
elik
of
Str
ait
at
moo
ring
CI0
(aft
er
Sch
umac
her
and
Ree
d,1
98
0).
Moo
ring
locati
on
isin
dic
ate
don
fig
ure
3.

4.2 Low-Frequency Current Fluctuations
Prominent low-frequency fluctuations were superposed on the meanflow in the lower Cook Inlet region. These fluctuations had time scalesof 1-2 weeks and magnitudes of the same order as, and at times greaterthan, the mean flow. They affected both speed and direction, though inthe regions of strong mean flow the effect was primarily on speed withlittle directional deviation. The nature of the fluctuations is illustrated in the representative time-series segments of several recordsfrom lower Cook Inlet (figure 7); they are also evident in the 7-daymean speeds shown on figure 6. Computations of horizontal kineticenergy reveal that in the region of strong westerly flow about 50% ofthe nontidal energy was contained in low-frequency fluctuations. Inlower Cook Inlet north of the westerly flow, 80-90% of the nontidalenergy was contained in the fluctuating flow. The fluctuations therefore exerted a dominant effect upon instantaneous currents. At mooringC5, for example (fig. 7), directional variations of nearly 90° andspeeds of up to about 75 cm/s were associated with these fluctuations.At mooring C4, which during summer indicated virtually zero mean flow,instantaneous currents were controlled entirely by the fluctuating andtidal components.
The distribution of low-frequency horizontal kinetic energy inlower Cook Inlet indicates that the fluctuations were associated withthe prominent westerly flow (fig. 8). The greatest low-frequency horizontal kinetic energy (>200 cm2/s 2 ) was present in this westerly flow,except in Stevenson Entrance where values were about half this. Valuesdropped off sharply northward into the Inlet to less than 100 cm2/s2.Within the lower Inlet north of the 100-m isobath, values were highest(60-70 cm2/s 2 ) in the western portion and decreased monotonicallyeastward to a low of 4 cm2/s 2 off Kachemak Bay.
While it is possible to identify the westerly current as the probable locus of low-frequency fluctuations, comparisons between the different moorings revealed a confused pattern of correlation betweenfluctuations at different locations. For example, a northerly flowevent on about 25 October 1977 at moorings Cl, C2, and C4 (fig. 7) wasnot reflected in records from the other moorings. Records from mooringC3, in particular, showed little correlation with events elsewhere inthe lower Inlet. As a quantitative check of the results of these visualcorrelations, horizontal coherencies were computed between the 20-mcurrent records; the resulting coherencies were uniformly low, in support of the visual correlation results.
As for the horizontal case, both visual inspection and coherencycomputations yielded inconsistent results for vertical correlations.The currents were vertically highly coherent at mooring Cl, whereas atC3 and C4 there was virtually no vertical coherency. Other mooringsfell between these extremes, but showed no detectable pattern of horizontal variation.
The source of the low-frequency fluctuations observed in lower CookInlet is uncertain. Comparison between selected major flow events andmeteorological parameters was inconclusive, primarily because the latterparameters were too incomplete to yield a meaningful comparison. An
15

BCD ,j
,!f
~--
~CD~~
--CD
j~ r~o~ aI\)
~S2CD
I\) "
z ~ ~ J0
,..;;;
rii ~ ~ICD Y 1 f--CD~~ , .....
I(~...CD
I i~ ~1,I~ III
~ ~
I\) I I I J I I I i I I Iii i I i I I, IiCD .!. g G ~ g G .!. g G g G ~ g G
I g G@: @: G~ENT (em/sec)
S ~.
Figure 7. Representative segments of low-pass (35-hr) filtered currentsfrom six locations at 20-m depth. Mooring locations are indicated onfigure 3.
16
B.
·4
c;)~~
·(2
25
)
&:?
'!-
.(10
3)
251 •
o41
."22
38
.•
•6
0.~5.
534
221
1
N 1
A.
98
7 •
()C>-~
.(10
12)
c:?'
!f>•
(86
3)
48 •
68
2 •4
51
.4
28
•o
39~
•11
792~2
••
192
146
N 1I-
'-..
..l
Fig
ure
8.
Mea
nd
istr
ibu
tio
no
fh
ori
zo
nta
lk
ineti
cen
erg
y(c
m2/s
2)
at
20
-to
25-m
dep
ths
intw
ofr
e
quen
cyb
and
s;A
)0
.03
-0.3
5cp
h,
whi
chin
clu
des
sem
idiu
rnal
and
diu
rnal
tid
al
and
inert
ial
ener
gy
,an
dB
)0
.00
1-0
.03
cph
,w
hich
incl
ud
esp
rom
inen
tlo
w-f
req
uen
cyfl
uctu
ati
on
s.P
aren
thes
ized
val
ues
wer
eo
bta
ined
from
63
-to
66-m
deep
ob
serv
atio
ns
rath
er
than
from
20-2
5m
.

environmental buoy moored in the lower Inlet and intended to providemeteorological data for comparison with the current records malfunctioned, and the complex local interaction between winds and topographyprecluded use of the regional atmospheric pressure fields to deducewinds over the lower Inlet. Research on other embayments has shown thatthese fluctuations are a common feature, and that such systems arestrongly responsive to atmospheric forcing on the outlying continentalshelf (Wang and Elliott, 1978; Wang, 1978; Winant and Beardsley, 1979;Holbrook, Muench, and Cannon, 1980). Such forcing is clearly presentoff lower Cook Inlet in the form of cyclonic low-pressure storms whichmigrate northeastward in the Gulf of Alaska. It is also possible thatflow fluctuations may be driven by the cross-shelf propagation of mesoscale eddies or meanders associated with the highly energetic AlaskanStream, which follows the shelf break south of Kodiak Island. Data fromthe Alaskan Stream are, however, inadequate to test this hypothesis.
4.3 Tidal Currents
The tidal currents in lower Cook Inlet are of the mixed type,primarily semidiurnal (M2). The highest currents occurred in Kennedyand Stevenson entrances (mooringsC8 and C9), where M2 amplitudes wereabout 70 cm/s. Within the lower Inlet farther north, currents werehigher in the eastern part (about 100 cm/s at mooring C7) than in thewestern portion (30-40 cm/s at C1-C4). No evidence was found of theextremely low tidal currents reported for one station in central lowerCook Inlet by Muench, Mofjeld, and Charnell (1978). The currents wereoriented approximately parallel to the axis of the Inlet. There is anantinode in the M2 tidal wave in northern Shelikof Strait, where thewave entering lower Cook Inlet around the north end of Afognak Islandmeets the wave that has entered the system via the south end of ShelikofStrait. This antinode is located close to mooring C10, consequently,the M2 current at C10 was extremely weak (about 8 cm/s) relative tothose elsewhere in the region.
The diurnal (K l ) tidal current exhibited more uniform and lowerspeeds (5-10 cm/s) than the M2. As for the M2 tide, there was an antinode in northern Shelikof Strait which led to extremely weak KI currents(about 2 cm/s) at mooring C10.
The tendency for tidal currents to be larger in the eastern than inthe western lower Inlet is demonstrated in Figure 8A. The energy in thetide-containing band was as much as five times greater in the easternthan in the western Inlet, and about twenty times larger· in KennedyEntrance than in northern Shelikof Strait near the M2 and Kl antinodes.
5. Summary
The major mean circulation feature in the lower Cook Inlet regionis the westerly flow. This can be graphically summarized by referenceto two additional sources of data; trajectories from satellite-tracked,drogued buoys which were followed through the system in summer 1978(fig. 9) and the results of an experiment carried out in July 1976 usinga doppler-shift wave radar method (fig. 10). Drogue 1775 closely followed isobaths through the lower Inlet to a point off Cape Douglas,while drogue 1421 entered through Kennedy Entrance and showed primarily
18

1500
o 1473• 1775t:::. 1450A 1421
23May
\· r···· . ..,,· .
:",-:" ''''.,'; \.:,
t·····.... ···
59.00
Figure 9. Trajectories of drogued, satellite-tracked buoys deployed in1978. Locations are plotted at I-day intervals.
19

N
AUGUSTINEISLAND
•50cm/s
--
7 JULY 1978
~ A-
\. ~ -' I +"'II'"t t ........t-t-
'-.,-.,- ,-
CAPEDOUGLAS
"... ...-........,/~.. ... --
~ .........~-= .. I •••~
" I ..,.....-..:-~ or c - --
...... ~/~---~/I" \////,.....-----
1W!f~
15
-,-
I I5 10
kmo
Figure 10. Example of 24-hr mean surface currents observed in July 1978using the doppler-shift radar unit discussed by Barrick, Evans, and Weber(1977). Data are courtesy of Dr. A.S. Frisch (Wave PropagationLaboratory, NOAA).
20

westward movement and some cross-isobath flow to the northward. Boththese drogues showed mean speeds of about 15 cm/s, in rough agreementwith that which would be predicted from the moored current observations.Drogue 1473 did not enter the lower Inlet, possibly in response to aneasterly flow pulse similar to those observed on the current records inStevenson Entrance. The 24-hour mean surface current picture compiledusing wave radar data defined circulation off Cape Douglas, where thewesterly flow is constrained by the bathymetry to curve southward andjoin the southward flow from the upper Inlet, creating particularystrong currents.
The well-documented westerly flow through the lower Inlet hadsuperposed upon it tidal and lower frequency fluctuating currents whosemagnitude varied with location. Both were maximum in Kennedy andStevenson entrances, and decreased to the north and west. Tidal currents were minimum in northern Shelikof Strait, and were larger ineastern than in western lower Cook Inlet. Low-frequency fluctuationdecreased northward. This is illustrated on figure 8 and in table 1,where the 2. 86-hr variance represents primarily tidal currents and the35-hr variance represents low-frequency fluctuations.
Near-bottom current speeds at a given location are of interest tosediment transport. Mean speeds, averaged over the entire length of therecord and including tidal currents, are given in table 1 as "2. 86-hrmean speed." These were generally above about 25 cm/s, with values ofabout 25 cm/s in the western portion of the lower Inlet and about 50cm/s in the eastern portion and in Kennedy and Stevenson entrances.This parallels the distribution of energy in tidal bands closely; thus,we conclude that tides are a major contributor to the relatively highnear-bottom current speeds observed.
The tidal fluctuating currents generally paralleled the channelorientation (table 2). In most cases, current directions for the different components were approximately aligned. In some cases (e. g. ,mooring Cl), however, the lesser components were directed up to 90 0 awayfrom the major K1 and M2 currents. The low-frequency fluctuationstended to be aligned with the mean flow in regions of strong mean currents (fig. 7). Elsewhere, they appeared to be random in orientationand frequently described full 360 0 rotations of the current vector.
21

Tab
le2•
•T
idal
curr
ent
com
pone
nts
for
four
maj
orsp
ecie
sde
rive
dfro
mcu
rren
tda
taus
ln9
the
Mun
k-C
artw
rl9ht
resp
onse
met
hod
(Mun
kln
dC
lrtw
rlgh
t,
1966
);H
Iscu
rren
tam
plitu
de(c
m/s
),G
isph
ase
rela
tive
toG
reen
wic
h(0
),D
Isdi
rect
ion
ofm
ajor
axis
(0),
and
RIs
sens
eof
rota
tion
(Cfo
r
cloc
kwis
e,A
for
antlc
lock
w1s
e).
Met
erM
ajor
°1M
inor
Maj
orK 1
Min
orM
ajor
52M
inor
Maj
or~
Min
orS
tati
onD
epth
(m)
HG
0H
RH
GD
HR
HG
0H
RIt
Gn
HR
CIB
IB3.
623
734
3.4
C6.
522
932
34.
BC
13.6
294
313
5.9
C33
.216
130
619
.1C
C2A
206.
324
115
2.B
C9.
425
75
4.3
C14
.032
434
56.
6C
36.5
300
353
20.7
CN
C3A
206.
423
926
3.lJ
C11
.624
316
5.7
C19
.B32
43
8.2
C53
.430
37
24.6
CN
C411
206.
322
214
2.3
C9.
724
24
3.7
C16
.633
035
56.
2C
46.3
302
357
18.9
CC5
1120
3.9
192
355
0.3
II5.
422
234
40.
5A
10.2
326
330
0.9
C28
.029
733
64.
5C
C6G
266.
919
98
2.8
C11
.421
335
93.
7C
22.7
315
358
7.3
C57
.32B
735
619
.5C
C78
17B.
916
135
82.
6C
15.9
184
358
2.5
C36
.829
935
84.
8C
98.0
269
357
17.4
CC8
B63
8.7
179
301
3.3
A13
.120
730
23.
7A
28.0
307
300
2.5
C70
.027
829
55.
8C
C9G
6610
.019
129
32.
5C
15.4
205
296
1.9
C27
.229
829
51.
5C
70.5
268
291
9.6
CCI
0025
2.1
265
580.
3A
1.7
307
350.
1A
3.3
4B25
1.7
C8.
34
353.
6C
C12A
209.
320
19
1.1
C15
.121
26
2.0
C29
.031
97
0.6
C79
.729
46
4.4
CC1
3A26
9.5
222
234.
2C
14.3
235
224.
5C
26.5
335
169.
8C
74.1
308
1328
.0C

6. Acknowledgements
Only through the cooperation of many individuals, primarily thoseat the Pacific Marine Environmental Laboratory of NOAA, was it possibleto successfully carry out the extensive field program and subsequentdata processing and analysis leading to this manuscript. Special thanksare extended to Jim Haslett, Dick Carlone, and Bill Parker, whosededication to duty ensured the success of the mooring operations, and toSharon Wright and Lynn Long for aiding in the data processing.
This study was supported in part by the Bureau of Land Managementthrough interagency agreement with the National Oceanic and AtmosphericAdministration under which a multiyear program responding to needs ofpetroleum development of the Alaskan continental shelf is managed by theOuter Continental Shelf Environmental Assessment Program (OCSEAP)office, and in part by the Pacific Marine Environmental Laboratory,NOAA.
23

7. References
Barrick, D.E., Evans, M.W., and Weber, B.L., 1977, Ocean surfacecurrents mapped by radar: Science, v. 198, p. 138-144.
Beardsley, R.C., and Winant, C.D., 1979, On the mean circulation inthe Mid-Atlantic Bight: J. Phys. Oceanogr., v. 9, p. 612-619.
Bowden, K.F., 1978, Physical problems of the benthic boundary layer:Geophys. Surveys, in press.
Brower, W.A., Jr., Diaz, H.F., Prechtel, A.S., Searby, H.W., andWise, J.L., 1977, Climatic Atlas of The Outer Continental ShelfWaters and Coastal Regions pf Alaska, Vol. 1, Gulf of Alaska:NOAA/OCSEAP Final Rept. RU No. 347. (unpub. man.)
Burbank, D.C., 1977, Circulation studies in Kachemak Bay and lowerCook Inlet, Alaska: Dept. of Fish and Game, Anchorage, Alaska.(unpub. man.)
Charnell, R.L., and Krancus, G.A., 1976, A processing system forAanderaa Current Meter data: NOAA Tech. Memo. ERL PMEL-6.
Favorite, F., 1967, The Alaskan Stream: Bull. 21, Int'l. N. Pac.Fish. Corom., Vancouver, B.C.
Favorite, F., 1974, Flow into the Bering Sea through Aleutian Islandpasses: In Hood, D.W., and Kelley, E.J., eds., Oceanography of theBering Se~ With Emphasis on Renewable Resources: Univ. of AlaskaOccas. Publ. No.2, Fairbanks, Alaska, p. 3-37.
Gatto, L.W., 1976, Baseline data on the oceanography of Cook Inlet,Alaska: Rept. 76-25, u.S. Army Cold Regions Res. and Engr. Lab.,Hanover, N.H.
Halpern, D., and Pillsbury, R.D., 1976, Influence of surface waveson subsurface current measurements in shallow water: Limn. andOceanogr., v. 21, p. 611-616.
Holbrook, J.R., Muench, R.D., and Cannon, G.A., 1980, Seasonal observations of low-frequency atmospheric forcing in the Strait ofJuan de Fuca: In Freeland, H.J., and Farmer, D.M., eds., FjordOceanography: Plenum Press, N.Y., p. 305-317.
Kinney, P.J., Button, D.K., Schell, D.M., Robertson, B.R., and Groves,J., 1970[a], Quantitative assessment of oil pollution problems inAlaska's Cook Inlet: Rept. R-169, Inst. Mar. Sci., Univ. ofAlaska, Fairbanks, Alaska.
Kinney, P.J., Groves, J., and Button, D.K., 1970[b], Cook Inletenvironmental data, R.V. Acona cruise 065 May 21-28, 1968: Rept.R70-2, Inst. Mar. Sci., Univ. of Alaska, Fairbanks, Alaska.
24

Knull, J .R. ,and Williamson, R. ~ 1969" Oceanographic survey of KachemakBay, Alaska: Man. Rept. 60~ Bur. Comm. Fish. Lab., Auke Bay,Alaska.
Levanon, N., 1975 (ed.), Special issue on data collection from multipleearth platforms: IEEE Trans. on Geoscience Electronics, v. 13.
Macklin; S.A., Lindsay, R.W., Reynolds, R.M. ,and Muench, R.D., 1979,Observations of mesoscale winds in an orographically-dominatedestuary: Cook Inlet, Alaska: Proc. XVII General Assembly ofthe IUGG, IAPSO Circular, Canberra, Australia, p. 111.
Matthews, J.B., and Mungall, J.C.H., 1972, A numerical tidal model andits application to Cook Inlet, Alaska: J. Mar. Res., v. 30, p.27-38.
Mayer, D.A., Hansen, D.V., and Ortman, D.A., 1979,Long-term currentand temperature observations on the Middle Atlantic shelf: J.Geophys. Res., v. 84, p. 1776-1792.
Muench, R.D., Mofjeld, H.O., and Charnell, R.L., 1978, Oceanographicconditions in lower Cook Inlet; spring and summer 1973: J.Geophys. Res., v. 83, p. 5090-5098.
Muench, R.D., and Schumacher, J.D., 1980, Physical oceanographic andmeteorological conditions in the northwest Gulf of Alaska: NOAATech. Memo. ERL PMEL-22, 147 pp.
Munk, W.H., and Cartwright, D., 1966, Tidal spectroscopy and prediction:Phil. Trans. Royal Soc. London A, v. 259, p. 533-581.
Ohtani, K., 1970, Relative transport in the Alaskan Stream in winter:J. Oceanogr. Soc. Japan, v. 26, p. 271-282.
Pearson, C.A., J.D. Schumacher and R.D. Meunch, 1981, Effects of waveinduced mooring noise on tidal and low-frequency current observations, Deep-Sea Res., v.#28A (in press).
Reed, R.K., 1980, Direct measurement of recirculation in the AlaskanStream: J. Phys. Oceanog., v. 10., p. 976-978.
Reed, R.K., and Taylor, N.E., 1965, Some measurements of the AlaskaStream with parachute drogues: Deep-Sea Res., v. 12, p. 777-784.
Reed, R.K., Muench, R.D., and Schumacher, J.D., 1980, On baroclinictransport of the Alaskan Stream near Kodiak Island: Deep-Sea Res.,v. 27, p. 509-523.
Royer, T.C., Hansen, D.V., and Pashinski, D.J., 1979, Coastal flowin the northern Gulf of Alaska as observed by dynamic topographyand satellite-tracked drogued drift buoys: J. Phys. Oceanog., v. 9,p. 785-801.
25

Schumacher, J.D., and Reed, R.K., 1980, Coastal flow in the northwestGulf of Alaska: the Kenai Current: J. Geophys. Res., v. 85, p.6680-6688.
Thomson, R.E., 1972, On the Alaskan Stream: J. Phys. Oceanog.,v. 2, p. 363-371.
Wang, D.P., 1978, Subtidal sea level variations in the Chesapeake Bayand relations to atmospheric forcing: J. Phys. Oceanogr., v. 9,p. 413-421.
Wang, D.P., and Elliott, A.J., 1978, Non-tidal variability in theChesapeake Bay and Potomac River: evidence for non-local forcing:J. Phys. Oceanogr., v. 8, p. 225-232.
Wright, F.F., Sharma, G.D., and Burbank, D.C., 1973, Erts-l observationsof sea surface circulation and sediment transport, Cook Inlet,Alaska: Proc. Symp. on Significant Results Obtained From The EarthResources Technology Satellite-I, NASA, Washington, D.C., p.1315-1322.
26
Top Related