


Languages
Pages
Legal


ChIP-seq
Peter N.Robinson
GeneRegulatoryNetworks
ChIP-Seq
XSET
FDR
MACS
Q/C & IDR
Big Picture
ChIP-seqPeak Calling
Peter N. Robinson
Institut fur Medizinische Genetik und HumangenetikCharite Universitatsmedizin Berlin
Genomics: Lecture #13

ChIP-seq
Peter N.Robinson
GeneRegulatoryNetworks
ChIP-Seq
XSET
FDR
MACS
Q/C & IDR
Big Picture
Outline
1 Gene Regulatory Networks
2 ChIP-Seq
3 XSET
4 FDR
5 MACS
6 ENCODE and the Irreproducible Discovery Rate (IDR)
7 The Big Picture

ChIP-seq
Peter N.Robinson
GeneRegulatoryNetworks
ChIP-Seq
XSET
FDR
MACS
Q/C & IDR
Big Picture
Gene Regulatory Networks
A genetic regulatory network (GRN) is a collection of geneswhich interact with each other indirectly (through their RNAand protein expression products) and with other substances inthe cell, thereby governing the rates at which genes in the net-work are transcribed into mRNA, thereby mediating biologicalfunction.

ChIP-seq
Peter N.Robinson
GeneRegulatoryNetworks
ChIP-Seq
XSET
FDR
MACS
Q/C & IDR
Big Picture
Gene Regulation
Genes are transcribed by RNA Polymerase II, but binding bymore or less specific transcription factors is required to initializethis process

ChIP-seq
Peter N.Robinson
GeneRegulatoryNetworks
ChIP-Seq
XSET
FDR
MACS
Q/C & IDR
Big Picture
Gene Regulation
The following somewhat oversimplified cartoon illustrates thephenomenon of gene regulation by a specific regulatory protein(transcription factor), without which transcription does not oc-cur.

ChIP-seq
Peter N.Robinson
GeneRegulatoryNetworks
ChIP-Seq
XSET
FDR
MACS
Q/C & IDR
Big Picture
Gene Regulation
Proteins bind to DNA at more or less specific sequences, socalled binding motifs. Genes that are regulated by a given tran-scription factor often have one or more DNA binding motifs forthe protein within their promoter sequence or other regulatorysequences.
De Silva EK et al (2008) Specific DNA-binding by apicomplexan AP2 transcription factors. PNAS
105:8393-8.

ChIP-seq
Peter N.Robinson
GeneRegulatoryNetworks
ChIP-Seq
XSET
FDR
MACS
Q/C & IDR
Big Picture
Gene Regulation
However, most DNA binding proteins do not have extremelyspecific binding motifs
ChIP-seq
Peter N.Robinson
GeneRegulatoryNetworks
ChIP-Seq
XSET
FDR
MACS
Q/C & IDR
Big Picture
Gene Regulation
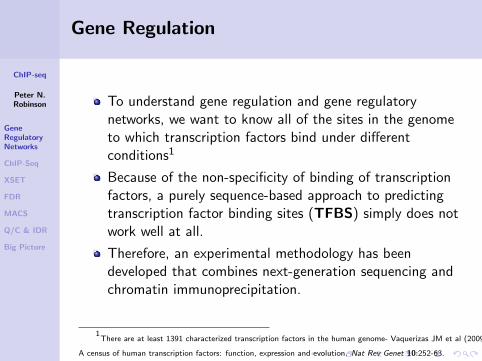
To understand gene regulation and gene regulatorynetworks, we want to know all of the sites in the genometo which transcription factors bind under differentconditions1
Because of the non-specificity of binding of transcriptionfactors, a purely sequence-based approach to predictingtranscription factor binding sites (TFBS) simply does notwork well at all.
Therefore, an experimental methodology has beendeveloped that combines next-generation sequencing andchromatin immunoprecipitation.
1There are at least 1391 characterized transcription factors in the human genome- Vaquerizas JM et al (2009)
A census of human transcription factors: function, expression and evolution. Nat Rev Genet 10:252-63.

ChIP-seq
Peter N.Robinson
GeneRegulatoryNetworks
ChIP-Seq
XSET
FDR
MACS
Q/C & IDR
Big Picture
Outline
1 Gene Regulatory Networks
2 ChIP-Seq
3 XSET
4 FDR
5 MACS
6 ENCODE and the Irreproducible Discovery Rate (IDR)
7 The Big Picture

ChIP-seq
Peter N.Robinson
GeneRegulatoryNetworks
ChIP-Seq
XSET
FDR
MACS
Q/C & IDR
Big Picture
ChIP-Seq
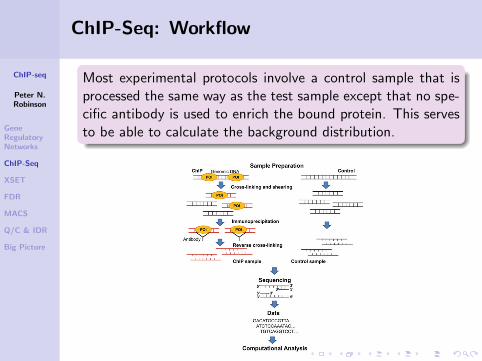
Chromatin Immunoprecipitation following by next generationsequencing (ChIP-seq) is used to analyze protein interactionswith DNA.
Three basic steps:
1 covalent cross-links between proteins and DNA areformed, typically by treating cells with formaldehyde
2 an antibody specific to the protein of interest is used toselectively coimmunoprecipitate the protein-bound DNAfragments that were covalently cross-linked.
3 the immunoprecipitated protein-DNA links are reversedand the recovered DNA is assayed to determine thesequences bound by that protein

ChIP-seq
Peter N.Robinson
GeneRegulatoryNetworks
ChIP-Seq
XSET
FDR
MACS
Q/C & IDR
Big Picture
ChIP-Seq: Workflow
Elaine R Mardis ER (2007) ChIP-seq: welcome to the new frontier. Nature Methods 4:613–614

ChIP-seq
Peter N.Robinson
GeneRegulatoryNetworks
ChIP-Seq
XSET
FDR
MACS
Q/C & IDR
Big Picture
ChIP-Seq: Workflow
DNA fragments from a chromatin immunoprecipitation exper-iment are sequenced from the 5’ end.
With ChIP-seq, the alignmentof the reads to the genomeresults in two peaks (one oneach strand) that flank thebinding location of the proteinor nucleosome of interest.
ChIP-seq
Peter N.Robinson
GeneRegulatoryNetworks
ChIP-Seq
XSET
FDR
MACS
Q/C & IDR
Big Picture
ChIP-Seq: Workflow
Most experimental protocols involve a control sample that isprocessed the same way as the test sample except that no spe-cific antibody is used to enrich the bound protein. This servesto be able to calculate the background distribution.

ChIP-seq
Peter N.Robinson
GeneRegulatoryNetworks
ChIP-Seq
XSET
FDR
MACS
Q/C & IDR
Big Picture
Outline
1 Gene Regulatory Networks
2 ChIP-Seq
3 XSET
4 FDR
5 MACS
6 ENCODE and the Irreproducible Discovery Rate (IDR)
7 The Big Picture

ChIP-seq
Peter N.Robinson
GeneRegulatoryNetworks
ChIP-Seq
XSET
FDR
MACS
Q/C & IDR
Big Picture
XSET: A simple algorithm
To set the stage, we will explain a simple algorithm from oneof the very first ChIP-seq papers from 2007.
The methodology involves a relatively simple scheme tocalculate peak depth in ChIP-Seq experiments.
Robertson G et al. (2007) Genome-wide profiles of STAT1 DNA association using chromatin
immunoprecipitation and massively parallel sequencing Nature Methods 4:651–657.

ChIP-seq
Peter N.Robinson
GeneRegulatoryNetworks
ChIP-Seq
XSET
FDR
MACS
Q/C & IDR
Big Picture
XSET: A simple algorithm
We start with single-end tags (SET), typically very shorte.g., 36 bp. Note fragments are sequenced from their 5’end in 5’ to 3’ direction only!In a typical ChIP-Seq experiment, we will have 20 to 50million reads that are mapped to the genome using“standard” methodologiesThe SETs are “computationally extended” in the 3’direction (e.g., 174-bp) into an extended SET (XSET).XSET length is chosen to be the mean fragment length ofthe size selected DNA.
POISET
XSET

ChIP-seq
Peter N.Robinson
GeneRegulatoryNetworks
ChIP-Seq
XSET
FDR
MACS
Q/C & IDR
Big Picture
XSET: Overlap profiles
XSET overlap profiles are then calculated by counting the num-ber of XSETs that are aligned to any given position of thegenome.
But how do we know whether any given peak is enriched?How do we know what is statistically significant?

ChIP-seq
Peter N.Robinson
GeneRegulatoryNetworks
ChIP-Seq
XSET
FDR
MACS
Q/C & IDR
Big Picture
Outline
1 Gene Regulatory Networks
2 ChIP-Seq
3 XSET
4 FDR
5 MACS
6 ENCODE and the Irreproducible Discovery Rate (IDR)
7 The Big Picture

ChIP-seq
Peter N.Robinson
GeneRegulatoryNetworks
ChIP-Seq
XSET
FDR
MACS
Q/C & IDR
Big Picture
False Discovery Rate
XSET employs the notion of False Discovery Rate (FDR) toestimate the significance of ChIP-Seq peaks. We will reviewthe salient concepts.
The scenario:
We want to simultaneously test m null hypothesesH1, . . . ,Hm at level α, giving p-values pi
Each hypothesis (in the current case) represents acandidate ChIP-Seq peak (transcription factor bindingevent), and the null hypothesis is that there is no truebinding.
m0 of these hypotheses are truly null (no effect)
ChIP-seq
Peter N.Robinson
GeneRegulatoryNetworks
ChIP-Seq
XSET
FDR
MACS
Q/C & IDR
Big Picture
False Discovery Rate
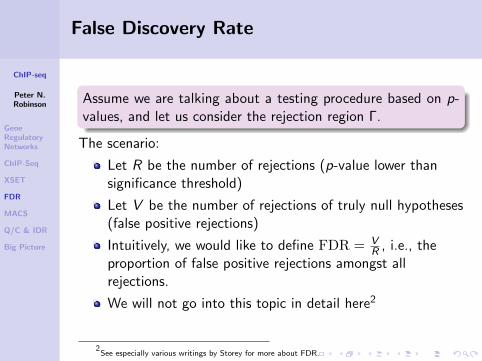
Assume we are talking about a testing procedure based on p-values, and let us consider the rejection region Γ.
The scenario:
Let R be the number of rejections (p-value lower thansignificance threshold)
Let V be the number of rejections of truly null hypotheses(false positive rejections)
Intuitively, we would like to define FDR = VR , i.e., the
proportion of false positive rejections amongst allrejections.
We will not go into this topic in detail here2
2See especially various writings by Storey for more about FDR.

ChIP-seq
Peter N.Robinson
GeneRegulatoryNetworks
ChIP-Seq
XSET
FDR
MACS
Q/C & IDR
Big Picture
XSET: FDR
XSET uses an empirical procedure to provide an estimate ofthe FDR based on the characteristics of the data
Randomly place the same number of reads as in the realdata onto the genome
Each random read is defined to have the XSET length
Calculate the random expectation for the probability ofobserving peaks with a particular height, takingmapability into account

ChIP-seq
Peter N.Robinson
GeneRegulatoryNetworks
ChIP-Seq
XSET
FDR
MACS
Q/C & IDR
Big Picture
Mappability
Not all reads can be mapped uniquely to the genome. Map-pability of a sequence of length n relates to the uniqueness(or not) of a sequence of length n that starts at a particularposition of the genome. If there is another identical sequencesomewhere else, then the n-mer sequence is not mappable.
Scalechr15:
1 kb hg1846,608,500 46,609,000 46,609,500 46,610,000 46,610,500
Mapability - ENCODE Duke Uniqueness of 35bp sequences
Mapability - ENCODE UMass Uniqueness at 15bp
UCSC Genes Based on RefSeq, UniProt, GenBank, CCDS and Comparative Genomics
RefSeq Genes
Placental Mammal Basewise Conservation by PhyloP
FBN1
FBN1
Duke Uniq 351 _
0 _
Umass Uniq 150.55 _
0.1 _
Mappability: The uniqueness of a stretch of DNA sequence compared with a whole-genome sequence. Short
sequence reads can be confidently mapped to unique sequence, but less confidently mapped to sequence that
occurs multiple times in a genome. Mappability increases substantially with read length
ChIP-seq
Peter N.Robinson
GeneRegulatoryNetworks
ChIP-Seq
XSET
FDR
MACS
Q/C & IDR
Big Picture
XSET: FDR
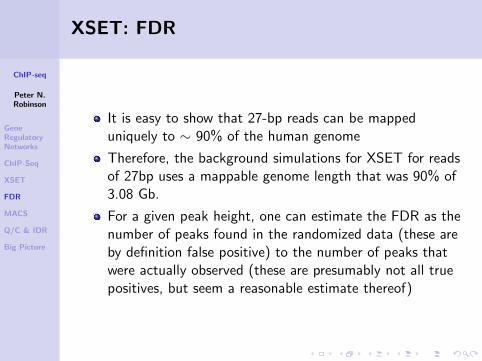
It is easy to show that 27-bp reads can be mappeduniquely to ∼ 90% of the human genome
Therefore, the background simulations for XSET for readsof 27bp uses a mappable genome length that was 90% of3.08 Gb.
For a given peak height, one can estimate the FDR as thenumber of peaks found in the randomized data (these areby definition false positive) to the number of peaks thatwere actually observed (these are presumably not all truepositives, but seem a reasonable estimate thereof)

ChIP-seq
Peter N.Robinson
GeneRegulatoryNetworks
ChIP-Seq
XSET
FDR
MACS
Q/C & IDR
Big Picture
XSET: FDR
Relationship between the peak height threshold (number ofXSETs that are aligned across a peak) and the estimated FDR
ChIP-seq
Peter N.Robinson
GeneRegulatoryNetworks
ChIP-Seq
XSET
FDR
MACS
Q/C & IDR
Big Picture
XSET: FDR
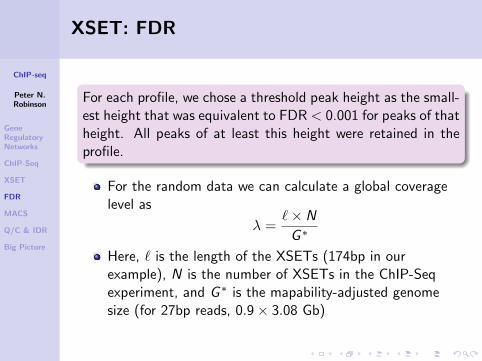
For each profile, we chose a threshold peak height as the small-est height that was equivalent to FDR < 0.001 for peaks of thatheight. All peaks of at least this height were retained in theprofile.
For the random data we can calculate a global coveragelevel as
λ =`× N
G ∗
Here, ` is the length of the XSETs (174bp in ourexample), N is the number of XSETs in the ChIP-Seqexperiment, and G ∗ is the mapability-adjusted genomesize (for 27bp reads, 0.9× 3.08 Gb)

ChIP-seq
Peter N.Robinson
GeneRegulatoryNetworks
ChIP-Seq
XSET
FDR
MACS
Q/C & IDR
Big Picture
XSET: FDR
Given a λ value calculated as above, the probability ofobserving a peak with a height of at least h is given by asum of Poisson probabilities as:
P(H ≥ h) =∞∑k=h
e−λλk
k!= 1−
h−1∑k=0
e−λλk
k!(1)

ChIP-seq
Peter N.Robinson
GeneRegulatoryNetworks
ChIP-Seq
XSET
FDR
MACS
Q/C & IDR
Big Picture
Stat1 and Interferon
Let us now look at a typical ChIP-Seq experiment. Stat1 is atranscription factor that can be activated by stimulation of cellsby interferon-γ. Thus, by performing one experiment beforeand one after interferon-γ stimulation, comparison of the peaksindicates the biological effect due to the stimulation.

ChIP-seq
Peter N.Robinson
GeneRegulatoryNetworks
ChIP-Seq
XSET
FDR
MACS
Q/C & IDR
Big Picture
Stat1 and Interferon
FDR-thresholded XSET profiles and peaks (the significancethreshold was estimated at λ = 11). Stimulated and unstimu-lated FDR-thresholded XSET profiles for the 247 Mb chromo-some 1

ChIP-seq
Peter N.Robinson
GeneRegulatoryNetworks
ChIP-Seq
XSET
FDR
MACS
Q/C & IDR
Big Picture
Stat1 and Interferon
The set of peaks and their location then form the basis for bi-ological interpretation of the actions of the transcription factorbeing investigated.
Parameter stimulated unstimulated
peak height at FDR threshold 11 11Number of peaks 41,582 11,004Average height 29.2 21.0Median height 16 13
STAT1 motif inferred fromsequences at peaks

ChIP-seq
Peter N.Robinson
GeneRegulatoryNetworks
ChIP-Seq
XSET
FDR
MACS
Q/C & IDR
Big Picture
Outline
1 Gene Regulatory Networks
2 ChIP-Seq
3 XSET
4 FDR
5 MACS
6 ENCODE and the Irreproducible Discovery Rate (IDR)
7 The Big Picture

ChIP-seq
Peter N.Robinson
GeneRegulatoryNetworks
ChIP-Seq
XSET
FDR
MACS
Q/C & IDR
Big Picture
MACS
We will now present Model-based Analysis of ChIP-Seqdata (MACS), which has been one of the most commonlyused peak finders. MACS introduced a more sophisticated wayof modeling the fragment size.
Clearly, the estimation of the fragment size is critical tothe performance of an algorithm such as XSET: The largerthe fragment size, the higher the average coverage of thegenome is, which has a direct influence on the calculationof the estimated significance threshold
Zhang Y (2008) Model-based Analysis of ChIP-Seq (MACS) Genome Biology 9:R137

ChIP-seq
Peter N.Robinson
GeneRegulatoryNetworks
ChIP-Seq
XSET
FDR
MACS
Q/C & IDR
Big Picture
MACS Bimodal enrichment
Since ChIP-DNA fragments are equally likely to be sequencedfrom both ends, the tag density around a true binding siteshould show a bimodal enrichment pattern
Watson strand tags enriched upstream of binding andCrick strand tags enriched downstream.
Tags are often shifted/extended towards the 3’ directionto better represent the precise protein-DNA interactionsite (as with XSETs). The size of the shift is, however,often unknown to the experimenter.

ChIP-seq
Peter N.Robinson
GeneRegulatoryNetworks
ChIP-Seq
XSET
FDR
MACS
Q/C & IDR
Big Picture
MACS Bimodal enrichment
The 5’ to 3’ sequencing requirement and short read lengthproduce stranded bias in tag distribution.
The separation between peaks (d) corresponds to the average sequenced fragment length.
Wilbanks EG (2010) Evaluation of Algorithm Performance in ChIP-Seq Peak Detection PLoS ONE 5:e11471.

ChIP-seq
Peter N.Robinson
GeneRegulatoryNetworks
ChIP-Seq
XSET
FDR
MACS
Q/C & IDR
Big Picture
ChIP-seq Fragment Length
Why does the separation between peaks (d) correspond tothe average sequenced fragment length?

ChIP-seq
Peter N.Robinson
GeneRegulatoryNetworks
ChIP-Seq
XSET
FDR
MACS
Q/C & IDR
Big Picture
Recall: Library Prep: Fragmentation
Most Illumina protocols require that DNA is fragmentedto less than 800 nt.
Ideally, fragments have uniform size
Sonication uses ultrasound waves in solution to shearDNA.
Ultrasound waves pass through the sample, expanding andcontracting liquid, creating “bubbles” in a process calledcavitation.
Bubbles ⇒ focused shearing forces ⇒ fragment the DNA
Sketch of sonication in“Eppi”
Source: Bioruptor
(http://www.diagenode.com/)
ChIP-seq
Peter N.Robinson
GeneRegulatoryNetworks
ChIP-Seq
XSET
FDR
MACS
Q/C & IDR
Big Picture
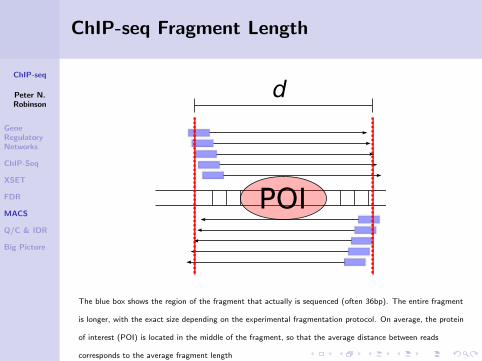
ChIP-seq Fragment Length
POI
d
The blue box shows the region of the fragment that actually is sequenced (often 36bp). The entire fragment
is longer, with the exact size depending on the experimental fragmentation protocol. On average, the protein
of interest (POI) is located in the middle of the fragment, so that the average distance between reads
corresponds to the average fragment length

ChIP-seq
Peter N.Robinson
GeneRegulatoryNetworks
ChIP-Seq
XSET
FDR
MACS
Q/C & IDR
Big Picture
MACS: Estimation of fragment size
Given a sonication size (bandwidth) and a high-confidencefold-enrichment (mfold), MACS slides windows of length 2 ×bandwidth across the genome to find regions with tags morethan mfold enriched relative to a random tag genome distribu-tion
bandwidth and mfold are user parameters
mfold specifies an interval of high-confidence enrichment ratio against the background on which to
build the model. The default value 10, 30 means that a model will be built on the basis of regions
having read counts that are 10- to 30-fold of the background.
bandwidth, which is half of the sliding window size used in the model-building step, is set according
to the length of the fragments expected experimentally from the sonication procedure

ChIP-seq
Peter N.Robinson
GeneRegulatoryNetworks
ChIP-Seq
XSET
FDR
MACS
Q/C & IDR
Big Picture
MACS: Shift size
Algorithm 1 Estimate Fragment Size
1: Slide a window of 2× bandwidth3 across genome
2: Identify regions of moderate enrichment (mfold:
10-30 fold)
3: for each peak i of 1000 randomly chosen enriched regionsdo
4: separate reads into + and - strand
5: Calculate mode of + and - summit
6: di ← |mode+ −mode−|7: end for8: d ← averagei (di )
Thus, the distance between bimodal summits is assumedto be the the estimated DNA fragment size d
3roughly twice the size of the sheared chromatinacross the genome

ChIP-seq
Peter N.Robinson
GeneRegulatoryNetworks
ChIP-Seq
XSET
FDR
MACS
Q/C & IDR
Big Picture
MACS: Shift size

ChIP-seq
Peter N.Robinson
GeneRegulatoryNetworks
ChIP-Seq
XSET
FDR
MACS
Q/C & IDR
Big Picture
MACS: Shift size
Once d has been estimated, all reads are shifted by d/2 to their3’ end, i.e., towards the center of the overall peak.
A statistical test is then used to determine significantpeaks
A dynamic λlocal is defined to capture local biases in thegenome.

ChIP-seq
Peter N.Robinson
GeneRegulatoryNetworks
ChIP-Seq
XSET
FDR
MACS
Q/C & IDR
Big Picture
ChIP-Seq: Background bias
Similar to the situation with read-depth analysis in genomesequencing, local characteristics of the genome can lead to abias in the number of reads being mapped.
chromatin state (e.g. euchromatin fragments easier thansilenced chromatin)
GC content
Therefore, ChIP-Seq experiments often include a controlsample, consisting of the he input material of the ChIPprocessed with an unspecific immunoprecipitation with”generic” (i.e., mixed) IgG

ChIP-seq
Peter N.Robinson
GeneRegulatoryNetworks
ChIP-Seq
XSET
FDR
MACS
Q/C & IDR
Big Picture
ChIP-Seq: Background bias
Similar to the situation with read-depth analysis in genomesequencing, local characteristics of the genome can lead to abias in the number of reads being mapped.
The tag count in ChIP versus control in 10 kb windows across the genome. Each dot represents a 10 kb
window; red dots are windows containing ChIP peaks and black dots are windows containing control peaks

ChIP-seq
Peter N.Robinson
GeneRegulatoryNetworks
ChIP-Seq
XSET
FDR
MACS
Q/C & IDR
Big Picture
MACS: Peak calling
Because of these biases, instead of using a uniform λBGestimated from the whole genome, MACS uses a dynamicparameter, λlocal , defined for each candidate peak as:
λlocal = max(λBG , λ1k , λ5k , λ10k) (2)
λBG is calculated over the entire genome, andλ1k , λ5k , λ10k are calculated from the 1 kb, 5 kb or 10 kbwindow centered at the peak location in the controlsample.

ChIP-seq
Peter N.Robinson
GeneRegulatoryNetworks
ChIP-Seq
XSET
FDR
MACS
Q/C & IDR
Big Picture
MACS: Peak calling
λlocal reduces the influence of local biases, and is robust againstoccasional low tag counts at small local regions. MACS usesλlocal to calculate the p-value of each candidate peak.
Candidate peaks with p-values below a user-definedthreshold p-value (default 10−5) are called (Poissondistribution)
The ratio between the ChIP-Seq tag count and λlocal isreported as the fold enrichment.

ChIP-seq
Peter N.Robinson
GeneRegulatoryNetworks
ChIP-Seq
XSET
FDR
MACS
Q/C & IDR
Big Picture
ChIP-Seq: Artifacts
It may also be useful to filterout certain classes of peaksthat are likely to be artifacts
Peaks with many readsstarting from the sameposition
Peaks with reads mainlyfrom only one strand
Pepke S et al. (2009) Computation for ChIP-seq and
RNA-seq studies Nature Methods 6:S22–S32

ChIP-seq
Peter N.Robinson
GeneRegulatoryNetworks
ChIP-Seq
XSET
FDR
MACS
Q/C & IDR
Big Picture
ChIP-Seq: An unsolved problem
ChIP-Seq programs report different numbers of peaks, whenrun with their default or recommended settings on the samedataset.
Wilbanks EG (2010) Evaluation of Algorithm Performance in ChIP-Seq Peak Detection PLoS ONE 5:e11471.

ChIP-seq
Peter N.Robinson
GeneRegulatoryNetworks
ChIP-Seq
XSET
FDR
MACS
Q/C & IDR
Big Picture
Outline
1 Gene Regulatory Networks
2 ChIP-Seq
3 XSET
4 FDR
5 MACS
6 ENCODE and the Irreproducible Discovery Rate (IDR)
7 The Big Picture

ChIP-seq
Peter N.Robinson
GeneRegulatoryNetworks
ChIP-Seq
XSET
FDR
MACS
Q/C & IDR
Big Picture
ChIP-Seq: Quality Control
In real life, there are innumerable ways that experiments can gowrong, and an essential part of bioinformatics is quality controlof genomics data.
Essential Q/C parameters
Biological reproducibility
Enrichment factor of immunoprecipitation
Size and uniformity of fragmentation
Library size and read count
PHRED quality profile of reads
weird stuff that nobody understands . . .

ChIP-seq
Peter N.Robinson
GeneRegulatoryNetworks
ChIP-Seq
XSET
FDR
MACS
Q/C & IDR
Big Picture
ChIP-Seq: Quality Control
We will discuss a few bioinformatic Q/C measures fromLandt SG et al. (2012) ChIP-seq guidelines and practices of the ENCODE and
modENCODE consortia. Genome Res 22:1813-31.

ChIP-seq
Peter N.Robinson
GeneRegulatoryNetworks
ChIP-Seq
XSET
FDR
MACS
Q/C & IDR
Big Picture
ChIP-Seq: Why do we need Q/C?
Lanes contain nuclear extract from GM12878 cells (G) andK562 cells (K). Arrows indicate band of expected size of133 kDa for transcription factor SIN3B.
The primary reactive band should contain at least 50% ofthe signal and ideally correspond to the expected size ofthe protein
A number of other wetlab Q/C measures are discussed in the paper

ChIP-seq
Peter N.Robinson
GeneRegulatoryNetworks
ChIP-Seq
XSET
FDR
MACS
Q/C & IDR
Big Picture
ChIP-Seq: Experimental Planning
A practical goal is to maximize site discovery by optimizingimmunoprecipitation and sequencing deeply, within reasonableexpense constraints.
Different TFs and enhancer sequences have differentbinding affinities, so it is not possible to provide a one-sizefor all recommendation for sequencing depth, but formammals, each replicate should generally have at least 10million mappable reads.
Library complexity: are there a lot of duplicate reads?Obviously, the deeper one sequences, the more likely it isto obtain duplicate reads, but an elevated number ofduplicates (i.e., low library complexity) can indicate thattoo little DNA was isolated by immunoprecipitation orthat there were problems with library construction

ChIP-seq
Peter N.Robinson
GeneRegulatoryNetworks
ChIP-Seq
XSET
FDR
MACS
Q/C & IDR
Big Picture
ChIP-Seq: Library complexity
ChIP-seq
Peter N.Robinson
GeneRegulatoryNetworks
ChIP-Seq
XSET
FDR
MACS
Q/C & IDR
Big Picture
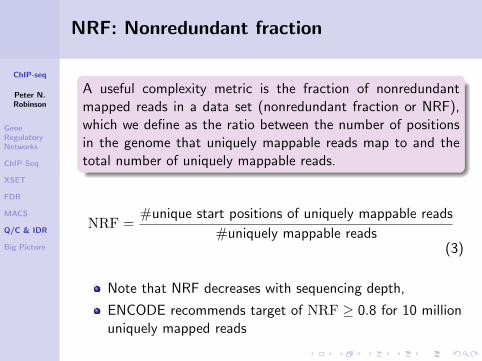
NRF: Nonredundant fraction
A useful complexity metric is the fraction of nonredundantmapped reads in a data set (nonredundant fraction or NRF),which we define as the ratio between the number of positionsin the genome that uniquely mappable reads map to and thetotal number of uniquely mappable reads.
NRF =#unique start positions of uniquely mappable reads
#uniquely mappable reads(3)
Note that NRF decreases with sequencing depth,
ENCODE recommends target of NRF ≥ 0.8 for 10 millionuniquely mapped reads

ChIP-seq
Peter N.Robinson
GeneRegulatoryNetworks
ChIP-Seq
XSET
FDR
MACS
Q/C & IDR
Big Picture
Measuring global ChIP enrichment (FRiP)
Typically, a minority of reads in ChIP-seq experiments occur insignificantly enriched genomic regions (i.e., peaks); the remain-der of the read represents background. The fraction of readsfalling within peak regions is therefore a useful and simple first-cut metric for the success of the immunoprecipitation, and iscalled FRiP (fraction of reads in peaks).
Most (787 of 1052) ENCODE data sets have a FRiP enrichment of 1% or more when peaks arecalled using MACS with default parameters.
There is a rough correlation with the number of peaks called

ChIP-seq
Peter N.Robinson
GeneRegulatoryNetworks
ChIP-Seq
XSET
FDR
MACS
Q/C & IDR
Big Picture
Cross-correlation analysis
High-quality ChIP-seq experiment produces significant cluster-ing of enriched DNA sequence tags at locations bound by theprotein of interest, and that the sequence tag density accu-mulates on forward and reverse strands centered around thebinding site.
“true signal” sequence tags arepositioned at a distance k fromthe binding site center thatdepends on the fragment sizedistribution
A control experiment lacks thispattern of shifted stranded tagdensities

ChIP-seq
Peter N.Robinson
GeneRegulatoryNetworks
ChIP-Seq
XSET
FDR
MACS
Q/C & IDR
Big Picture
Cross-correlation analysis
Reads are shifted in the direction of the strand they map to by anincreasing number of base pairs and the Pearson correlation between theper-position read count vectors for each strand is calculated.
This typically produces two peaks when cross-correlation is plotted againstthe shift value: a peak of enrichment corresponding to the predominantfragment length and a peak corresponding to the read length (“phantom”peak)

ChIP-seq
Peter N.Robinson
GeneRegulatoryNetworks
ChIP-Seq
XSET
FDR
MACS
Q/C & IDR
Big Picture
Cross-correlation analysis
The normalized ratio between the fragment-length cross-correlation peakand the background cross-correlation (normalized strand coefficient, NSC)and the ratio between the fragment-length peak and the read-length peak(relative strand correlation, RSC), are strong metrics for assessingsignal-to-noise ratios in a ChIP-seq experiment.
ENCODE cutoff: NSC values < 1.05 and RSC values < 0.8

ChIP-seq
Peter N.Robinson
GeneRegulatoryNetworks
ChIP-Seq
XSET
FDR
MACS
Q/C & IDR
Big Picture
ChIP-seq: Biological replicates
Stuff happens: Sometimes the wetlab experiment simply doesn’t work. Bioinformatics analysis needs to
recognize this and warn the experimentalists: Garbage in garbage out!
ChIP-seq
Peter N.Robinson
GeneRegulatoryNetworks
ChIP-Seq
XSET
FDR
MACS
Q/C & IDR
Big Picture
Consistency of replicates: Analysis using IDR
Definition (IDR)
The irreproducible discovery rate (IDR) is a unified approach tomeasure the reproducibility of findings identified from replicatehigh-throughput experiments
The scenario: We have two ChIP-seq experiments andhave called peaks for each separately of them using MACSor some other tool
Thus, each peak in each experiment has been assigned ap-value

ChIP-seq
Peter N.Robinson
GeneRegulatoryNetworks
ChIP-Seq
XSET
FDR
MACS
Q/C & IDR
Big Picture
Consistency of replicates: Analysis using IDR
Each list of peaks is ranked according to p-value
The IDR method then fits the bivariate rank distributionsover the replicates in order to separate signal from noisebased on a defined confidence of rank consistency andreproducibility of identifications
We will not cover the details of the method, which was presented in Li Q (2011) Measuring
reproducibility of high-throughput experiments. Ann Appl Stat 5:1752–1779.

ChIP-seq
Peter N.Robinson
GeneRegulatoryNetworks
ChIP-Seq
XSET
FDR
MACS
Q/C & IDR
Big Picture
IDR: Good Quality
Scatter plots of signal scores of peaks that overlap in each pair of replicates.
Note that low ranks correspond to high signal and vice versa.
Black data points represent pairs of peaks that pass an IDR threshold of 1%, whereas the red datapoints represent pairs of peaks that do not pass the IDR threshold of 1%.
The RAD21 replicates show high reproducibility with ∼30,000 peaks passing an IDR threshold of 1%

ChIP-seq
Peter N.Robinson
GeneRegulatoryNetworks
ChIP-Seq
XSET
FDR
MACS
Q/C & IDR
Big Picture
IDR: Good Quality
The SPT20 replicates show poor reproducibility with only six peaks passing the 1% IDR threshold

ChIP-seq
Peter N.Robinson
GeneRegulatoryNetworks
ChIP-Seq
XSET
FDR
MACS
Q/C & IDR
Big Picture
Outline
1 Gene Regulatory Networks
2 ChIP-Seq
3 XSET
4 FDR
5 MACS
6 ENCODE and the Irreproducible Discovery Rate (IDR)
7 The Big Picture

ChIP-seq
Peter N.Robinson
GeneRegulatoryNetworks
ChIP-Seq
XSET
FDR
MACS
Q/C & IDR
Big Picture
The Big Picture: Using ChIP-seq to answerbiological questions
Transcription in eukaryotes involves interactions between multi-protein complexes and chromosomal DNA to coordinately regu-late gene expression in a stimulus-specific, temporal, and tissue-specific fashion
ChIP-seq is one of the most important genomics methodologies toinvestigate gene regulation
We will present a bird’s eye view of a nice paper on the subject: Stender JDet al (2010) Genome-wide analysis of estrogen receptor alpha DNA bindingand tethering mechanisms identifies Runx1 as a novel tethering factor inreceptor-mediated transcriptional activation. Mol Cell Biol 30:3943-55.

ChIP-seq
Peter N.Robinson
GeneRegulatoryNetworks
ChIP-Seq
XSET
FDR
MACS
Q/C & IDR
Big Picture
Multiprotein complexes are important forregulation
Transcription factors have theability to regulate geneexpression by binding directly toDNA at sequence-specificresponse elements or bytethering to other responseelements through protein-proteininteractions with otherDNA-bound factors
The combinatorial usage of theseresponse elements drives theregulation of target genes andultimately determines stimulusand tissue specificity.
ChIP-seq
Peter N.Robinson
GeneRegulatoryNetworks
ChIP-Seq
XSET
FDR
MACS
Q/C & IDR
Big Picture
Estrogen Receptor
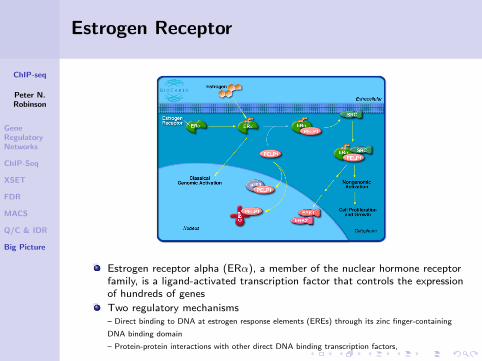
Estrogen receptor alpha (ERα), a member of the nuclear hormone receptorfamily, is a ligand-activated transcription factor that controls the expressionof hundreds of genes
Two regulatory mechanisms– Direct binding to DNA at estrogen response elements (EREs) through its zinc finger-containing
DNA binding domain
– Protein-protein interactions with other direct DNA binding transcription factors,

ChIP-seq
Peter N.Robinson
GeneRegulatoryNetworks
ChIP-Seq
XSET
FDR
MACS
Q/C & IDR
Big Picture
Estrogen Receptor Element: ERE
The Estrogen Receptor Element (ERE) is a DNA motif to whichthe estrogen receptor α (ERα) can bind.

ChIP-seq
Peter N.Robinson
GeneRegulatoryNetworks
ChIP-Seq
XSET
FDR
MACS
Q/C & IDR
Big Picture
Estrogen Receptor
The authors Stender et al. examine the genome-widechromatin localization of a mutant nuclear hormonereceptor, one in which point mutations in the DNAbinding domain disable the receptor’s ability to bind to itspalindromic DNA response element.
Thus, they have a molecular system to distinguish betweendirect DNA-binding and protein-protein interactions withindirect DNA binding

ChIP-seq
Peter N.Robinson
GeneRegulatoryNetworks
ChIP-Seq
XSET
FDR
MACS
Q/C & IDR
Big Picture
Mutant Estrogen Receptor Construct
The estrogen receptor DNA binding domain mutant selectivelyactivates ERE binding-independent estrogen signaling.

ChIP-seq
Peter N.Robinson
GeneRegulatoryNetworks
ChIP-Seq
XSET
FDR
MACS
Q/C & IDR
Big Picture
WT vs. mutant ER: Effects on geneexpression
MDA-MB-231 cells stably expressing either the WT ER or DB-Dmut ER. Upregulated genes are shown in red, and genes down-regulated by E2 are shown in green
Hierarchical clustering of these E2-regulated genes
using the microarray expression data from the WT or
DBDmut ER-expressing cells segregated the
E2-regulated genes into two major classes: (i) genes
that were regulated only by the WT ER (Fig. 2A) and
(ii) genes that were regulated by both the WT ER and
DBDmut ER (Fig. 2B).

ChIP-seq
Peter N.Robinson
GeneRegulatoryNetworks
ChIP-Seq
XSET
FDR
MACS
Q/C & IDR
Big Picture
WT vs. mutant ER: ChIP-seq
Peaks preferential for WT ER recruitment (n = 6,019) are denoted in red,while peaks common for both WT ER and DBDmut ER (n = 451) areblue. Peaks unique for the DBDmut ER (n = 662) are shown in yellow.
The DBDmut colocalized to only 451 (7%) (blue dots) of the 6470 WT
binding peaks (red dots plus blue dots), which indicates that the majority
of ER recruitment to ER binding sites requires a fully functional DNA
binding domain

ChIP-seq
Peter N.Robinson
GeneRegulatoryNetworks
ChIP-Seq
XSET
FDR
MACS
Q/C & IDR
Big Picture
WT vs. mutant ER: DNA binding motifs
The DNA sequences corresponding to direct ER binding sites were searchedfor enriched motif sequences
The ERE was the most enriched motif for WT ER (as expected)
The tethered binding sites were investigated while using direct WT ER
binding sites as a background set. In contrast to direct binding sites, the
most enriched motifs for the tethering sites included Ap1, Runx, and HRE

ChIP-seq
Peter N.Robinson
GeneRegulatoryNetworks
ChIP-Seq
XSET
FDR
MACS
Q/C & IDR
Big Picture
WT vs. mutant ER: DNA binding motifs
The Ap1 motif was present in 37% of the binding sites of the DBDmut ER,while being present in only 16% of the WT ER DNA binding sites
In addition, the Runx motif was present in 20% of DBDmut sites, whileonly 7% of the WT ER binding sites contained a Runx motif.
These data suggest that members of the Ap1 and the Runx families may
be potential candidate tethering factors involved in mediating
ERα-dependent gene regulation.

ChIP-seq
Peter N.Robinson
GeneRegulatoryNetworks
ChIP-Seq
XSET
FDR
MACS
Q/C & IDR
Big Picture
Runx1 is a cofactor of ER
The observation that the Runx motif was specifically enrichedin a subset of ER tethering sites suggested the possibility thatRunx1 might bind to and serve as a tethering protein for ERαat distinct chromosomal locations.
Cells were treated with vehicle (i.e., negative control) or 10 nM E2 for 45min prior to immunoprecipitation with Runx1 antibody or IgG followed byWestern immunoblotting for ERα.
The fact that immunoprecipitation by a Runx1 antibody shows a signal, but
that with IgG (also a negative control) does not indicates a binding
interaction between Runx1 and ERα.

ChIP-seq
Peter N.Robinson
GeneRegulatoryNetworks
ChIP-Seq
XSET
FDR
MACS
Q/C & IDR
Big Picture
Elegant Genomics!
The paper I just presented has all of the hallmarks of an elegantgenomics experiment!
The experiment begins with an hypothesis
The experimental design involves a global search orinvestigation4
The experiment involves several interventions that allowgenomic scale effects to be evaluated with at least somedegree of specificity (ERα wildtype vs. mutant construct,stimulation by oestrogen vs. vehicle)
Comprehensive and integrated bioinformatics analysis thatis informed by the biological question
The results of bioinformatics analysis lead to a targetedmolecular experiment that validated the results of thebioinformatic analysis
4otherwise it wouldn’t really be genomics . . .

ChIP-seq
Peter N.Robinson
GeneRegulatoryNetworks
ChIP-Seq
XSET
FDR
MACS
Q/C & IDR
Big Picture
The End of the Lecture as We Know It
Email:[email protected]
Office hours byappointment
Lectures were once useful; but now, when all can read, and booksare so numerous, lectures are unnecessary. If your attention fails,and you miss a part of a lecture, it is lost; you cannot go back as
you do upon a book... People have nowadays got a strangeopinion that everything should be taught by lectures. Now, Icannot see that lectures can do as much good as reading thebooks from which the lectures are taken. I know nothing that
can be best taught by lectures, except where experiments are tobe shown. You may teach chymistry by lectures. You might
teach making shoes by lectures!
Samuel Johnson, quoted in Boswell’s Life of Johnson (1791).
Top Related