


Languages
Pages
Legal


Characterization and Validation of Telemetric Digital
Tachometer based on Hall Effect Sensor
www.utch.edu.mx
June 2014
www.mdpi.com/journal/sensors

Contents:
IntroductionTelemetry and its applications
Proposed systemFunctional diagramSensing and signal conditioningWireless transmission and receptionWireless transmission and receptionData analysis and display
Results and discussion
Conclusions and further work
References and notes
2
INTRODUCTION
Telemetry
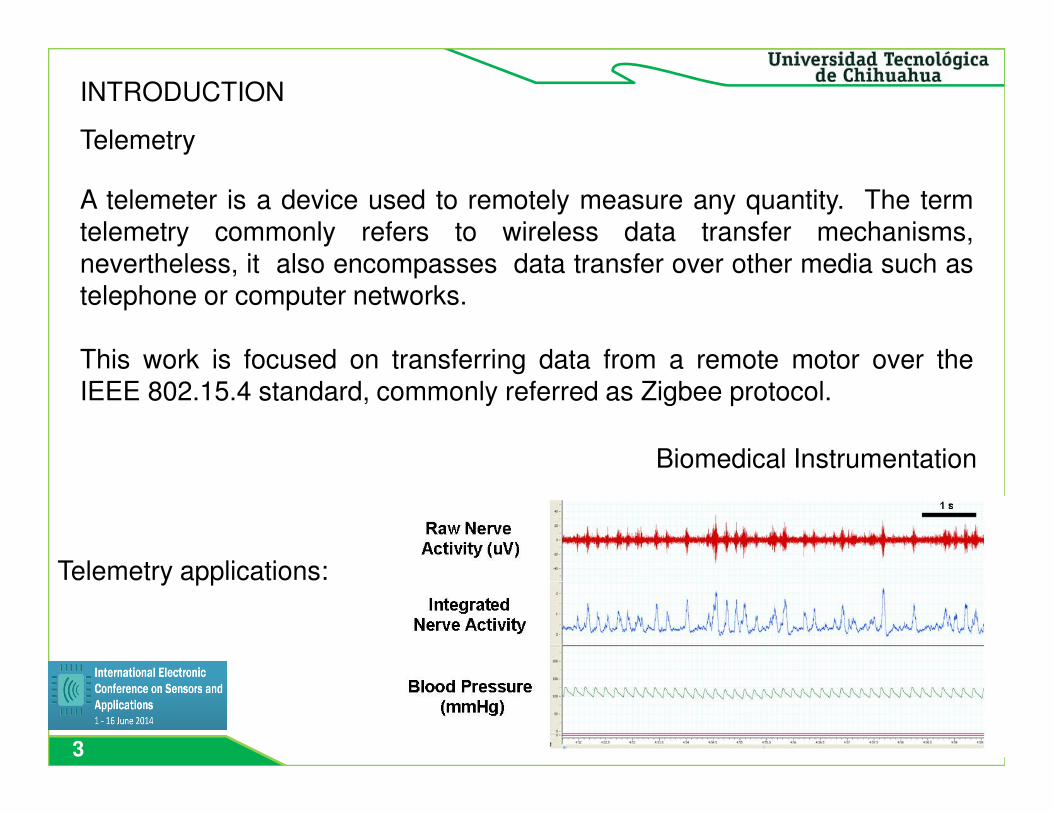
A telemeter is a device used to remotely measure any quantity. The termtelemetry commonly refers to wireless data transfer mechanisms,nevertheless, it also encompasses data transfer over other media such astelephone or computer networks.
This work is focused on transferring data from a remote motor over theIEEE 802.15.4 standard, commonly referred as Zigbee protocol.
3
Biomedical Instrumentation
Telemetry applications:

Military Industry
Several researches have beenpresented in the medical, militaryand automotive industries.
Everyday we are more an moreinvolved with telemetry systems.Our cars they now have GPSsystems which guide us to ourdestinies, and even can provide usinformation of positioning, routes or
4
information of positioning, routes orfuel spend.

Automotive Industry
Having an accurate information about shaft’s speed is possible to takebetter decesions during dynamic events like acceleration andendurance of Formula SAE competition.
5
- J. Waldo

TELEMETRY SYSTEM
According to the Telemetry Applications Handbook, a telemetrysystem can be divided into two big funcional blocks. Transmissionsubsystem and reception subsystem, as shown as follows:
System TransducerSignal
ConditioningData
Acquisition
Wireless data
TX/RX
Transducer
6
Transducer Remote location
Data
Analysis
Wireless data
TX/RX
Monitoring and
Control
Monitoring and control
station

SENSING AND SIGNAL CONDITIONING
Hall effect sensors have been used in a wide varietyof applications for years. These applications includethem as proximity switching, positioning and speeddetection
7
In order to detect the speed of the motors’ shaft, thereare placed three permanent magnets equally spacedat 120°, whose magnetic fields can be detected by afixed Hall effect sensor

Because of the magnetic field can be detected from a certain distancebefore the magnet crosses in front of the sensor, and after it crosses it, it isnecessary a signal conditioning stage to transform this variable voltageoutput to a pulse train, which can be processed by a micro controller. Thisconditioning task is performed by a single operational amplifier comparatorwith a reference signal used as threshold.
8

By changing the threshold parameter in the comparator, the pulse width ismodified. Greater thresholds carry thinner pulses, while lower thresholdsimplies wider pulse trains.
Threshold = 0.75
Threshold = 0.40
9
Threshold = 0.40
This pulse trains are countedby a micro controller PIC16F887 in order to computethe corresponding speed.

Wireless transmission and reception is done by two XbeeRF modules working in transparent mode, this impliesthat, all UART data received in the transmission moduleis queued for RF transmission. When RF data isreceived by the reception module, it is transmitted to the
WIRELESS TRANSMISSION AND RECEPTION
10
data analysis block to later be displayed

DATA ANALYSIS AND DISPLAY
Before data is display, it is processed by a median filter, in order to eliminate zeros from the raw data. These zeros are obtained principally by errors in the data transfer process.
monitoring interface developedin the graphical LabViewsoftware gives the user the
11
software gives the user thepossibility to observe the instantspeed through a sliding gauge,the historical speeds displayedin a waveform chart as well asthe channel to properlyestablish communicationbetween the computer and theRF reception module.

RESULTS AND DISCUSSION
To validate the presented work, various measurements were performed,varying principally three variables: Speed given in revolutions per minute( n ), distance of transmission ( d ), and sample time ( T ). In order tohave statistical validity, there were taken 30 samples of every variablecombination, then, this data was fitted into a normal distribution to obtainthe mean and standard deviation of the dataset.
12
Normal distribution fitting

Next figure shows de box plots for diverse datasets obtained varyingspeeds, sample times and measurement distances. First row shows databefore median filtering. Second row show data after median filtering.Data spreading is caused by missed information in the data transferprocessed.
13

CONCLUSSIONS AND FURTHER WORK
In this study, a low cost digital tachometer has been characterized.Important achievements have been reached to implement thismethodology in the research of other physical variables oriented to monitorand control diverse variables in a Formula SAE automobile. Has beenvalidated the reliability and repeatability of the whole system, includingsensing, signal conditioning, wireless transmission-reception, data analysisand data display functional blocks.
14
Diverse experiments were performed, documenting the consequences ofchanging speeds, distances and sample times.

By increasing the sample time, the mean value approaches the realspeed, but the system response is slower. In the other hand, bydecreasing the sample time the response is faster, but the mean valuedeparts from the real value, according to the measurements taken by acommercial optical tachometer model DT-2234C.
Getting an error correspondence between the real speeds and computedspeeds in a given sample time it is possible to obtain a correctionfunction to compensate this difference, while preserving useful timeresponse.
15
response.
As further work is still pending the research of other wirelesstechnologies and/or communication protocols that can be useful ingreater distances and adverse conditions. It is important to note that untilthis point all experiments were done in a laboratory with controlledconditions and may vary when applied to an automobile.

REFERENCES AND NOTES
1. Doost-Mohammady, R.; Chowdhury, K.R. Enhancing Wireless Medical Telemetry through Dynamic Spectrum Access. Proceedings of the IEEE International
Conference on Communications, Ottawa, Canada, June 2012, pp. 1603-1608.
2. Doost-Mohammady, R.; Chowdhury, K.R. Transforming healthcare and medical telemetry through cognitive radio networks. IEEE Transactions on Wireless
Communications, volume 19, issue 4, August 2012, pp. 67-73.
3. Crowley, N. Analysis of Telemetry Satellite Data. Proceedings of the IEEE Aerospace
Conference, volume 4, Aspen, USA, February 1997, pp. 57-64.
16
4. Formation flying radio frequency instrument: First flight results from the PRISMA
mission. Workshop on Satellite Navigation Technologies and European Workshop
on GNSS Signals and Signal Processing, Noordwijk, Netherlands, December 2010, pp. 1-8.
5. Cocco, L.; Daponte, P. Metrology and Formula One Car. Proceedings of the IEEE
International Instrumentation and Measurement Technology Conference, Victoria, Canada, May 2008, pp. 755-760.

6. Chen, F.; McKillip, D. Measurement and Analysis of vibration and deformation using laser metrology and automotive application. Proceedings of the Institution of Mechanical Engineers, Part D, volume 221, issue 6, June 2007.
7. Waldo, J. Embeddeb computing and Formula One racing. IEEE Pervasive Computing, volume 4, issue 3, July 2005, pp. 18-21.
8. Telemetry Applications Handbook. New, Mexico, USA, Telemetry Group U.S. Army
White Sands Missile Range. Available online: http://www.dtic.mil/dtic/tr/fulltext/u2/a193741.pdf (accessed on
10/05/2014).
17
10/05/2014).
9. Kavanagh, R.C. Improved Digital Tachometer With Reduced Sensitivity to Sensor
Nonideality, IEEE Transactions on Industrial Electronics, volume 47, issue 4, August
2000, pp. 890-897.
© 2014 by the authors; licensee MDPI, Basel, Switzerland. This article is an open
access article distributed under the terms and conditions of the Creative Commons Attribution license (http://creativecommons.org/licenses/by/3.0/).

Sergio Gonzalez-DuarteJorge Antonio Cardona-Soto
Carlos Omar Seanez-HernandezEsteban Rubio-Ochoa
Jessica Hieraldin Aguirre-Fernandez
Universidad Tecnológica de Chihuahua
18
Universidad Tecnológica de ChihuahuaMechatronics department
Tel. +52(614)432-2000 ext. 168Av. Montes Americanos 9501
Sector 35, C.P. 31216Chihuahua, Chih., México
{sgonzalez, jcardona, cseanez, erubio, jaguirre}@utch.edu.mx
Top Related