


Languages
Pages
Legal


CHARACTERISTICS OF LIMES PRODUCED FROM MARBLES
AND LIMESTONES
A Thesis Submitted to the Graduate School of Engineering and Science of
İzmir Institute of Technology in Partial Fulfillment of the Requirements for the Degree of
MASTER OF SCIENCE
in Architectural Restoration
by Gülcan TOPRAK
July 2007 İzmir, Turkey

We approve the thesis of Gülcan TOPRAK
Date of Signature …………………………………………………….. 10 July 2007 Prof. Dr. Hasan BÖKE Supervisor Department of Architectural Restoration İzmir Institute of Technology …………………………………………………….. 10 July 2007 Prof. Dr. Başak İPEKOĞLU Department of Architectural Restoration İzmir Institute of Technology …………………………………………………….. 10 July 2007 Assoc. Prof. Dr. Neriman Şahin GÜÇHAN Department of Architecture Middle East Technical University …………………………………………………….. 10 July 2007 Prof. Dr. Başak İPEKOĞLU Head of Architectural Restoration İzmir Institute of Technology
………………………………………………….................. Prof. Dr. M. Barış ÖZERDEM
Head of the Graduate School

ACKNOWLEDGEMENTS
I would like to present my sincere gratitude to my supervisor Prof. Dr. Hasan Böke
for his valuable guidance, contributions and supervision throughout this study. I am also
thankfull to him for his unlimited patience, and understanding. I am really glad to have
the oppurtunity to be his student and nothing can be enough to express my thankfulness
to him.
I am also grateful to Assoc. Prof. Dr. Neriman Şahin Güçhan, Prof. Dr. Başak
İpekoğlu for their valuable evaluations and recommendations in the critics of the jury.
I would like to thank to my friends in Iztech, Res. Assist. Elif Uğurlu and Res.
Assist. Kerem Şerifaki first of all for their friendship and then valuable support
thorought my master education. I would also present my special thanks to team of
Centre for Materials Research of the Institute for the XRD, SEM analysis and
mechanical tests of the study, research scientist Gökhan Erdoğan, Duygu Oğuz Kılıç,
Evrim Yakut, Mine Bahçeci for their valuable helps.
I am thankful to my best friends, Filiz Kuşcu Yeşildere, Pınar Yılmaz Acar, İrem
Erbaş, and Bengi Bulut with all my heart, for being by my side in every decision I
make. I would also present my special thanks to Mustafa Bastıyalı who shared his
knowledge and experience graciously with me.
Finally, I would like to express my thankfullness to my dear parents Gül and Yusuf
Toprak, my brother Gökhan for their love, encouragement and support during the
realization process of my thesis and during all my lifetime. I present my special thanks
to all of them for always being with me whenever I needed. I would like to dedicate this
work to my family.

ABSTRACT
CHARACTERISTICS OF LIMES PRODUCED FROM LIMESTONES
AND MARBLES
In this study, characteristics of lime produced from some marbles and
limestones were investigated in order to compare their effects on the lime mortars. For
this purpose, limestones that contain low and high amounts of diatoms and marbles
quarried from the city of Muğla and the Marmara island were selected as samples.
The calcination temperatures of the stones were found to be around 800 °C by
TGA analysis. Considering their calcination temperatures, they were heated to 850 °C
in a laboratory furnace, then slaked and carbonated. Before and after these processes,
mineralogical and chemical compositions, and microstructures of the products were
investigated by XRD and SEM-EDS analysis.
The hydraulic properties of carbonated limes were evaluated by determining
weight loss at the temperatures between 200-600oC due to the loss of the structurally
bound water of hydraulic products and weight loss at the temperatures over 600oC due
to carbon dioxide released during the decomposition of calcium carbonates by TGA.
The effects of limes on the properties of mortars were investigated by producing
lime mortars and comparing their compressive strengths during one year carbonation in
laboratory condition. Mortars were prepared with one part (in weight) of lime and three
parts (in weight) of marble aggregates.
The results of the study indicated that the lime produced from limestone
containing high amounts of diatoms is highly hydraulic due to formation of calcium
silicate whereas the others are non-hydraulic. The mortars prepared from lime
containing high amounts of diatoms were found to be relatively high in compressive
strength due to its hydraulicity.
The results show that the production of hydaulic lime composed mainly of
calcium silicate at a relatively low calcinations temperature (850 °C) is possible.
Considering this result, it can be concluded that hydraulic lime could be produced by
the calcining of limestone containing diatoms in historic kilns.
iv
ÖZET
MERMER VE KİREÇ TAŞLARINDAN ELDE EDİLEN KİREÇLERİN
ÖZELLİKLERİ
Bu çalışmada, farklı mermer ve kireç taşlarından elde edilen kireçlerin
özellikleri ve elde edilen kirecin kireç harçları üzerine etkisi incelenmiştir. Bu sebeple,
Urla bölgesindeki bazı tarihi binalarda kullanılmış, yüksek ve düşük miktarda diatom
içeren 2 tip kireç taşı ile Muğla ve Marmara Adası’ndan çıkarılan mermerler üzerinde
çalışma yapılmıştır.
Mermer ve kireç taşların kalsinasyon sıcaklıkları TGA analizleri ile yaklaşık
800 °C olarak belirlenmiştir. Belirlenen kalsinasyon sıcaklıklarına göre taşlar öncelikle
850 °C de laboatuar fırınında yakılmış, daha sonra söndürülüp karbonatlaşmaya
bırakılmıştır. Tüm bu süreçlerin öncesinde ve sonrasında örneklerin, mineralojik ve
kimyasal kompozisyonları ile mikro yapıları XRD ve SEM-EDS analizleriyle
belirlenmiştir.
Karbonatlaşmış kireç örneklerin hidrolik özelliklerini belirlemek amacıyla TGA
analizlerindeki ağırlık azalışları gözlenmiştir. 200-600 °C arasındaki ağırlık azalışı su
kaybına bağlıyken 600 °C üzerindeki ağırlık azalışı ise karbon dioksit gazının açığa
çıkmasıyla açıklanmaktadır.
Kirecin kireç harçları üzerine ektisini görmek amacıyla, elde edilen farklı tip
kireçlerden kireç harçları hazırlanmış ve hazırlanan kireç harçlarının mekanik özellikleri
bir senelik karbonatlaşma süreci boyunca laboratuar ortamında yapılan testlerle
belirlenmiştir. Harçların hazırlanmasında 1 ölçek kirece karşılık 3 ölçek mermer
agregaları kullanılmıştır.
Bu çalışmanın sonuçları, yüksek oranda diatom içeren kireç taşından elde edilen
kirecin kalsiyum silikat oluşumuna bağlı olarak yüksek hidrolik özelliklere sahip
olduğunu göstermektedir. Diğer örneklerden hazırlanan kireçler ise hidrolik özellikler
taşımamaktadır. Bununla beraber, yüksek oranda diatom içeren kireç ile hazırlanan
harçlar daha yüksek basınç mukavemetlerine sahiptir.
Sonuçlar yüksek oranda kalsiyum silikat içeren hidrolik kireçlerin düşük
sıcaklıklarda elde edilebileceğini göstermektedir. Bu sonuç diatom içeren kireç
v

taşlarının yakılması sonucu hidrolik kireç elde edilebilmenin mümkün olduğunu
kanıtlamaktadır.
vi

TABLE OF CONTENTS LIST OF FIGURES ........................................................................................................ ix
LIST OF TABLES......................................................................................................... xii
CHAPTER 1: INTRODUCTION ....................................................................................1
1.1. Raw Materials of Lime ..........................................................................................1
1.1.1. Limestones ......................................................................................................2
1.2. Calcination Process of Calcareous Stones .............................................................3
1.2.1. Lime Kilns ......................................................................................................4
1.2.2. Factors That Affect the Properties of Quicklime............................................5
1.3. Hydration (Slaking) of Calcined Limestones ........................................................6
1.3.1. Factors Influencing the Characteristics of Lime.............................................6
1.4. Carbonation Process of Lime.................................................................................8
1.4.1. Factors Influencing the Carbonation Reaction ...............................................9
1.6. Types of Lime......................................................................................................10
1.6.1. Non-hydraulic Limes ....................................................................................10
1.6.2. Hydraulic Limes ...........................................................................................11
1.7. Aim of the Study..................................................................................................12
CHAPTER 2: EXPERIMENTAL METHODS ..............................................................15
2.1. Marble and Limestone Samples...........................................................................15
2.2.Determination of Bulk Densities and Porosities of Stones...................................16
2.3.Preparation of Stone Samples for Calcination......................................................17
2.4. Determination of Calcination Temperatures of Stones.......................................17
2.5. Calcination Process of the Samples .....................................................................17
2.6. Slaking and Carbonation of Calcined Stone Samples .........................................18
2.7. Determination of Mineralogical Compositions of Unheated and
Calcined Stones (quicklime), Slaked and Carbonated Lime ..............................18
2.8. Determination of Microstructural and Chemical Compositions of
Unheated and Heated Stones (quicklime), Slaked and Carbonated
Lime ....................................................................................................................18
2.9. Determination of Hydraulicity of Lime by TGA.................................................19
2.10. Preparation of Lime Mortars..............................................................................19
2.11. Determination of Uniaxial Compressive Strengths of Mortars .........................20
2.12. Determination of Modulus of Elasticity of Mortars ..........................................20
vii

CHAPTER 3: RESULTS AND DISCUSSION..............................................................22
3.1. Densities and Porosities of Marbles and Limestones ..........................................22
3.2. Mineralogical Compositions of Marbles and Limestones ..................................23
3.3. Chemical Compositions of Marbles and Limestones .........................................27
3.4. Microstructural Characteristics of Marmara and Muğla Marbles ......................30
3.5. Microstructural Characteristics of White and Grey Limestones .........................31
3.6. Calcination Temperatures of Marbles and Limestones .......................................35
3.7. Mineralogical Characteristics of Calcined Marbles and Limestones ..................37
3.8. Microstructural Characteristics of Calcined Marmara and Muğla
Marbles ...............................................................................................................40
3.9. Microstructural Characteristics of Calcined White and Grey
Limestones ..........................................................................................................42
3.10. Mineralogical Characteristics of Limes Produced from Slaking of
Calcined Marbles and Limestones......................................................................46
3.11. Microstructural Characteristics of Limes Produced from Slaking of
Calcined Marmara and Muğla Marbles ..............................................................48
3.12. Microstructural Characteristics of Limes Produced from Slaking of
Calcined White and Grey Limestones ................................................................51
3.13. Mineralogical Composition of Carbonated Limes Produced from
Calcined Marbles and Limestones......................................................................52
3.14. Microstructure of Carbonated Lime Produced from Marmara and
Muğla Marbles....................................................................................................56
3.15. Microstructure of Carbonated Lime Produced from White and Grey
Limestone............................................................................................................58
3.16. Hydraulicity of the Carbonated Limes...............................................................61
3.17. Mineralogical Compositions of Lime Mortars after One Year
Carbonation.........................................................................................................65
3.18. Uniaxial Compressive Strengths and Modulus of Elasticities of
Test Mortars........................................................................................................70
CHAPTER 4: CONCLUSION .......................................................................................72
REFERENCES ...............................................................................................................74
viii

LIST OF FIGURES Figure Page
Figure 3.1. XRD patterns of Marmara(a) and Muğla(b) marbles. ............................24
Figure 3.2. XRD patterns of white (a) and gray (b) limestones. ...............................25
Figure 3. 3. FT-IR spectrum of Marmara(a) and Muğla(b) marbles..........................26
Figure 3.4. FT-IR spectrum of white(a) and grey(b) limestones. .............................27
Figure 3.5. SEM pictures of calcite crystals in the Marmara marble........................30
Figure 3.6. SEM pictures of calcite crystals in the Muğla marble. ...........................31
Figure 3.7. SEM pictures of micritic calcite crystals in white limestone..................32
Figure 3.8. SEM pictures of micritic calcite crystals in grey limestone. ..................33
Figure 3.9. SEM images of diatoms embedded in calcite crystals in grey
limestone.................................................................................................33
Figure 3.10. SEM images of a disk (a) and bow (b) shaped diatom
frustules; small holes on their surfaces (c,d);precipitated
small size of calcite crystals on the surface and the holes of
the diatoms (e). .......................................................................................34
Figure 3. 11. TGA graphs of marbles and limestones..................................................36
Figure 3.12. XRD patterns of calcined Marmara (a) and Muğla (b)
marbles....................................................................................................38
Figure 3.13. XRD patterns of calcined white (a) and grey (b) limestones..................39
Figure 3.14. Secondary electron images and EDS spectrum of calcium
oxide crystals of calcined Marmara marble. ...........................................41
Figure 3.15. Secondary electron images and EDS spectrum of calcium
oxide crystals of calcined Muğla marble. ...............................................42
Figure 3.16. Secondary electron images and EDS spectrum of the calcium
oxide crystals of calcined white limestones............................................43
Figure 3.17. Secondary electron images and the EDS spectrum of calcium
oxide crystals of calcined grey limestone. ..............................................44
Figure 3.18. Secondary electron images and the EDS spectrum of calcium
silicate formed by the reaction of diatoms and calcium oxide
during the calcination of the grey limestone...........................................45
Figure 3.19. XRD patterns of slaked Marmara (a) and Muğla (b) marbles. ...............47
Figure 3.20. XRD patterns of slaked white (a) and grey (b) limestones.....................48
ix
Figure 3.21. Secondary electron images and the EDS spectrum of calcium
hydroxide formed by slaking of calcined Marmara marble..................49
Figure 3.22. Secondary electron images and the EDS spectrum of calcium
hydroxide crystals formed by slaking of the calcined Muğla
marble. ....................................................................................................50
Figure 3.23. Secondary electron images and the EDS spectrum of calcium
hydroxide crystals formed by the slaking of calcined white
limestone.................................................................................................51
Figure 3.24. Secondary electron images and the EDS spectrum of calcium
hydroxide and calcium silicate crystals formed by the slaking
of calcined grey limestone. .....................................................................52
Figure 3.25. XRD patterns of carbonated Marmara (a) and Muğla (b)
limes........................................................................................................55
Figure 3.26. XRD patterns of carbonated limes produced from white (a)
and grey (b) limestones...........................................................................56
Figure 3.27. Secondary electron images and EDS spectrum of carbonated
lime produced from Marmara marble. ....................................................57
Figure 3.28. Secondary electron images and EDS spectrum of calcite
crystals containing magnesium in carbonated lime produced
from Muğla marble. ................................................................................58
Figure 3.29. Secondary electron images and EDS spectrum of calcite
crystals in carbonated lime produced from white limestone. .................59
Figure 3.30. Secondary electron images and EDS spectrum of calcite
crystals in carbonated lime produced from grey limestone. ..................60
Figure 3.31. Secondary electron images and EDS spectrum needle like
calcium silicate hydrate formation in carbonated lime
produced from grey limestone. ...............................................................61
Figure 3.32. TGA graphs of carbonated limes produced from Marmara
(a), Muğla (b)marbles and white (c) and grey (d) limestones. ...............64
Figure 3.33. XRD patterns of mortars produced from Marmara lime after
theree (a), six (b) and twelve (c) months carbonation. ...........................66
Figure 3.34. XRD patterns of mortars produced from Muğla lime after
theree (a), six (b) and twelve (c) months carbonation. ...........................67
x

Figure 3.35. XRD patterns of mortars produced from white lime after
theree (a), six (b) and twelve (c) months carbonation. ...........................68
Figure 3.36. XRD patterns of mortars produced from grey lime after three
(a), six (b) and twelve (c) months carbonation. ......................................69
Figure 3.37. Uniaxial compressive strengths and modulus of elasticities
of test mortars. ......................................................................................70
xi

LIST OF TABLES
Table Page
Table 2.1. Definitions of stone samples......................................................................16
Table 3.1. Density and porosity values of marbles and limestones. ...........................22
Table 3.2. Minerals determined by XRD analysis in marbles and
limestones. .................................................................................................23
Table 3.3. Elemental compositions of marbles and limestones and
percentage of weight loss at temperature 900° C.......................................29
Table 3.4. Percentage of weight loss observed in the marbles and
limestones between 700-800 ° C by the TGA analysis. .............................35
Table 3.5. Minerals determined by the XRD analysis after calcination of
marbles and limestones. .............................................................................37
Table 3.6. Minerals identified by the XRD analysis after the hydration of
calcined marbles and limestones................................................................46
Table 3.7. Minerals identified by XRD analysis after carbonation. ...........................54
Table 3.8. Classification of limes according to cementation and
hydraulicity indices....................................................................................62
Table 3.9. Cementation and hydraulicity indices of carbonated limes. ......................62
Table 3.10. The weight losses between 200°C and 600°C and weight
losses over 600°C of carbonated limes. .....................................................63
Table 3.11. Ratios of intense peak of CaCO3 (29.4 2 Θ) to Ca(OH)2 (34.0 2
Θ) after 3, 6 and 12 months carbonation. ...................................................65
Table 3.12. Compressive strength values of the samples. ............................................71
Table 3.13. Modulus of elasticity values of the samples. .............................................71
xii

CHAPTER 1
INTRODUCTION Lime is the most frequently used traditional material in building industry for more
than three thousands years. The earliest civilizations such as Incas, Mayas, Chinese,
Egyptians, ancient Greeks and Romans used lime for mortar binder in brick or stone
masonry and for rendering the masonry surfaces (Boynton 1966, Cowper 2000). Today,
it is still the most conventional material used in modern building industry.
In this chapter, the process of lime production is described to discuss the effects of
its characteristics as binders on the lime mortars which is the main aim of this study. For
this purpose, calcination of limestone, slaking of quicklime, carbonation of lime and the
factors influencing the processes of calcination of calcareous stone and slaking and
carbonation of lime are shortly defined in this section.
1.1. Raw Materials of Lime
Lime is produced by calcining (heating) of calcareous stones which are
primarily composed of calcium carbonate (CaCO3) and then hydration of the calcination
products (Boynton 1966, Eckel 1928, Holmes and Wingate 1997). The most abundant
type of calcareous stone is limestone in variable forms of calcareous stones in nature.
Some of the most common types of calcareous stones are marble, travertine, chalk,
tufa, glass stone, Iceland spar, coquina, marl, oyster shell, stalactites and stalagmites,
and varying forms of limestone (Boynton 1966, Davey 1961, Eckel 1928).
Marble is the most dense metamorphic stone type formed under the high
temperatures and pressure (Boynton 1966, Holmes and Wingate 1997). It has several
types in color, purity and composition (Boynton 1966, Holmes and Wingate 1997).
Travertine is a dense and hard stone type formed by chemical deposition of calcium
carbonate (CaCO3) in natural hot-water springs (Boynton 1966, Holmes and Wingate
1997). Chalk occurs in shallow water such as lakes and seas and contains some parts of
shells, animals and calcareous algae (Holmes and Wingate 1997). It is a soft, fine-
grained stone which has different forms in color and purity (Boynton 1966).
1
Iceland spar that is very difficult to find such a pure type in nature is a pure
calcareous stone which contains about %99.9 of calcite (CaCO3) (Boynton 1966). Marl
is a type of calcareous stone which contains high amounts of clay and sand particles
(Boynton 1966). Stalactites and stalagmites are other types of calcareous stones which
are formed by deposition of calcium carbonate in cold groundwater and found on the
roofs and floors of caverns (Boynton 1966).
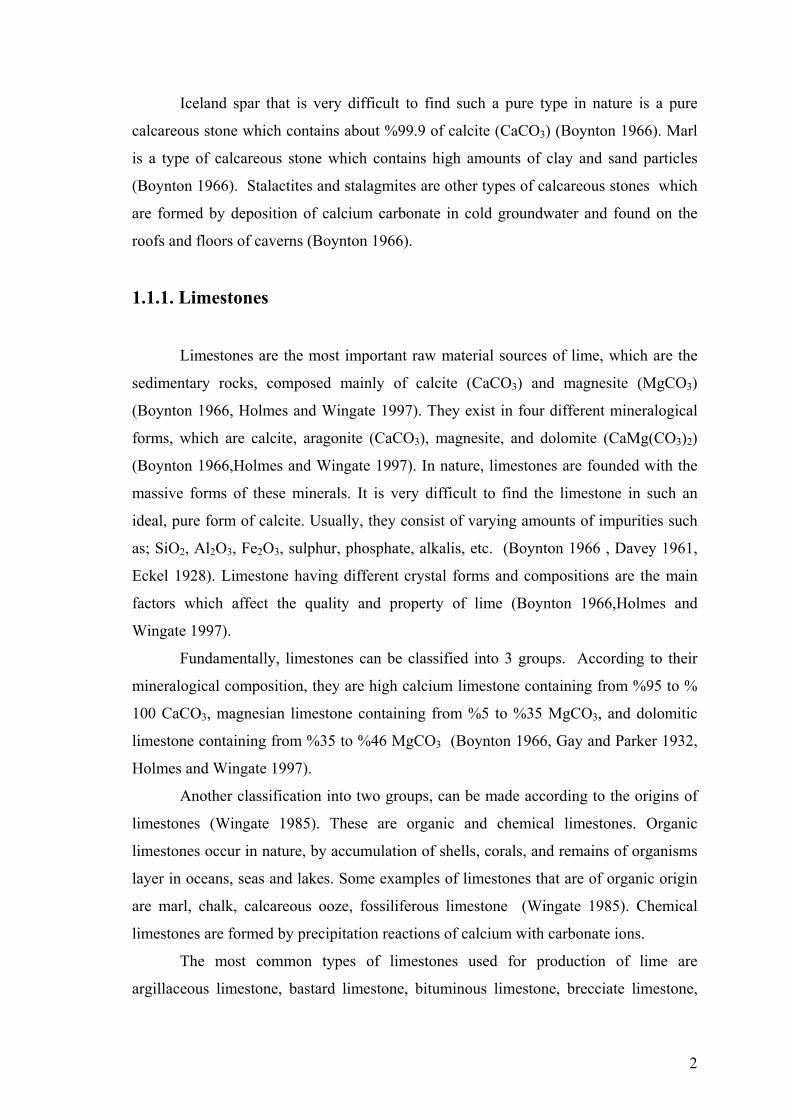
1.1.1. Limestones
Limestones are the most important raw material sources of lime, which are the
sedimentary rocks, composed mainly of calcite (CaCO3) and magnesite (MgCO3)
(Boynton 1966, Holmes and Wingate 1997). They exist in four different mineralogical
forms, which are calcite, aragonite (CaCO3), magnesite, and dolomite (CaMg(CO3)2)
(Boynton 1966,Holmes and Wingate 1997). In nature, limestones are founded with the
massive forms of these minerals. It is very difficult to find the limestone in such an
ideal, pure form of calcite. Usually, they consist of varying amounts of impurities such
as; SiO2, Al2O3, Fe2O3, sulphur, phosphate, alkalis, etc. (Boynton 1966 , Davey 1961,
Eckel 1928). Limestone having different crystal forms and compositions are the main
factors which affect the quality and property of lime (Boynton 1966,Holmes and
Wingate 1997).
Fundamentally, limestones can be classified into 3 groups. According to their
mineralogical composition, they are high calcium limestone containing from %95 to %
100 CaCO3, magnesian limestone containing from %5 to %35 MgCO3, and dolomitic
limestone containing from %35 to %46 MgCO3 (Boynton 1966, Gay and Parker 1932,
Holmes and Wingate 1997).
Another classification into two groups, can be made according to the origins of
limestones (Wingate 1985). These are organic and chemical limestones. Organic
limestones occur in nature, by accumulation of shells, corals, and remains of organisms
layer in oceans, seas and lakes. Some examples of limestones that are of organic origin
are marl, chalk, calcareous ooze, fossiliferous limestone (Wingate 1985). Chemical
limestones are formed by precipitation reactions of calcium with carbonate ions.
The most common types of limestones used for production of lime are
argillaceous limestone, bastard limestone, bituminous limestone, brecciate limestone,
2

calcitic limestone, carbonaceous limestone, cement stone, chemical-grade limestone,
compact limestone, coral limestone, cherty limestone, dolomitic limestone, ferruginous
limestone, fossiliferous limestone, glauconic limestone, high calcium limestone,
hydraulic limestone, Indiana limestone, lias limestone, lithographic limestone,
magnesian limestone, metallurgical grade limestone, oolitic limestone, phosphatic
limestone, pisolitic limestone, shell limestone and siliceous limestone. (Boynton 1966,
Davey 1961, Eckel 1928, Holmes and Wingate 1997).
1.2. Calcination Process of Calcareous Stones
Lime is produced by calcining of limestone at temperatures over 800 ° C in a
%100 CO2 atmosphere at 760 mmHg pressure (Boynton 1966). In the calcination
process, limestone decomposes by expelling carbon dioxide gas (CO2) and converts to
calcium oxide (CaO). This product is called as “quicklime” (Boynton 1966, Boynton
1984, Holmes and Wingate 1997). In the process, there are three main requirements
which are heating the stone to its dissociation temperature, providing for minimum
temperature for a certain duration, and expelling the CO2 gas from the stone (Boynton
1966).
When a pure limestone (calcite) is heated to its dissociation temperature, it loses
44% of molecular weight by expulsing of CO2 (Boynton 1966). The composition and
quantitative dissociation of reaction are as follows;
CaCO3 + heat CaO + CO2 (Reaction 1.1)
100 56 44
In dolomitic and magnesian limestone, there will be greater loss, compared to
calcite. If a dolomitic limestone containing 60% CaCO3 and 40% MgCO3 is heated, it
loses 47.36% of molecular weight by driving off CO2 (Eckel 1928 ). This affects the
quantity of quicklime (CaO). The more MgCO3 content is in a limestone, the less is the
CaO that formed in burning process (Eckel 1928).
The dissociation temperature of limestone varies according to the type of the
limestone (Boynton 1966, McClellan 1970). The most important factors that affect the
dissociation temperature are chemical purity and physical characteristics of limestone
3

(Boynton 1966, McClellan 1970). The dissociation temperature for a pure limestone
which is primarily composed of CaCO3 is 898 °C for 760 mm pressure for a 100 % CO2
atmosphere. (Boynton 1966). However, for dolomitic and magnesian limestone the
temperature changes according to the ratio of MgCO3 to CaCO3 (Boynton 1966). While
dissociation of the pure magnesium carbonate (MgCO3 ) is accomplished at 402–480°C,
the dolomitic limestone decomposes at higher temperatures, (dense, fine crystalline type
at 500°C; fairly crystalline type at 650°C ; and highly crystalline type at 750°C)
(Boynton 1966) .
The size of the limestone pieces influences the time required for the calcination
process (Boynton 1966, Boynton 1984). The calcination of large stones is completed in
longer time compared to smaller ones; because the reaction begins at outer surfaces of
the stone and then develops into inner sides. The greater the size of the stone, the greater
time is required for the calcination (Boynton 1966, Boynton 1984, Hassibi 1999).
1.2.1. Lime Kilns Calcination is carried out in lime kilns. In ancient times, to supply the limestones
easily used in calcination, the kilns were built near limestone quarries. (Davey 1961,
Eckel 1928) . The main substances burnt as source of energy were charcoal and wood
used for calcination of limestones (Davey 1961) . There were two basic types of lime
kilns which were, flare kilns and continuous kilns.
In flare kilns limestones were burnt with the heat and flames without any contact
with fuel. This is called intermittent burning (Davey 1961) . The burning process was
carried out 1.5 or 2 days at temperature lower than 900 °C (Callebaut 2000).
In running kilns continuous burning was carried out. Limestones and fuel took
place alternately in the kilns and calcined one then the other successively. The
calcination process was completed entirely about in a week.
Quicklime produced in flare kilns were more pure and whiter when compared to
quicklime produced in running kilns. Therefore, flare kilns increased the quality of the
produced quicklime (Davey 1961) . Today, ring kiln and rotary kilns are used for
calcination of both lime and portland cement. Since oil and gas are the main energy
source, it is possible to reach high temperatures in modern types of kilns. Therefore,
both C2S and C3S are present in some 19 th century lime mortars (Callebaut 2000).
4

1.2.2. Factors That Affect the Properties of Quicklime
The chemical composition, the surface area, the porosity, the pore size
distribution, the size of crystals of limestone affect the properties of produced quicklime
(Eades and Sandberg 1970, McClellan 1970).
Chemical composition: Properties of quicklime are mainly affected by
chemical composition of the raw material (Eades and Sandberg 1970, McClellan 1970).
If a pure limestone composed with high percentages of calcium carbonate is used as a
raw material, quicklime that is rich in calcium will be produced. When argillaceous
limestones having high percentages of siliceous and argilleceous material are calcined at
high temperatures (over 950 C), hydraulic compounds such as calcium aluminates -
silicates are formed. The formation of hydraulic compounds depends on the silica-lime
and the alumina-lime reaction, which increase hydraulic properties of lime (Cowper
2000, Davey 1961, Eckel 1928).
Physical characteristics of the raw material: Physical characteristics of the
limestone also affect the properties of quicklime (Eades and Sandberg 1970, McClellan
1970). The limestone that has high porosity produces more porous quicklime, while the
one that has low porosity forms less porous quicklime. The high porous quicklime is
more rapidly hydrated with water than that of less porous one (Moropoulou et al. 2001).
Calcination conditions: The calcination temperature, the retention time and the
fuel used in the calcination are the other factors that influence the properties of
quicklime. The optimum temperature for the calcination process is 900 °C (Boynton
1966, Cowper 2000, Davey 1961). When the limestone is calcined at the temperature of
900 °C, the produced quicklime will have a large surface area, and high porosity which
increase the chemical reactivity (Boynton 1966, Cowper 2000, Davey 1961). If a
limestone is calcined at a temperature lower than 900 °C, the produced quicklime will
be under-burnt which is the result of the incomplete process (Boynton 1966, Boynton
1984). On the other hand, when the calcination temperature is higher than 900 °C, the
quicklime will be hard-burnt (Boynton 1984, Gillott 1967, Holmes and Wingate 1997).
Moreover, exposed to higher temperatures at 1400 °C or over it will produce less
5

reactive quicklime which is called dead-burnt lime having a dark color, low porosity,
high density and a small surface area (Boynton 1984, Gillott 1967, Boynton 1984,
Gillott 1967, Swallow 1995).
The retention time of calcination influences the properties of the quicklime. If
the limestone is calcined more than its optimum duration, the quicklime will be hard-
burnt or dead-burnt. In contrast, a short retention time produces an under-burnt
quicklime (Potgier et al. 2002).
1.3. Hydration (Slaking) of Calcined Limestones
The hydration of quicklime with water, known as slaking, is a highly exothermic
reaction. During the hydration reaction, the calcium oxide combines with water and
forms ‘lime hydrate’ or ‘hydrated lime’ (Ca(OH)2) (Reaction 1.2) (Boynton 1966,
Wingate 1985).
CaO + H2O Ca(OH)2 + heat (Reaction 1.2)
Quicklime Water Lime
Upon the reaction, the surface area and the volume of produced lime are higher
than the quicklime’s (Boynton 1966 , Eckel 1928, Holmes and Wingate 1997, Oates
1991, Wingate 1985). The degree of expansion changes with the chemical compositions
of quicklime (Boynton 1966, Eckel 1928, Holmes and Wingate 1997, Wingate 1985).
The pure quicklime having low amounts of magnesium oxide and other impurities
expanses in volume by over 3 times. However, the impure quicklime will show less
expansion (Boynton 1966, Holmes and Wingate 1997, Wingate 1985). Moreover, if the
pure quicklime is slaked within the total amount of water at once, which is required for
a complete hydration, the expansion will be 3.5 times in volume. Nevertheless, if it is
slaked step by step, the volume of the lime will increase about 1.7 times (Eckel 1928).
1.3.1. Factors Influencing the Characteristics of Lime
The hydration process and the quality of lime change with the properties of
quicklime such as impurity, porosity, pore size distribution, crystals size, MgO content
6
and some external factors such as slaking temperature, amount of water, water quality,
water/lime ratio, slaking temperature, agitation rate, and aging of lime putty.
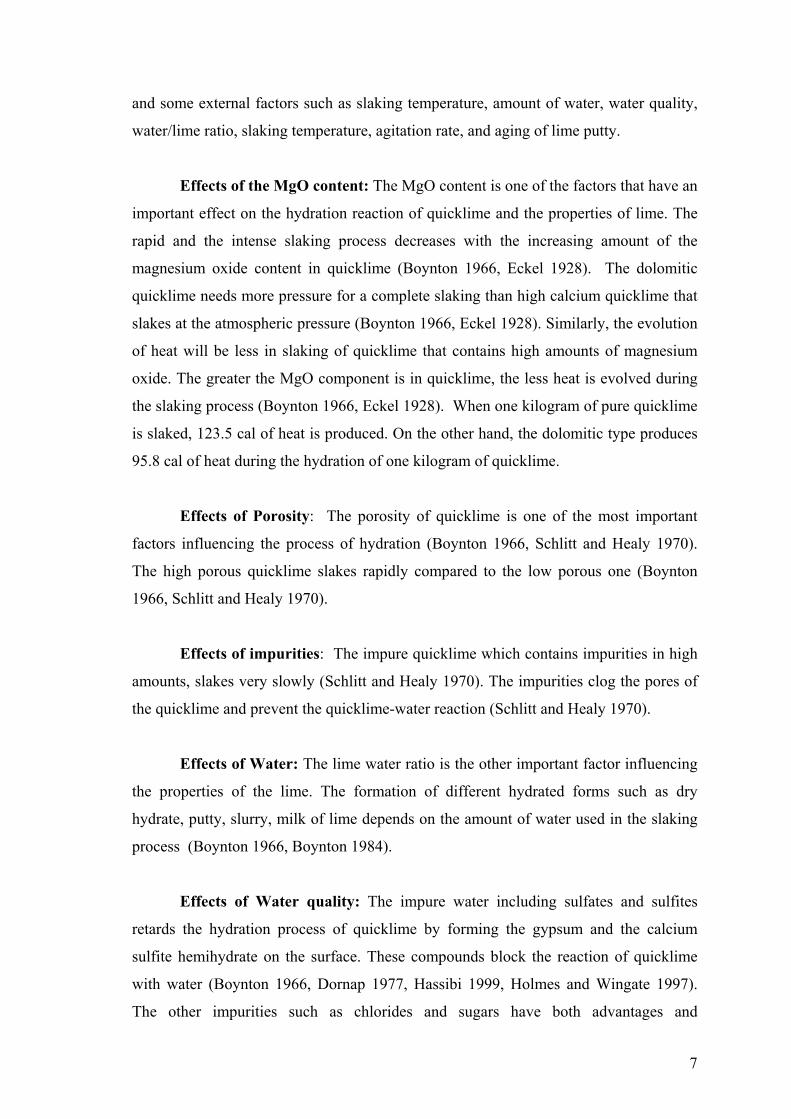
Effects of the MgO content: The MgO content is one of the factors that have an
important effect on the hydration reaction of quicklime and the properties of lime. The
rapid and the intense slaking process decreases with the increasing amount of the
magnesium oxide content in quicklime (Boynton 1966, Eckel 1928). The dolomitic
quicklime needs more pressure for a complete slaking than high calcium quicklime that
slakes at the atmospheric pressure (Boynton 1966, Eckel 1928). Similarly, the evolution
of heat will be less in slaking of quicklime that contains high amounts of magnesium
oxide. The greater the MgO component is in quicklime, the less heat is evolved during
the slaking process (Boynton 1966, Eckel 1928). When one kilogram of pure quicklime
is slaked, 123.5 cal of heat is produced. On the other hand, the dolomitic type produces
95.8 cal of heat during the hydration of one kilogram of quicklime.
Effects of Porosity: The porosity of quicklime is one of the most important
factors influencing the process of hydration (Boynton 1966, Schlitt and Healy 1970).
The high porous quicklime slakes rapidly compared to the low porous one (Boynton
1966, Schlitt and Healy 1970).
Effects of impurities: The impure quicklime which contains impurities in high
amounts, slakes very slowly (Schlitt and Healy 1970). The impurities clog the pores of
the quicklime and prevent the quicklime-water reaction (Schlitt and Healy 1970).
Effects of Water: The lime water ratio is the other important factor influencing
the properties of the lime. The formation of different hydrated forms such as dry
hydrate, putty, slurry, milk of lime depends on the amount of water used in the slaking
process (Boynton 1966, Boynton 1984).
Effects of Water quality: The impure water including sulfates and sulfites
retards the hydration process of quicklime by forming the gypsum and the calcium
sulfite hemihydrate on the surface. These compounds block the reaction of quicklime
with water (Boynton 1966, Dornap 1977, Hassibi 1999, Holmes and Wingate 1997).
The other impurities such as chlorides and sugars have both advantages and
7

disadvantages. In one hand they have an accelerating effects on the hydration reaction
(Boynton 1966, Dornap 1977, Hassibi 1999, Holmes and Wingate 1997). On the other
hand, chlorides are the source of soluble salts, which are the cause of the deterioration.
To achieve an accomplished and successful hydration process, the water that is used in
the reaction should be excessively pure (Boynton 1966, Dornap 1977, Hassibi 1999,
Holmes and Wingate 1997).
Effects of temperature: The slaking temperature has an important factor that
effects the hydration reaction of the quicklime (Boynton 1966, Hedin 1963). If the
slaking temperature is high, the slaking process will take place rapidly (Boynton 1966,
Hedin 1963). However, extremely higher slaking temperatures damage the plastic
properties of the lime (Cowper 2000). Therefore, in order to achieve an effective
hydration process, the reaction should be performed at a temperature between 71 °C and
93 °C (Boynton 1966).
Effects of stirring: The stirring has an accelerating effect on the slaking
process of the quicklime by providing a rapid diffusion of water into quicklime
(Boynton 1966, Dornap 1977). A slow agitation has an unfavorable effect on the slaking
of quicklime, which causes incomplete hydration reaction (Boynton 1966).
Effects of aging: Aging has a favorable effect on the quality of the lime
(Carrington and Swallow 1996, Lynch 1998). Both the plasticity and the water retention
capacity of the lime are increased upon aging (Cowper 2000). During the aging process,
the crystals size of the lime reduces and the surface area increases. A high surface area
develops a faster carbonation process (Rodriguez et al. 1998).
1.4. Carbonation Process of Lime
Carbonation is a hardening process of the hydrated lime with the carbon dioxide
gas. During the carbonation process, CO2 diffuses through the lime and dissolves in the
water present on the surface of lime and forms the carbonic acid. The carbonic acid
reacts with the lime and then the calcium carbonate is formed (Reactions 1.3-1.4)
(Holmes and Wingate 1997, Moorehead 1986, Van Balen and Van Gemert 1994).
8

CO2 + H2O H2CO3 (Reaction 1.3)
Ca (OH)2 + H2CO3 CaCO3 + 2H2O + 74kj (Reaction 1.4)
1.4.1. Factors Influencing the Carbonation Reaction
The rate of the carbonation depends on CO2 concentration, air pressure, and
moisture content of the lime, temperature, relative humidity and thickness of specimen.
Their effects are shortly described in this section.
CO2 gas concentration: High concentration of CO2 gas speeds the carbonation
reaction of lime, which is directly proportional to concentration of CO2 (Moorehead
1986). However, in a 100% CO2 atmosphere, rapid carbonation takes place on the
surface of the lime and the further carbonation is prevented (Moorehead 1986).
Moisture content: The moisture content of the lime is an important factor that
influences the absorption of CO2 gas from the atmosphere (Cazalla et.al. 2000, Van
Balen and Van Gemert 1994). The carbonation reaction develops more rapidly in
optimum saturated conditions. On the other hand, in dry or fully saturated conditions,
the reaction becomes slower. (Moorehead 1986).
Temperature: High temperatures increase the rate of the chemical reaction.
But, it decreases the solubility of the carbon dioxide and the hydrated lime in the water.
Therefore, the optimum value for the carbonation temperature is about 20°C (Van Balen
and Van Gemert 1994).
Relative Humidity: The carbonation of the slaked lime is accelerated with
increasing relative humidity between the range of 25% and 95%. (Cazalla et al. 2000,
Swenson and Sereda 1968).
9

Permeability: Low permeability has a retarding effect on the rate of carbonation
reaction which reduces the speed of absorption of CO2 gas from the atmosphere. The
slow rate of carbonation takes place in the low permeable lime (Moorehead 1986).
Thickness of the lime: The carbonation reaction begins on the surface of the
lime and progresses to the inside. Hence, the increase in the thickness of the lime
decreases the rate of penetration of carbon dioxide gas into lime, where the reaction
develops (Moorehead 1986).
Lime concentration: The rate of the carbonation reaction is directly
proportional to the amount of the lime that will be carbonated. If the calcium hydroxide
concentration is increased, the time needed for the carbonation reaction will increase
and the rate will be slower (Moorehead 1986).
Use of the aged-lime putty: The aging of the lime putties directly affect the
carbonation process (Cazalla et al. 2000). Aged putties have smaller portlandite crystals
while non-aged putties have larger ones. Smaller portlandite crystals transform into
calcite crystals more rapidly compared to larger ones due to having a higher surface area
(Cazalla et al. 2000, Henisch 1988). Therefore, aged putties exhibit rapid and extensive
carbonation reaction.
1.6. Types of Lime
Limes can be classified into two fundamental types according to their hydraulic
character (Cowper 2000, Eckel 1928, Vicat 2003). These are; non-hydraulic limes,
those that are composed mainly of calcium oxide and magnesium oxide in different
ratios, and hydraulic limes, those that contain active compounds of calcium silicates and
aluminates in addition to CaO and MgO (Cowper 2000).
1.6.1. Non-hydraulic Limes
Non-hydraulic limes can be classified into three groups according to the amount
of calcium oxide content. They are fat limes, lean limes, and magnesian limes (Cowper
2000, Eckel 1928, Vicat 2003).
10

Fat limes contain over 95 % of calcium oxide ( CaO) and 5 % of impurities such
as magnesia (MgO), silica ( SiO2), alumina (Al2O3), iron oxide (Fe2O3), etc. They slake
rapidly, show great expansion in volume about 3 times, and evolve heat in a great extent
during the slaking process (Cowper 2000, Eckel 1928, Vicat 2003). Magnesian limes
contain over 30% of MgO (Cowper 2000, Eckel 1928, Vicat 2003). When compared to
fat limes, this type of limes slake slowly and expand less in volume. Therefore, the
resulting product of magnesian limes will be less, if equal amount of lime is slaked of
these groups. Although magnesian limes are less plastic, they are much more durable
than fat limes. Lean limes contain over 5% of impurities such as silica, alumina, iron
oxide etc. (Cowper 2000, Eckel 1928, Vicat 2003).
1.6.2. Hydraulic Limes
Hydraulic limes can be classified in two groups, which are natural hydraulic
limes and hydraulic limes. Natural hydraulic limes are produced from limestones which
contain a high percentage of siliceous and argilleceous material. These types of
limestones are composed of CaO, MgO and some other impurities such as alumina, iron
and silica. If argillaceous limestones, which are impure and contain a high percentage of
siliceous or argillaceous material, are used as a raw material for lime production, these
impurities react with the quicklime during the calcination process at a high temperature
and calcium aluminates-silicates are produced (tricalcium silicate: 3CaO.SiO2,
dicalcium aluminate: 2CaO.Al2O3 ) (Boynton 1966,Cowper 2000, Lea 1940). These
compounds are set and harden in the water and increase the strength of the lime mortar.
(Boynton 1966,Cowper 2000, Lea 1940). Therefore, such limes have been used as
binders for mortars in water constructions such as bridges, drainage systems, cisterns,
foundations etc. (Cowan 1977, Davey 1961).
Hydraulic lime is also produced by adding of silicates (clay minerals) into the
pure powdered limestone. If these mixtures are heated at a temperature between 950-
1250 ° C, hydraulic limes are produced (Boynton 1966, Cowper 2000, Lea 1940). They
slake very slowly when compared to non-hydraulic limes and expanse less in volume
during the slaking process (Cowper 2000, Lea 1940). While non-hydraulic limes harden
with CO2 only, hydraulic limes harden by CO2 gas and by water (Cowper 2000, Lea
1940).
11
Hydraulic limes can be classified into three groups. They are eminently
hydraulic limes, moderately hydraulic limes and feebly hydraulic limes (Cowper 2000).
Eminently hydraulic limes set in water rapidly about in 2-4 days. Moderately hydraulic
limes set in water in 15-20 days while feebly hydraulic limes set over 20 days (Cowper
2000).
Hydraulic limes can also be classified by hydraulic and cementation indices.
They are the ratio of the total percentage of silica and alumina to the percentage of lime.
The high index values show the more hydraulic capacity of lime. Followings are the
formula of the indices (Vicat 2003).
Hydraulic index = (%Al2O3+%Fe2O3+%SiO2) / (%CaO+%MgO)
Cementation index = (2.8%SiO2+1.1%Al2O3+0.7%Fe2O3) / (%CaO+1.4%MgO)
Feebly hydraulic limes have 0.1 to 0.2 of hydraulic index. Eminently and
moderately hydraulic limes have values of 0.2 to 0.4. (Cowper 2000).
1.7. Aim of the Study
Mortars used as bonding agent for bedding and jointing masonry units and
rendering masonry surfaces are composed of binders and filling materials (Cowan 1977,
Davey 1961). Historically, several kinds of mortars were used in the construction of
buildings. Mud is the oldest known mortar, used in construction of the first collective
settlements in Mesopotamia 10.000 years ago (Davey 1961). Gypsum is a binding
material long used in the mortars of brick vaults and arches due to its quick setting and
high mechanical strength (Davey 1961, Middendorf 1998). Lime mortars have been the
most widely used in the construction of the buildings since their first known use in
Eygpt in 4000 B.C. (Cowan 1977, Vicat 1997).
Lime mortars can be classified as non-hydraulic and hydraulic. Non-hydraulic
mortars are produced by mixing fat lime with inert aggregates and hardened only by the
carbonation of lime due to the carbon dioxide in the air.
Hydraulic mortars are produced either by mixing fat lime with the aggregates
containing amorphous active silicates and aluminates such as pozzolans, or by mixing
hydraulic lime with the inert aggregates. Hydraulic mortars are hardened by both the
12

carbonation of lime and the reaction between the lime and pozzolans in the presence of
water. This reaction produces calcium silicate hydrates and calcium aluminate hydrates,
which set under water and impart high strength to the lime mortars (Lea 1970). For this
reason, such mortars were extensively used in the construction of foundations placed in
waterlogged grounds and for drainage systems, cisterns, bridges, etc. (Cowan 1977,
Davey 1961). Romans successfully improved the use of hydraulic lime mortars
produced by combining lime and pozzolanas in masonry structures (Cowan 1977,
Davey 1961).
The determination of historic lime mortar characteristics became an important
subject in the second half of the 20th century due to the extensive damage to historic
building materials that was caused by cement-based mortars used in their restoration.
The studies on historic lime mortars and plasters are compiled by Hansen et al. (Hansen
et al. 2003) in a bibliography which provides an extensive source for conservators and
conservation scientists.
Among the studies of historic lime mortars, the achievement of hydraulic
properties of historic mortars is usually described as the process of mixing pozzolanic
aggregates with the high calcium lime (Franzini et al. 1999, Moropoulou et al. 2001).
However, the possibility of the use of the natural hydraulic lime in historic mortars has
not been thoroughly considered.
The first production of hydraulic lime was found around the second half of the
18th century (Vicat 1997). This type of lime is obtained by the calcination of limestone
with high amounts of clay substances, forming calcium and aluminium silicates at
temperatures between 950° C and 1250° C. Even though such temperatures could not be
reached before the 18th century, the possibility of achieving hydraulic properties of lime
by heating limestone containing silica at relatively low temperatures has not been taken
into consideration.
In a previous study (Çizer 2004), the hydraulic characteristics of lime mortars
used in the walls and brick domes of some Ottoman baths are examined to determine
whether hydraulicity of the mortars originates by mixing pozzolanic aggregates with fat
lime or by the use of natural hydraulic lime. The results indicate that the lime used in
the stone masonry of Ottoman baths was non-hydraulic but brick dome mortars was
hydraulic.
In this study, taking into cosideration the kiln conditions of the 15th century, the
possibility of obtaining non-hydraulic and hydraulic lime at a relatively low
13

temperatures are examined. For this purpose some types of marbles and limestones are
heated at a relatively low temperature (850 °C), then slaked and carbonated.
Lime mortars are prepared with mixing of limes produced by marbles and
limestones and agregates produced from Marmara marble in order to compare their
compressive strengths during one year carbonation in laboratory condition.
Then, characteristics of marbles and limestones after calcining, slaking and
carbonation are indicated by XRD, SEM, EDS and TGA analyses.
14
CHAPTER 2
EXPERIMENTAL METHODS
In this study, different types of marble and limestone were used in the
production of lime for the purpose of investigating the lime quality on the mortar
properties. Marbles quarried from the Marmara Island and the city of Muğla, white and
grey colored limestones quarried in Urla region were selected as samples for the study.
The microstructure and mineralogical compositions of the marbles and limestones were
determined before and after their heating, slaking, and carbonation processes. Mortars
were prepared with one part (in weight) of lime and three parts (in weight) of marble
aggregates. The characteristics of mortars were compared by determining their
compressive strength after one year carbonation. In this section, experimental methods
used in this work are described.
2.1. Marble and Limestone Samples
Marbles quarried from the city of Muğla and the Marmara Island were selected
as marble samples in the production of lime. Limestones that contain low and high
amounts of diatoms used in the walls of historic buildings in Urla region were selected
as limestone samples (Teomete 2004). The definitions of the stone samples are given in
the following table (Table 2.1).
15
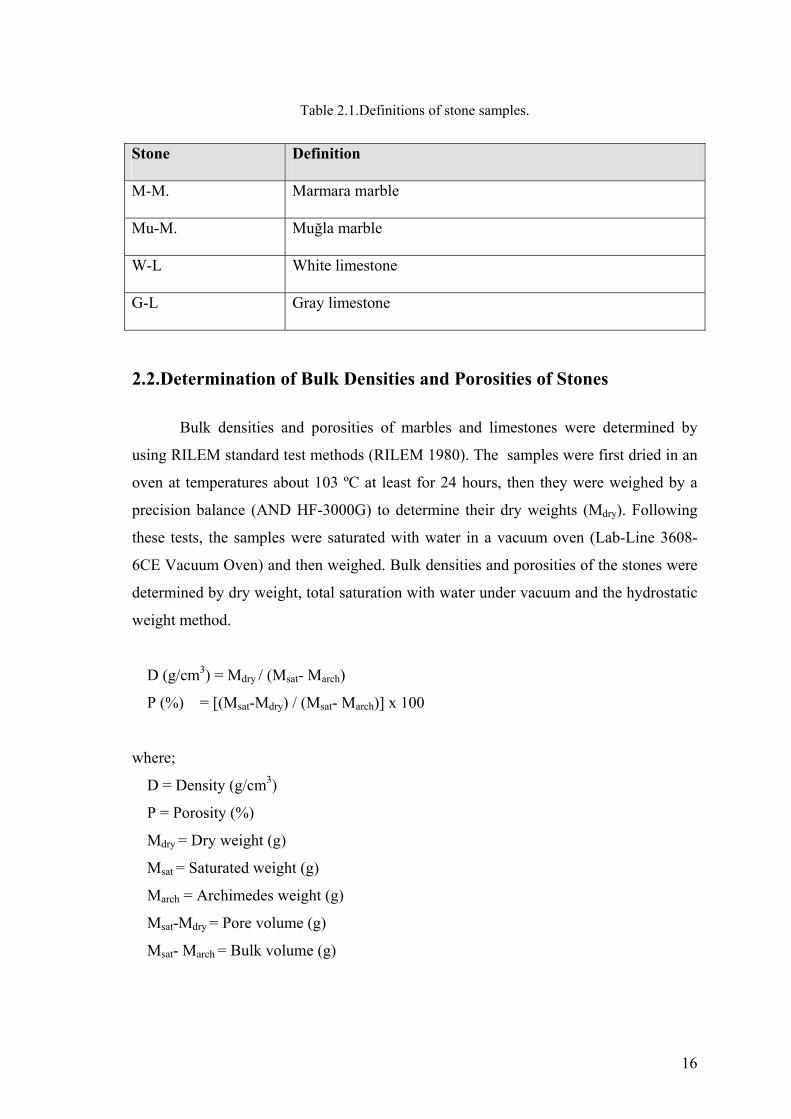
Table 2.1.Definitions of stone samples.
Stone Definition
M-M. Marmara marble
Mu-M. Muğla marble
W-L White limestone
G-L Gray limestone
2.2.Determination of Bulk Densities and Porosities of Stones
Bulk densities and porosities of marbles and limestones were determined by
using RILEM standard test methods (RILEM 1980). The samples were first dried in an
oven at temperatures about 103 ºC at least for 24 hours, then they were weighed by a
precision balance (AND HF-3000G) to determine their dry weights (Mdry). Following
these tests, the samples were saturated with water in a vacuum oven (Lab-Line 3608-
6CE Vacuum Oven) and then weighed. Bulk densities and porosities of the stones were
determined by dry weight, total saturation with water under vacuum and the hydrostatic
weight method.
D (g/cm3) = Mdry / (Msat- March)
P (%) = [(Msat-Mdry) / (Msat- March)] x 100
where;
D = Density (g/cm3)
P = Porosity (%)
Mdry = Dry weight (g)
Msat = Saturated weight (g)
March = Archimedes weight (g)
Msat-Mdry = Pore volume (g)
Msat- March = Bulk volume (g)
16

2.3.Preparation of Stone Samples for Calcination
Small pieces of stones were used in the calcination process. The coarse pieces
of marble and limestones were grinded by using a ball mill machine. Following the
grinding process, the pieces of stones were sieved, to be ordered according to their
particle sizes. The fraction between 250 - 125 mesh were used in the calcination process
of the stones.
2.4. Determination of Calcination Temperatures of Stones
Calcination temperatures of marbles and limestones were determined by
thermogravimetric analysis (TG/DTG) using Shimadzu TGA-21. The
thermogravimetric analysis was carried out in a static nitrogen atmosphere at a
temperature range of 50-1000°C with a controlled heating rate of 10°C/min. During the
heating process, TGA instrument recorded the loss of hygroscopic (adsorbed) water (<
120°C) and the loss of structural carbon dioxide gas resulted from the decomposition of
the calcium carbonate (> 600°C).
2.5. Calcination Process of the Samples
The calcination temperature and the carbon dioxide content of limestone and
marble were first determined by TGA analysis. After determining the calcination
temperatures of stones by the TGA analysis, the calcination of the marbles and
limestone samples were carried out in a laboratory furnace considering the calcination
temperatures of the stones. About five grams of ground sample was heated in the
crucible at 850 ºC which was above the calcination temperatures of stones for 12 hours
until all calcium carbonate is converted into calcium oxide. Calcined samples were then
kept in a desiccator before the slaking. Weight losses due to the release of the carbon
dioxide gas at this temperature were precisely determined to find out the percentage of
the calcium carbonate content in the compositions of the stones.
The reason for choosing the temperature of 850 ºC for the calcination process
was to investigate the possibility of production of hydraulic lime from limestones at a
relatively low calcination temperature.
17

2.6. Slaking and Carbonation of Calcined Stone Samples
The calcinated limestone (quicklime) was hydrated with distilled water in the
glass beaker until lime putty was produced. The lime putty was then spread out on glass
slides and carbonated for a month in the laboratory. During the carbonation process,
lime was wetted with distilled water. After a month, the samples were dried in an oven
at a temperature of 40 ° C for 24 hours.
2.7. Determination of Mineralogical Compositions of Unheated and
Calcined Stones (quicklime), Slaked and Carbonated Lime
Minerological compositions of the unheated and heated limestones and marbles
(quicklime), slaked and carbonated limes were determined by XRD and FT-IR analyses
which were carried out on dry powdered samples. XRD analyses were performed on
finely ground samples of less than 53 µm. X-ray diffraction patterns were taken with Cu
K∝ radiation by using a Philips X-Pert Pro X-ray model Diffractometer.
For the IR analysis, 0.3-0.5 milligram of dry powdered samples were mixed with
80 milligram of spectral grade KBr and pressed into pellets by about 10 tons/cm2
pressure. Spectral measurements were executed by a Spectrum BX II FTIR
spectrometer (Perkin Elmer). It was operated in the absorbance mode. The IR spectra
was taken between 400-4000 cm-1 with a 4 cm-1 resolution.
2.8. Determination of Microstructural and Chemical Compositions of
Unheated and Heated Stones (quicklime), Slaked and Carbonated
Lime
Chemical compositions and the microstructural properties of the unheated and
heated limestone and marbles (quicklime), slaked and carbonated lime were determined
by Philips XL 30S-FEG Scanning Electron Microscope (SEM) equipped with X-Ray
Energy Dispersive System (EDS).
SEM-EDS analysis was used in the determination of elemental compositions of
the stones. For this analysis, samples were ground to the fineness of less than 53µm and
18

then pressed into pellets. SEM-EDS analyses were carried out in three different zones of
each specimen.
The microstructures of the samples were determined on coarse samples by SEM
analyses.
2.9. Determination of Hydraulicity of Lime by TGA
Thermogravimetric analysis (TG/DTG) was performed on carbonated samples by
using Shimadzu TGA-21 thermogravimetric analyzer in order to determine
hygroscopic water, structurally bound water and carbon dioxide contents to evaluate
hydraulicity of the lime. Their hydraulicities were evaluated by determining weight loss
at the temperatures between 200-600oC due to the loss of the structurally bound water
of hydraulic products, such as calcium silicate hydrates and calcium aluminate hydrates,
and weight loss at the temperatures over 600oC due to carbon dioxide releases during
the decomposition of calcium carbonates by using a Shimadzu TGA-51 (Moropoulou et
al. 2001).
The thermogravimetric analysis was carried out in a static nitrogen atmosphere at a
temperature range of 50-1000°C with a controlled heating rate of 10°C/min.
2.10. Preparation of Lime Mortars
Lime mortars were perapared with different types of limes produced by marbles
and limestones in order to compare their characteristics by measuring the compressive
strenghts during 12 months carbonation.
Marble pieces were used as aggregates for preparing the mortars. The reason for
selecting marble aggregates was that it does not react with lime. Hence, the main
purpose was to observe only the effects of different limes on the mortar characteristics.
In preparation of mortars, the quicklime - aggregate ratio in weight was 1/3 and
the particle size of the aggregates were between 1000-2000, 500-1000, and 250-500
mesh in size in equal quantities. The main reason of using quicklime in the peraparation
of mortars was to provide a homogenous mixture and a strong binding between the lime
and the aggregates. The amount of water that was used in preparing of mortar was more
than the amount of water which was needed for slaking of quicklime.
19
Mortar mixtures were prepared by the Kitcheneaid mini mixer and put into
moulds of 4.5x5 cm in sizes, which is produced from PVC. After 48 hours waiting
period, the mixtures were set off the moulds and waited for about 28 days in
desiccators of which relative humidity was at %100 and temperature at 25°C. After 28
days, samples were left in the room conditions. The compressive strengths of the
mortars were then determined after 3, 6, 9 and 12 months waiting periods.
2.11. Determination of Uniaxial Compressive Strengths of Mortars
The determination of uniaxial compressive strength of mortars were determined
by Shimadizu AG-I Mechanical Test Instrument. The Instrument automatically
computed, displayed and recorded test results using a software system. Maximum 15
kN force was applied with 1mm/min. speed. The strokes were recorded under loading.
The relationship between the strokes and load by a graph was automatically displayed
on the test condition monitor. This graph was composed of a curve of which the peak
point gave the maximum force (F) under which the specimen failed. As a result,
uniaxial compressive strenghts represented by ‘σ’ were calculated by using this graph
with the following formula.
σ = F/A
where;
F : Failure load (kN)
A : Area onto which loading was applied (mm2)
2.12. Determination of Modulus of Elasticity of Mortars
The modulus of elasticity is the rate of change of strain as a function of stress. It
provides required information about how well a material can resist deformation under
the action of external forces (Airapetov 1986). The modulus of elasticity (E) is
formulated as follows.
20

E = Stress / Strain = σ / ε = ( F/A) / ( l/lo)
where;
F : Failure load (kN)
A : Area onto which force was applied (mm2)
l : Change in thickness of the sample along its vertical axis (mm)
lo : Initial thickness of the sample (mm)
Stress (σ) is the ratio of force to the area where the force is applied. Strain (ε)
corresponds to the change in thickness of samples under the action of the applied force
(Airapetov 1986). When a compression force is applied onto a solid material, the force
is transmitted through its body and causes it to become deformed along the direction of
the applied force (Airapetov 1986). The decrease in thickness is denoted by - l. Here,
the minus sign refers to contraction in dimension. This change in dimension is called
strain and denoted by l/lo (Airapetov 1986).
Relationship between deformation and applied force is expressed by a stress-
strain curve. Slope of this curve (tanθ) gives the modulus of elasticity of that material
(Airapetov 1986). Therefore, the modulus of elasticity was calculated using the slopes
of the stress-strain curves obtained from the results of the compression strength tests.
21

CHAPTER 3
RESULTS AND DISCUSSION
In this chapter, the physical, microstructural, mineralogic and chemical
properties of the marbles and limestones used as samples are presented and the results
are discussed at the beginning. Next, the properties of the quicklimes which were
formed by calcinations of the stones, the lime produced within the hydration processes,
and the final products after the carbonation processes and the differences among them
constitute the main part of the chapter. Moreover, hydraulic capacities of carbonated
limes are included . Finally, carbonation processes of the mortars which were produced
from these limes, and their differences observed in their mechanical properties are
discussed.
3.1. Densities and Porosities of Marbles and Limestones
Basic physical properties such as densitiy and porosity values of the stones were
determined by using RILEM standart tests. According to the test results , Marmara and
Muğla marbles have high density and low porosity values (Table 3.1). When compared
to values of density and porosity of white limestones, it was observed that the grey
limestone was less dense and a more porous stone (Table 3.1).
Table 3.1. Density and porosity values of marbles and limestones.
Sample Density (g/cm3) Porosity (%)
Mar-M 2.7 0.2
Mu-M 2.7 0.4
W-L 2.5 2.4
G-L 2.2 11.3
22

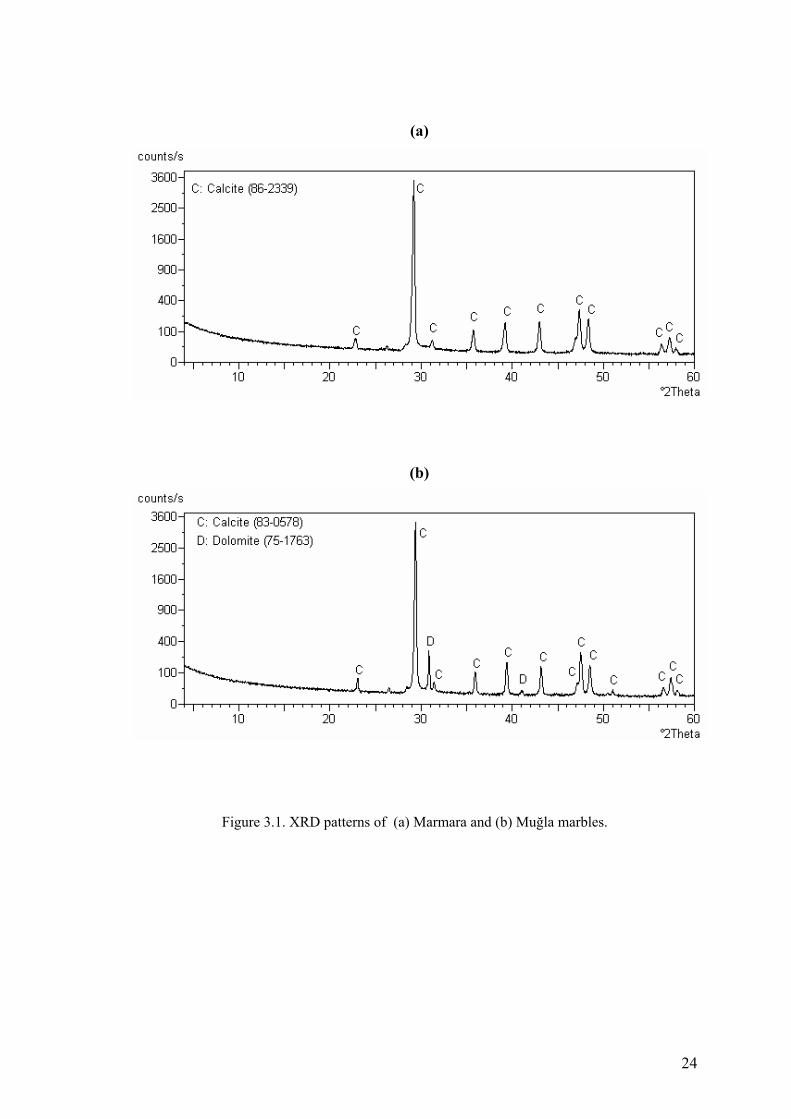
3.2. Mineralogical Compositions of Marbles and Limestones
Mineralogical compositions of marbles and limestones were determined by
XRD and IR analyses. In XRD patterns of Marmara marble, only peaks of calcite
minerals were observed. It indicates that the Marmara marble is composed of pure
calcite crystals. However, it is detected both calcite minerals peaks and the most intense
dolomite minerals peaks in XRD diffraction patterns of the Muğla marble. It shows that
Muğla marble was composed mainly of calcite crystals, and dolomite minerals in lower
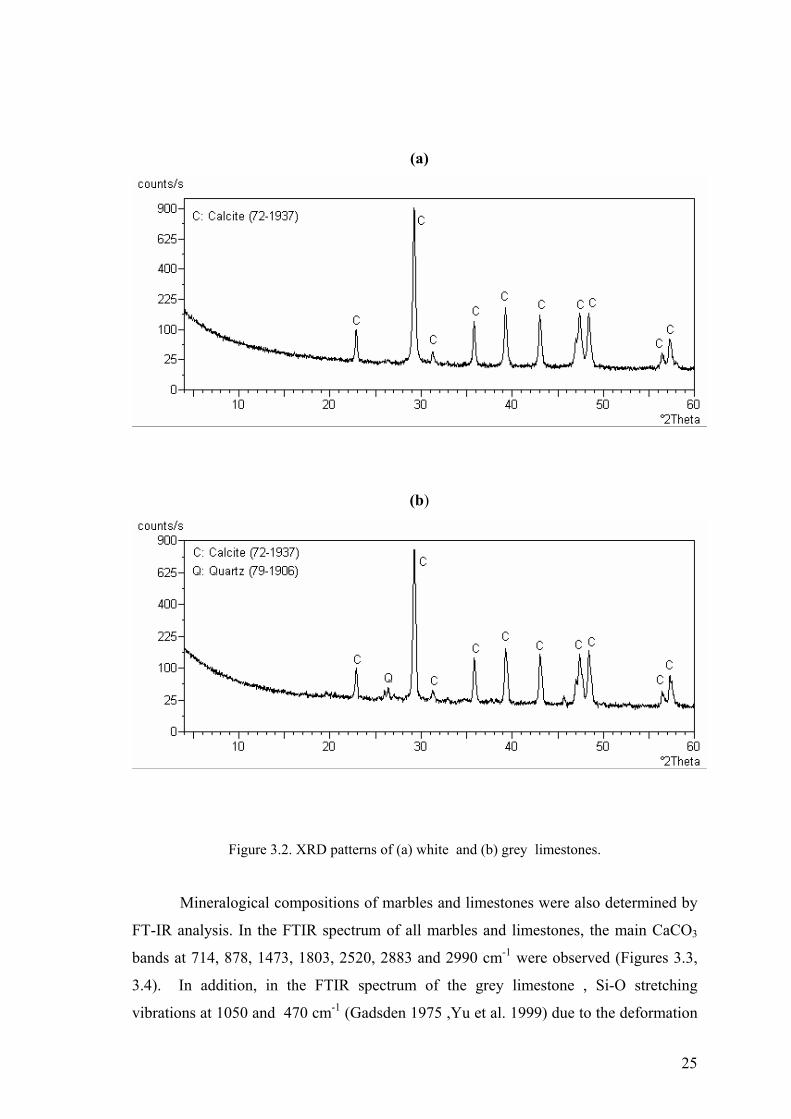
amounts. In XRD patterns of white limestone, only the calcite peaks were observed. On
the other hand, in the XRD patterns of grey limestone, peaks of calcite and less intense
peaks of quartz minerals were observed. These results indicate that white and gray
limestones were composed of mainly calcite crystals.
Table 3.2. Minerals determined by XRD analysis in marbles and limestones.
Sample Calcite Dolomite Quartz
Ma-M +++ - -
Mu-M +++ + -
W-L +++ - -
G-L +++ - +
23
(a)
(b)
Figure 3.1. XRD patterns of (a) Marmara and (b) Muğla marbles.
24
(a)
(b)
Figure 3.2. XRD patterns of (a) white and (b) grey limestones.
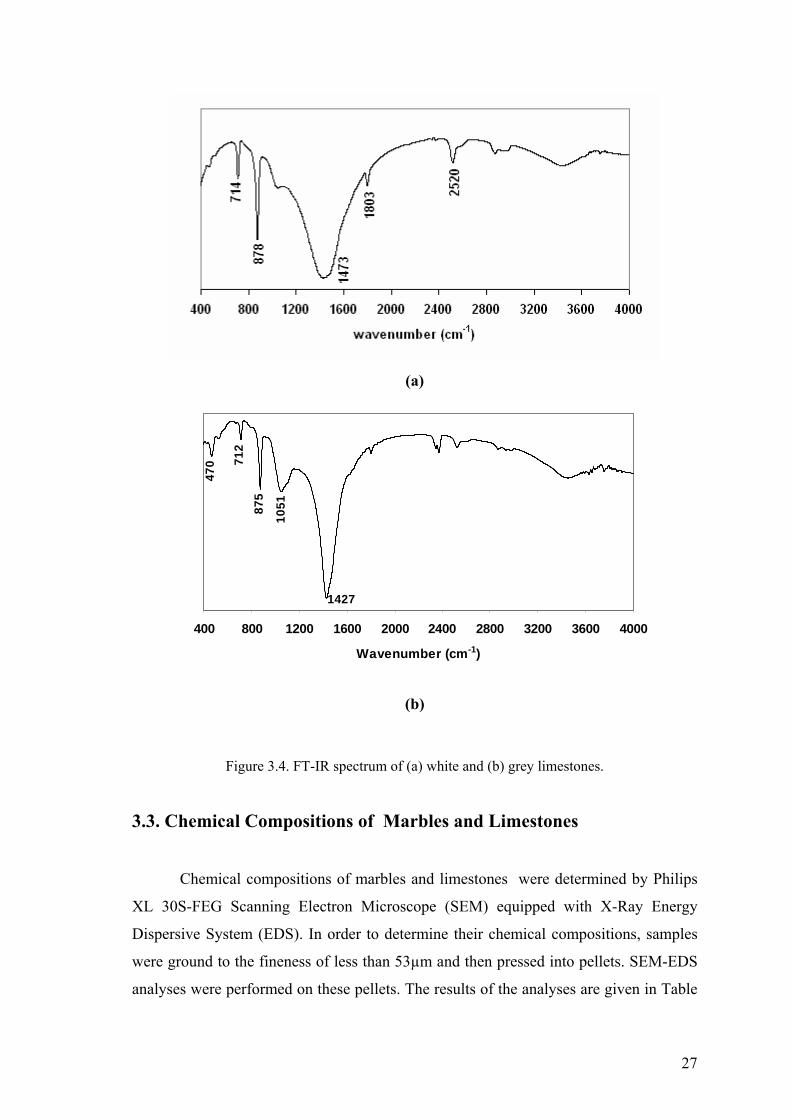
Mineralogical compositions of marbles and limestones were also determined by
FT-IR analysis. In the FTIR spectrum of all marbles and limestones, the main CaCO3
bands at 714, 878, 1473, 1803, 2520, 2883 and 2990 cm-1 were observed (Figures 3.3,
3.4). In addition, in the FTIR spectrum of the grey limestone , Si-O stretching
vibrations at 1050 and 470 cm-1 (Gadsden 1975 ,Yu et al. 1999) due to the deformation
25
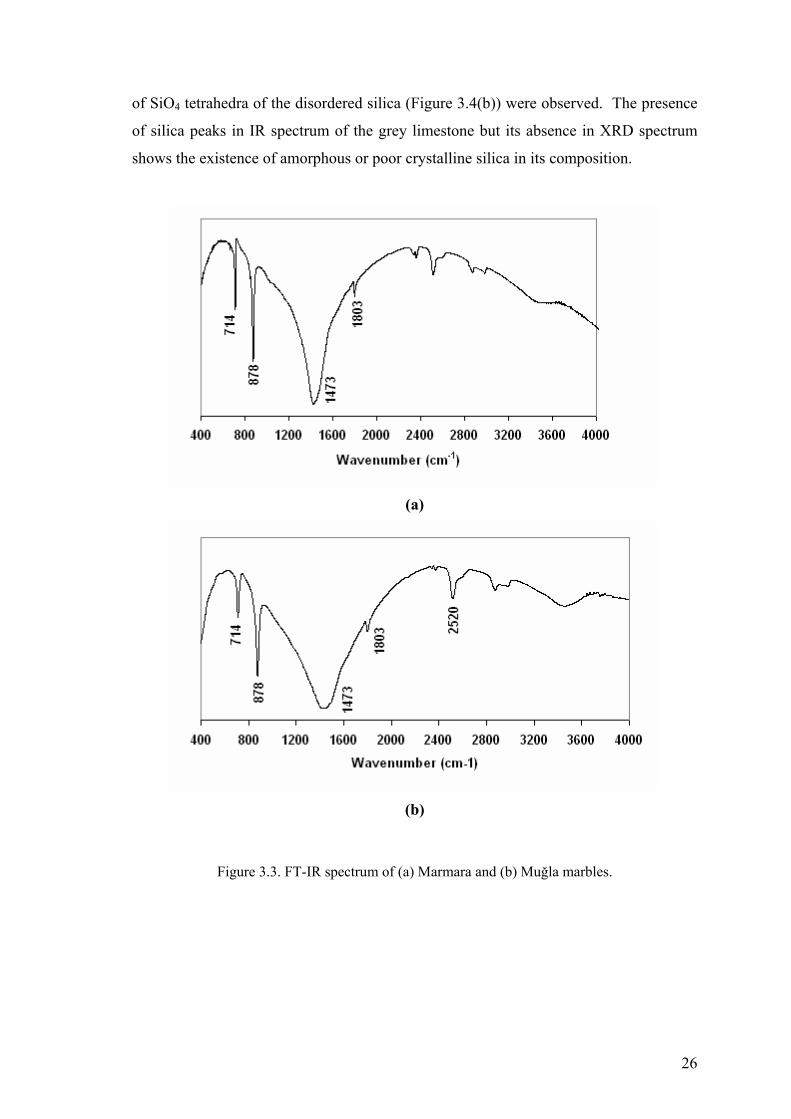
of SiO4 tetrahedra of the disordered silica (Figure 3.4(b)) were observed. The presence
of silica peaks in IR spectrum of the grey limestone but its absence in XRD spectrum
shows the existence of amorphous or poor crystalline silica in its composition.
(a)
(b)
Figure 3.3. FT-IR spectrum of (a) Marmara and (b) Muğla marbles.
26
(a)
400 800 1200 1600 2000 2400 2800 3200 3600 4000
Wavenumber (cm-1)
470
105187
571
2
1427
(b)
Figure 3.4. FT-IR spectrum of (a) white and (b) grey limestones.
3.3. Chemical Compositions of Marbles and Limestones
Chemical compositions of marbles and limestones were determined by Philips
XL 30S-FEG Scanning Electron Microscope (SEM) equipped with X-Ray Energy
Dispersive System (EDS). In order to determine their chemical compositions, samples
were ground to the fineness of less than 53µm and then pressed into pellets. SEM-EDS
analyses were performed on these pellets. The results of the analyses are given in Table
27

28
2O3. This shows that the grey limestone contains high
amounts of silicates.
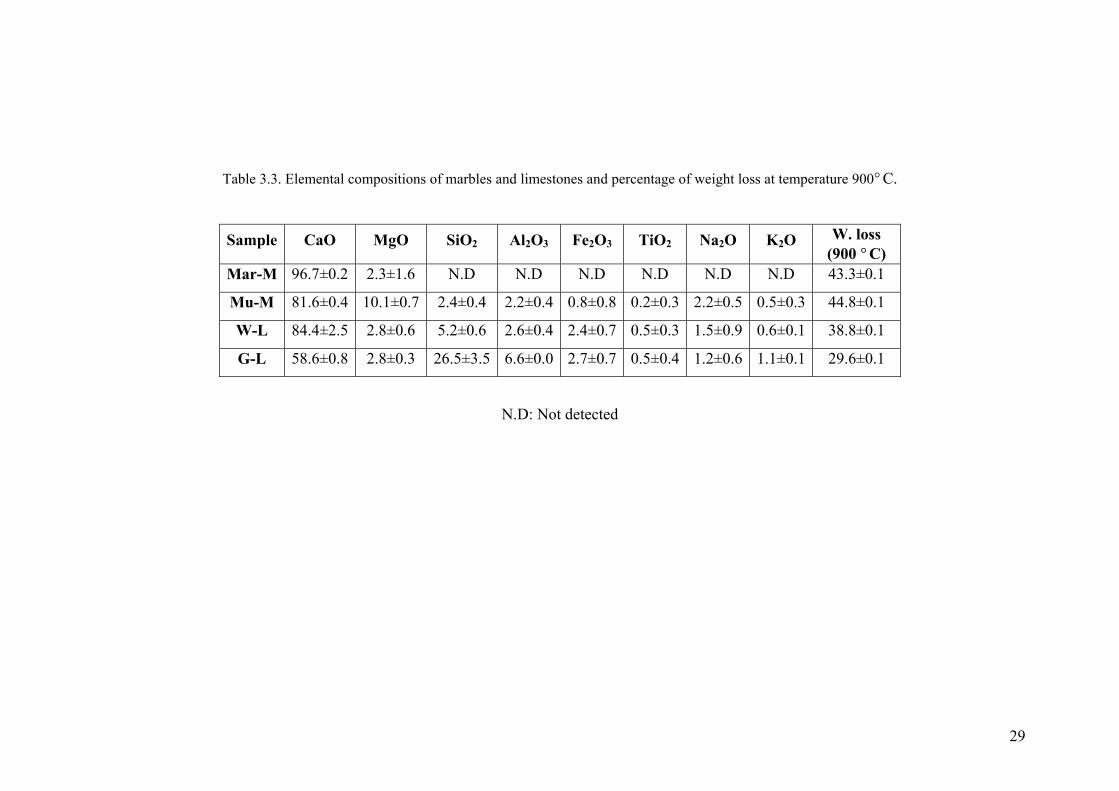
3.3. As it is seen in table 3.3, the Marmara marble contains a high percentage of CaO
(∼97%), and a low percentage of MgO about 2%. It shows that the Marmara marble is
composed of mainly CaO and contains low amounts of MgO. Similarly, CaO content in
Muğla marble is high. However, they differ from each other in terms of magnesium
content. The magnesium found in the composition of marble can be originated from
dolomite (CaMg(CO3)2). On the other hand, white limestone contains higher
percentages of SiO2 and Fe2O3 when compared with the chemical compositions of
marbles. The grey limestone is composed of low percentages of CaO and high
percentages of SiO2 and Al
29
Table 3.3. Elemental compositions of marbles and limestones and percentage of weight loss at temperature 900° C.
Sample CaO MgO SiO2 Al2O3 Fe2O3 TiO2 Na2O K2O W. loss (900 ° C)
Mar-M 96.7±0.2 2.3±1.6 N.D N.D N.D N.D N.D N.D 43.3±0.1
Mu-M 81.6±0.4 10.1±0.7 2.4±0.4 2.2±0.4 0.8±0.8 0.2±0.3 2.2±0.5 0.5±0.3 44.8±0.1
W-L 84.4±2.5 2.8±0.6 5.2±0.6 2.6±0.4 2.4±0.7 0.5±0.3 1.5±0.9 0.6±0.1 38.8±0.1
G-L 58.6±0.8 2.8±0.3 26.5±3.5 6.6±0.0 2.7±0.7 0.5±0.4 1.2±0.6 1.1±0.1 29.6±0.1
N.D: Not detected

3.4. Microstructural Characteristics of Marmara and Muğla Marbles
Microstructural characteristics of the Marmara marble was determined by SEM
analyses. According to the results of the analyses, the sizes of the calcite crystals of the
marble are in the range of 2 to 3.5mm. (Figure 3.5). Calcite crystals are tightly bounded
to each other. In previous studies, similar characteristics of Marmara marble has also
been reported (Moens et al. 1989).
Figure 3.5. SEM pictures of calcite crystals in the Marmara marble.
The mineral sizes of calcite crystals that form the Muğla marble, are smaller
when compared to the Marmara marble and vary in the range of 22-800 micrometres
(Figure 3.6). Calcite crystals are tightly bounded to each other in the marble matrix. In
previous studies, similar characteristics of Muğla marble has also been reported (Yavuz
et al. 2002).
30

Figure 3.6. SEM pictures of calcite crystals in the Muğla marble.
3.5. Microstructural Characteristics of White and Grey Limestones
The microstructure analyses of white limestone carried by using SEM show that
small and large grain size calcite crystals are not homogeneously distributed in the stone
matrix (Figure 3.7).
31

Figure 3.7. SEM pictures of micritic calcite crystals in white limestone.
The SEM analysis of the grey limestone shows that it is composed of small and
large grain size calcite crystals (Figure 3.8). Differently from the white limestone, the
grey limestone contains high amounts of amorphous silica from diatoms. The SEM-
EDS analysis indicates that the limestone contains nearly 30 % of silicon oxide in its
composition that is originated by the presence of the high amounts of diatoms. Diatoms
are composed of skeletal shells originated from many kinds of unicellular algae
(Korunic 1998, Gürel and Yıldız 2006, Fragoulis et al. 2005). Mainly disk, bow and
cone shaped diatom frustules are noticed in the SEM pictures (Figures 3.9, 3.10).
32

Figure 3.8. SEM pictures of micritic calcite crystals in grey limestone.
Figure 3.9. SEM images of diatoms embedded in calcite crystals in grey limestone.
33

(a)
(b)
(c)
(d)
(e)
Figure 3.10. SEM images of a (a) disk and (b) bow shaped diatom frustules; (c,d) small holes on
their surfaces; (e) precipitated small size of calcite crystals on the surface and the holes
of the diatoms.
34

3.6. Calcination Temperatures of Marbles and Limestones
When calcite crystals, which are the main constituents of marbles and
limestones, are heated at a temperature of around 900 ° C, they will transform into
calcium oxide through the release of carbon dioxide gas. The calcination process of
calcite begins when the partial pressure of CO2 in the gas above the solid surface is less
than the decomposition pressure of the CaCO3 (Reaction 3.1) (Stanmore and Gilot
2005).
CaCO3 → CaO + CO2 ΔH= + 182.1 kJ mol-1 (Reaction 3.1)
Calcination temperatures of marbles and limestones were determined by the
TGA analysis. The TGA analysis of the Marmara marble and white limestone show that
their calcinations begin at a temperature of 700 ° C and end at 800 ° C. Between the
range of temperatures of 700-800 ° C, the percentage of weight loss due to the release of
carbon dioxide gas was around 40% (Table 3.4, Figure 3.11). This loss in weight refers
that, the samples of the stones contain calcium carbonate over 90 %. However, 30%
weight loss due to driving of carbon dioxide was observed in the grey limestone . This
results indicate that the grey limestone contains nearly 70 % of calcite (Table 3.4). On
the TGA graphs of marbles and limestones, none weight loss were observed due to the
dehydroxylation of clay minerals between 400-600 ºC, which indicates that they don’t
contain clay minerals.
Table 3.4. Percentage of weight loss observed in the marbles and limestones between 700-800
° C by the TGA analysis.
Sample % Weight loss
Mar-M 44.01
Mu-M 39.6
W-L 38.8
G-L 29.61
35
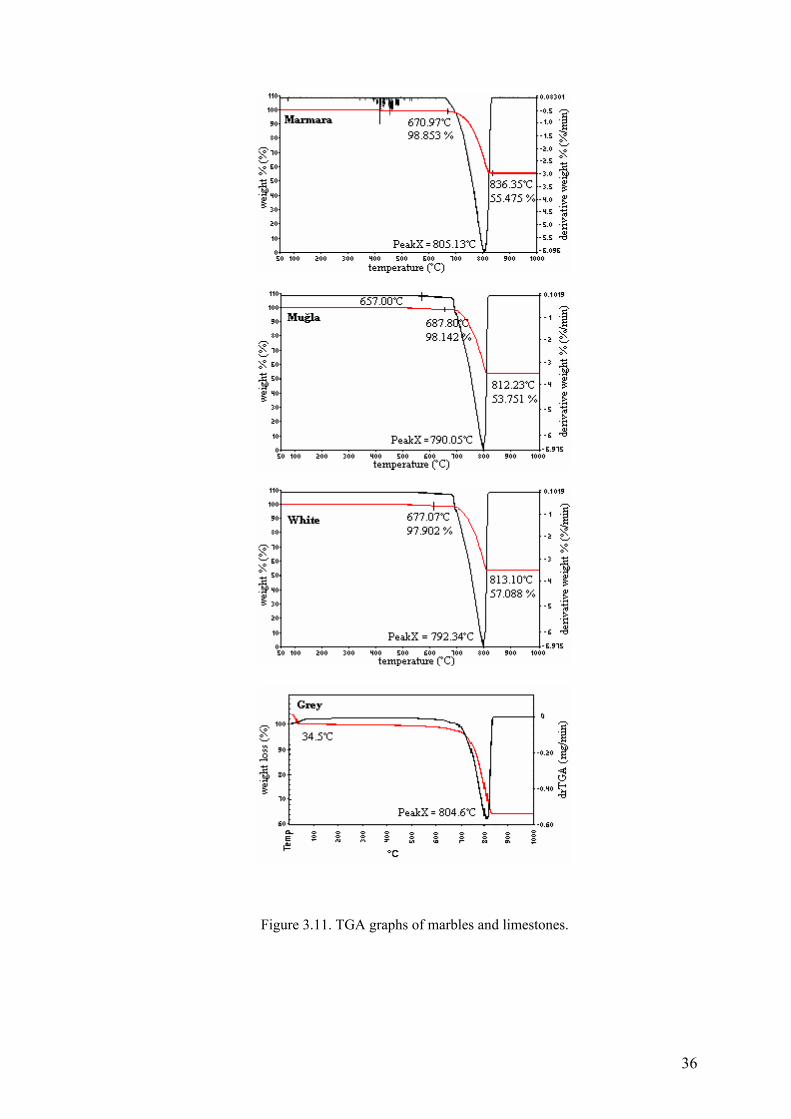
Figure 3.11. TGA graphs of marbles and limestones.
36

3.7. Mineralogical Characteristics of Calcined Marbles and Limestones
Considering the calcination temperatures determined by TGA analyses, the
samples were calcined at 850 ° C temperature during 12 hours. The calcined samples
were then cooled in a desiccator in dry conditions. The mineralogic characteristics of
dry samples were determined by the XRD analysis.
After the calcination process, basic peak of CaCO3 (29. 2 2Θ) was not observed
in XRD patterns. It shows that, calcite crystals are completely transformed into CaO in
12 hours and in a temperature of 850 ° C .
In the XRD diffraction patterns of Marmara, Muğla marbles and white limestone
samples, basic peaks of CaO with values of about 32.3, 37.5 and 53.9 2Θ have been
observed (Table3.5 and Figures 3.12, 3.13). On the other hand, basic peak of
magnesium oxide (at 42.9 2Θ) has been detected as well as calcium oxide peaks in
Muğla marble.
XRD diffraction patterns of grey limestone samples differ from the other
samples. Dicalcium silicate (Ca2SiO4) peaks with the values of 32.5, 33.11, 39.8 and
41.3 2Θ have been observed as well as CaO peaks (Figure3.13). This formation
indicates that, diatoms (amorphous silicates) in the grey limestone have reacted with the
calcium oxide and formed calcium silicates (Reaction 3.2)
2CaO + SiO2 → 2 CaO . SiO2 (Reaction 3.2)
This result shows that the production of the hydraulic lime at a relatively low
calcination temperature (850ºC) is possible. This results may also explain the finding of
the use of hydraulic limes in a 15th century Ottoman bath mortars (Böke et al. 2007,
Çizer 2004).
Table 3.5. Minerals determined by the XRD analysis after calcination of marbles and
limestones.
37

Sample Calcium Oxide (CaO)
Magnesium Oxide (MgO)
Calcium Silicate (2CaO.SiO2)
Ma-M +++ - -
Mu-M +++ + -
W-L +++ - -
G-L +++ - ++
(a)
(b)
Figure 3.12. XRD patterns of calcined (a) Marmara and (b) Muğla marbles.
(a)
38
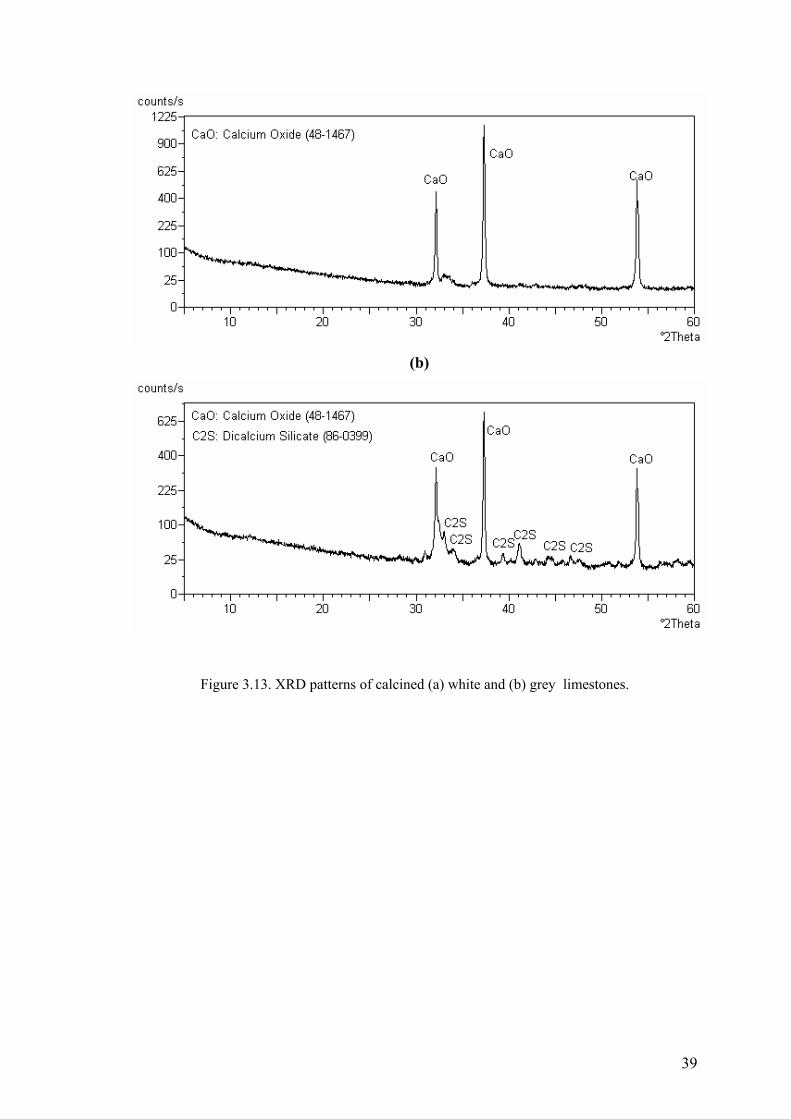
(b)
Figure 3.13. XRD patterns of calcined (a) white and (b) grey limestones.
39

3.8. Microstructural Characteristics of Calcined Marmara and Muğla
Marbles
The microstructural characteristics of the calcined Marmara and Muğla marble
have been determined by SEM analysis. Porous structures on calcite crystals were
observed due to the release of carbon dioxide gas after calcination processes (Figures
3.14, 3.15). The diameters of pores are ranged between 5 to 10 microns (Figures 3.14,
3.15).
The molar volume of calcite is 36.9 cm3 mol-1. After the calcination process of
calcite, the molar volume of quicklime will be 16.9 cm3 mol-1 volume (Stanmore and
Gilot 2005).
Previous studies showed that high calcination temperatures cause the denser
and the more perfect crystal lattice. Calcite crystals have rhombohedral structure and
the crystal lattice is imperfection. At low calcination temperatures, more vacancies and
defects in the calcite crystal structure are formed. At these temperatures, crystal
structures are loose and their sizes are small. With the rise of temperature, the crystals
of CaO grow and change to cubic structure (Huisheng et al. 2002).
In this study, heating Marmara and Muğla marbles in low temperatures caused
the formation of imperfect crystals. In the SEM-EDX analysis of the Marmara marble,
only calcium and oxygen peaks have been observed. It indicates that calcite crystals
have been completely transformed into the calcium oxide (Figure 3.14). On the other
hand, magnesium peaks have been shown in the Muğla marble as well as calcium
peaks, which are originated from calcinations of magnesium carbonate.
40

Figure 3.14. Secondary electron images and EDS spectrum of calcium oxide crystals of calcined
Marmara marble.
41

Figure 3.15. Secondary electron images and EDS spectrum of calcium oxide crystals of
calcined Muğla marble.
3.9. Microstructural Characteristics of Calcined White and Grey
Limestones
The SEM images show that the white limestone consists of small individual
CaO crystals after the calcination process. CaO grains were varied in diameter from
<0.05 micron to 0.8 micron. The individual CaO crystals are partly bonded to other
grains and partly surrounded by voids. Smaller calcium oxide crystals with voids
42

increases their surface area. It leads to calcium oxide crystals to be more reactive with
water (Huisheng et al. 2002, Stanmore and Gilot 2005).
Previous works show that limestones are composed of over 90% calcite and
contains from 3 to 35% open porosity (Huisheng et al. 2002, Stanmore and Gilot 2005).
Pores are generally large with few micropores. Hence, the surface area of limestones
range from 1 to 10 m2g-1. When the calcination occurs, the porosity of the calcium oxide
is greater than 0.6 than that of calcite crystals (Huisheng et al. 2002, Stanmore and Gilot
2005).
Figure 3.16. Secondary electron images and EDS spectrum of the calcium oxide crystals of
calcined white limestones.
The microstructure analysis of the grey limestone shows that small and large
grain size of calcite crystals with diatoms are distributed inhomogeneously in the stone
(Figure 3.17). After the limestone was heated to 850 ºC in a laboratory furnace, calcium
oxide and calcium silicate peaks (C2S) were identified by the XRD analysis (Figure
3.17). The SEM analysis presented that the quicklime formed at this temperature has a
43

porous structure due to the carbon dioxide driven from the calcite minerals (Figure
3.18). The observation of mainly calcium and silicon peaks in the EDS spectrum of the
diatoms shows that the diatoms are converted to C2S by reaction with quicklime (Figure
3.18) (Callebaut et al. 2001, Gualtieri et al. 2006, Varas et al. 2005).
A high contact surface area of precipitated calcite crystals on the surfaces and
the pores of the diatoms (Figure 3.18) and the amorphous character of the diatoms
themselves may be the main reasons for the formation of C2S at this low temperature.
igure 3.17. Secondary electron images and the EDS spectrum of calcium oxide crystals of F
calcined grey limestone.
44
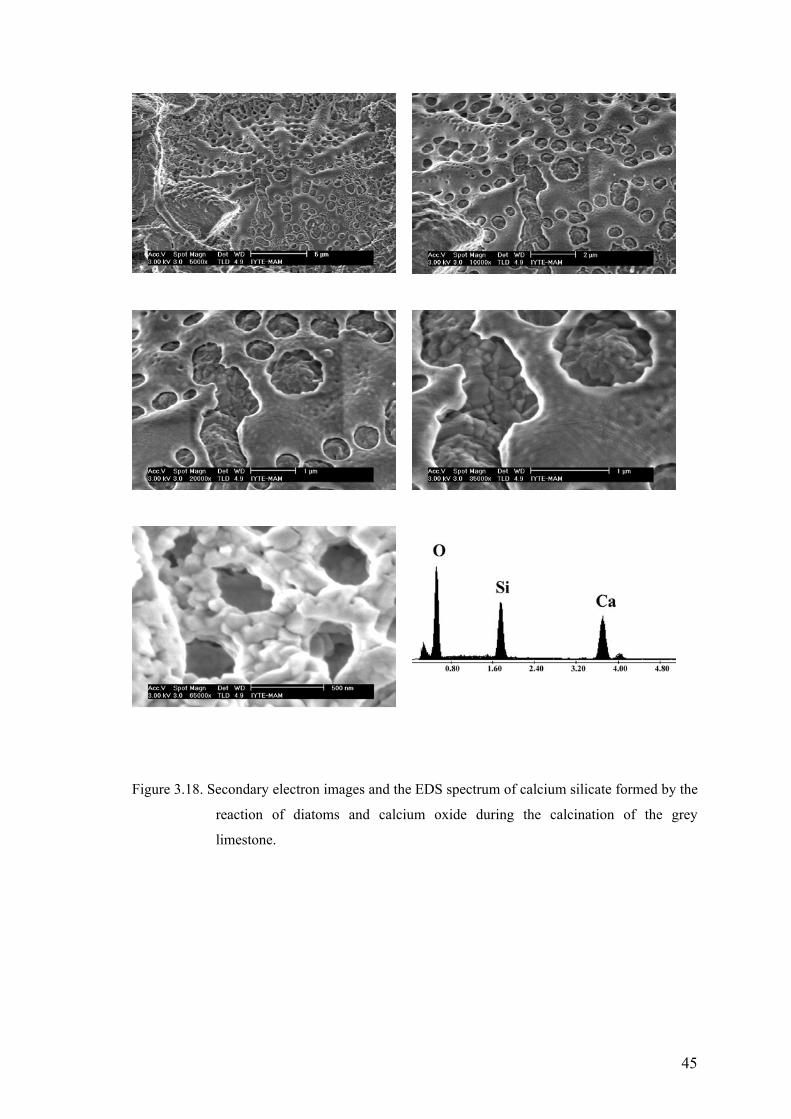
Figure 3.18. Secondary electron images and the EDS spectrum of calcium silicate formed by the
reaction of diatoms and calcium oxide during the calcination of the grey
limestone.
45

3.10. Mineralogical Characteristics of Limes Produced from Slaking of
Calcined Marbles and Limestones
The calcined marbles and limestones were slaked with distilled water. When
calcium oxide reacts with water, calcium hydroxide is formed (Reaction 3.3).
CaO + H2O → Ca(OH)2 + Heat (Reaction 3.3)
After the slaking process, samples were dried and their mineralogical
compositions were determined by the XRD analysis. The XRD patterns are shown in
Figures 3.19, 3.20 and the observed minerals are given in Table 3.6. In the XRD
patterns of the Marmara marble and white limestone, the main peaks of the portlandite
crystals were observed at d values of 4.895, 2.619, 1.917, and 1.790 corresponding to 2
theta angles: 18.110, 34.215, 47.386 and 50.965. Magnesium hydroxide was identified
as well as portlandite minerals in the Muğla marble.
In the XRD patterns of the grey limestone, calcium hydroxide (portlandite) and
dicalcium silicate were indicated (Figure 3.20 b). This may suggest that the formation of
calcium hydroxide is more favorable than the formation of calcium silicate hydrate.
Table 3.6. Minerals identified by the XRD analysis after the hydration of calcined marbles and
limestones.
Samples Lime
(Ca(OH)3)
Brucite
(Mg(OH)2)
Coesite
SiO2
Calcium silicate
(Ca2SiO4)
Marmara +++ - - -
Mugla +++ + - -
White +++ - + -
Grey +++ - - ++
46
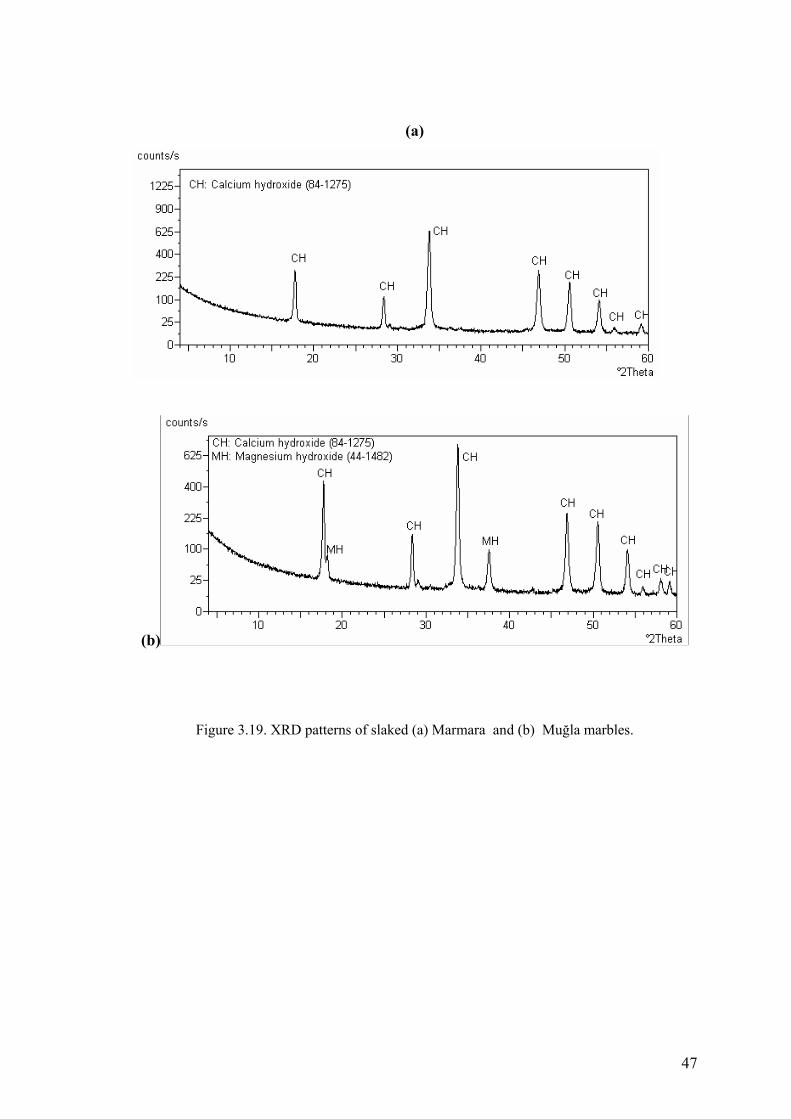
(a)
(b)
Figure 3.19. XRD patterns of slaked (a) Marmara and (b) Muğla marbles.
47
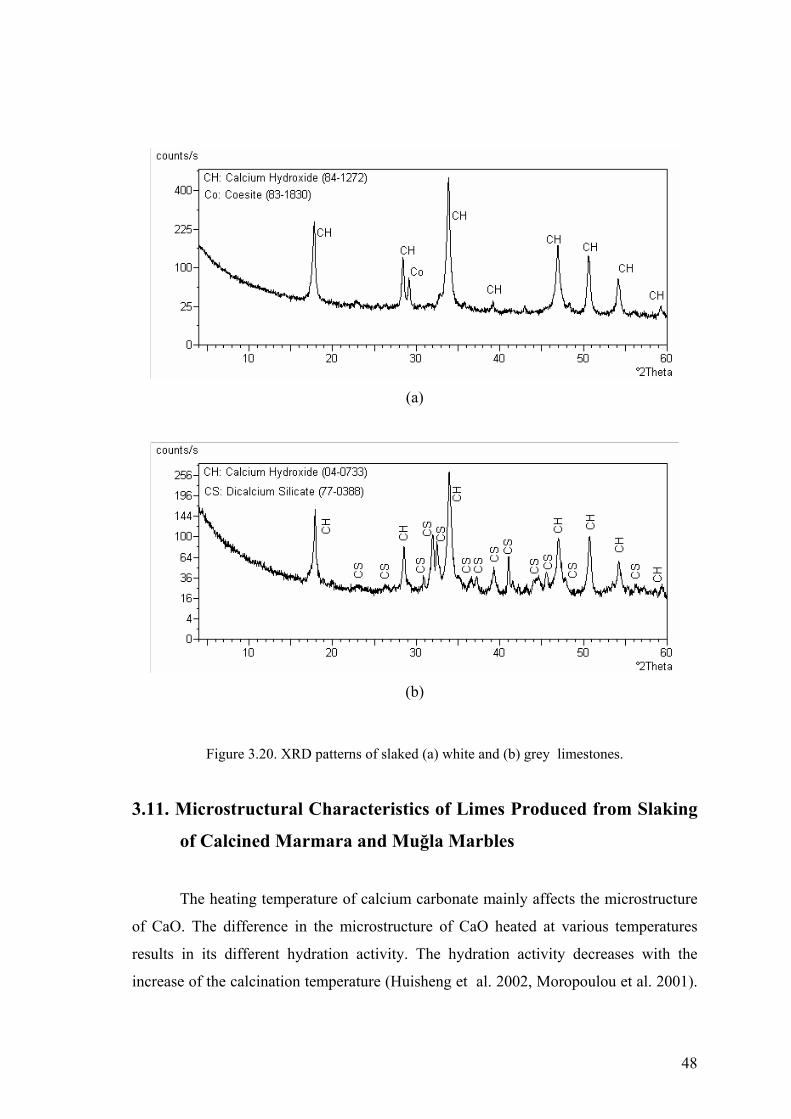
(a)
(b)
Figure 3.20. XRD patterns of slaked (a) white and (b) grey limestones.
3.11. Microstructural Characteristics of Limes Produced from Slaking
of Calcined Marmara and Muğla Marbles
The heating temperature of calcium carbonate mainly affects the microstructure
of CaO. The difference in the microstructure of CaO heated at various temperatures
results in its different hydration activity. The hydration activity decreases with the
increase of the calcination temperature (Huisheng et al. 2002, Moropoulou et al. 2001).
48

In this study, the hydration activities of limes produced from marbles should be high
due to the low calcination temperature (850 °C).
In the slaked Marmara and Muğla marbles calcium hydroxide crystals form a
network with grains of irregular shape and average size in the sub-micrometer range.
The formation of sub-micron size of calcium hydroxide crystals may show high
hydration activities of quicklime produced from marbles.
Figure 3.21. Secondary electron images and the EDS spectrum of calcium hydroxide formed by
slaking of calcined Marmara marble.
49

Figure 3.22. Secondary electron images and the EDS spectrum of calcium hydroxide crystals
formed by slaking of the calcined Muğla marble.
50

3.12. Microstructural Characteristics of Limes Produced from Slaking
of Calcined White and Grey Limestones
The calcium hydroxide crystals which are formed by slaking of heated white and
grey limestones differ from the crystals of Marmara and Muğla marbles. Limes which
are formed by grey and white limestones have an amorphous appearance, whereas limes
produced from Marmara and Muğla marbles have a microcrystalline structure.
(Figures 3.23, 3.24). On scanned electron micrographs, formed limes appear as a cluster
of very fine particles having less than 1 micrometer diameter.
Figure 3.23. Secondary electron images and the EDS spectrum of calcium hydroxide crystals
formed by the slaking of calcined white limestone.
Differently from the white limestone, on SEM pictures of grey limestone
weathered textured of diatomite due to the formation of calcium silicate, were observed
as well as very fine calcium hydroxide crystals (Figure 3.24).
51

Figure 3.24. Secondary electron images and the EDS spectrum of calcium hydroxide and
calcium silicate crystals formed by the slaking of calcined grey limestone.
3.13. Mineralogical Composition of Carbonated Limes Produced from
Calcined Marbles and Limestones
The carbonation of lime in the air is done by the reaction of carbon dioxide. The
carbonation reaction is exothermic (Reaction 3.4).
Ca(OH)2 + CO2 → CaCO3 + H2O +74 KJ (Reaction 3.4)
52

The rate of the carbonation depends on the CO2 concentration and pressure,
moisture content, temperature, relative humidity and thickness of specimen (Silva et.al.
2006).
During the carbonation, calcium hydroxide reacts with the carbon dioxide and forms
calcite crystals. There are several stages in the carbonation process of the lime
(Arandigoyen et al. 2005). They are;
a) CO2 diffuses through the lime being influenced by the microstructure and by the
water content
b) The carbon dioxide is dissolved in the water
c) The chemical equilibrium of CO2 occurs and
d) The precipitation of calcite occurs
After the process, the volume is increased by 11.8% due to carbonation of calcium
hydroxide (Dario et al. 2005).
In this study calcined marbles and limestones (quicklimes) were hydrated with
distilled water in the glass beaker until lime putty was produced. The lime putty was
then spread out on glass slides and carbonated for one month in the laboratory. During
carbonation, the lime was wetted with distilled water. After one month, the samples
were dried in an oven at 40 ° C for 24 hours. Mineralogical compositions of the
carbonated lime were determined by using a Philips X-pert X-ray diffraction (XRD) and
a Spectrum BX II FTIR spectrometer (Perkin Elmer). After the carbonation of lime,
only calcium carbonate peaks were observed in the XRD patterns of the Marmara
marble, and white limestones (Table3.7, Figures 3.25, 3.26). This shows that limes
produced from calcined Marmara marble and white limestone have been completely
carbonated (Figures 3.25, 3.26). However, an incomplete carbonation reaction in the
lime produced from the Muğla marble has been observed after a month. This may
explain the higher thickness of the lime putty on the glass compared to the lime of
Marmara marble.
After the carbonation of lime produced from the grey limestone, mainly calcium
carbonate peaks and a basic peak of calcium silicate in low intensity have been observed
in the XRD patterns (Figure 3.25). The disappearance of calcium silicate peaks (C2S) in
the XRD patterns of lime was explained by the formation of calcium silicate hydrate
(CSH) with water. The expected main XRD peaks of CSH were not observed in the
53

carbonated lime. This was probably due to the amorphous character of CSH or its
principal peaks overlap with calcite (Luxan 1996).
Table 3.7. Minerals identified by XRD analysis after carbonation.
Samples Calcite
(CaCO3)
Lime
(Ca(OH)3)
Brucite
(Mg(OH)2)
Calcium silicate
(Ca2SiO4)
Marmara +++ - - -
Mugla +++ + + -
White +++ - - -
Grey +++ - - +
54

(a)
(b)
Figure 3.25. XRD patterns of carbonated (a) Marmara and (b) Muğla limes.
55

(a)
(b)
Figure 3.26. XRD patterns of carbonated limes produced from (a) white and (b) grey
limestones.
3.14. Microstructure of Carbonated Lime Produced from Marmara
and Muğla Marbles
SEM-EDS analysis indicated that carbonated limes produced from Marmara and
Muğla marbles were composed of micritic calcite crystals (Figures 3.27, 3.28). Crystals
are nearly between 2-5 µm in size and they are well developed crystalline structures.
When carbonation of lime is completed, calcium hydroxide crystals transforms
into a much denser calcite crystal structure. Pore size distribution shifts towards smaller
56

pores. Volume of the calcium hydroxide increase when it transforms into calcite
(Arandigoyen et al. 2005). The volume increases by 11.8% due to carbonation of
calcium hydroxide. However, excess water present in the lime causes the shrinkage of
the lime due to the evaporation. The evaporation of the excess water in the lime leads
also to the porous structure (Arandigoyen et al. 2005).
Figure 3.27. Secondary electron images and EDS spectrum of carbonated lime produced from
Marmara marble.
57

Figure 3.28. Secondary electron images and EDS spectrum of calcite crystals containing
magnesium in carbonated lime produced from Muğla marble.
3.15. Microstructure of Carbonated Lime Produced from White and
Grey Limestone
SEM-EDS analysis indicated that carbonated lime produced from white
limestone was composed of micritic calcite crystals (Figure 3.29). Crystals are nearly 4
µm in size and they were well packed together (Figure 3.29).
58

Figure 3.29. Secondary electron images and EDS spectrum of calcite crystals in carbonated lime
produced from white limestone.
SEM-EDS analysis indicated that carbonated lime produced from grey limestone
was composed of micritic calcite crystals connected with fibrous network rich in silicon
oxide (Figure 3.30). Diatoms in the carbonated lime were weathered due to the
formation of amorphous needle like calcium silicate hydrate formation (Figure 3.31).
59

Figure 3.30. Secondary electron images and EDS spectrum of calcite crystals in carbonated lime
produced from grey limestone.
60

Figure 3.31. Secondary electron images and EDS spectrum needle like calcium silicate hydrate
formation in carbonated lime produced from grey limestone.
3.16. Hydraulicity of the Carbonated Limes
Hydraulic properties of lime can be determined by calculating hydraulic (HI)
and cementation (CI) indices according to Boynton formula (Reactions 3.5, 3.6). The
higher indices values indicate the more hydraulic character of lime (Table 3.8).
61

%MgO+%CaO
SiO % + OFe % + O%Al=HI
23232 (Equation 3.1)
%MgO 1.4 + %CaO
OFe % 0.7 + O%Al 1.1 + SiO % 2.8=CI
32322 (Equation 3.2)
The cementation and hydraulicity indices values of lime are given in Table 3.9.
According to the cementation and hydraulic indices values, lime produced from grey
limestone limes can be classified as highly hydraulic lime. On the other hand, limes
produced from Marmara and Muğla marble are not hydraulic (Table 3.9). Because their
hydraulic and cementation indices are less than 0.1 and 0.3. The lime produced from
white limestone can be accepted as weakly hydraulic.
Table 3.8. Classification of limes according to cementation and hydraulicity indices.
Lime Hydraulic Index Cementation Index
Weakly hydraulic 0.1 – 0.2 0.3 -0.5 Moderately hydraulic 0.2-0.4 0.5-0.7 Highly hydraulic <0.4 0.7 -1.1
Table 3.9. Cementation and hydraulicity indices of carbonated limes.
Sample Hydraulic Index Cementation Index
Mar-M 0.00 0.00
Mu-M 0.06 0.11
W-L 0.12 0.22
G-L 0.58 1.35
Hydraulicity of lime can also be evaluated by thermal analysis (TGA). For this
purpose, percentages of weight losses at 200-600oC and at temperatures over 600oC
were determined on carbonated limes. Weight loss at temperatures of 200-600oC was
mainly due to loss of chemically bound water of hydraulic products, such as calcium
silicate hydrates and calcium aluminate hydrates (Bakolas et al. 1995). Weight loss at
temperatures over 600oC was due to carbon dioxide released during the decomposition
62

of carbonates (Bakolas et al. 1995). It has been reported that if the ratio of CO2/H2O is
between 1 and 10 in a given mortar, it can be accepted as a hydraulic lime mortar
(Moropoulou et al. 2000, Moropoulou et al. 2001).
Table 3.10. The weight losses between 200°C and 600°C and weight losses over 600°C of
carbonated limes.
Sample 200-600 °C (H2O) >600 °C (CO2) CO2/H2O
Mar-M 0.67 46 68.7
Mu-M 5.1 38.63 7.6
W-L 6.2 38.55 6.2
G-L 6.4 25.6 4
Table 3.9 shows that, limes excepting Marmara marble have hydraulic
properties. Muğla marble does not contain silica and aluminum that are needed for
formation of hydraulic lime. Therefore, lime produced from Muğla marble is not
expected to be hydraulic. Weight loss in carbonated lime observed at 200-600 °C
temperature can be explained by lime that is not carbonated. Observing non-carbonated
lime in XRD patterns of lime produced from Muğla marble support this idea. Similarly,
white limestone does not contain sufficient silica and alumina. Therefore, the hydraulic
properties of the lime produced from white limestone can be explained by non-
carbonated lime.
63

(a)
(b)
(c)
(d)
Figure 3.32. TGA graphs of carbonated limes produced from (a) Marmara, (b) Muğla marbles
and (c) white and (d) grey limestones.
64

3.17. Mineralogical Compositions of Lime Mortars after One Year
Carbonation
Mechanical properties of mortars (4.5x5 cm), which were prepared by mixing
marble aggregates and mortars produced from limestones, were tested after 3, 6, and 12
months. Mineralogical compositions of samples broken in these tests were determined
by XRD analysis. The minerals determined by these analysis were shown in Figures
3.33, 3.34, 3.35, 3.36 and Table 3.11.
As is shown in XRD analysis, calcium hydroxide peaks have become less
intense after 3 months. It shows that, carbonation is enhanced by time. (Table 3.11).
However, there are no calcium silicate peaks in mortars prepared by lime produced from
grey limestone. It refers that, during the carbonation process calcium silicate has
transformed into amorphous calcium silicate hydrate by the reaction of moisture in the
air.
Table 3.11. Ratios of intense peak of CaCO3 (29.4 2Θ) to Ca(OH)2 (34.0 2Θ) after 3, 6 and 12
months carbonation.
CaCO3 / Ca(OH)2
Samples Initial 3 Months 6 Months 12 Months
Marmara 0 0.86 4.08 2.97
Mugla 0 1.54 5.41 2.72
White 0 0.98 3.09 19.93
Grey 0 4.76 9.31 31.6
65
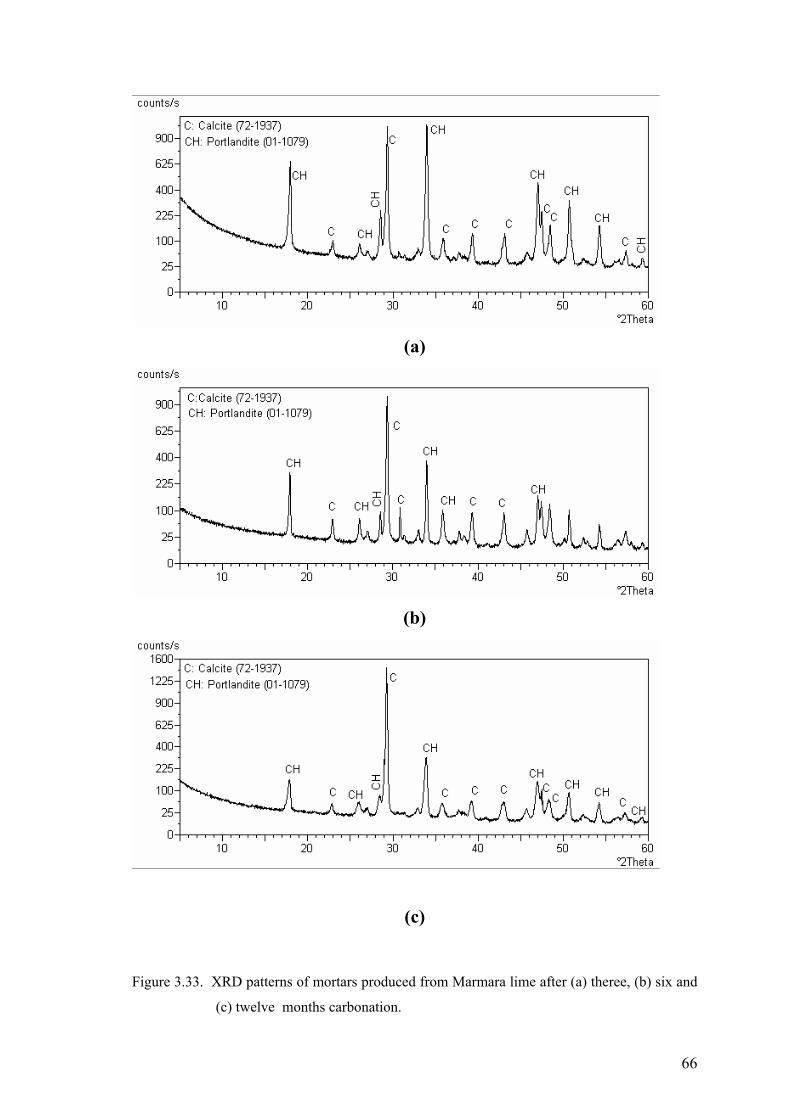
(a)
(b)
(c)
Figure 3.33. XRD patterns of mortars produced from Marmara lime after (a) theree, (b) six and
(c) twelve months carbonation.
66

(a)
(b)
(c)
Figure 3.34. XRD patterns of mortars produced from Muğla lime after (a) theree, (b) six and
(c) twelve months carbonation.
67

(a)
(b)
(c)
Figure 3.35. XRD patterns of mortars produced from white lime after (a) theree, (b) six and (c)
twelve months carbonation.
68

(a)
(b)
(c)
Figure 3.36. XRD patterns of mortars produced from grey lime after (a) three, (b) six and (c)
twelve months carbonation.
69

3.18. Uniaxial Compressive Strengths and Modulus of Elasticities of
Test Mortars Uniaxial compressive strengths and modulus of elasticities of mortars were
determined after 3, 6, and 12 months of carbonation in the laboratory conditions.
Compressive strength tests were carried out with AG-I Shimadzu under a uniaxial
pressure of 15 KN.
Figure 3.37. Uniaxial compressive strengths and modulus of elasticities of test mortars.
According to the test results, mortar produced from grey limestone had the
highest compressive strength values of 3.70 MPa., after 3 months carbonation process
while the mortar produced from white limestone had the lowest values of 0.70 MPa.
The Muğla and Marmara marbles had the values of 1.02 MPa. and 1.17 MPa. The
second test was performed after 6 months carbonation process. When compared to the
first tests results, a remarkable increase in the values of the limes produced from grey
and white limestone have been observed due to increase in waiting period. The value of
the lime produced from grey limestone was 5.83MPa. and the value of lime produced
from white limestone was 1.55 MPa. However, the limes produced from Muğla and
Marmara marbles had approximate values. Similarly, according to the last tests results,
after 12 months carbonation period, the strongest lime that resist highest compression
forces was the one produced from grey limestone which had the value of 6.62 MPa. The
lime produced from white limestone had the secondary highest value of 2.17 MPa. It is
shown that, there is a significant increase in the compressive strengths values of the
lime produced from grey limestone due to the highly hydraulic properties of the lime
70

since hydraulic limes harden in time. Similarly, a considerable increase has been
observed in the values of the lime produced from white limestone which is weakly
hydraulic. On the other hand, limes produced from Muğla and Marmara marbles which
are non-hydraulic limes, had lower values of 1.44 MPa. and 1.46 MPa.
In order to understand the elastic behaviour of the mortars against the applied
forces, modulus of elasticitiy of the mortars were calculated after 3, 6 and 12 months
carbonation processes. According to the results, the lime produced from grey limestone
have the highest modulus of elasticity values of 218.08 MPa., 277.59 MPa., 302.61
MPa. The values of lime produced from white limestone were 23.44 MPa., 129.14
MPa., 98.77 MPa. The lime of Marmara marble had the values of 42.03 MPa., 97.00
MPa., 74.89 MPa. and the lime of Muğla marble had the values of 47.86 MPa., 69.63
MPa., 73.79 MPa.
Table 3.12. Compressive strength values of the samples.
Sample
Compressive Strength(MPa.) after 3 months
Compressive Strength(MPa.) after 6 months
Compressive Strength(MPa.) after 12 months
grey 3.7 5.8 6.6 white 0.7 1.6 2.2 marmara 1.2 1.7 1.5 muğla 1.0 1.3 1.4
Table 3.13. Modulus of elasticity values of the samples.
Sample
Modulus of Elasticity (MPa.) after 3 months
Modulus of Elasticity (MPa.) after 6 months
Modulus of Elasticity (MPa.) after 12 months
grey 218.1 277.6 302.6 white 23.4 129.1 98.8 marmara 42.0 97.0 74.9 muğla 47.9 69.6 73.8
71

CHAPTER 4
CONCLUSION
In this study, characteristics of lime produced from some marbles and
limestones were investigated in order to compare their effects as binders on the lime
mortars. For this purpose, limestones that contain low and high amounts of diatoms and
marbles quarried from the city of Muğla and the Marmara Island were selected as stone
samples.
The Marmara marble and white limestone are composed mainly of calcite
crystals, whereas Muğla marble contains low amounts of dolomite crystals as well as
calcite crystals. Furthermore, white limestone contains low amounts of SiO2 and Fe2O3
differently from the Muğla and Marmara marbles. On the other hand, the grey limestone
is mainly composed of CaCO3, SiO2 and Al2O3.
The sizes of the calcite crystals of the Marmara marble, which are tightly
bounded to each other since the stone sample has a low porosity, are in the range of 2.2
to 3.6 mm. On the other hand, the Muğla marble has smaller calcite crystals that vary in
the range of 22-800 micrometres. The white and grey limestones show small and large
grain size calcite crystals that are distributed inhomogeneously in the stones.
The calcination temperature of the stones is around 800 °C. The calcined white
limestone, Marmara and Muğla marble are mainly composed of calcium oxide.
However, Muğla marble consists higher amounts of magnesium oxide that is derived
from dolomite in its composition. On the other hand, calcinated grey limestone contains
calcium silicate (Ca2SiO4) as well as calcium oxide (CaO). Formation of calcium
silicate (Ca2SiO4) indicates that production of hydraulic lime at a relatively low
calcination temperature is possible.
The slaked Marmara marble and white limestone are composed of portlandite
crystals. However, the slaked Muğla marble contains magnesium oxide as well as
portlandite in its composition. Owing to the formation of calcium silicate, the diatomites
have weathered textures. Moreover, the calcium hydroxide crystals that are formed by
slaking of the Marmara and the Muğla marbles have microcrystalline structure, while
the grey and the white limestone have amorphous appearance.
72

The carbonated white limestone and the Marmara marble are composed of
mainly calcium carbonate. However, lime produced from the grey limestone consist of
calcium silicate hydrate as well as calcium carbonate. The carbonated lime produced
from the grey limestone is composed of micritic calcite crystals connected with fibrous
network rich in silicon oxide.
Carbonated limes produced from the Marmara and the Muğla marbles are
composed of micritic calcite crystals that form well developed crystalline structures and
vary in size between 2-5 µm. On the other hand, the calcite crystals of lime produced
from the white limestone are nearly 4 µm in size and well packed together.
According to the cementation and hydraulic indices values, lime produced from
grey limestone can be classified as highly hydraulic lime whereas the lime produced
from white limestone can be accepted as weakly hydraulic. On the other hand, limes
produced from Marmara and Muğla marble are not hydraulic.
According to the mechanical test results, the lime produced from grey limestone
had relatively high compressive strength values compared to the others. It means that,
hydraulic lime mortars have higher mechanical strength than non-hydraulic lime
mortars.
This study has shown that, producing hydraulic limes at relatively low
temperatures by using limestones containing diatoms is possible. Considering this
result, it can be concluded that hydraulic lime could be produced by the calcining of
limestone containing diatoms in historic kilns.
73

REFERENCES Arandigoyen M., Pérez Bernal J.L., Bello López M.A., Alvarez J.I. 2005. ‘‘Lime-
pastes with Different Kneading Water: Pore structure and capillary porosity’’, Applied Surface Science. Vol. 252, No.5, pp.1449-1459.
Bakolas A., Biscontin G., Contardi V., Franceschi E., Moropoulou A., Palazzi D.,
Zendri E. 1995. ‘‘Thermoanalytical research on traditional mortars in Venice’’, Thermochim Acta. Vol. 269(270), pp. 817-828.
Beruto D.T., Barberis F., Botter R. 2005. ‘‘Calcium carbonate binding mechanisms in
the setting of calcium and calcium–magnesium putty-limes’’, Journal of Cultural Heritage. Vol. 6, No. 3, pp. 253-260.
Boynton, R.S., 1966. Chemistry and Technology of Lime and Limestone, (John Wiley &
Sons, New York). Boynton R.S., 1984. ‘‘Lime and limestone’’, in Encyclopaedia of Chemical
Technology, (3 rd edn, Wiley, Newyork), pp. 343-382. Böke H., Çizer Ö., İpekoğlu B., Uğurlu E., Şerifaki K., Toprak G. 2007.
“Characteristics of lime produced from limestone containing diatoms”, Construction and Building Materials, in press.
Callebaut K., Elsen J., Van Balen K., Viane W. 2000. ‘‘Historical and scientific study
of hydraulic mortars from the 19 th century ’’, Rilem Publications. Vol. 12, pp. 32-125.
Callebaut K., Elsen J., Van Balen K., Viane W. 2001. ‘‘Nineteenth century hydraulic
restoration mortars in the Saint Michael’s Church (Leuven, Belgium) natural hydraulic lime or cement?’’, Cem Concr Res. Vol.31, pp. 397-403.
Carrington D., and Swallow P. 1996. ‘‘Limes and lime mortars - Part two’’, Journal
of Architectural Conservation. Vol.1, pp. 7-22. Cazalla O., Navarro C. R., Sebastian E., Cultrone G. 2000. “Aging of Lime Putty:
Effects on Traditional Lime Mortar Carbonation”, Journal of American Ceramic Society. Vol. 83, pp. 1070-1076.
Cowan H.J., 1977. “Structure in the Ancient World”, in The Master Builders – A
History of Structural and Environmental Design from Ancient Egypt to the Nineteenth Century, (John Wiley & Sons, New York), pp. 25-74.
Cowper A.D., 2000. Lime and Lime Mortars, (Donhead Publishing Ltd, Dorset), (First
published in 1927 for the Building Research Station by HM Stationary Office, London).
74

Çizer Ö. 2004. "Investigation of Lime Mortar Characteristics for the Conservation of the Ottoman Baths in Seferihisar-Urla Region", M.Sc. Thesis, İzmir Institute of Technology, Graduate School of Engineering and Sciences, İzmir.
Davey N., 1961. A History of Buildings Materials, (Phoenix House, London), pp. 97-
127. De Silva P., Bucea L., Moorehead D.R., Sirivivatnanon V. 2006. ‘‘Carbonate binders:
Reaction kinetics, strength and microstructure’’, Cement and Concrete Composites. Vol.28, No.7, pp.613-620.
Dornap G.F. 1977. “EinfluB der Löschbedingungen auf die Qualitat des gebildeten
Calcium hydroxids beim NaBlöschen von Kalk”, Zement-Kalk-Gips. Vol.30, pp. 34-39.
Eades J.L., Sandberg P.A., 1970. “Characterization of the properties of commercial lime
by surface area measurements and scanning electron microscopy”, in American Society for Testing and Materials, (ASTM Special Technical Publication 472, Philadelphia), pp. 3-23.
Eckel E.C., 1928. Cements, Limes and Plasters – Their Materials, Manufacture and
Properties, (John Wiley & Sons, New York), pp. 91-583. Fragoulis D., Stamatakis M.G., Papageorgiou, Chaniotakis E., 2005. ‘‘The physical and
mechanical properties of composite cements manufactured with calcareous and clayey Greek diatomite mixtures’’, Cement and Concrete Composites. Vol.27, pp.205-209.
Gadsden JA., 1975. Infrared spectra of minerals and related inorganic compounds,
(Butterworth). Gay C. M., Parker H., 1932. Materials and Methods of Architectural Construction,
(John Wiley & Sons Inc., New York), pp. 14-17. Gillot J.E. 1967. “Carbonation of Ca(OH)2 investigated by thermal and x-ray diffraction
methods of analysis”, Journal of Applied Chemistry. Vol.17, pp. 185-189. Gualtieri, A.F., Viani A. and Montanari C. 2006. ‘‘Quantitative phase analysis of
hydraulic limes using the Rietveld method’’, Cement and Concrete Research. Vol. 36, No. 2, pp. 401-406.
Gürel A., Yıldız A. 2006. ‘‘Diatom communities, lithofacies characteristics and
paleoenvironmental interpration of plicene diatomite deposits in the Ihlara-Selime plain (Aksaray, Central Anatolia, Turkey)’’, Journal of Asian Earth Sciences, In press.
Hassibi M. 1999. “An Overview of Lime Slaking and Factors That Affect The Process”,
Presented to 3rd International Sorbalit Symposium, New Orleans, LA USA , (3 November -5 November 1999).
75

Hedin R. 1963. ‘‘Plasticity of Lime Mortars’’, National Lime Association. Vol.3 . Henisch H.K., 1998. Crystal Growth in Gels and Liesegang Rings, (Cambridge
University Press). Holmes S., Wingate M., 1997. Building with Lime, (Intermediate Technology
Publications, London).
Huisheng S., Yujing Z., Wenwen L. 2002. ‘‘Effects of temperature on the hydration characteristics of free lime’’, Cement and Concrete Research. Vol. 32, pp.789-793.
Korunic Z. 1998. ‘‘Diatomaceous earths, a group of natural insecticides’’, Journal of
Stored Restoration. Vol.34, pp. 87-97. Lea F.M. 1940. “Investigations on Pozzolanas”, Building Research. No.27, pp. 1-63. Lynch G. 1998. “Lime Mortars for Brickwork:Traditional Practice and Modern
Misconceptions-Part One”, Journal of Architectural Conservation. Vol.4, pp.7-20. Luxan M.P, Dorrego F. 1996. ‘‘Ancient XVI Century Mortar from the Dominican
Republic: its characteristics, microstructure and additives’’, Cem Concr Res. Vol.26, pp.841-849.
McClellan G.H., and Eades J.L., 1970. “The Textural Evolution of Limestone
Calcines”, in American Society for Testing and Materials, (ASTM Special Technical Publication 472, Philadelphia), pp. 209-227.
Moens L., Roos P., De Rudder J., Hoste J., 1989. ‘‘Chemical and petrographical
identification of white marbles from the Mediterranean area’’, Proceedings of the 25th International Archaeometry Symposium, Amsterdam.
Moorehead D.R. 1986. ‘‘Cementation by the Carbonation of Hydrated Lime”, Cement
and Concrete Research. Vol.16, pp.700-800. Moropoulou A, Bakolas A, Bisbikou K. 2001. ‘‘Investigation of the technology of
historic mortars’’, Cultural Heritage. Vol.1, pp.45-48. Moropoulou A, Bakolas A, Bisbikou K. 2000. ‘‘Physico-chemical adhesion and
cohesion bonds in joint mortars imparting durability to the historic structures’’, Construction Building Material. Vol.14, pp.35-46.
Moropoulou A., Bakolas A., Aggelakopoulou E. 2001. “The effects of limestone
characteristics and calcination temperature to the reactivity of the quicklime”, Cement and Concrete Research. Vol.31, pp.633-639
Oates T., 1991. “Lime and Limestone” in Encyclopaedia of Chemical Technology, (4
th edn, Wiley, New York 1991), pp. 317-345. Peter N., 1850. Encylopedia of Architecture, (Fry & Co., New York).
76

Potgieter J.H., Potgieter S.S., Moja S.J. 2002. “An empirical study of factors
influencing lime slaking. Part I: production and storage conditions”, Minerals Engineering. Vol.15, pp.201-203.
Rodriguez-Navarro C., Hansen E., and Ginell W.S. 1998. “Calcium hydroxide crystal
evolution upon aging of lime putty ”, Journal of the American Ceramic Society. Vol.81, pp. 3032-3034.
Schlitt W.J., Healy G.W., 1970. “ Characterisation of Lime: A Comparison and Scaling
Down of the Coarse Grain Titration Test and ASTM Slaking Rate Test” in American Society for Testing and Materials , (ASTM Special Technical Publication 472, Philadelphia), pp. 143-160.
Stanmore B.R., Gilot P. 2005. “Review-calcination and carbonation of limestones
during thermal cycling for CO2 sequestration’’, Fuel Processing Technology. Vol.86, pp. 1707-1743.
Swallow P., Carrington D. 1995. “Limes and Lime Mortars–Part 1”, Journal of
Architectural Conservation. Vol.1, pp.7-25. Teomete E. 2004. “Finite element modeling of historical masonry structures; Case
study:Urla Kamanlı Mosque’’, M.Sc. Thesis, İzmir Institute of Technology, İzmir. Van Balen V., Van Gemert D. 1994. “Modelling lime carbonation”, Materials and
Structures. Vol.27, pp. 393-398. Varas M.J. , Alvarez de Buergo M., Fort R. 2005. ‘‘Natural cement as the precursor of
Portland cement: Methodology for its identification’’, Cement and Concrete Research. Vol. 35, No.11, pp.2055-2065.
Vicat L. J., 2003. Mortars and Cements, (Donhead Publishing Ltd, Dorset), (First
published in 1837, London). Wingate M., 1985. Small-Scale Lime Burning: A Practical Introduction, (Intermediate
Technology Publications, London). Yavuz B.A.H., Türk N., Koca M.Y., 2002. Muğla yöresi mermerlerinin mineralojik,
kimyasal, fiziksel ve mekanik özellikleri, (Muğla Üniversitesi Yayınları), pp.1-18. Yu P., Kirkpatrick RJ., Poe B., McMillan PF. 1999. ‘‘Structure of calcium silicate
hydrate (C-S-H): Near-, Mid-, and Far-Infrared Spectroscopy’’, Journal of American Ceramic Society. Vol.82, No. 3, pp.742-748.
77
Top Related