


Languages
Pages
Legal


25
Tiara Budi Wardani, 2017 IMPROVING STUDENTS’ UNDERSTANDING OF LIGHTS AND OPTICS AND UNDERSTANDING ABOUT NATURE OF SCIENCE (NOS) THROUGH INQUIRY BASED LABORATORY ACTIVITY Universitas Pendidikan Indonesia | repository.upi.edu | perpustakaan.upi.edu
CHAPTER III
RESEARCH METHODOLOGY
A. Research Method and Research Design
1. Research Method
The research method that used in this research is Quasi Experiment. Quasi
experiment includes assignment, but not random assignment of participants to
groups (Creswell, 2012). Creswell (2012) stated that it can be used when the
researcher cannot artificially create groups for the experiment. This method is
appropriate with the purpose of this research which is investigating the effect of
Inquiry based Laboratory Activity towards students’ understanding about lights
ad optics and understanding about nature of science (NOS).
2. Research Design
Pre-test and post-test design was used in this reseach as the research
design. The researcher assigned two groups of participants. One group was taken
as the experimental group and the other ones as the control groups, then the
researcher administered a pre-test to both groups, conducted experimental
treatment activities to the experimental group only, and then administered a
post-test to assess the differences between the two groups (Creswell, 2012).
The treatment given to both group are in the same learning method, which
is laboratory activity but the learning model are different. The control group
used conventional model of laboratory activity while the experiment group used
the inquiry based laboratory activity.
Table 3.1 Pre-test and Post-test Design
Selected Control
Group
Pre-test Non-Inquiry based
Laboratory Activity
Post-test
Selected
Experimental
Group
Pre-test Inquiry based
Laboratory Activity
Post-test
(Cressell, 2012)

26
Tiara Budi Wardani, 2017 IMPROVING STUDENTS’ UNDERSTANDING OF LIGHTS AND OPTICS AND UNDERSTANDING ABOUT NATURE OF SCIENCE (NOS) THROUGH INQUIRY BASED LABORATORY ACTIVITY Universitas Pendidikan Indonesia | repository.upi.edu | perpustakaan.upi.edu
B. Population and Sample
The sampling technique that used in this research was Cluster Random
Sampling. Fraenkel, Wallen and Hyun (2007) stated that cluster random
sampling randomly select only one cluster as a sample and then observing or
interviewing all individuals within that cluster. Even if there are a large number
of individuals within the cluster, it is the cluster that has been randomly selected,
rather than individuals.
Then, after the random lottery has been conducted, one class consisted of
24 students was taken as experimental class, while the other class consisted of
21 students taken as control class. Both group generally consisted of almost half
males and half females with the age around 14 years old.
Table 3.2 The Percentage of Students’ Gender
Gender
Experiment Class Control Class
Number of
Students Percentage
Number of
Students Percentage
Male 13 54,2% 12 57,1%
Female 11 45,8% 9 42.9%
Total 24 100% 21 100%
C. Assumption
The assumptions as the foundation of this research are as follow.
1. Inquiry based Laboratory Activity can give more positive effect toward
students’ conceptual mastery (Wolf and Fraser, 2007; Sesen and Tarhan,
2013) and understanding about Nature of Science (Ozgelen; Tuzun; and
Hanuscin, 2013).
2. Students’ conceptual mastery is considered as one of the importance
competences that have to be attained by the students like what stated by
Anderson and Krathwohl (2001) in the Revision of Bloom Taxonomy, the
students are said to be understand or have good conceptual knowledge when
they can build connection between “new” knowledge to be gained and their
prior knowledge.

27
Tiara Budi Wardani, 2017 IMPROVING STUDENTS’ UNDERSTANDING OF LIGHTS AND OPTICS AND UNDERSTANDING ABOUT NATURE OF SCIENCE (NOS) THROUGH INQUIRY BASED LABORATORY ACTIVITY Universitas Pendidikan Indonesia | repository.upi.edu | perpustakaan.upi.edu
3. Students’ understanding about Nature of Science (NOS) can be improved
using Inquiry based Laboratory Activity since this model engage students to
investigate science trough scientist way of thinking.
D. Hypothesis
Hypothesis that is tested in this research are as follow.
H0: There is no effect in students’ conceptual mastery in learning lights
and optics using Inquiry based Laboratory Activity.
H1: There is effect in students’ conceptual mastery in learning lights and optics
using Inquiry based Laboratory Activity.
H0: There is no effect in students’ understanding about nature of science
(NOS) in learning lights and optics using Inquiry based Laboratory
Activity.
H1: There is effect in students’ understanding about nature of science (NOS) in
learning lights and optics using Inquiry based Laboratory Activity.
E. Operational Definition
Operational definition explained in order to avoid the missunderstand
about this research. The terminologies used in this research are explained as
follow:
1. Learning activities is conducted by implementing Inquiry based Laboratory
Activity. This learning model was expressed in the lesson plan and assesed
using the observation sheet by the observers (several teachers).
2. Students’ conceptual mastery in this research is the competence of students
that covers the level cognitive by Anderson and Krathwohl (2001) in The
Revised Bloom’s Taxonomy, such as remembering (C1), understanding
(C2), applying (C3), Analyzing (C4) and Evaluating (C5). This competence
was measured using an objective test that consisted 25 multiple choice
questions (pre-test and post-test).

28
Tiara Budi Wardani, 2017 IMPROVING STUDENTS’ UNDERSTANDING OF LIGHTS AND OPTICS AND UNDERSTANDING ABOUT NATURE OF SCIENCE (NOS) THROUGH INQUIRY BASED LABORATORY ACTIVITY Universitas Pendidikan Indonesia | repository.upi.edu | perpustakaan.upi.edu
3. Students’ understanding about Nature of Science (NOS) in this research was
measured using a questionnaire which was adopted from Liang et al. (2008)
and already judged by experts.
4. Lights and Optics
Lights and Optics is chosen as the topic that learned in this research. The
topic focused to five subtopics based on Indonesia Nasional Curriculum of
2013, which are lights properties, images formed and its characteristics,
human and animal vision organs, the working principle of optical devices.
F. Research Instrument
In this research, instrument is necessary in order to be used for gaining the
data. There are several types of research instruments that were used in this
research. Those instruments are described below.
1. Observation Sheet
In this research, the observation sheet used to investigate the conformity of
the aspect of Inquiry based Laboratory Activity, lesson plan and the real learning
activity conducted by the researcher. This observation sheet contained several
statement and fulfilled by the observers that have the obligation to observe and
analyze the whole implementation and also to judge whether the implementation
was in line with the procedure or not by giving checklist if the activity stated in
the lesson plan is done by the researcher and giving cross sign for the opposite.
2. Objective Test
Objective test is the instrument that used to test the students’ conceptual
mastery, specifically in the lights and optics topic. The same objective test was
given to the student as pretest and posttest. Both control and experiment groups
were given pretest and posttes. Pretest conducted before the treatments are
given. The result of this test showed the basic knowledge of the students about
lights and optics topic. Then, the posttest conducted after the the treatments were
given.

29
Tiara Budi Wardani, 2017 IMPROVING STUDENTS’ UNDERSTANDING OF LIGHTS AND OPTICS AND UNDERSTANDING ABOUT NATURE OF SCIENCE (NOS) THROUGH INQUIRY BASED LABORATORY ACTIVITY Universitas Pendidikan Indonesia | repository.upi.edu | perpustakaan.upi.edu
The purpose of posttest was to measure the improvement of the students’
conceptual mastery. The type of questions that given in the pretest and posttest is
multiple choice, each contained 25 questions. The multiple choice questions was
constructed based on Anderson and Krathwohl (2001) in the Revision of
Bloom’s Taxonomy in the cognitive level of remembering (C1), understanding
(C2), applying (C3), analyzing (C4), and evaluating (C5). The table below is the
blue print of objective test before being analyzed and revised.
Table 3.2 The Blue Print of Objective Test Item Before Revision
Sub Topics Level of Cognitive Domain Tot
al
Percent
age C1 C2 C3 C4 C5
Light and its
properties 1,2 3,4 5 6,7 8, 9 9 22,5%
Image formed
by mirror and
its
characteristics
12,1
8 13,17
10,
14
11,1
5 16 9 22,5%
Image formed
by lense and its
characteristics
19,2
4
20,
22,
25
21,23 7 17,5%
Human vision 26,
27
28,
29 30,
31,3
2
7 17,5%
Optical devices 33,
34
35,
36
37,
38
39,4
0 8 20%
Total 10 11 8 8 3 40 100%
Percentage 25% 27,5
% 20%
20
%
7,5
%
100
%
All the test items were judged by the experts and tested to the students that
have learned about lights and optics, then after that the students’ answer was
analyzed using a statistical software, namely ANATES (the detail result of test
item analysis is attached in appendix). The result of ANATES was being the
consideration to elliminate the test items. Some of the test items were selected,
revised or deleted. The new blue print of objective test item was arranged and
used as the fix research instrument. From 40 test items, there are 25 test items
used. The new blue print of objective test items after being analyzed and revised
was shown in the Table 3.7.

30
Tiara Budi Wardani, 2017 IMPROVING STUDENTS’ UNDERSTANDING OF LIGHTS AND OPTICS AND UNDERSTANDING ABOUT NATURE OF SCIENCE (NOS) THROUGH INQUIRY BASED LABORATORY ACTIVITY Universitas Pendidikan Indonesia | repository.upi.edu | perpustakaan.upi.edu
3. Student Understanding of Science and Scientific Inquiry (SUSSI)
In this research, the students’ understandings about Nature of Science
(NOS) was measured using Student Understanding of Science and Scientific
Inquiry (SUSSI). SUSSI was a questionnaire in form of Likert-type items to
asses students’ understandings on the nature of science (NOS) in terms of six
aspects which are observations and inferences, tentativeness, scientific theories
and laws, social and cultural embeddedness, creativity and imagination, and
scientific methods (Liang et al., 2008). Each of the aspects consists of four
statements, the maximum score can be obtained by students in each aspects is 8,
while -8 for the minimum. SUSSI questionnaire allows the use of inferential
statistics to determine the effect of any instructional interventions in small or
large scale study. The SUSSI questionnaire is attached in appendix.
G. Instrument Development and Analysis
The objective test that was used to measure the students’ conceptual
mastery was tested before it was used as pretest and posttest. The instrument
development started by analyzing the curriculum applied in the chosen school.
Afterwards, the reseearcher formulated and arranged the objective test.In the
preparation stage, the objective test was validated and tested to the class that has
learned about lights and optics, which is the 9th grade studets. The analysis of
instrument consisted of the discriminating power, distractor, level of difficulty,
validity and realibility.
1. Discriminating Power
Discriminating power is define as ability of particular question to
distinguish the higher achiever with the lower achiever students. Discriminating
power index show the scale from minus one until positive ine, with the negative
one represent low discriminating power index. The result of discriminating
power test then interpreted using the interpretation of discriminating power by
Arikunto (2013).

31
Tiara Budi Wardani, 2017 IMPROVING STUDENTS’ UNDERSTANDING OF LIGHTS AND OPTICS AND UNDERSTANDING ABOUT NATURE OF SCIENCE (NOS) THROUGH INQUIRY BASED LABORATORY ACTIVITY Universitas Pendidikan Indonesia | repository.upi.edu | perpustakaan.upi.edu
2. Distractors
According to Escudero, Reyna and Morales (2000), distractors are the
stuff of multiple choice items, when incorrect alternatives are offered and
students have to select the correct alternatives. Here a simple frequency count of
the number of times a particular alternatives is selected provided information on
the effectiveness of the distractor. If it is selected several times then it is working
effectively, if it is never or seldom selected then it is not working effectively and
it should be replaced (Escudero, Reyna and Morales; 2000).
3. Difficulty Level
Difficulty level in this research means the ability of the test in gaining the
number of students who can give the right answer in the question. The ability of
students in answering difficult question is not seen from the perspective of the
teacher. According to Arikunto (2013), good question is the question which is
not too easy or too difficult to be answered. He also stated that the question
which are too easy will not stimulate the students to try harder to solve it, while
too dfficult questions will make students give up and lose heart. The categories
to consider the problems are easy, medium and difficult. The proportion of three
categories based on the normal curve. Means that, most of the problems are in
the medium category, some are included into category of easy and difficult with
balance proportion. The result of difficulty level test by ANATES then
interpreted using the interpretation of difficulty level by Arikunto (2013).
4. Validity
Validity refers to the extent to which an instrument measures what it is
intended to measure (Ary, Jacobs and Razavieh, 1979). While, according to
Golafshani (2003) validity determines whether the research truly measures that
which it was intended to measure or how thruthful the research results are.
Hence, by having this validity test, it can measure whether the data that resulted
from the test is valid with the variable that want to be measured and interpreted.

32
Tiara Budi Wardani, 2017 IMPROVING STUDENTS’ UNDERSTANDING OF LIGHTS AND OPTICS AND UNDERSTANDING ABOUT NATURE OF SCIENCE (NOS) THROUGH INQUIRY BASED LABORATORY ACTIVITY Universitas Pendidikan Indonesia | repository.upi.edu | perpustakaan.upi.edu
Content validity is the most common type of validation used by researcher
to ascertain id a test provides an accurate assesment of instructional objectives
(Miller, 2008). It is the most important idea to consider when preparing or
selecting an instrument for use (Fraenkel, 2011). Each type of validity follows
specific procedures and has primary use. In this research, ANATES software
was used to measure or determine the validity of the instrument. The result then
interpreted using the interpretation by Minium, King and Bear (1993), it is the
interpretation about the correlation coefficient between x and y variable which is
devided into different categories.
5. Reliability
Reliability refers to the consistency of scores or answers from one
administration of an instrument to another, and from one set of items to another
(Fraenkel, 2011). Reliable means a test must rely fit on several aspects in
conducting the test item. The result of difficulty level test by ANATES then
interpreted using the interpretation of difficulty level by Minium, King and Bear
(1993).
H. Instrument Development and Analysis Result
1. Recapitulation of Objective Test Analysis Result
Before the objective test being used, the objective test was tested to the
students that have learned about lights and optics which are the students of 9th
grade in the same school of the sample students. Before analyzed and judged,
objective test consisted of 40 questions. The validity, realibility, discriminating
power and difficulty level of the instrument was analyzed. The test was given to
23 9th grade students. The recapitulation of objective test analysis result is shown
in the Table 3.3.
Test Item Recaptulation
Realibility Test : 0,77 (High)
33
Tiara Budi Wardani, 2017 IMPROVING STUDENTS’ UNDERSTANDING OF LIGHTS AND OPTICS AND UNDERSTANDING ABOUT NATURE OF SCIENCE (NOS) THROUGH INQUIRY BASED LABORATORY ACTIVITY Universitas Pendidikan Indonesia | repository.upi.edu | perpustakaan.upi.edu
Table 3.3 The Recapitulation of Objective Test Analysis Result
Question
Number
Discriminating
Power Difficulty Level Validity Status
1 Poor Very Easy Invalid Rejected
2 Poor Easy Very Low Rejected
3 Poor Easy Invalid Rejected
4 Poor Very Easy Invalid Rejected
5 Poor Very Difficult Very Low Rejected
6 Poor Very Easy Invalid Rejected
7 Good Medium Enough Used
8 Good Medium Low Revised
9 Good Very Easy Enough Used
10 Enough Difficult Low Revised
11 Good Medium Enough Used
12 Enough Medium Enough Used
13 Poor Very Easy Very Low Rejected
14 Poor Very Easy Very Low Rejected
15 Poor Very Easy Very Low Rejected
16 Enough Medium Low Revised
17 Poor Easy Very Low Rejected
18 Enough Very Easy Enough Used
19 Excellent Medium Enough Used
20 Poor Medium Very Low Revised
21 Enough Difficult Enough Used
22 Good Medium Enough Used
23 Enough Easy Low Revised
24 Good Very Easy Enough Used
25 Enough Medium Low Revised
26 Poor Easy Low Revised
27 Poor Easy Invalid Rejected
28 Poor Easy Invalid Rejected
29 Enough Medium Low Revised
30 Good Medium Low Revised
31 Poor Medium Very Low Rejected
32 Poor Medium Very Low Rejected
33 Good Medium Low Revised
34 Enough Medium Enough Used
35 Poor Difficult Very Low Rejected
36 Enough Very Difficult Low Revised

34
Tiara Budi Wardani, 2017 IMPROVING STUDENTS’ UNDERSTANDING OF LIGHTS AND OPTICS AND UNDERSTANDING ABOUT NATURE OF SCIENCE (NOS) THROUGH INQUIRY BASED LABORATORY ACTIVITY Universitas Pendidikan Indonesia | repository.upi.edu | perpustakaan.upi.edu
Question
Number
Discriminating
Power Difficulty Level Validity Status
37 Excellent Medium High Used
38 Good Medium Low Revised
39 Poor Medium Very Low Revised
40 Enough Very Easy Enough Used
The test item has been tested in terms of validity, realibility,
discriminating power and difficulty level also judgend by several experts then
revised so that it is adequate to be used as the research instrument to obtain the
data of students’ mastery. The following table is the blue print of objective test
as the research instrument to determine students’ conceptual mastery which is
based on cognitive domain.
Table 3.4 Blue Print of Objective Test after Analyzed
Sub Topics Level of Cognitive Domain Tot
al
Percent
age C1 C2 C3 C4 C5
Light and its
properties 1 2 3 4 5 5 20%
Image formed
by mirror and
its
characteristics
8,
10 6 7 9 5 20%
Image formed
by lense and its
characteristics
11 13
12,
14,
15
5 20%
Human vision 16 17 19 18,
20 5 20%
Optical devices 21 22,
23 24 25 5 20%
Total 6 5 7 5 2 25 100%
Percentage 24% 20% 28% 20% 8% 100
%
I. Data Analysis
The data collected from the research instrument was processed and
analyzed using statistical calculation. To make the statistical calculation
effective, so it helped by a software named (Statistic Product and Service

35
Tiara Budi Wardani, 2017 IMPROVING STUDENTS’ UNDERSTANDING OF LIGHTS AND OPTICS AND UNDERSTANDING ABOUT NATURE OF SCIENCE (NOS) THROUGH INQUIRY BASED LABORATORY ACTIVITY Universitas Pendidikan Indonesia | repository.upi.edu | perpustakaan.upi.edu
Solution) software version 17.0 (SPSS 17.0) which is a statistical program that
capable to process statistic data accurately.
To measure students’ conceptual mastery and understanding about Nature
of Science (NOS) improvement, the data of students’ score will be collected
from the pretest and posttest in form of objective test for students’ conceptual
mastery and questionnaire for understanding about Nature of Science (NOS).
The calculation process of data is explained as follow:
1. Scoring of Test
In this research, the improvement of students’ conceptual mastery is
measured using the data of test scores. The 25 test items were used in this
research. Each multiple choice correct answer was given 4 score and each
incorrect answer was given 0 score.
While the understanding about Nature of Science (NOS) was measured
using a questionnaire. There six aspects which were tested, when the students
were very agree with a positive statement, they were obtained 2 score, while if
they were very disagree, they were obtained -2. So, the scoring range was from -
48 to 48. -48 as the lowest score and 48 as the highest score they possibly got.
2. Calculation of Gain Score and Normalized Score
The gain of the students’ score is pretest and posttest score difference, in
order to measure the improvement of students’ conceptual mastery
understanding about Nature of Science (NOS). It could be assumed as the effect
of the treatment. After the actual gain was calculated, then the Normalized Gain
(N-Gain) was also calculated. Normalized gain was supposed to determine the
categories of the improvement.
According to Hake (1999), below is the formula to calculate the gain:
𝐺 = 𝑆𝑓 – 𝑆𝑖
Note
G = Gain score
Sf= Posttest score
Si= Pretest score

36
Tiara Budi Wardani, 2017 IMPROVING STUDENTS’ UNDERSTANDING OF LIGHTS AND OPTICS AND UNDERSTANDING ABOUT NATURE OF SCIENCE (NOS) THROUGH INQUIRY BASED LABORATORY ACTIVITY Universitas Pendidikan Indonesia | repository.upi.edu | perpustakaan.upi.edu
The effectiveness of the treatment by the teacher in teaching lights and
optics to improve students’ conceptual mastery and understanding about Nature
of Science (NOS) can be seen from the result of the normalized gain. The
formula of N-Gain is shown as follow:
< 𝑔 >=𝑆𝑓 − 𝑆𝑖
𝑆𝑚𝑎𝑥 − 𝑆𝑖
Note
G = Gain score
Sf= Posttest score
Si= Pretest score
(Hake,1999)
Then the normalized gain is interpreted and determined based on the
criteria based on Arikunto (2013).
3. Normality Test
In statistics, normality tests are used to determine if a data set is well-
modeled by a normal distribution and to compute how likely it is for a random
variable underlying the data set to be normally distributed (Razali, N. & Wah, Y.
B., 2011). In this research, normality was analyzed to know weather the data
from experimental and control group are distributed normally or not. The
anaysis used as consideration in data analysis weather the analysis using
parametric or non-parametric analysis test. If both data distribute normally, then
the homogenity should be tested. While, if the data distribution was not normal,
the data analysis can use Mann Whitney Test. Because the data gained in this
research was normal, so the homogenity should be tested as well. In this
resseach, the normality was calculated using SPSS.
4. Homogeneity Test
After the normality has been analyzed, the consideration to chose the
appropriate method was still not enough to be decided. Another aspect to be
analyzed is the homogeneity of the data. The homogeneity test relate to the

37
Tiara Budi Wardani, 2017 IMPROVING STUDENTS’ UNDERSTANDING OF LIGHTS AND OPTICS AND UNDERSTANDING ABOUT NATURE OF SCIENCE (NOS) THROUGH INQUIRY BASED LABORATORY ACTIVITY Universitas Pendidikan Indonesia | repository.upi.edu | perpustakaan.upi.edu
validity of the often convenient assumption that the statistical properties of any
one part of an overall dataset are the same as any other part (Krus, D.J., &
Blackman, H.S., 1988). Sudjana (2005) stated that the data is homogen when the
sig. value is more than 0,005. If the data normally distributed and homogenous,
the hypothesis tested using T-Test, meanwhile if the data normally distribution
but not homogeneous, the hyposthesis will be tested using T’-Test. In this
research, the data was normal and homogen, therefore the data was analyzed
using T-Test.
5. Mean Difference Test
Mean Difference Test was done to determine wheater both control group
and experimental group have the same mean score or not. According to Fay, M.
P.; & Proschan, M. A. (2010), if the data have normal distribution and
homogenous, the mean difference will be tested using T-Test (independent
sample test). While, if the data is not distributed normally but homogenous, the
data should be tested using T’-Test. And if the data are not normally distributed,
the data should be tested using Mann Whitney Test.
J. Research Procedure
The procedure or steps of the research are including the following
activities below:
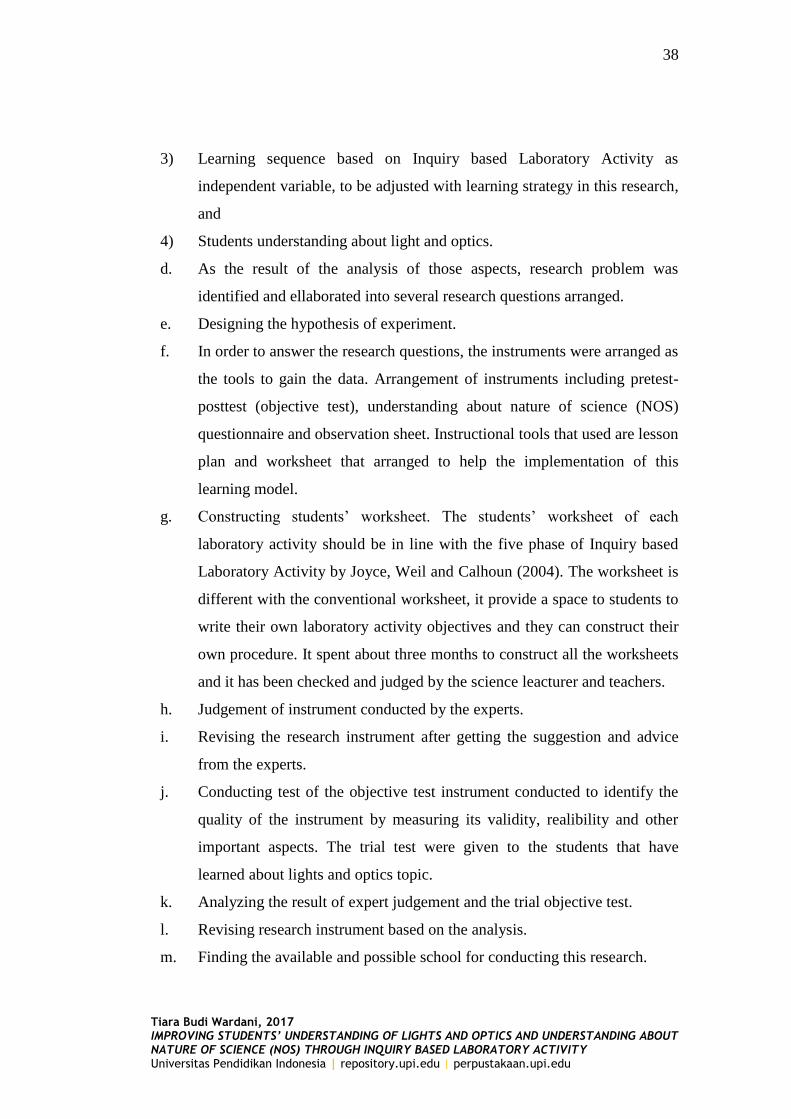
1. Preparation Stage
a. Investigating the problem and difficulties occured in teaching and learning
process.
b. Determining the specific topic to be investigated in this research.
c. Analyzing several aspects that strengthen the foundation of this research,
which are:
1) The curriculum that used in the school, to make sure that the topic that
investigated in this reseach is appropriate with the independent variable,
2) Learning model that considered as appropriate based on the literature
review conducted,
38
Tiara Budi Wardani, 2017 IMPROVING STUDENTS’ UNDERSTANDING OF LIGHTS AND OPTICS AND UNDERSTANDING ABOUT NATURE OF SCIENCE (NOS) THROUGH INQUIRY BASED LABORATORY ACTIVITY Universitas Pendidikan Indonesia | repository.upi.edu | perpustakaan.upi.edu
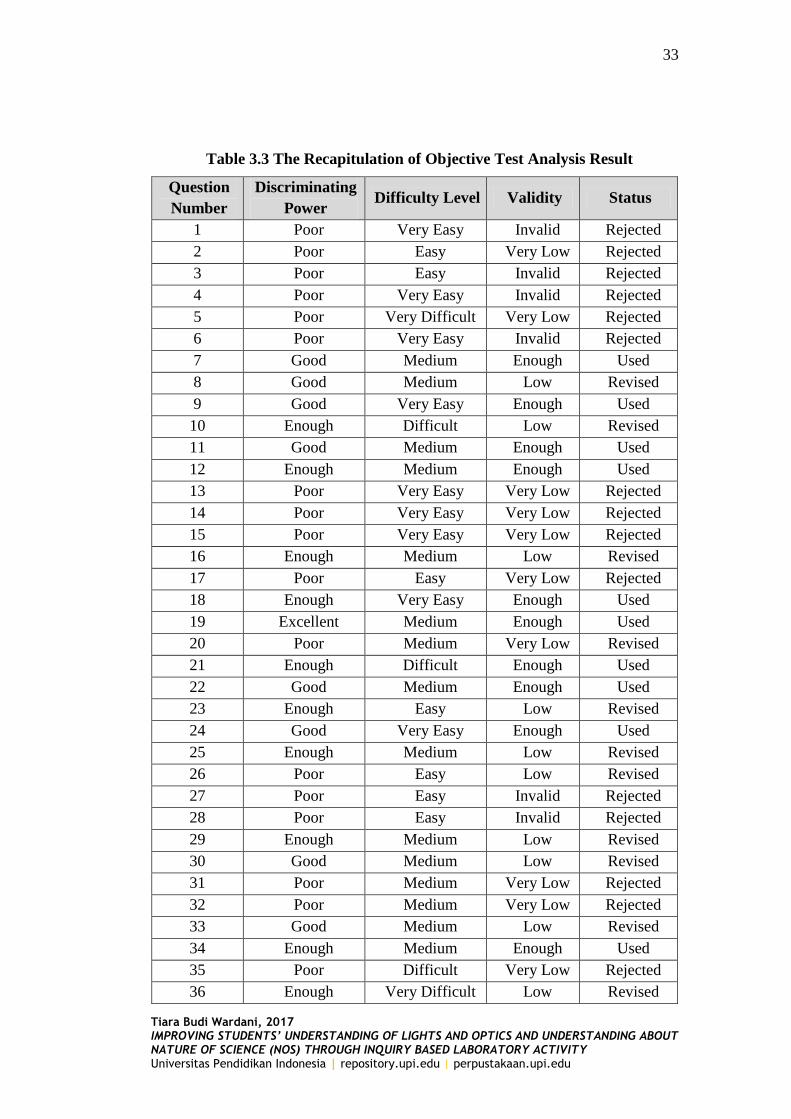
3) Learning sequence based on Inquiry based Laboratory Activity as
independent variable, to be adjusted with learning strategy in this research,
and
4) Students understanding about light and optics.
d. As the result of the analysis of those aspects, research problem was
identified and ellaborated into several research questions arranged.
e. Designing the hypothesis of experiment.
f. In order to answer the research questions, the instruments were arranged as
the tools to gain the data. Arrangement of instruments including pretest-
posttest (objective test), understanding about nature of science (NOS)
questionnaire and observation sheet. Instructional tools that used are lesson
plan and worksheet that arranged to help the implementation of this
learning model.
g. Constructing students’ worksheet. The students’ worksheet of each
laboratory activity should be in line with the five phase of Inquiry based
Laboratory Activity by Joyce, Weil and Calhoun (2004). The worksheet is
different with the conventional worksheet, it provide a space to students to
write their own laboratory activity objectives and they can construct their
own procedure. It spent about three months to construct all the worksheets
and it has been checked and judged by the science leacturer and teachers.
h. Judgement of instrument conducted by the experts.
i. Revising the research instrument after getting the suggestion and advice
from the experts.
j. Conducting test of the objective test instrument conducted to identify the
quality of the instrument by measuring its validity, realibility and other
important aspects. The trial test were given to the students that have
learned about lights and optics topic.
k. Analyzing the result of expert judgement and the trial objective test.
l. Revising research instrument based on the analysis.
m. Finding the available and possible school for conducting this research.

39
Tiara Budi Wardani, 2017 IMPROVING STUDENTS’ UNDERSTANDING OF LIGHTS AND OPTICS AND UNDERSTANDING ABOUT NATURE OF SCIENCE (NOS) THROUGH INQUIRY BASED LABORATORY ACTIVITY Universitas Pendidikan Indonesia | repository.upi.edu | perpustakaan.upi.edu
2. Implementation Stage
a. Conducting the pretest to identify students prior knowledge about the topic
which is lights and optics, and understanding about Nature of Science
(NOS).
b. Giving the treatment to both classes. The experimental class using Inquiry
based Laboratory Activity, while the control class using conventional
laboratory activity.
c. Implementation of Inquiry based Laboratory Activity
The implementation of Inquiry based Laboratory Activity was
conducted within 10 meetings, added by one meeting in the beginning to
give pretest and one meeting in the end to give posttest, so the total
meeting was 12 interfaces with students. This research was conducted in
one of Junior High School in Bandung on March to April 2017 with the
sample students from 8th Grade.
In implementing this teaching model, the observation was done in
order to check and make sure that the teacher’s and students’ activities
were already in line with the steps of Inquiry based Laboratory Activity.
The observation sheets were constructed by the researcher based on the
steps of Inquiry based Laboratory Activity based on Joyce, Weil and
Calhoun (2004).
The score of the observation then measured from the result of each
observer. There were only two categories, they are “yes” or “no”, if during
observation the observer found that the activity was done, then they have
to add a check list mark in “yes” category, then if the activity was undone,
they have to add a checklist mark in “no” category. The full format of
observation sheets can be accessed in the attachment. The summary of
observation sheets during the implementation of Inquiry based Laboratory
Activity is shown as below in the following Table 3.5.

40
Tiara Budi Wardani, 2017 IMPROVING STUDENTS’ UNDERSTANDING OF LIGHTS AND OPTICS AND UNDERSTANDING ABOUT NATURE OF SCIENCE (NOS) THROUGH INQUIRY BASED LABORATORY ACTIVITY Universitas Pendidikan Indonesia | repository.upi.edu | perpustakaan.upi.edu
Table 3.5 The Summary of Observation Sheets
Subtopics Steps/Phase of Inquiry
based Laboratory Activity
Observer
Score Category 1 2
T S T S
Light and its
properties
Confrontation with the
problem
100
All
activity
done
Data gathering
(Verification)
Data gathering
(Experimentation)
Organizing, formulating an
ezplanation
Analysis of the inquiry
process
Image formed
by mirror and
its
characteristics
Confrontation with the
problem
100
All
activity
done
Data gathering
(Verification)
Data gathering
(Experimentation)
Organizing, formulating an
ezplanation
Analysis of the inquiry
process
Image
formed by
lense and its
characteristics
Confrontation with the
problem
100 All
activity
done
Data gathering
(Verification)
Data gathering
(Experimentation)
Organizing, formulating an
ezplanation
Analysis of the inquiry
process
Human vision
Confrontation with the
problem
100 All
activity
done
Data gathering
(Verification)
Data gathering
(Experimentation)
Organizing, formulating an
ezplanation
Analysis of the inquiry
process
Optical
devices
Confrontation with the
problem
100 All
activity
done
Data gathering
(Verification)
Data gathering
(Experimentation)
Organizing, formulating an
ezplanation

41
Tiara Budi Wardani, 2017 IMPROVING STUDENTS’ UNDERSTANDING OF LIGHTS AND OPTICS AND UNDERSTANDING ABOUT NATURE OF SCIENCE (NOS) THROUGH INQUIRY BASED LABORATORY ACTIVITY Universitas Pendidikan Indonesia | repository.upi.edu | perpustakaan.upi.edu
Subtopics Steps/Phase of Inquiry
based Laboratory Activity
Observer
Score Category 1 2
T S T S
Analysis of the inquiry
process
Based on the observation result that taken by two observers, the
implementation was done in line with Inquiry based Laboratory Activity, in all
meetings the activities were completely conducted. Below is the detail
explaination about the implementation of inquiry based laboratory activity.
1) Confrontation with the problem
In this phase, the researcher which acted as the teacher explain the
procedures of inquiry to the students it the experiment class. It is related to
what are their role and how they should learn. After they understood about
the inquiry procedures, then the researcher posed the problem related to the
subtopic of lights and optics. From this problem, the students are guided to
formulate a question to be investigated. Below are the problems confronted
to the students in each subtopic:
a) Lights properties: What do you feel and see if you were in a room
without any lamps? Can you see something?
b) Lights reflections: Does reflection only occur in mirror? How about the
wall or the bed, can it relect the light?
c) Image formations in mirror: What happend when you are stand up in
front of a mirror? Do you see yourself in the same size and same
directions?
d) Image formations in lense: Have you ever see the rearview mirror?
e) Human vision: Why the people who suffer myopia have to use the
concave lense (-)?
2) Data Gathering (Verification)
After the question formulated, the students are asked to obtained
information regarding their questions. The researcher allowed the students
to search the information from any source such as internet, book, and etc.
The summary of the information should be written on the students’

42
Tiara Budi Wardani, 2017 IMPROVING STUDENTS’ UNDERSTANDING OF LIGHTS AND OPTICS AND UNDERSTANDING ABOUT NATURE OF SCIENCE (NOS) THROUGH INQUIRY BASED LABORATORY ACTIVITY Universitas Pendidikan Indonesia | repository.upi.edu | perpustakaan.upi.edu
worksheet. The worksheet used in this research was available in the
attachment.
3) Data gathering (Experimentation)
The students are guided by the teacher to prove or to find the answer of their
question through doing experiment or laboratory activity. The students are
engaged to prepare and plan their own experiment.
4) Organizing, formulating an ezplanation
When the experiment has been conducted, the students are asked to observe
the result and then guided by the researcher to construct the conclusion of
the experiment and try to formulate the answer of their question.
5) Analysis of the inquiry process
The researcher evaluated the learning process by giving sevaral related
question in order to check their understanding. And the researcher also gave
clarification regarding the learning activity.
d. Conducting the posttest to measure the effect of Inquiry based Laboratory
Activity.
e. Making a recapitulation from data gained to be analyzed and processed in
the next stage.
3. Completion Stage
a. Analyzing the data obtained in accordance with the instrument used for
each variable that measured and interpreting the data gained.
b. Arranging the discussion regarding the result of data analysis.
c. Constructing the conclusion based on the result.
43
Tiara Budi Wardani, 2017 IMPROVING STUDENTS’ UNDERSTANDING OF LIGHTS AND OPTICS AND UNDERSTANDING ABOUT NATURE OF SCIENCE (NOS) THROUGH INQUIRY BASED LABORATORY ACTIVITY Universitas Pendidikan Indonesia | repository.upi.edu | perpustakaan.upi.edu
Figure 3.1 The Flowchart of Research Procedure
Literature
review about
experiment
based learning
Literature review
about students’
understandings
about nature of
science (NOS)
Literature
review about
conceptual
mastery
Literature
review about
light and optics
Designing instruments
Revised
Valid
Test and validation Preparation
Stage
Implementation
Stage
Conducting the research
Experimental Group
Conducting the pretest
Giving Inquiry based
Laboratory Activity treatment
Conducting the posttest
Compliting the
reseach paper
Process and analysis
the data
Result and
conclusion
Collect research data
Invalid
Completion
Stage
Control Group
Conducting the pretest
Giving non Inquiry based
Laboratory Activity treatment
Conducting the posttest
Top Related