


Languages
Pages
Legal


50
CHAPTER III
DETERMINANTS OF SHARE PRICES: EVIDENCE FROM INDIA*
3.1 INTRODUCTION
Investment in equity shares is one of the major avenues of investment that yields
considerable returns to investors. It is also a source of finance for the capital
requirements of firms. Returns from such equity investments are subject to vary
owing to the movement of share prices, which depend on various factors. Such
factors that influence share prices could be either firm specific internal factors such
as earnings, dividend, book value, etc. or external factors such as interest rate,
government regulations, foreign exchange rate, etc.
Having knowledge of such factors and their possible impact on share prices is highly
appreciable on the part of both firms and investors. Since share prices convey
information to the outside world about the current and future performance of firms, it
is imperative for the managers of the firms to pay due attention to the factors that
influence share prices. This would help them to enhance their firm value in the
market. Consideration of such factors by investors is also warranted while investing
their funds, since this would aid them in making wise investment decisions and
invest in stocks that yield good profits.
* A paper based on this chapter is published in Journal of Emerging Trends in Economics and
Management Sciences (Nirmala et al., 2011).

51
A number of factors have been identified as share price determinants by the extant
studies conducted on different markets. The pioneering work on determinants of
share prices by Collins (1957) for US banks identified dividend, net profit, operating
earnings and book value as the factors influencing share prices. Following Collins
(1957), there have been various attempts to identify the determinants of share prices
for different markets.
Karathanassis & Philippas (1988) for banks listed on Athens stock exchange found
dividends, retained earnings and size to exert a significant positive influence on
share prices. Midani (1991) studied the factors that influence share prices in the
Kuwait stock market. The study pointed out earnings and financial leverage as the
major determinants of share prices. Later, Irfan & Nishat (2002) investigated the
effect of fundamental factors on share prices of the firms listed on Karachi Stock
Exchange and identified dividend yield, leverage, payout ratio and size as factors
influencing share prices.
For a sample of Nepalese firms, Pradhan (2003) report that dividend significantly
influence share prices. Al-Tamimi (2007) attempted to identify the factors that
influence the stock prices in the United Arab Emirates financial market. The study
found earnings of firms to have a significant and positive influence on share prices.
The variables earnings and book value per share are reported as significant share
price determinants by AL-Omar & AL-Mutairi (2008) for Kuwaiti commercial
banks. Khan (2009) studied share price determinants for the firms listed on Dhaka
Stock Exchange and found dividend as a factor influencing share prices. By

52
examining the stocks of firms listed on the Nigerian Stock Exchange, Somoye et al.
(2009) identified earnings, gross domestic product, lending interest rate and foreign
exchange rate to be the major factors influencing share prices.
Sunde & Sanderson (2009) for Zimbabwe market undertook a review to identify the
factors that influence share prices. The study reports corporate earnings,
management, lawsuits, mergers and takeovers, market liquidity and stability,
availability of substitutes, Government policy, macroeconomic fundamentals,
investor sentiments, technical influences and analyst reports as factors influencing
share prices.
Uddin (2009) analysed the effect of certain microeconomic factors on the share
prices of bank, leasing and insurance companies listed on Dhaka Stock Exchange.
The study found dividend, earnings and net asset value per share to bear a significant
relation with share prices.
The above discussed studies have been conducted for the foreign markets.
Specifically, in the Indian market, a number of studies are available that have
attempted to identify the factors that influence the share prices. The pioneering study
is by Srivastava (1968) that studied the effect of retained earnings on share prices.
The study report that retained earnings has no significant influence on share prices.
In a later study, Bhole (1980) found earnings to be a significant factor influencing
share prices.

53
Zahir & Khanna (1982) show that share prices of private sector firms are
significantly influenced by dividend and yield. Krishan (1984) examined the share
prices of general engineering industry and cotton textiles industry. The study found
that, in both the industries, book value per share and dividend are significant factors
that determine share prices. In the case of cotton textiles industry, yield was also
observed to be significantly influencing share prices.
For the chemical industry, Chawla & Srinivasan (1987) examined the relation
between share prices, dividend and retained earnings. Both dividend and retained
earnings were found to be significant determinants of share price. Zahir (1992)
report dividend, earnings and yield as factors influencing prices of both more volatile
and less volatile shares. Further, the study point out that security price index is a
significant price determinant of more volatile shares.
In an attempt to identify the share price determinants for the cement industry,
Malakar & Gupta (1999, 2002) found dividend to be a significant determinant of
share price. In a subsequent study by Sen & Ray (2003), dividend pay out ratio and
earnings emerged as significant determinants of share prices of BSE Sensex firms.
By examining share prices of the firms listed on the Bombay Stock Exchange, Mehta
& Turan (2005) identified market capitalisation, market price to book value ratio and
price-earning ratio as major factors influencing share prices.
Sharma & Singh (2006) studied the effect of fundamental factors on the equity prices
of manufacturing firms listed on Bombay Stock Exchange. The study found book

54
value, earnings and price-earning ratio as significant share price determinants in
engineering industry; book value and size in cotton textile industry; price-earning
ratio and return on capital employed in chemical industry; dividend, earnings and
price-earning ratio in electrical industry; and book value per share, payout and price-
earning ratio in miscellaneous industry.
Singhania (2006) for manufacturing firms reported book value, dividend, dividend
cover, dividend yield, earnings and price-earning ratio as significant share price
determinants. Azhagaiah & Priya (2008) investigated the effect of dividend on share
prices of organic and inorganic chemical companies. The study reported that
dividend has significant influence on share prices in organic chemical companies and
no influence in inorganic chemical companies.
For the chemical industry, Singhania (2008) identified book value, dividend,
dividend cover, dividend yield, earnings and price-earning ratio as major factors
influencing share prices. Bapat & Raithatha (2009), for manufacturing firms, found
profit, size of firm and volatility as significant determinants of share prices.
A review of the available literature on share price determinants indicates that most of
the studies have used either time-series or cross-section data. There have also been
attempts to identify the share price determinants using panel data. However, such
studies have applied the conventional regression analysis and examined whether the
data fits into fixed effect or random effect model. These exercises ignore the time
series properties of the data and hence, it is likely that the results generated might be
suffering from spurious relationship.
55
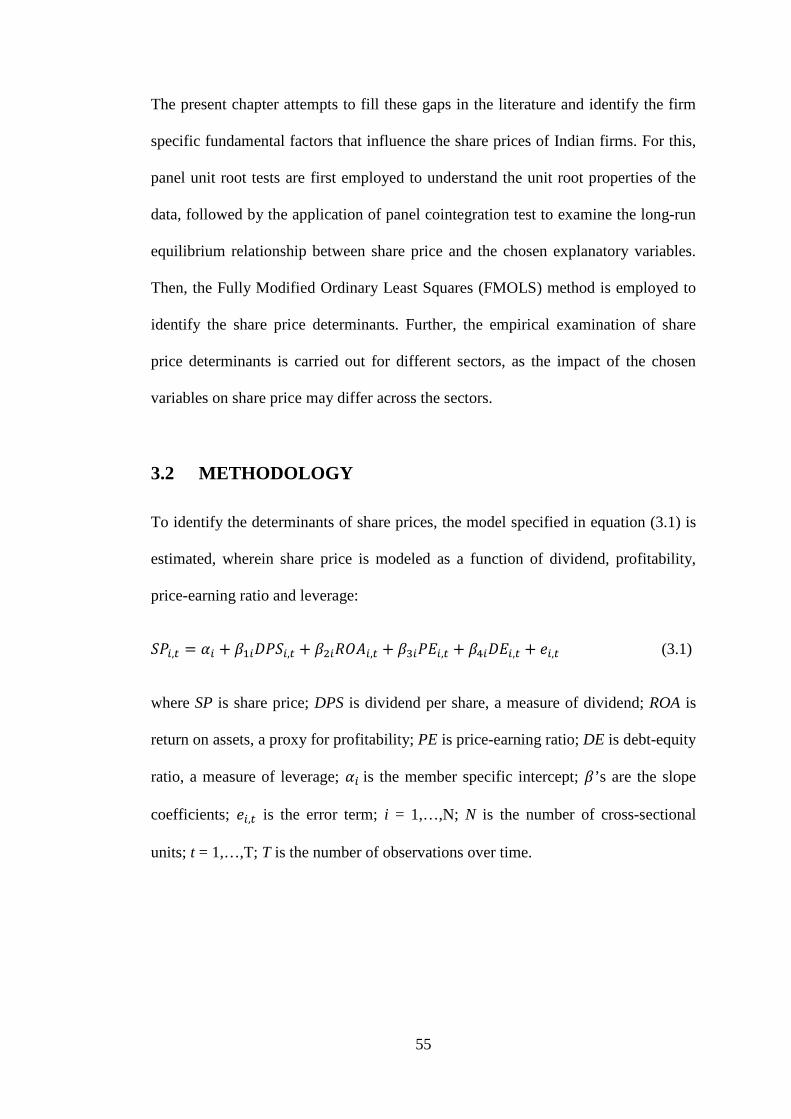
The present chapter attempts to fill these gaps in the literature and identify the firm
specific fundamental factors that influence the share prices of Indian firms. For this,
panel unit root tests are first employed to understand the unit root properties of the
data, followed by the application of panel cointegration test to examine the long-run
equilibrium relationship between share price and the chosen explanatory variables.
Then, the Fully Modified Ordinary Least Squares (FMOLS) method is employed to
identify the share price determinants. Further, the empirical examination of share
price determinants is carried out for different sectors, as the impact of the chosen
variables on share price may differ across the sectors.
3.2 METHODOLOGY
To identify the determinants of share prices, the model specified in equation (3.1) is
estimated, wherein share price is modeled as a function of dividend, profitability,
price-earning ratio and leverage:
���,� = �� + �������,� + �����,� + ������,� + ������,� + ��,� (3.1)
where SP is share price; DPS is dividend per share, a measure of dividend; ROA is
return on assets, a proxy for profitability; PE is price-earning ratio; DE is debt-equity
ratio, a measure of leverage; �� is the member specific intercept; �’s are the slope
coefficients; ��,� is the error term; i = 1,…,N; N is the number of cross-sectional
units; t = 1,…,T; T is the number of observations over time.

56
The empirical investigation starts with the assessment of the unit root properties of
the variables specified in equation (3.1), followed by the test of cointegration
between the variables. Finally, the model given in equation (3.1) is estimated using
FMOLS method.
3.2.1 PANEL UNIT ROOT TEST
The panel unit root tests, viz., Fisher-ADF and Fisher-PP tests7 proposed by Maddala
& Wu (1999) are employed to test the unit root properties of the variables share
price, dividend per share, return on assets, price-earning ratio and debt-equity ratio.
3.2.2 PANEL COINTEGRATION TEST
To test for cointegration between the variables share price, dividend per share, return
on assets, price-earning ratio and debt-equity ratio, the panel cointegration test
proposed by Pedroni (1999, 2004)8 is used.
3.2.3 FULLY MODIFIED ORDINARY LEAST SQUARES METHOD
In order to identify the factors that influence the share prices, the model specified in
equation (3.1) is estimated by using the fully modified ordinary least squares
method9 proposed by Pedroni (2000). The null hypothesis being tested is that the
chosen explanatory variable has no influence on share price.
7 These tests are discussed in section 2.2.1 of chapter II.
8 Details of this test are provided in section 2.2.2 of chapter II.
9 FMOLS method is discussed in section 2.2.3 of chapter II.

57
3.3 EMPIRICAL RESULTS
The empirical investigation of share price determinants is carried out using panel
data consisting of annual time series data over the period 2000-2009 and cross-
section data pertaining to three sectors, viz., auto, healthcare and PSU. As initial
sample, the various BSE sectoral indices were considered. Out of this, the final data
sample is constructed such that there are a minimum of 9 firms in each sector with
continuous data on the selected variables over the sample period. This screening
yielded a final sample of three sectors and the details of the final sample10 are given
in table 3.1. Data on all the selected variables is obtained from Prowess database of
Centre for Monitoring Indian Economy (CMIE).
Table 3.1: Details of Final Sample
S. No. Sector No. of firms
1 Auto 09
2 Healthcare 09
3 PSU 19
Note: PSU – Public Sector Undertaking
As a measure of the dependent variable share price, average of yearly high and low
prices of the share, deflated by the wholesale price index is used. Further, the face
value of the shares is not the same; it differs from one firm to the other. Hence, the
face value of each share is taken as ` 10 and share prices are adjusted accordingly.
10 List of sample firms under each sector is provided in Appendix III-A.

58
A number of firm specific fundamental factors have been identified as share price
determinants by the prior studies carried out for different markets. Of these, four
predominant factors, viz., dividend, profitability, price-earning ratio and leverage,
are taken up as possible determinants of share prices and their effect on share prices
is being assessed in this chapter. These variables are summarised in table 3.2.
Following is a discussion of each of these explanatory variables and their expected
relation with share price.
Dividend
A portion of firm’s profit is distributed to the shareholders as dividend. Dividend is
the return that shareholders receive on their shareholdings and is a source of regular
income for the investors. Dividend seeking investors who prefer current income in
the form of dividend to capital appreciation would favour stocks that pay out higher
dividends. Their preference for higher dividend paying stocks result in greater
demand for such stocks, thereby enhancing their market price. Dividend is therefore
expected to be positively related to share prices. As a surrogate for dividend,
dividend per share (DPS) computed as annual dividend amount paid to equity
shareholders upon number of equity shares outstanding is used. Dividend per share
so computed is deflated by the wholesale price index and is adjusted for the varying
face value of the shares.
59
Profitability
One of the important criteria that is used to assess a firm’s financial performance is
the profitability of the firm. The profit that is left over with a firm after paying tax
and preference dividend is the earnings available to the equity shareholders of the
firm, and firms utilize these earnings to distribute dividends to shareholders. Higher
the profit after tax, higher is the earnings available to the equity shareholders and
hence, higher is the scope for increased dividend payouts. The higher dividend
payouts would in turn enhance the market price of the firm’s share and this way, a
positive relationship is expected to exist between share price and profitability. To
examine the influence of profitability on share prices, return on assets (ROA) i.e. the
ratio of profit after tax to total assets is used.
Price-Earning ratio
Another major firm specific fundamental variable that could influence the share
prices is the price-earning ratio (PE). Price-earning ratio indicates the price that
investors are willing to pay for the net profit per share earned by the firm. It is
computed as market price per equity share upon earnings per share of the firm. It
reflects the market expectations about the firm’s future performance; a high PE ratio
suggests that investors are expecting the firm to have higher earnings in the future
and are willing to pay more for the shares of such firms. This way, price-earning
ratio is expected to have a positive relationship with share price.
Leverage
Leverage, measured as debt-equity ratio (DE), indicates the relative proportion of
equity and debt that a firm is using to finance its assets. It is a measure of how much

60
a firm is relying on debt. Since raising capital via debt involves periodic interest
payments on part of firms, increased use of debt by a firm would result in higher
interest payments by the firm. This would in turn lower the earnings that is available
to the equity shareholders of the firm and hence, investors generally prefer firms that
have lower debt content in their capital structure. This way a negative relation
between share price and leverage is hypothesized.
61
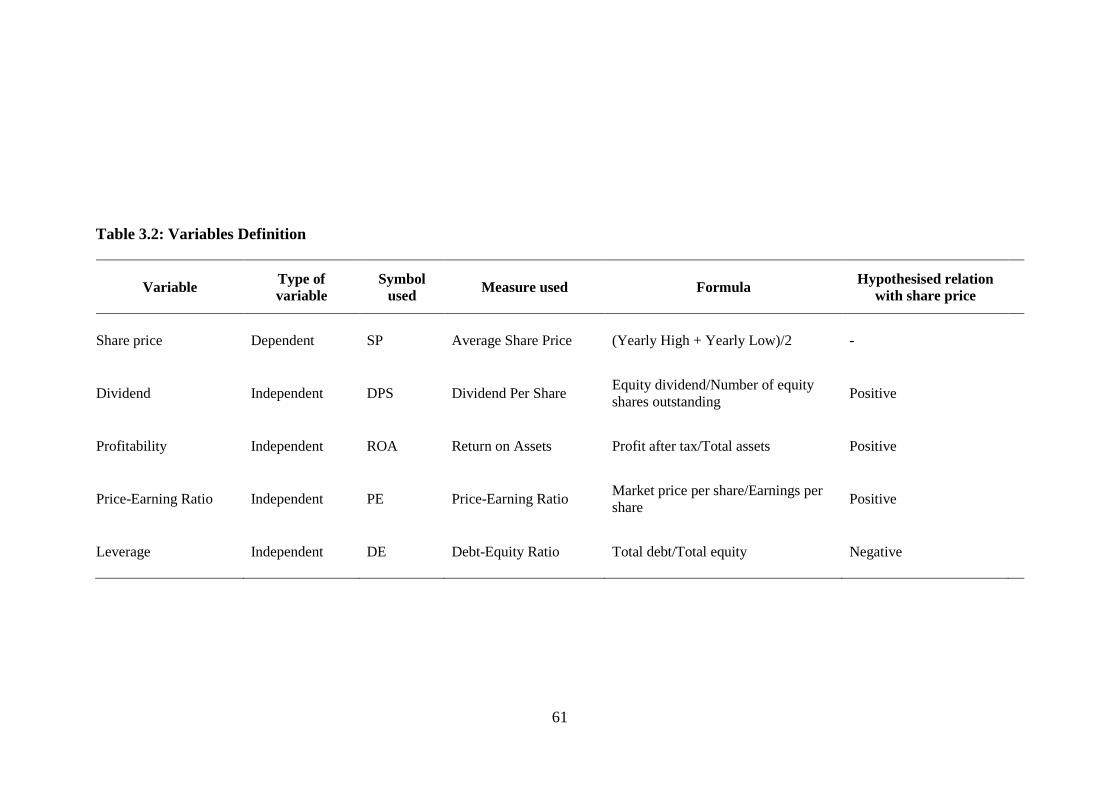
Table 3.2: Variables Definition
Variable Type of variable
Symbol used Measure used Formula Hypothesised relation
with share price
Share price Dependent SP Average Share Price (Yearly High + Yearly Low)/2 -
Dividend Independent DPS Dividend Per Share Equity dividend/Number of equity shares outstanding
Positive
Profitability Independent ROA Return on Assets Profit after tax/Total assets Positive
Price-Earning Ratio Independent PE Price-Earning Ratio Market price per share/Earnings per share
Positive
Leverage Independent DE Debt-Equity Ratio Total debt/Total equity Negative

62
3.3.1 CORRELATION MATRIX
As a first step, the correlation between the explanatory variables is checked to ensure
that there is no multicollinearity problem. The correlation matrix for the chosen
explanatory variables pertaining to each of the sectors under consideration is
reported in tables 3.3 to 3.5. From the results reported in these tables, it is found that
there is no multicollinearity problem.
Table 3.3: Correlation Matrix for Auto Sector
DPS ROA PE DE
DPS 1.0000
ROA 0.3024 1.0000
PE 0.1023 0.2892 1.0000
DE -0.3901 -0.4750 -0.1075 1.0000
Note: DPS – Dividend per Share; ROA – Return on Assets; PE – Price-Earning ratio; DE – Debt-Equity Ratio
Table 3.4: Correlation Matrix for Healthcare Sector
DPS ROA PE DE
DPS 1.0000
ROA 0.4860 1.0000
PE 0.1688 -0.1260 1.0000
DE -0.4355 -0.4938 -0.2967 1.0000
Note: DPS – Dividend per Share; ROA – Return on Assets; PE – Price-Earning ratio; DE – Debt-Equity Ratio

63
Table 3.5: Correlation Matrix for PSU Sector
DPS ROA PE DE
DPS 1.0000
ROA 0.3105 1.0000
PE 0.0074 0.1286 1.0000
DE -0.2659 -0.4482 -0.2147 1.0000
Note: DPS – Dividend per Share; ROA – Return on Assets; PE – Price-Earning ratio; DE – Debt-Equity Ratio; PSU – Public Sector Undertaking
3.3.2 PANEL UNIT ROOT TEST RESULTS
The results of panel unit root tests11 for the variables share price, dividend per share,
return on assets, price-earning ratio and debt-equity ratio, both in level and first
difference, for each of the sectors under consideration are reported in tables 3.6-3.10.
Table 3.6 presents the results of panel unit root tests for share price. Both Fisher-
ADF and Fisher-PP tests, for each of the sectors under consideration, fail to reject
the null hypothesis that share price in level is nonstationary; hence, share price is
tested for stationarity in first difference. The null is rejected by both the tests, for all
the chosen sectors, implying that share prices become stationary upon first
differencing. These findings imply that, for all the sectors under consideration, the
variable share price follows an I(1) process.
11 The panel unit root tests have been carried out in Eviews.

64
Table 3.6: Panel Unit Root Test Results for Share Price
Null hypothesis (H0): Share price series has unit root
Sector Share Price in Level Share Price in First Difference
Fisher-ADF test Fisher-PP test Fisher-ADF test Fisher-PP test
Auto 19.81 (0.34) 11.01 (0.89) 41.87 (0.00) 46.96 (0.00)
Healthcare 20.14 (0.33) 19.72 (0.35) 76.93 (0.00) 79.19 (0.00)
PSU 18.19 (1.00) 20.31 (0.99) 109.94 (0.00) 163.06 (0.00)
Note: Numbers in (#) are p-values; PSU – Public Sector Undertaking

65
The results of panel unit root tests for dividend per share (DPS) in level and first
difference are reported in table 3.7. The results of both Fisher-ADF and Fisher-PP
tests indicate that, for all the sectors under consideration, dividend per share in level
is nonstationary. When tested for stationarity in first difference, the null hypothesis
that dividend per share in first difference is nonstationary is rejected, for each of the
sectors under consideration. Therefore, for all the chosen sectors, dividend per share
in first difference is stationary; DPS thus follows an I(1) process.
Table 3.8 presents unit root test results for return on assets (ROA). For all the chosen
sectors, both the Fisher-ADF and Fisher-PP tests fail to reject the null hypothesis
that ROA in level is nonstationary. In first difference form, return on assets is found
to be stationary in each of the chosen sectors. Thus, the data pertaining to the
variable return on assets, follows an I(1) process for all the sectors under
consideration.
The results of unit root tests for price-earning (PE) ratio in level and first difference
are presented in table 3.9. The results of both Fisher-ADF and Fisher-PP tests, for all
the chosen sectors, fail to reject the null hypothesis that price-earning ratio in level is
nonstationary; PE ratio is thus nonstationary in level. Hence, it is tested for
stationarity in first difference. For all the sectors under consideration, the tests reject
the null of unit root, indicating that PE ratio in first difference is stationary. Thus, for
all the sectors under consideration, PE ratio follows an I(1) process.

66
Table 3.7: Panel Unit Root Test Results for Dividend Per Share
Null hypothesis (H0): Dividend per share series has unit root
Sector Dividend Per Share in Level Dividend Per Share in First Difference
Fisher-ADF test Fisher-PP test Fisher-ADF test Fisher-PP test
Auto 29.24 (0.08) 21.99 (0.23) 60.19 (0.00) 59.99 (0.00)
Healthcare 9.95 (0.93) 8.85 (0.96) 72.57 (0.00) 91.54 (0.00)
PSU 30.37 (0.81) 28.55 (0.87) 186.16 (0.00) 210.17 (0.00)
Note: Numbers in (#) are p-values; PSU – Public Sector Undertaking

67
Table 3.8: Panel Unit Root Test Results for Return on Assets
Null hypothesis (H0): Return on assets series has unit root
Sector Return on Assets in Level Return on Assets in First Difference
Fisher-ADF test Fisher-PP test Fisher-ADF test Fisher-PP test
Auto 19.52 (0.36) 14.83 (0.67) 61.94 (0.00) 73.21 (0.00)
Healthcare 27.53 (0.07) 28.17 (0.06) 115.96 (0.00) 127.50 (0.00)
PSU 37.00 (0.52) 36.81 (0.52) 192.82 (0.00) 201.79 (0.00)
Note: Numbers in (#) are p-values; PSU – Public Sector Undertaking

68
Table 3.9: Panel Unit Root Test Results for Price-Earning Ratio
Null hypothesis (H0): Price-Earning ratio series has unit root
Sector Price-Earning Ratio in Level Price-Earning Ratio in First Difference
Fisher-ADF test Fisher-PP test Fisher-ADF test Fisher-PP test
Auto 12.56 (0.82) 22.08 (0.23) 106.98 (0.00) 119.24 (0.00)
Healthcare 25.80 (0.10) 25.35 (0.12) 82.90 (0.00) 93.06 (0.00)
PSU 33.18 (0.69) 43.57 (0.25) 227.83 (0.00) 245.75 (0.00)
Note: Numbers in (#) are p-values; PSU – Public Sector Undertaking

69
Table 3.10: Panel Unit Root Test Results for Debt-Equity Ratio
Null hypothesis (H0): Debt-Equity ratio series has unit root
Sector Debt-Equity Ratio in Level Debt-Equity Ratio in First Difference
Fisher-ADF test Fisher-PP test Fisher-ADF test Fisher-PP test
Auto 23.66 (0.17) 28.80 (0.08) 77.96 (0.00) 77.26 (0.00)
Healthcare 18.58 (0.29) 16.81 (0.40) 73.72 (0.00) 73.46 (0.00)
PSU 48.33 (0.12) 49.57 (0.10) 160.21 (0.00) 155.38 (0.00)
Note: Numbers in (#) are p-values; PSU – Public Sector Undertaking

70
Table 3.10 reports the unit root test results for debt-equity ratio (DE). For all the
chosen sectors, both the tests fail to reject the null hypothesis that DE ratio in level is
nonstationary. When tested for stationarity in first difference, DE ratio turned out to
be stationary for all the chosen sectors. Hence, DE ratio follows an I(1) process, for
all the sectors under consideration.
From the results of panel unit root tests, it is evident that, for all the chosen sectors,
the variables share price, dividend per share, return on assets, price-earning ratio and
debt-equity ratio are nonstationary in level and become stationary upon first
differencing. Since all these variables follow an I(1) process, the cointegration test is
carried out next to examine whether these variables are cointegrated or not.
3.3.3 PANEL COINTEGRATION TEST RESULTS
The results of panel cointegration test are reported in table 3.1112,13.
12 Panel-ADF and Group-ADF statistics have better small sample properties as compared to other
statistics (Lee & Chang, 2008). Of these two statistics, the group-ADF statistic allows potential
heterogeneity across individual members of the panel. Hence, the Group-ADF test statistic is
considered for the test of cointegration.
13 The panel cointegration test is performed in Eviews.

71
Table 3.11: Panel Cointegration Test Results
Null hypothesis (H0): No cointegration between the variables
Sector Group ADF test statistic
Auto -4.15 (0.00)
Healthcare -2.08 (0.02)
PSU -7.10 (0.00)
Note: Numbers in (#) are p-values; PSU – Public Sector Undertaking
From table 3.11, it is evident that, for all the sectors under consideration, the null
hypothesis that there is no cointegration between the variables is rejected. This
implies that the variables share price, dividend per share, return on assets, price-
earning ratio and debt-equity ratio are cointegrated i.e. a long-run equilibrium
relationship exists between the chosen variables. Since the variables are cointegrated,
FMOLS method is next employed to identify the share price determinants.
3.3.4 GROUP MEAN PANEL FMOLS RESULTS
To identify which of the explanatory variables influence share prices, the model
specified in equation (3.1) is estimated using FMOLS method, the results of which
are reported in table 3.1214.
14 The estimates are obtained using the RATS code provided by Peter Pedroni.

72
Table 3.12: Group Mean Panel FMOLS Results
Sector Slope Coefficients
�� �� �� ��
Auto 12.27
[11.17]
***
2.48
[-1.71]
*
6.36
[4.37]
***
-3.14
[-3.09]
***
Healthcare 64.62
[10.22]
***
5.95
[0.09]
6.14
[4.84]
***
-2.74
[-5.86]
***
PSU 25.58
[9.31]
***
-20.69
[-0.04]
9.55
[21.39]
***
-0.70
[-5.85]
***
Note: Numbers in [#] are t-values; PSU – Public Sector Undertaking; *** and * denote significance at 1% and 10% level respectively; β1, β2, β3 and β4 are the slope coefficients for DPS, ROA, PE and DE respectively
From the results of table 3.12, it is evident that the variable dividend per share is a
significant determinant of share price for all the sectors under consideration. As
expected, dividend per share is positively related to share price. This means that
share price would rise with an increase in dividend per share. This finding indicates
that investors attach more value to those firms that pay dividends. Current income in
the form of dividend is being preferred by investors and they are willing to buy such
stocks that pay high dividends.
Return on assets is found to significantly influence share prices in the case of Auto
sector. As expected, return on assets bear a positive relation with share price. For the
remaining two sectors, Healthcare and PSU, return on assets does not influence share
price. This finding implies that investors do not attach much importance to the
73
profitability of a firm. Instead, what matters to the investors more, is the portion of
earnings that is paid to them in the form of dividend.
The variable price earning ratio is found to be a significant determinant of share
price, for all the three sectors under consideration. It is found to be positively related
to share price, which is in accordance with the expected relation. This finding
indicates that, shares with higher PE ratio will be better valued in the market, as it
reflects investors’ expectations that the firm will have good prospects in the future.
Further, the results indicate that, for all the three sectors under consideration, debt-
equity ratio is a significant factor influencing share prices and it exerts a negative
relation with share price. This finding implies that as the debt content in the capital
structure of a firm decreases, its share price increase and vice versa. This indicates
that investors prefer firms with lower debt content, since increased use of debt by a
firm lowers the earnings available for equity shareholders and investors become
apprehensive about their returns.
In a nutshell, the FMOLS results reported in table 3.12 reveal that, the variables
dividend, price-earning ratio and leverage are significant determinants of share
prices for all the sectors under consideration. As expected, the variables dividend and
price-earning ratio bear a positive relation with share price, and leverage bears a
negative relation. Further, in the auto sector alone, profitability is found to be a
significant factor influencing share prices; in accordance with the expected relation,
profitability is found to be positively related to share price.

74
3.4 CONCLUSION
This chapter focused on identifying the firm specific fundamental factors that
influence the share prices of Indian firms. An understanding of such factors is
essential both for investors and firms; it would help investors to frame profitable
investment strategies and enable firms in enhancing their market value. A number of
studies have been conducted on share price determinants for the foreign as well as
Indian market. Most of these studies have examined the issue using either time series
or cross section data. Few have used panel data, but the results of such studies may
be spurious because of the methodological flaws committed by them.
Through the empirical investigation carried out in this chapter, an attempt has been
made to fill these gaps and identify the share price determinants in the Indian market.
To this end, panel data consisting of annual time series data over the period 2000-
2009 and cross section data pertaining to three sectors, viz., auto, healthcare and
PSU is used. As possible determinants of share prices, four firm-specific
fundamental variables, viz., dividend, profitability, price-earning ratio and leverage
are considered, and to identify which of these variables influence the share prices,
the fully modified ordinary least squares method of Pedroni (2000) is employed.
Prior to employing FMOLS, the unit root properties of the variables is examined by
using the panel unit root tests, viz., Fisher-ADF and Fisher-PP, and the test of
cointegration between the variables is carried out by employing the panel
cointegration test of Pedroni (1999).
The results of unit root tests indicate that all the variables, viz., share price, dividend,
profitability, price-earning ratio and leverage, are integrated of order one. From the

75
cointegration test, it is found that the variables bear a long-run equilibrium
relationship. The results of FMOLS method indicate that the variables dividend,
price-earning ratio and leverage are significant determinants of share prices for all
the sectors under consideration. While dividend and price-earning ratio bear a
positive relation with share price, leverage bears a negative relation. Further, in the
auto sector alone, profitability turned out to be a significant factor influencing share
prices and it is found to be positively related to share prices.
Top Related