


Languages
Pages
Legal


© 2007 – 2010, Cisco Systems, Inc. All rights reserved. Cisco PublicTSHOOT v6 Chapter 7
1
Chapter 7:Troubleshooting Network Performance Issues
CCNP TSHOOT: Maintaining and Troubleshooting IP Networks

Chapter 72© 2007 – 2010, Cisco Systems, Inc. All rights reserved. Cisco Public
Troubleshooting Network Applications Service
Chapter 73© 2007 – 2010, Cisco Systems, Inc. All rights reserved. Cisco Public
Cisco Application Networking Services (ANS) Overview A comprehensive portfolio of application networking solutions and
technologies. Enables successful and secure delivery of applications within data
centers to local, remote, and branch-office users. Uses technology to accelerate, secure, and increase availability of both
application traffic and computing resources. Unlike application delivery point products that are focused on specific IT
issues or places in the network. A portfolio of application networking platforms integrated into existing
devices throughout the network. Application-enabled networks includes:
• Application acceleration services such as Wide Area Application Services (WAAS)
• Server load balancing products such as Application Control Engine (ACE)• Monitoring and quality-of-service (QoS) mechanisms.

Chapter 74© 2007 – 2010, Cisco Systems, Inc. All rights reserved. Cisco Public
ANS Overview – Cont.The Main Categories of Application Services

Chapter 75© 2007 – 2010, Cisco Systems, Inc. All rights reserved. Cisco Public
ANS Optimization Cycle
4-step application optimization cycle and Cisco IOS technologies.
Chapter 76© 2007 – 2010, Cisco Systems, Inc. All rights reserved. Cisco Public
ANS Baselining and Application Optimization Tools Baselining and the establishment of acceptable network behavior
includes:• Understanding available bandwidth• Identifying a normal pattern of network behavior such as network delays
and what applications are running on the network• Understanding the behavior (and requirements) of each application on the
network• Measuring application response times
Cisco IOS baselining and application optimization tools:• NetFlow accounting• IP SLAs• Network-Based Application Recognition (NBAR) packet inspection• Server load balancing (SLB)• QoS and AutoQoS

Chapter 77© 2007 – 2010, Cisco Systems, Inc. All rights reserved. Cisco Public
NetFlow Overview Provides services for IP applications, including:
• Network traffic accounting• Usage-based network billing• Network planning• Security denial-of-service monitoring• Overall network monitoring
Cisco’s NetFlow is on the IETF standards track to become an industry-wide standard.
Netflow works by creating a NetFlow cache that will hold information for all active flows.

Chapter 78© 2007 – 2010, Cisco Systems, Inc. All rights reserved. Cisco Public
NetFlow Overview – Cont.A flow is a unidirectional stream of packets, between a given source and a destination, that have several components in common (seven key fields).
Chapter 79© 2007 – 2010, Cisco Systems, Inc. All rights reserved. Cisco Public
NetFlow Configuration
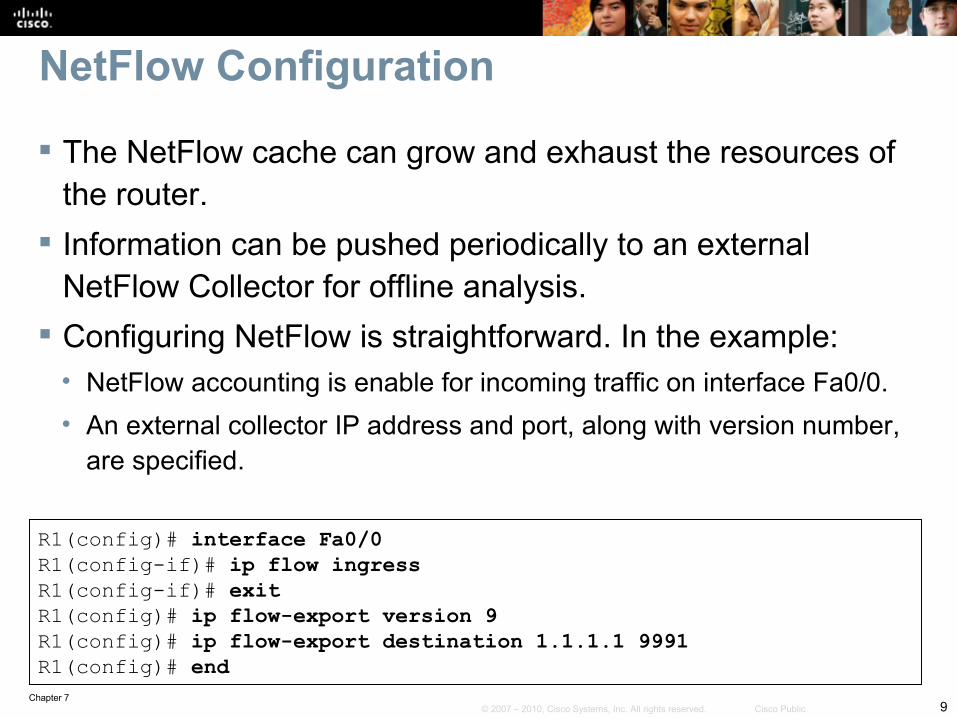
The NetFlow cache can grow and exhaust the resources of the router.
Information can be pushed periodically to an external NetFlow Collector for offline analysis.
Configuring NetFlow is straightforward. In the example:• NetFlow accounting is enable for incoming traffic on interface Fa0/0.• An external collector IP address and port, along with version number,
are specified.
R1(config)# interface Fa0/0R1(config-if)# ip flow ingressR1(config-if)# exitR1(config)# ip flow-export version 9R1(config)# ip flow-export destination 1.1.1.1 9991R1(config)# end

Chapter 710© 2007 – 2010, Cisco Systems, Inc. All rights reserved. Cisco Public
NetFlow Statistics ExampleR1# show ip cache flowIP packet size distribution (85435 total packets):! Packet Sizes 1-32 64 96 128 160 192 224 256 288 320 352 384 416 448 480 .000 .000 .000 .000 000 .000 .000 .000 .000 .000 .000 .000 .000 .000 .000 512 544 576 1024 1536 2048 2560 3072 3584 4096 4608 .000 .000 .000 .000 1.00 .000 .000 .000 .000 .000 .000 IP Flow Switching Cache, 278544 bytes ! Number of Active Flows 2728 active, 1638 inactive, 85310 added 463824 ager polls, 0 flow alloc failures Active flows timeout in 30 minutes Inactive flows timeout in 15 seconds last clearing of statistics never! Rates and DurationProtocol Total Flows Packets Bytes Packets Active (Sec) Idle (Sec)-------- Flows /Sec /Flow /Pkt /Sec /Flow /FlowTCP-X 2 0.0 1 1440 11.2 0.0 9.5TCP-other 82580 11.2 1 1440 11.2 0.0 12.0Total 82582 11.2 1 1440 11.2 0.0 12.0 ! Flow Details CacheSrcIF SrcIPaddress DstIf DstIPaddress Pr SrcP DstP PktsEt0/0 132.122.25.60 Se0/0 192.168.1.1 06 9AEE 0007 1Et0/0 139.57.220.28 Se0/0 192.168.1.1 06 708D 0007 1Et0/0 165.172.153.65 Se0/0 192.168.1.1 06 CB46 0007 1

Chapter 711© 2007 – 2010, Cisco Systems, Inc. All rights reserved. Cisco Public
Cisco IP SLA Overview The IP service level agreements, or IP SLA, is a Cisco IOS software
feature. Allows configuring a router to send synthetic (generated) traffic to a host
computer or router that has been configured to respond. One-way or return travel times and packet loss data are gathered. Jitter measurement data can be collected as well. The results of IP SLA operations can be tied to other features of the
router, and trigger action based on the results of the probe. Multiple IP SLA probes can be run at the same time and customize the
nature of the probe by selecting:• Ports• Traffic characteristics• Packet sizes• Frequency• Timeouts for the probe• Many other parameters.
Chapter 712© 2007 – 2010, Cisco Systems, Inc. All rights reserved. Cisco Public
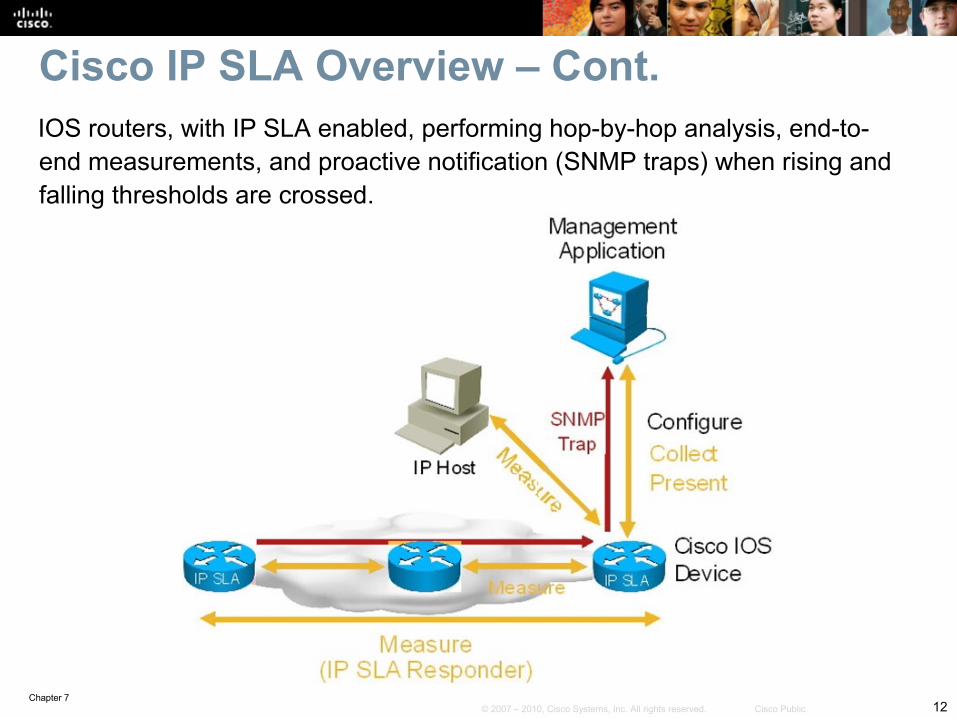
Cisco IP SLA Overview – Cont.IOS routers, with IP SLA enabled, performing hop-by-hop analysis, end-to-end measurements, and proactive notification (SNMP traps) when rising and falling thresholds are crossed.

Chapter 713© 2007 – 2010, Cisco Systems, Inc. All rights reserved. Cisco Public
Cisco IP SLA ConfigurationTo implement IP SLA network performance measurement, perform these tasks:Enable the IP SLA responder, if required. Configure the required IP SLA operation type. Configure options available for the specified operation type. Configure threshold conditions, if required. Schedule the operation to run, and then let the operation run for a period of time to gather statistics. Display and interpret the results of the operation using the CLI or a network management system (NMS), with SNMP.

Chapter 714© 2007 – 2010, Cisco Systems, Inc. All rights reserved. Cisco Public
Cisco IP SLA Configuration Example
Define the SLA monitor operation identifier as 1. In IP SLA configuration mode, define the type of operation (for
example: echo, ftp, path-jitter, etc). Configure a monitor operation of echo protocol ipIcmpEcho to address 10.32.130.2.
Define the frequency to be every 120 seconds Define the value of ToS to be 32. The IP SLA is configured to run forever, starting now.
R1(config)# ip sla monitor 1R1(config-sla-monitor)# type echo protocol ipIcmpEcho 10.32.130.2R1(config-sla-monitor-echo)# frequency 120 R1(config-sla-monitor-echo)# tos 32R1(config-sla-monitor-echo)# exit R1(config)# ip sla monitor schedule 1 start-time now life forever R1(config)# exit

Chapter 715© 2007 – 2010, Cisco Systems, Inc. All rights reserved. Cisco Public
Cisco IP SLA Responder A simple echo probe does not need a responder. If the echo
packet comes back, it means success. The Cisco IOS IP SLA Responder is a component
embedded in the destination Cisco routing device that allows the system to anticipate and respond to Cisco IOS IP SLA request packets.
The patented Cisco IOS IP SLA Control Protocol is used by the IOS IP SLA Responder. SLA CP provides a mechanism through which the responder can be notified and on which port it should listen and respond.
Only a Cisco IOS device can be a source for a destination IP SLA Responder.
Chapter 716© 2007 – 2010, Cisco Systems, Inc. All rights reserved. Cisco Public
Cisco IP SLA Responder (cont.)
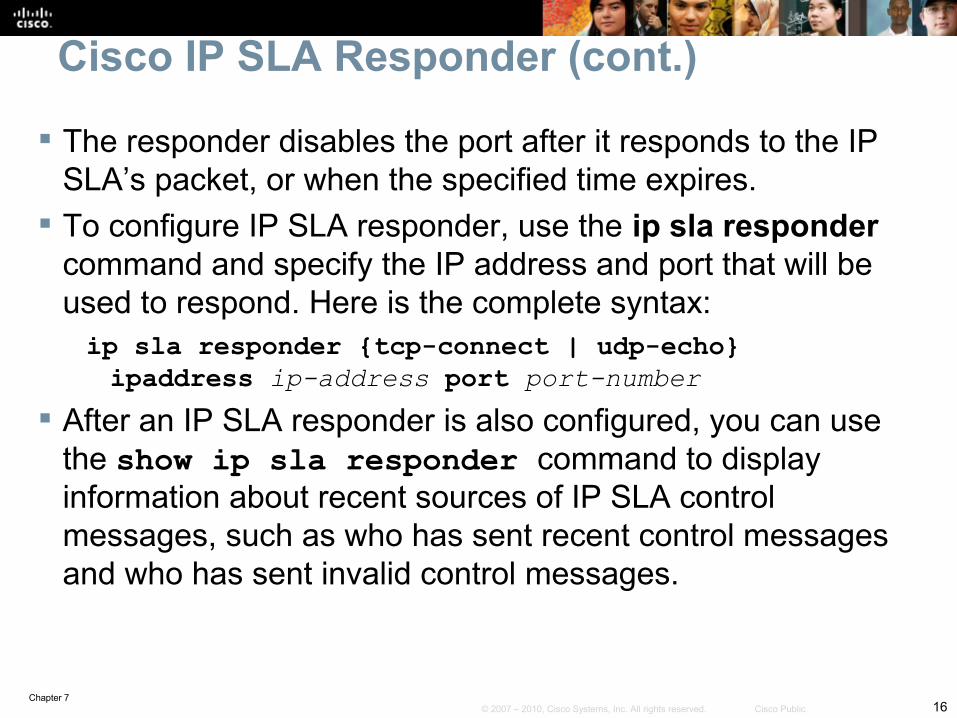
The responder disables the port after it responds to the IP SLA’s packet, or when the specified time expires.
To configure IP SLA responder, use the ip sla responder command and specify the IP address and port that will be used to respond. Here is the complete syntax:ip sla responder {tcp-connect | udp-echo} ipaddress ip-address port port-number
After an IP SLA responder is also configured, you can use the show ip sla responder command to display information about recent sources of IP SLA control messages, such as who has sent recent control messages and who has sent invalid control messages.

Chapter 717© 2007 – 2010, Cisco Systems, Inc. All rights reserved. Cisco Public
NBAR Overview NBAR is a baselining and traffic-classification tool. NBAR can recognize and classify a wide variety of
applications and protocols that use dynamic TCP/UDP port assignments.
If an application is recognized and classified by NBAR, the network can invoke services for that specific application.
NBAR can be used to ensure that network bandwidth is used efficiently by classifying packets, and then applying QoS to the classified traffic.
NBAR can also be used to identify malicious or unwanted traffic and block or filter it.
There is a long list of applications identified by NBAR.

Chapter 718© 2007 – 2010, Cisco Systems, Inc. All rights reserved. Cisco Public
NBAR Overview (cont.) The supported applications and protocols include those that
use static ports, those that use dynamic ports, and even the non-UDP and non-TCP-based ones.
Traditionally, routers were not able to recognize many applications by just inspecting the Layer 3 and Layer 4 headers.
NBAR performs deep packet inspection up to the application layer for traffic classification.
Because NBAR depends on CEF, It doesn't cause major performance degradation on routers.
Chapter 719© 2007 – 2010, Cisco Systems, Inc. All rights reserved. Cisco Public
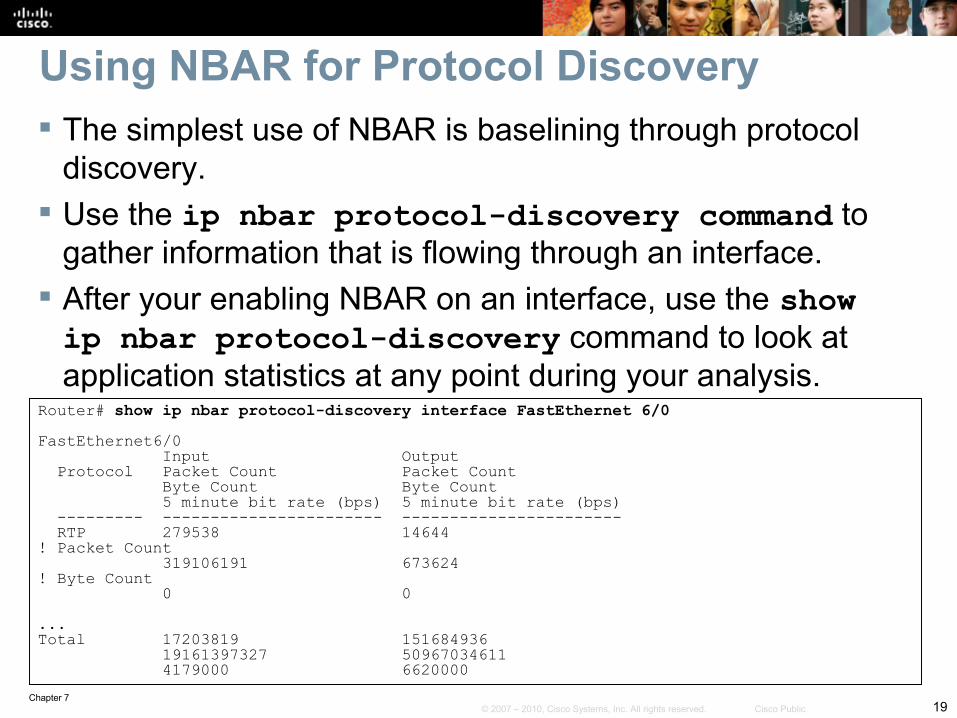
Using NBAR for Protocol Discovery The simplest use of NBAR is baselining through protocol
discovery. Use the ip nbar protocol-discovery command to
gather information that is flowing through an interface. After your enabling NBAR on an interface, use the show ip nbar protocol-discovery command to look at application statistics at any point during your analysis.
Router# show ip nbar protocol-discovery interface FastEthernet 6/0 FastEthernet6/0 Input Output Protocol Packet Count Packet Count Byte Count Byte Count 5 minute bit rate (bps) 5 minute bit rate (bps) --------- ----------------------- ----------------------- RTP 279538 14644! Packet Count 319106191 673624! Byte Count 0 0 ...Total 17203819 151684936 19161397327 50967034611 4179000 6620000

Chapter 720© 2007 – 2010, Cisco Systems, Inc. All rights reserved. Cisco Public
NBAR PDLMs Out of the box, NBAR can only classify packets of known
applications. Description Language Modules (PDLMs) can be
downloaded to match more protocols and applications. PDLMs contain the rules that are used by NBAR to
recognize an application and can bring new or changed functionality to NBAR.
You can load an external PDLM at run time to extend the NBAR list of recognized protocols.
You can download a PDLM from Cisco System’s web site into your router’s flash memory and load it using the command:ip nbar pdlm flash://pdlm-name.
Chapter 721© 2007 – 2010, Cisco Systems, Inc. All rights reserved. Cisco Public
SLB Overview The Cisco IOS server load balancing (SLB) feature allows
you to define a virtual server. The virtual server represents a cluster of real servers, a
server farm. When a client connects to the virtual server, the Cisco IOS
SLB load balances the connection to a real server based on the configured load-balance algorithm or predictor.
Clients initiate their connections to a virtual IP address, which is configured at the load balancer and represents the servers of the server farm.
This solution not only adds optimization by balancing the load across multiple servers, but it also provides scalability.

Chapter 722© 2007 – 2010, Cisco Systems, Inc. All rights reserved. Cisco Public
SLB Overview (cont.) If you need more capacity, you simply add more servers,
and the solution remains transparent to clients. If you need to remove a server or put it out of rotation for
maintenance purposes, you simply remove it from the server farm, and transparency is still maintained.
Clients will still point to the VIP, what happens inside the server farm is transparent to them.

Chapter 723© 2007 – 2010, Cisco Systems, Inc. All rights reserved. Cisco Public
SLB Overview – Cont.The SLB feature is a Cisco IOS-based solution that provides server load balancing. This allows the definition of a virtual server that represents a cluster of real servers, known as a server farm.

Chapter 724© 2007 – 2010, Cisco Systems, Inc. All rights reserved. Cisco Public
QoS and AutoQoS Overview Cisco QoS/AutoQoS traffic classification uses NBAR. Within the framework of QoS, each traffic class is treated
differently by the network Cisco AutoQoS is an automation tool for deploying QoS policies. For Cisco AutoQoS to work, routers must meet the following
requirements:• CEF must be enabled on the interface.• The interface (or subinterface) must have an IP address configured.• For serial interfaces (or subinterfaces), the appropriate bandwidth must
be configured.• On point-to-point serial interfaces, both sides must have AutoQos
configured.• The interface should not have any prior QoS configurations
Chapter 725© 2007 – 2010, Cisco Systems, Inc. All rights reserved. Cisco Public
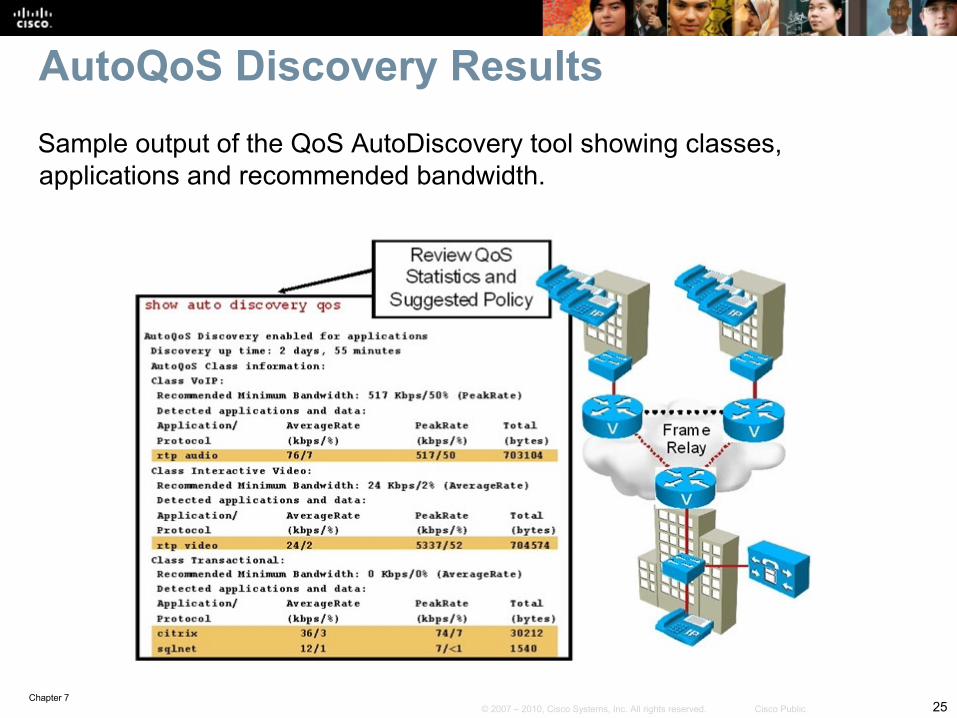
AutoQoS Discovery ResultsSample output of the QoS AutoDiscovery tool showing classes, applications and recommended bandwidth.
Chapter 726© 2007 – 2010, Cisco Systems, Inc. All rights reserved. Cisco Public
Common Issues with Network Application Services

Chapter 727© 2007 – 2010, Cisco Systems, Inc. All rights reserved. Cisco Public
Common NetFlow Issues Performance issues NetFlow may need tuning to prevent performance degradation in the
NetFlow-enabled device. Limits might need to be set for the number of entries in the cache, or the
NetFlow aging timers might need tuning. Export problems Typically configuration errors or reachability of the NetFlow Collector or
server. The following are some of the common NetFlow export issues:
• A destination IP address has not been configured.• A source interface has not been configured.• A source interface has been configured, but does not have an IPv4 address.• A source interface has been configured, but it is not in the up state.• The subnet of the destination is unreachable.

Chapter 728© 2007 – 2010, Cisco Systems, Inc. All rights reserved. Cisco Public
Common IP SLA Issues IP SLAs require readiness on the sender side, the responder
side, and the network. Issues related to performance are common because probes can
cause a burden on the device. Senders generally suffer more from the overscheduling and
frequency of probes. Probe scheduling can be problematic if the clock on the device is
out of sync; synchronizing through NTP is highly recommended. Network readiness is also essential. When using IP SLAs for troubleshooting, problems that prevents
an application from working on the network will prevent the probe from working.
Typically, it is the firewalls and access control mechanisms that filter or block traffic.

Chapter 729© 2007 – 2010, Cisco Systems, Inc. All rights reserved. Cisco Public
Common NBAR Issues NBAR is a traffic-classification mechanism based on application-layer
components. What can be done with the resulting traffic classes varies. For example, you can
apply a QoS mechanism to a traffic class or block traffic that matches a traffic class.
NBAR does not detect traffic that uses nonstandard ports. Check the current NBAR port map using the command show ip nbar port-map.
NBAR allows you to map any port you wish using the following command:ip nbar port-map protocol-name [tcp | udp] port-number
Another issue that affects most NBAR deployments is application support. Traffic going unnoticed by NBAR and not being classified will have important
security implications. The solution is to load a PDLM to upgrade the router NBAR application
definition. This is similar to upgrading antivirus software with a new virus definition file.

Chapter 730© 2007 – 2010, Cisco Systems, Inc. All rights reserved. Cisco Public
Common AutoQoS Issues Many Cisco AutoQoS issues relate directly to its requirements and limitations. The interface must be configured with an IP address and specific (proper) bandwidth
(serial bandwidth is not autosensed.) AutoQoS uses the configured interface bandwidth to enable or disable certain QoS
features such as compression and fragmentation. Another common AutoQoS problem cause is mismatched parameters on the two
sides of a serial link. (For example, configured bandwidths differ.) AutoQoS might enable certain features on one side while disabling them on the
other side of the same link, which can cause Layer 2 issues and bring the interface down.
Modifying the Cisco AutoQoS configuration after the feature has been enabled can cause orphaned commands.
Before you apply AutoQoS confirm that the interface has:• An IP address• Proper bandwidth configured• CEF enabled• No policies applied to it already

Chapter 731© 2007 – 2010, Cisco Systems, Inc. All rights reserved. Cisco Public
Network Application Service Troubleshooting CommandsNetwork Application Service
IOS Troubleshooting Command
NetFlow show ip cache flowshow ip flow exportshow ip flow interfacedebug ip flow export
IP SLA show ip sla monitor statisticsshow ip sla monitor collection-statisticsshow ip sla monitor configurationdebug ip sla monitor trace
NBAR show ip nbar port-mapshow ip nbar protocol-discoverydebug ip nbar unclassified-port-stats
AutoQoS show auto qos interfaceshow auto discovery qos
Chapter 732© 2007 – 2010, Cisco Systems, Inc. All rights reserved. Cisco Public
NetFlow Troubleshooting Example
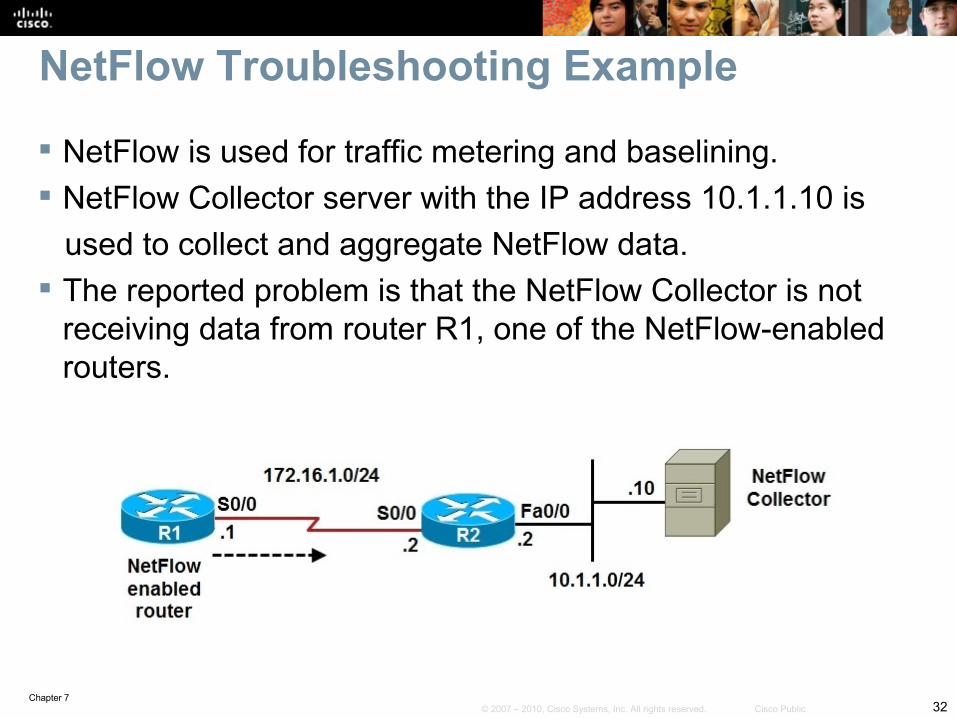
NetFlow is used for traffic metering and baselining. NetFlow Collector server with the IP address 10.1.1.10 is used to collect and aggregate NetFlow data. The reported problem is that the NetFlow Collector is not
receiving data from router R1, one of the NetFlow-enabled routers.

Chapter 733© 2007 – 2010, Cisco Systems, Inc. All rights reserved. Cisco Public
NetFlow Troubleshooting Example – Cont.
Start by testing connectivity between R1 and the NetFlow Collector and checking the NetFlow-specific configuration (to verify the configured parameters).
Using the ping command, you can confirm IP connectivity between R1 and NetFlow Collector
It is discovered that the NetFlow Collector’s address is 10.1.1.10 and the NetFlow port number is 9991.
The show ip flow interface command verifies that on router R1, NetFlow is active on interface serial 0/0 for ingress traffic.

Chapter 734© 2007 – 2010, Cisco Systems, Inc. All rights reserved. Cisco Public
R1# show ip cache flowIP packet size distribution 1-32 64 96 128 160 192 224 256 288 320 352 384 416 448 480 .000 .687 .000 .312 .000 .000 .000 .000 .000 .000 .000 .000 .000 .000 .000 512 544 576 1024 1536 2048 2560 3072 3584 4096 4608 .000 .000 .000 .000 .000 .000 .000 .000 .000 .000 .000IP Flow Switching Cache, 278544 bytes 0 active, 4096 inactive, 12 added 192 ager polls, 0 flow alloc failures Active flows timeout in 30 minutes Inactive flows timeout in 15 secondsIP Sub Flow Cache, 21640 bytes 0 active, 1024 inactive, 12 added, 12 added to flow 0 alloc failures, 0 force free 1 chunk, 1 chunk added last clearing of statistics neverProtocol Total Flows Packets Bytes Packets Active (Sec) Idle (Sec)-------- Flows /Sec /Flow /Pkt /Sec /Flow /FlowUDP-other 11 0.0 1 52 0.0 0.0 15.6ICMP 1 0.0 5 100 0.0 0.1 15.6Total 12 0.0 1 67 0.0 0.0 15.6
NetFlow Troubleshooting Example – Cont.Check whether R1 is exporting NetFlow and if there are any flows to export using the show ip cache flow command on R1. Based on the output shown, R1 is collecting data.

Chapter 735© 2007 – 2010, Cisco Systems, Inc. All rights reserved. Cisco Public
NetFlow Troubleshooting Example – Cont.
R1# show ip flow exportFlow export v5 is enabled for main cache Exporting flows to 10.1.152.1 (9991) Exporting using source interface FastEthernet0/0 Version 5 flow records 5 flows exported in 3 udp datagrams 0 flows failed due to lack of export packet 0 export packets were sent up to process level 0 export packets were dropped due to no fib 0 export packets were dropped due to adjacency issues 0 export packets were dropped due to fragmentation failures 0 export packets were dropped due to encapsulation fixup failures
Check if R1 is exporting the NetFlow data to the correct server. The IP address of the NetFlow Collector and the source interface are incorrect.

Chapter 736© 2007 – 2010, Cisco Systems, Inc. All rights reserved. Cisco Public
R1(config)# no ip flow-export destination 10.1.152.1 9991R1(config)# ip flow-export destination 10.1.1.10 9991R1(config)# no ip flow-export source Fa0/0R1(config)# ip flow-export source Fa0/0R1(config)# endR1#R1# show ip flow exportFlow export v5 is enabled for main cache Exporting flows to 10.1.1.10 (9991) Exporting using source interface Loopback0 version 5 flow records 29 flows exported in 22 udp datagrams 0 flows failed due to lack of export packet 5 export packets were sent up to process level 0 export packets were dropped due to no fib 0 export packets were dropped due to adjacency issues 0 export packets were dropped due to fragmentation failures 0 export packets were dropped due to encapsulation fixup failures
NetFlow Troubleshooting Example – Cont.
Correct the NetFLow Collector’s address and IP NetFlow’s source interface. Verify the configuration using the show ip flow export command again.

Chapter 737© 2007 – 2010, Cisco Systems, Inc. All rights reserved. Cisco Public
IP SLA Troubleshooting Example R1 is an IP SLA sender and R2 is the IP SLA responder. To measure delay, a TCP connection probe (entry 1) is sent on
port 2002 from R1 to R2 every 10 minutes. SNMP traps are sent to an SNMP console if a certain threshold is
surpassed. The problem is that the probe does not start and it does not
report any statistics.
Chapter 738© 2007 – 2010, Cisco Systems, Inc. All rights reserved. Cisco Public
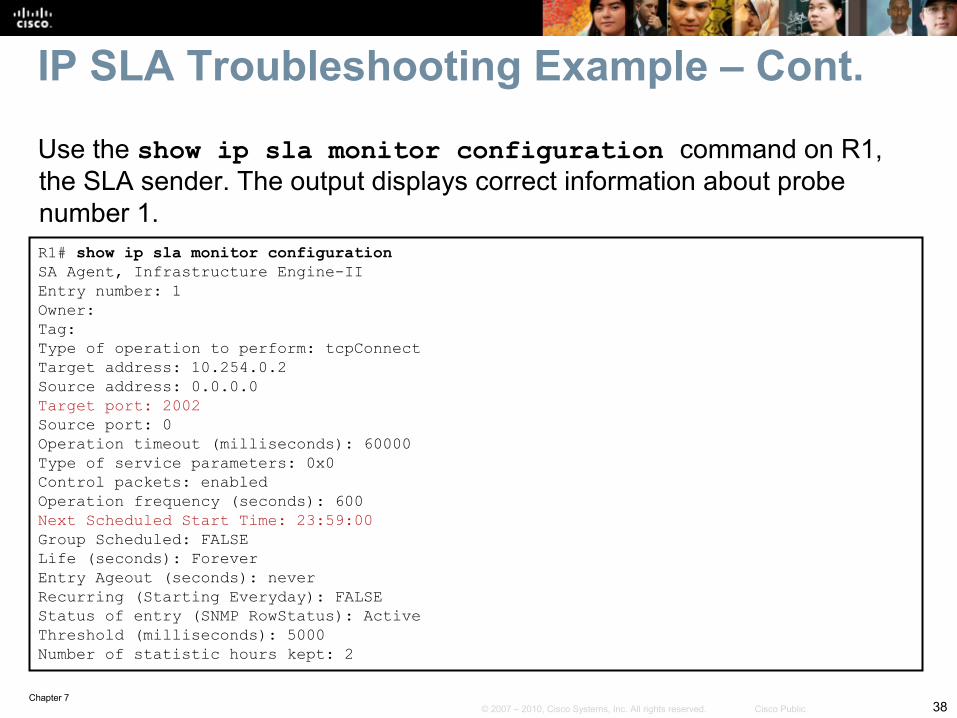
R1# show ip sla monitor configurationSA Agent, Infrastructure Engine-IIEntry number: 1Owner: Tag: Type of operation to perform: tcpConnectTarget address: 10.254.0.2Source address: 0.0.0.0Target port: 2002Source port: 0Operation timeout (milliseconds): 60000Type of service parameters: 0x0Control packets: enabledOperation frequency (seconds): 600Next Scheduled Start Time: 23:59:00Group Scheduled: FALSELife (seconds): ForeverEntry Ageout (seconds): neverRecurring (Starting Everyday): FALSEStatus of entry (SNMP RowStatus): ActiveThreshold (milliseconds): 5000Number of statistic hours kept: 2
IP SLA Troubleshooting Example – Cont.
Use the show ip sla monitor configuration command on R1, the SLA sender. The output displays correct information about probe number 1.

Chapter 739© 2007 – 2010, Cisco Systems, Inc. All rights reserved. Cisco Public
R1# show run | section ip slaip sla monitor 1 type tcpConnect dest-ipaddr 10.254.0.2 dest-port 2002 frequency 600ip sla monitor schedule 1 life forever start-time 23:59:00 Sep 10ip sla monitor 2 type echo protocol ipIcmpEcho 10.9.9.21 source-interface FastEhternet0/0ip sla monitor schedule 2 life forever start-time nowip sla monitor 3 type udpEcho dest-ipaddr 10.1.1.100 dest-port 5247ip sla monitor schedule 3 life forever start-time now
IP SLA Troubleshooting Example – Cont.
Using the show run | section ip sla command on R1. Notice that the probe was supposed to start at 23:59, and even though it is past that time, it has not started.

Chapter 740© 2007 – 2010, Cisco Systems, Inc. All rights reserved. Cisco Public
IP SLA Troubleshooting Example – Cont.
A check of the NTP status on R1 indicates it is not synchronized with the NTP server (R2). Configure R2 as the ntp master and the problem is corrected.R1# show ntp statusClock is unsynchronized, stratum 16, no reference clocknominal freq is 250.0000 Hz, actual freq is 250.0000 Hz, precision is 2**18reference time is CE3D3F49.C3932713 (16:33:13.763 UTC Mon Aug 24 2009)clock offset is 1.2491 msec, root delay is 22.99 msecroot dispersion is 1.68 msec, peer dispersion is 0.41 msec
R2(config)# ntp master 1R2(config)# end
R1# show ntp statusClock is synchronized, stratum 2, reference is 10.254.0.2nominal freq is 250.0000 Hz, actual freq is 250.0000 Hz, precision is 2**18reference time is CE54DCFD.19C87A09 (14:28:13.100 UTC Fri Sep 11 2009)clock offset is 0.4728 msec, root delay is 22.87 msecroot dispersion is 7875.56 msec, peer dispersion is 7875.08 msec
Chapter 741© 2007 – 2010, Cisco Systems, Inc. All rights reserved. Cisco Public
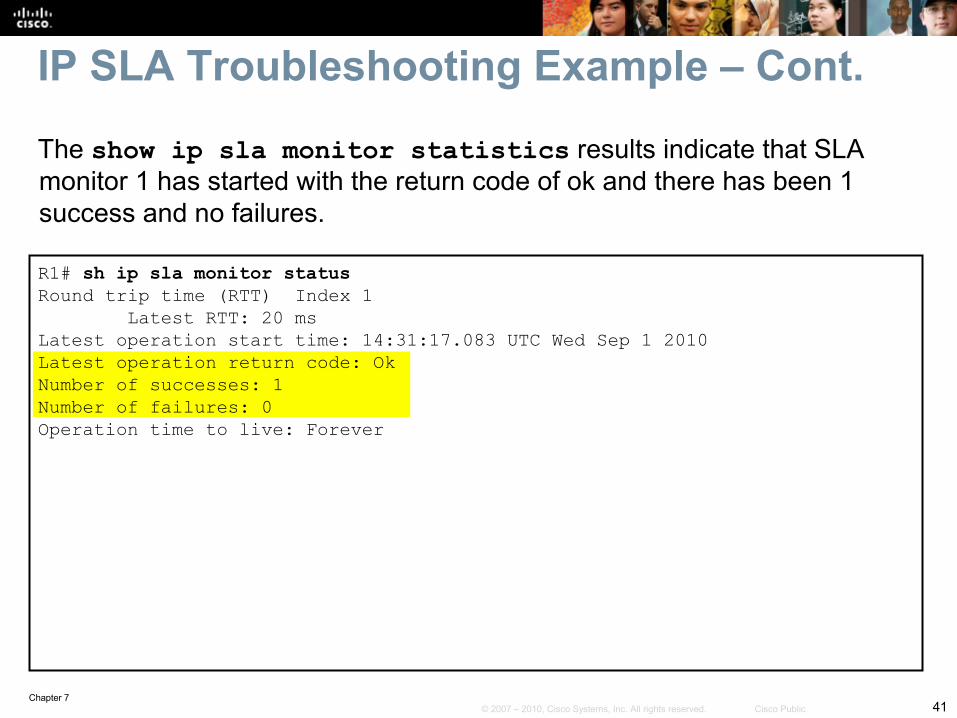
R1# sh ip sla monitor statusRound trip time (RTT) Index 1 Latest RTT: 20 msLatest operation start time: 14:31:17.083 UTC Wed Sep 1 2010Latest operation return code: OkNumber of successes: 1Number of failures: 0Operation time to live: Forever
IP SLA Troubleshooting Example – Cont.
The show ip sla monitor statistics results indicate that SLA monitor 1 has started with the return code of ok and there has been 1 success and no failures.

Chapter 742© 2007 – 2010, Cisco Systems, Inc. All rights reserved. Cisco Public
AutoQoS Troubleshooting Example
The connection between R1 and R2 is down However, the service provider maintains that the backbone
service is fully operational.
Chapter 743© 2007 – 2010, Cisco Systems, Inc. All rights reserved. Cisco Public
AutoQoS Troubleshooting Example – Cont.
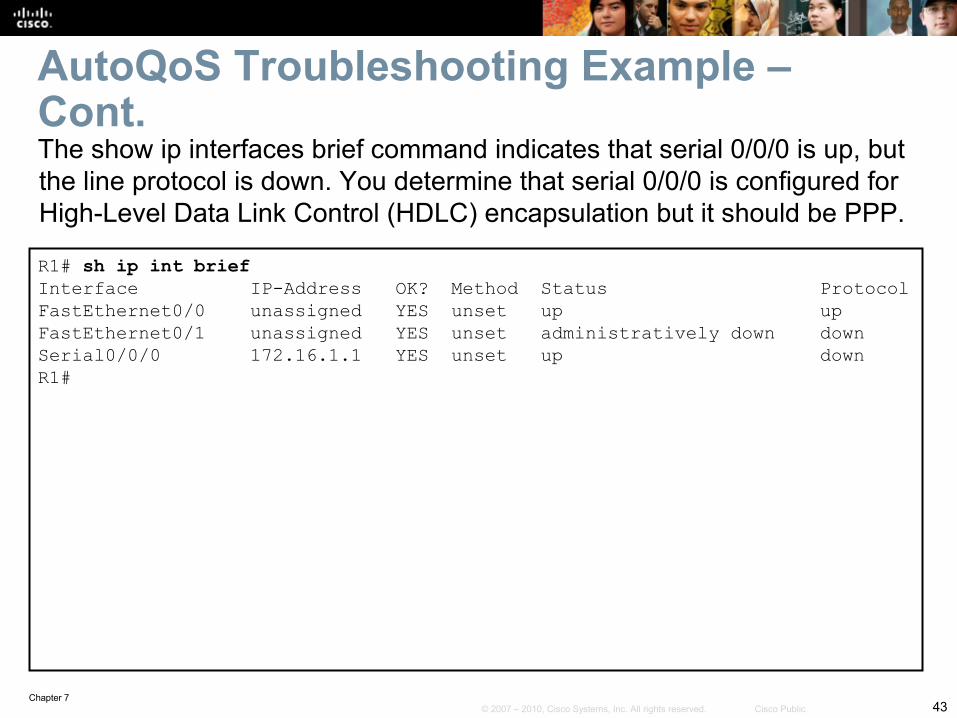
R1# sh ip int briefInterface IP-Address OK? Method Status ProtocolFastEthernet0/0 unassigned YES unset up upFastEthernet0/1 unassigned YES unset administratively down downSerial0/0/0 172.16.1.1 YES unset up downR1#
The show ip interfaces brief command indicates that serial 0/0/0 is up, but the line protocol is down. You determine that serial 0/0/0 is configured for High-Level Data Link Control (HDLC) encapsulation but it should be PPP.
Chapter 744© 2007 – 2010, Cisco Systems, Inc. All rights reserved. Cisco Public
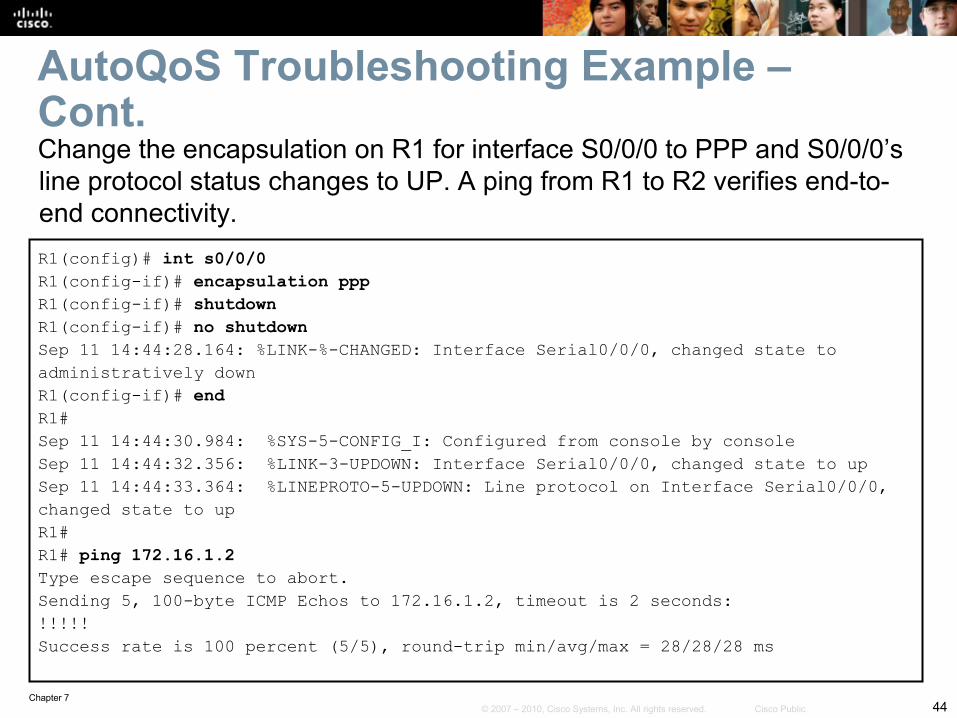
R1(config)# int s0/0/0R1(config-if)# encapsulation pppR1(config-if)# shutdownR1(config-if)# no shutdownSep 11 14:44:28.164: %LINK-%-CHANGED: Interface Serial0/0/0, changed state to administratively downR1(config-if)# endR1#Sep 11 14:44:30.984: %SYS-5-CONFIG_I: Configured from console by consoleSep 11 14:44:32.356: %LINK-3-UPDOWN: Interface Serial0/0/0, changed state to upSep 11 14:44:33.364: %LINEPROTO-5-UPDOWN: Line protocol on Interface Serial0/0/0, changed state to upR1#R1# ping 172.16.1.2Type escape sequence to abort.Sending 5, 100-byte ICMP Echos to 172.16.1.2, timeout is 2 seconds:!!!!!Success rate is 100 percent (5/5), round-trip min/avg/max = 28/28/28 ms
AutoQoS Troubleshooting Example – Cont.Change the encapsulation on R1 for interface S0/0/0 to PPP and S0/0/0’s line protocol status changes to UP. A ping from R1 to R2 verifies end-to-end connectivity.

Chapter 745© 2007 – 2010, Cisco Systems, Inc. All rights reserved. Cisco Public
AutoQoS Troubleshooting Example – Cont.
Why was the encapsulation on R1 S0/0/0 changed from PPP to HDLC? Someone tried to enable AutoQoS on this interface and tried to remove
it but the circuit remained down. When AutoQoS was removed, the interface encapsulation was changed
back to the serial interface default, which is HDLC. Changing the encapsulation to PPP restored connectivity but we still
need to make use of AutoQoS on this interface.

Chapter 746© 2007 – 2010, Cisco Systems, Inc. All rights reserved. Cisco Public
R1(config)# int s0/0/0R1(config-if)# auto discovery qos AutoQos discovery already runningR1(config-if)# R1(config-if)# auto qos voipR1(config-if)#Sep 1 14:52:54.141: %LINK-3-UPDOWN: Interface Multilink2001100115, changed state to downSep 1 14:52:55.273: %RMON-5-FALLINGTRAP: Falling trap is generated because the value of cbQosCMDropBitRate.1317.1319 has fallen below the falling-threshold value 0
AutoQoS Troubleshooting Example – Cont.Enabling AutoQoS on R1’s Serial 0/0/0 interface generates an error.

Chapter 747© 2007 – 2010, Cisco Systems, Inc. All rights reserved. Cisco Public
R1# sh run int s0/0/0Building configuration… Current configuration : 277 bytes!interface Serial0/0/0 bandwidth 200 no ip address ip nbar protocol-discovery ip flow ingress encapsulation ppp auto qos voip auto discovery qos no fair-queue ppp multilink ppp multilink group 2001100115 service-policy input TEST service-policy output TESTend
AutoQoS Troubleshooting Example – Cont.Serial0/0/0’s bandwidth is mistakenly set to 200 kbps instead of 2 Mbps.

Chapter 748© 2007 – 2010, Cisco Systems, Inc. All rights reserved. Cisco Public
AutoQoS Troubleshooting Example – Cont.After fixing the bandwidth, reapplying AutoQoS is still unsuccessful.
R1(config)# int s0/0/0R1(config-if)# no auto qos% Cannot disable multilink on a multilink group interface% Not all config may be removed and may reappear after reactivating the Logical-interface/sub-interfacesR1(config-if)# bandwidth 2000R1(config-if)# auto qosPolicy map TEST is already attachedAutoQoS Error: the following command was not properly applied:service-policy output AutoQoS-Policy-UnTrustR1(config-if)# endR1#Sep 1 14:56:49.329: %LINK-3-CHANGED: Interface Multilink2001100115, changed state to administratively downSep 1 14:56:50.205: %SYS-5-CONFIG_I: Configured from console by console
Chapter 749© 2007 – 2010, Cisco Systems, Inc. All rights reserved. Cisco Public
AutoQoS Troubleshooting Example – Cont.
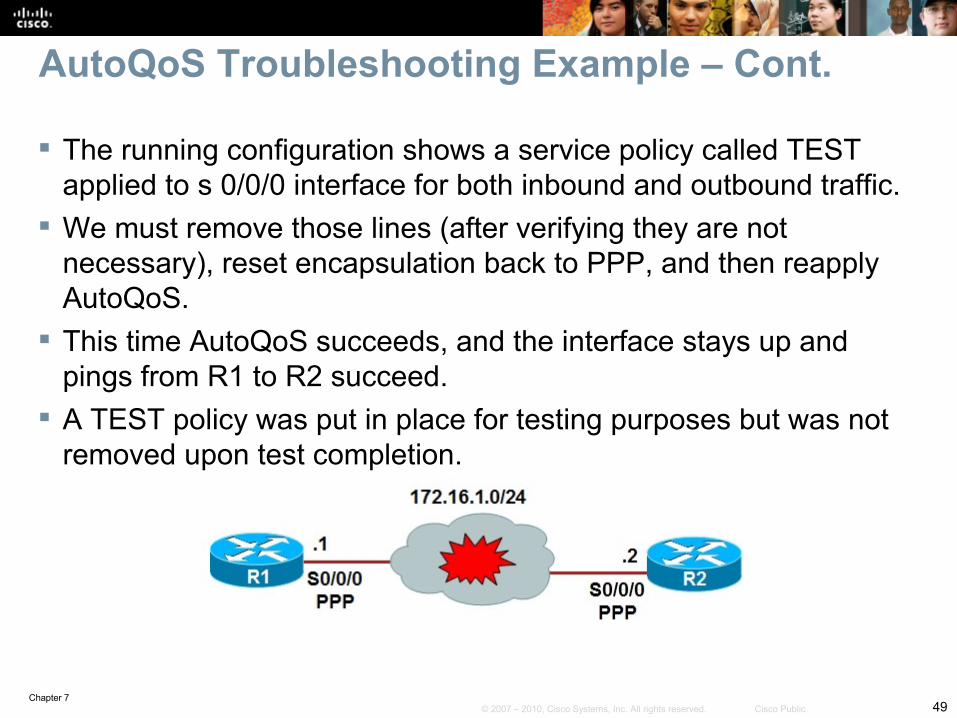
The running configuration shows a service policy called TEST applied to s 0/0/0 interface for both inbound and outbound traffic.
We must remove those lines (after verifying they are not necessary), reset encapsulation back to PPP, and then reapply AutoQoS.
This time AutoQoS succeeds, and the interface stays up and pings from R1 to R2 succeed.
A TEST policy was put in place for testing purposes but was not removed upon test completion.

Chapter 750© 2007 – 2010, Cisco Systems, Inc. All rights reserved. Cisco Public
Troubleshooting Performance Issues on Switches

Chapter 751© 2007 – 2010, Cisco Systems, Inc. All rights reserved. Cisco Public
Identifying Switch Performance Issues This section covers the Cisco IOS commands to perform
the following tasks:• Diagnose physical and data link layer problems on switch ports.• Analyze ternary content addressable memory (TCAM) utilization on
switches in order to determine the root cause of TCAM allocation failures.
• Determine the root cause of high CPU usage on a switch. Performance problems are defined in terms of expectations
and requirements by different entities:• User expectations and requirements• Business expectations and requirements• Technical expectations and requirements

Chapter 752© 2007 – 2010, Cisco Systems, Inc. All rights reserved. Cisco Public
Identifying Switch Performance Issues – Cont. In general, troubleshooting performance problems is a three-step
process:• Assessing whether the problem is technical in nature: • Isolating the performance problem to a device, link, or component:• Diagnosing and resolving the performance degradation at the component
level: Although there are differences between the hardware architectures
among various Catalyst switch families, all switches include the following components:• Interfaces: These are used to receive and transmit frames.• Forwarding hardware: This consists of two elements: Hardware that
implements the decision-making logic that rewrites a frame and forward it to the correct interface, and a backplane to carry frames from the ingress interface to the egress interface.
• Control plane hardware: These execute the processes that are part of the operating system.

Chapter 753© 2007 – 2010, Cisco Systems, Inc. All rights reserved. Cisco Public
Identifying Switch Performance Issues – Cont. When you find indications of packet loss on a switch, the
first place to look is usually the output of the show interface command.
This output shows packet statistics including various error counters.
On switches, two additional command options are supported that are not available on routers:show interfaces interface-id counters
• This command displays the total numbers of input and output unicast, multicast and broadcast packets and the total input and output byte counts. show interfaces interface-id counters errors
• This command displays the error statistics for each interface.

Chapter 754© 2007 – 2010, Cisco Systems, Inc. All rights reserved. Cisco Public
AutoQoS Troubleshooting Example – Cont.Checking the Number of Received Packets vs Interface Errors
ASW1# show interfaces FastEthernet 0/1 counters Port InOctets InUcastPkts InMcastPkts InBcastPktsFa0/1 647140108 499128 4305 0 Port OutOctets OutUcastPkts OutMcastPkts OutBcastPktsFa0/1 28533484 319996 52 3 ASW1# show interfaces FastEthernet 0/1 counters errors Port Align-Err FCS-Err Xmit-Err Rcv-Err UnderSize OutDiscardsFa0/1 0 12618 0 12662 0 0 Port Single-Col Multi-Col Late-Col Excess-Col Carri-Sen Runts GiantsFa0/1 0 0 0 0 0 0 44

Chapter 755© 2007 – 2010, Cisco Systems, Inc. All rights reserved. Cisco Public
Identifying Switch Performance Issues – Cont.
Parameters reported by the show interfaces interface-id counters errors command .
Reported Parameter DescriptionAlign-Err Frames with alignment errors ending in uneven number
of octets and have bad CRC, received on the port. FCS-Err Frames with valid size with Frame Check Sequence
(FCS) errors but no framing errors.Xmit-Err and Rcv-Err
Indicates the internal port transmit (Tx) or receive (Rx) buffers are full.
Undersize Frames received that are smaller than the minimum IEEE 802.3 frame size of 64 bytes.
Single-Col Number of times one collision occurs before the port transmits a frame to the media successfully.
Multi-Col Number of times multiple collisions occur before the port transmits a frame to the media successfully.

Chapter 756© 2007 – 2010, Cisco Systems, Inc. All rights reserved. Cisco Public
Identifying Switch Performance Issues – Cont.
Parameters reported by the show interfaces interface-id counters errors command - Cont.
Reported Parameter
Description
Late-Col Number of times that a collision is detected on a particular port late in the transmission process.
Excess-Col Count of frames transmitted on a particular port, which fail due to excessive collisions.
Carri-Sen Occurs every time an Ethernet controller wants to send data on a half-duplex connection.
Runts Frames received that are smaller than the minimum IEEE 802.3 size (64 bytes), and with a bad CRC.
Giants Frames that exceed the maximum IEEE 802.3 size (1518 bytes), and have a bad FCS.

Chapter 757© 2007 – 2010, Cisco Systems, Inc. All rights reserved. Cisco Public
Switch Port/Interface IssuesCommon interface and wiring problems and their
corresponding remedies: No cable connected: Connect the cable from the switch to a
known good device. Wrong port: Make sure that both ends of the cable are
plugged into the correct ports. Device has no power: Ensure that both devices have power. Wrong cable type: Verify that the correct type of cable is
being used. Bad cable: Swap the suspect cable with a known good
cable. Look for broken or missing pins on connectors.

Chapter 758© 2007 – 2010, Cisco Systems, Inc. All rights reserved. Cisco Public
Switch Port/Interface Issues (cont.)Loose connections: Check for loose connections. Sometimes
a cable appears to be seated in the jack, but it is not. Unplug the cable and reinsert it. Verify that the click-tab is engaging the jack.
Patch panels: Eliminate faulty patch panel connections. Bypass the patch panel if possible to rule it out as the problem.
Media converters: Eliminate faulty media converters. Bypass the media converter, if possible, to rule it out as the problem.
Bad or wrong gigabit interface converter (GBIC): Swap the suspect GBIC with a known good GBIC. Verify hardware and software support for the GBIC.

Chapter 759© 2007 – 2010, Cisco Systems, Inc. All rights reserved. Cisco Public
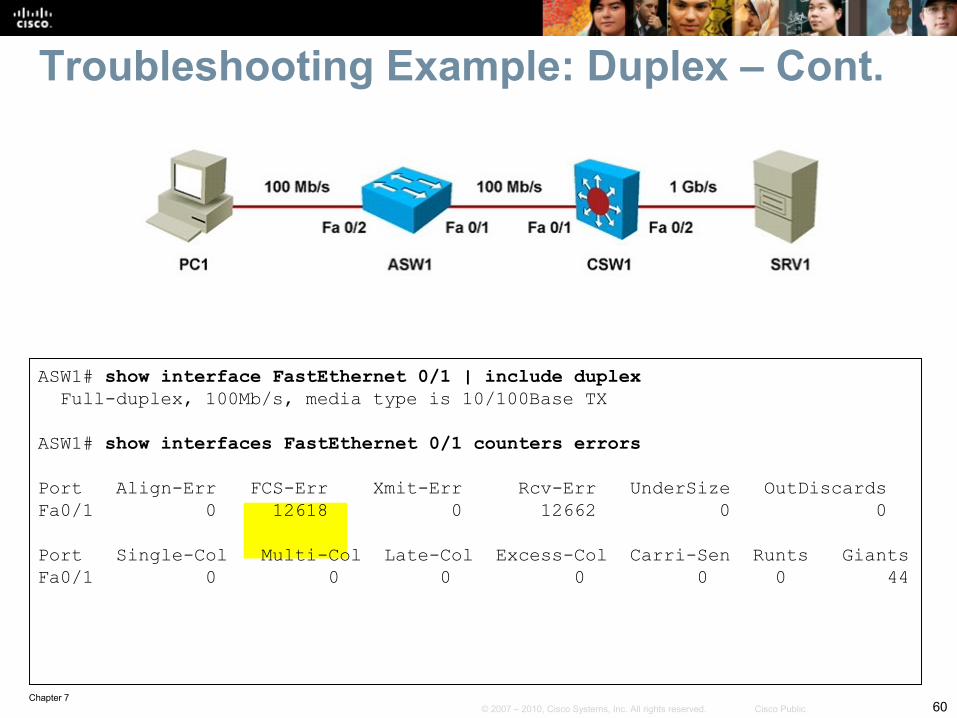
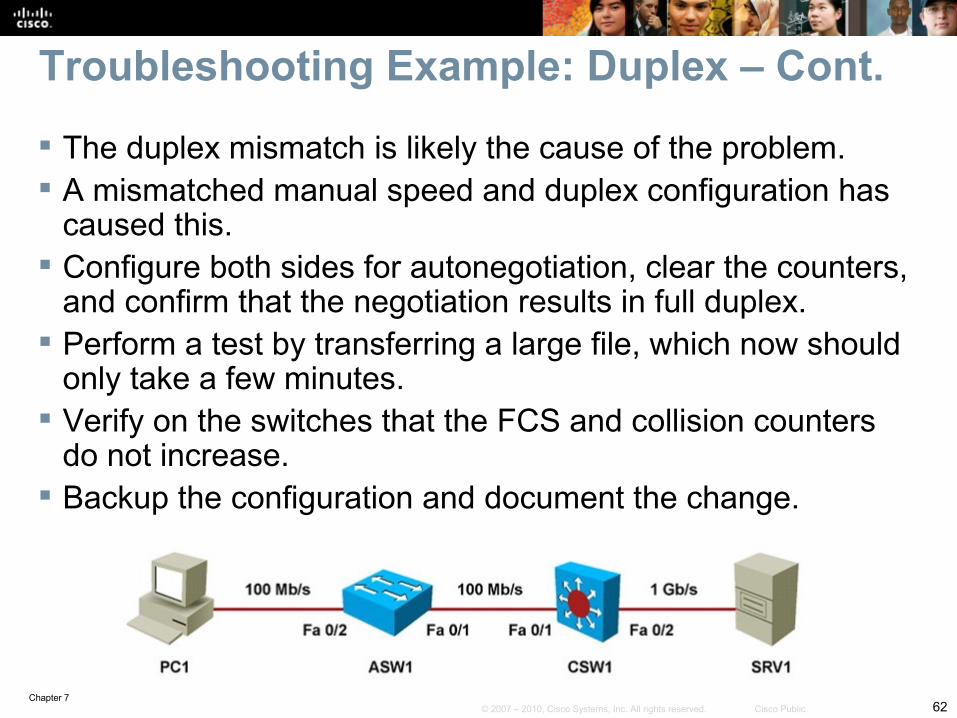
Troubleshooting Example: Duplex The user on PC1 has complained that transferring large files to
SRV1 takes hours. The maximum throughput the user can expect is 100 Mbps
between the client and the server. Transfer of 1 GB of data at the rate of 100 Mbps should take
approximately 80 seconds (not factoring overhead). Potential explanations: Congestion on the network or under-
performing hardware or software on the client, network, or server. Average load on the links in the path has not been higher than 50
percent over the last few hours, ruling out congestion as the cause.
Chapter 760© 2007 – 2010, Cisco Systems, Inc. All rights reserved. Cisco Public
ASW1# show interface FastEthernet 0/1 | include duplex Full-duplex, 100Mb/s, media type is 10/100Base TX ASW1# show interfaces FastEthernet 0/1 counters errors Port Align-Err FCS-Err Xmit-Err Rcv-Err UnderSize OutDiscardsFa0/1 0 12618 0 12662 0 0 Port Single-Col Multi-Col Late-Col Excess-Col Carri-Sen Runts GiantsFa0/1 0 0 0 0 0 0 44
Troubleshooting Example: Duplex – Cont.

Chapter 761© 2007 – 2010, Cisco Systems, Inc. All rights reserved. Cisco Public
CSW1# show interface FastEthernet 0/1 | include duplex Half-duplex, 10Mb/s, media type is 10/100Base TX CSW1# show interfaces FastEthernet 0/1 counters errors Port Align-Err FCS-Err Xmit-Err Rcv-Err UnderSize OutDiscardsFa0/1 0 0 0 0 0 0 Port Single-Col Multi-Col Late-Col Excess-Col Carri-Sen Runts GiantsFa0/1 664 124 12697 0 0 0 44
Troubleshooting Example: Duplex – Cont.
Chapter 762© 2007 – 2010, Cisco Systems, Inc. All rights reserved. Cisco Public
Troubleshooting Example: Duplex – Cont.
The duplex mismatch is likely the cause of the problem. A mismatched manual speed and duplex configuration has
caused this. Configure both sides for autonegotiation, clear the counters,
and confirm that the negotiation results in full duplex. Perform a test by transferring a large file, which now should
only take a few minutes. Verify on the switches that the FCS and collision counters
do not increase. Backup the configuration and document the change.

Chapter 763© 2007 – 2010, Cisco Systems, Inc. All rights reserved. Cisco Public
CSW1(config)# interface FastEthernet 0/1CSW1(config-if)# shutdownCSW1(config-if)# speed autoCSW1(config-if)# duplex autoCSW1(config-if)# mdix autoCSW1(config-if)# no shutdownCSW1(config-if)# end
Automatic medium-dependent interface crossover (Auto-MDIX) This feature automatically detects the required cable connection
type (straight-through or crossover) for a connection. If one of the two sides of a connection supports auto-MDIX, a
crossover or a straight-through Ethernet cable will work. This feature depends on the speed and duplex auto-negotiation
feature being enabled. The default setting for auto-MDIX was changed from disabled to
enabled with IOS Release 12.2(20)SE. This feature manually enabled using the mdix auto command.

Chapter 764© 2007 – 2010, Cisco Systems, Inc. All rights reserved. Cisco Public
CSW1# show interface FastEthernet 0/1 transceiver propertiesDiagnostic Monitoring is not implementedName : Fa0/1Administrative Speed: autoAdministrative Duplex: autoAdministrative Auto-MDIX: onAdministrative Power Inline: N/AOperational Speed: 100Operational Duplex: fullOperational Auto-MDIX: onMedia Type: 10/100BaseTX
Automatic medium-dependent interface crossover (Auto-MDIX) – Cont.To verify the status of auto-MDIX, speed, and duplex for an interface you can use the show interface transceiver properties command.

Chapter 765© 2007 – 2010, Cisco Systems, Inc. All rights reserved. Cisco Public
Troubleshooting TCAM Problems The decision-making logic of a switch has a significant
impact on its performance. The logic consists of specialized high performance lookup
memory, the ternary content-addressable memory (TCAM). The TCAM forwards frames at high speeds and utilizes full
capacity of the switch backplane. If frames cannot be forwarded by the TCAM, they will be
handed off (punted) to the CPU for processing. Because the CPU is also used to execute the control plane
processes, it can only forward traffic at certain rate. If a large amount of traffic is punted to the CPU, the
throughput for the traffic concerned will decrease.

Chapter 766© 2007 – 2010, Cisco Systems, Inc. All rights reserved. Cisco Public
Troubleshooting TCAM Problems - Cont. Traffic might be punted or handled by the CPU for many
reasons: Packets destined for any of the switch IP addresses.
Examples of such packets include Telnet, SSH, or SNMP packets destined for one of the switch IP addresses.
Multicasts and broadcasts from control plane protocols such as the STP or routing protocols.
Packets that cannot be forwarded by the TCAM because a feature is not supported in hardware. (For example, GRE tunnel packets).
Packets that cannot be forwarded in hardware because the TCAM could not hold the necessary information.

Chapter 767© 2007 – 2010, Cisco Systems, Inc. All rights reserved. Cisco Public
Troubleshooting TCAM Problems - Cont. The TCAM is divided into separate areas, each of which has limits. On the Catalyst 3560 and 3750 series switches, the allocation of TCAM
space is based on a switch database manager (SDM) template. Templates other than the default can be selected to change the allocation of
TCAM resources to better fit the role of the switch in the network. When the values in the Used column get close to the values in the Max
column, there might be extra load on the CPU because of a failed allocation of TCAM resources.
CSW1# show platform tcam utilization CAM Utilization for ASIC# 0 Max Used Masks/Values Masks/Values Unicast mac addresses: 784/6272 23/99IPv4 IGMP groups + multicast routes: 144/1152 6/26IPv4 unicast directly-connected routes: 784/6272 23/99IPv4 unicast indirectly-connected routes: 272/2176 30/175IPv4 policy based routing aces: 0/0 30/175IPv4 qos aces: 768/768 260/260IPv4 security aces: 1024/1024 27/27 Note: Allocation of TCAM entries per feature uses A complex algorithm. The above information is meant to provide an abstract view of the current TCAM utilization

Chapter 768© 2007 – 2010, Cisco Systems, Inc. All rights reserved. Cisco Public
CSW1# show platform ip unicast counts# of HL3U fibs 141# of HL3U adjs 9# of HL3U mpaths 2# of HL3U covering-fibs 0# of HL3U fibs with adj failures 0Fibs of Prefix length 0, with TCAM fails: 0Fibs of Prefix length 1, with TCAM fails: 0Fibs of Prefix length 2, with TCAM fails: 0Fibs of Prefix length 3, with TCAM fails: 0Fibs of Prefix length 4, with TCAM fails: 0Fibs of Prefix length 5, with TCAM fails: 0Fibs of Prefix length 6, with TCAM fails: 0
<output omitted>
Troubleshooting TCAM Problems - Cont. For some types of TCAM entries, it is possible to see whether
any TCAM-allocation failures have occurred. The example output of the show platform ip unicast counts command shows if any TCAM-allocation failures were experienced for IP Version 4 prefixes.
MAC attacks can fill up the CAM/TCAM, leading to performance degradation.

Chapter 769© 2007 – 2010, Cisco Systems, Inc. All rights reserved. Cisco Public
CSW1#sh controllers cpu-interfaceASIC Rxbiterr Rxunder Fwdctfix Txbuflos Rxbufloc Rxbufdrain-------------------------------------------------------------------------ASIC0 0 0 0 0 0 0 cpu-queue-frames retrieved dropped invalid hol-block stray---------------- --------- ------- ------- --------- -----rpc 1 0 0 0 0stp 853663 0 0 0 0ipc 0 0 0 0 0routing protocol 1580429 0 0 0 0L2 protocol 22004 0 0 0 0remote console 0 0 0 0 0sw forwarding 1380174 0 0 0 0
<output omitted>
Troubleshooting TCAM Problems - Cont. The show controllers cpu-interface command displays
packet counts for packets that are forwarded to the CPU. If the retrieved packet counter in the sw forwarding row is
rapidly increasing when you execute this command multiple times in a row, traffic is being switched in software by the CPU rather than in hardware by the TCAM.
Chapter 770© 2007 – 2010, Cisco Systems, Inc. All rights reserved. Cisco Public
Troubleshooting TCAM Problems - Cont. TCAM problems can be alleviated by reducing the amount
of information fed by the control plane into TCAM. For example, make use of route summarization, route
filtering, and access list (prefix list) optimization. Generally, TCAM is not upgradeable, so either reduce the
information that needs to be programmed into the TCAM or upgrade to a higher-level switch, which can handle more TCAM entries.
The TCAM allocation is configurable on the 3560 and 3750 series of switches and is managed by the switch database manager (SDM).
For more information, consult the SDM section of the configuration guide for the Catalyst 3560 or 3750 series.

Chapter 771© 2007 – 2010, Cisco Systems, Inc. All rights reserved. Cisco Public
Control Plane: Troubleshooting High CPU Load on Switches The bulk of the traffic is switched in hardware by TCAM and
CPU load is often low even when the switch is forwarding a large amount of traffic.
Low- to mid-range routers use the same CPU for packet forwarding that is also used for control plane functions.
An increase in the traffic volume handled by the router can result in a proportional increase in CPU load.
The command to display the switch CPU load is show processes cpu (the same command used in routers).
Because of the difference in implementation of packet-switching process in routers and switches, the conclusions drawn from the output of this command usually differ.
Chapter 772© 2007 – 2010, Cisco Systems, Inc. All rights reserved. Cisco Public
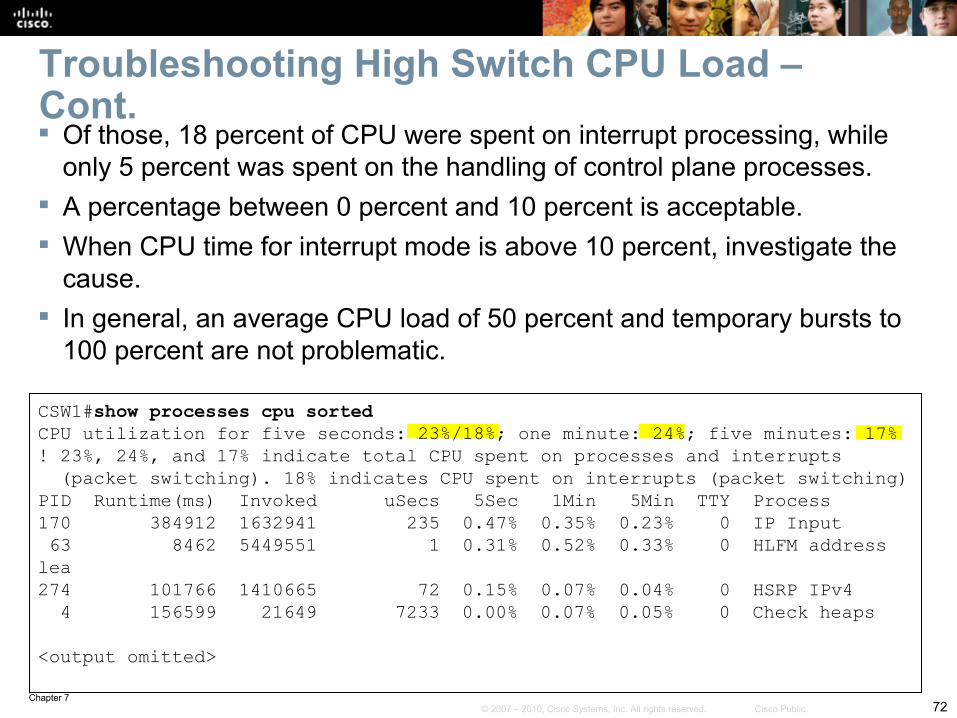
Troubleshooting High Switch CPU Load – Cont. Of those, 18 percent of CPU were spent on interrupt processing, while
only 5 percent was spent on the handling of control plane processes. A percentage between 0 percent and 10 percent is acceptable. When CPU time for interrupt mode is above 10 percent, investigate the
cause. In general, an average CPU load of 50 percent and temporary bursts to
100 percent are not problematic.
CSW1#show processes cpu sortedCPU utilization for five seconds: 23%/18%; one minute: 24%; five minutes: 17%! 23%, 24%, and 17% indicate total CPU spent on processes and interrupts (packet switching). 18% indicates CPU spent on interrupts (packet switching)PID Runtime(ms) Invoked uSecs 5Sec 1Min 5Min TTY Process170 384912 1632941 235 0.47% 0.35% 0.23% 0 IP Input 63 8462 5449551 1 0.31% 0.52% 0.33% 0 HLFM address lea274 101766 1410665 72 0.15% 0.07% 0.04% 0 HSRP IPv4 4 156599 21649 7233 0.00% 0.07% 0.05% 0 Check heaps
<output omitted>
Chapter 773© 2007 – 2010, Cisco Systems, Inc. All rights reserved. Cisco Public
Troubleshooting High Switch CPU Load – Cont. Processor intensive Cisco IOS commands:
• show tech-support• debug• show running-configuration• copy running-config startup-config• write memory
Routing protocol update processing:• A Layer 3 switch participating in a routing protocol might experience
peaks in CPU usage when many routing updates are received.
Chapter 774© 2007 – 2010, Cisco Systems, Inc. All rights reserved. Cisco Public
Troubleshooting High Switch CPU Load – Cont. SNMP polling:
• During SNMP discoveries or other bulk transfers of SNMP information by a network management system, the CPU can temporarily peak to 100 percent.
• If the SNMP process is constantly utilizing a high percentage of the available CPU cycles on a switch, investigate the settings on the network management station that is polling the device.
• The device might be polled too often, it might be polled for too much information, or both.

Chapter 775© 2007 – 2010, Cisco Systems, Inc. All rights reserved. Cisco Public
CSW1# show processes cpu sorted 5minCPU utilization for five seconds: 32%/4%; one minute: 32%; five minutes: 26%PID Runtime(ms) Invoked uSecs 5Sec 1Min 5Min TTY Process170 492557 1723695 285 22.52% 20.57% 15.49% 0 IP Input 95 7809 693 11268 0.00% 0.00% 0.41% 0 Exec274 101766 1410665 72 0.15% 0.15% 0.09% 0 HSRP IPv4 4 158998 21932 7249 0.00% 0.06% 0.05% 0 Check heaps
<output omitted>
Troubleshooting High Switch CPU Load – Cont. In the example, the IP Input process is responsible for most
of the CPU load. The IP Input process is responsible for all IP traffic that is
not handled by TCAM or forwarded in interrupt mode. (for example, ICMP messages)
Chapter 776© 2007 – 2010, Cisco Systems, Inc. All rights reserved. Cisco Public
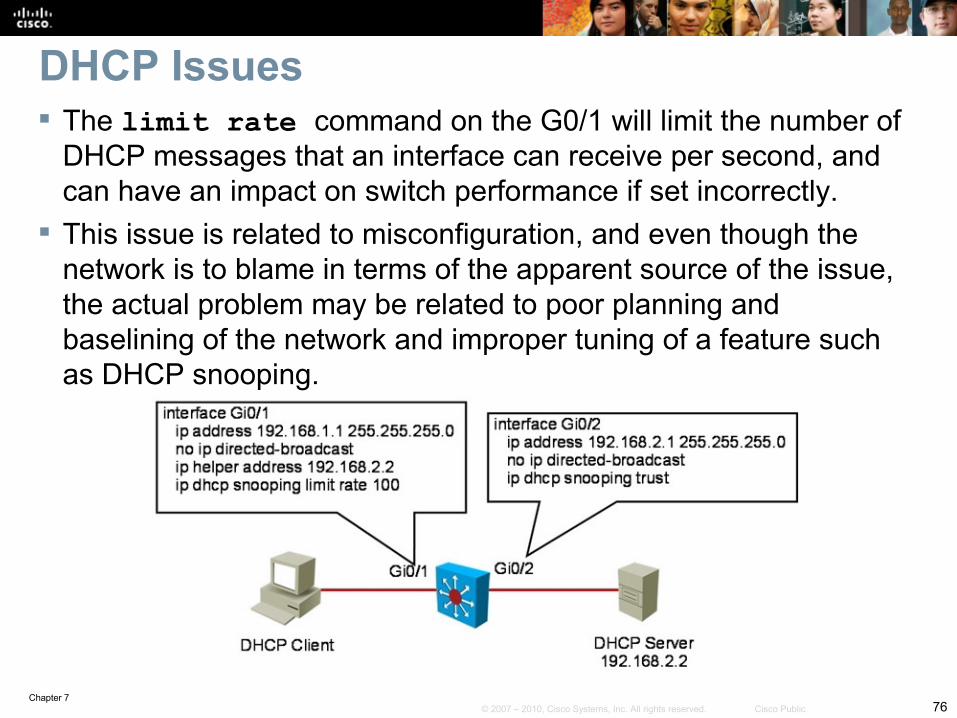
DHCP Issues The limit rate command on the G0/1 will limit the number of
DHCP messages that an interface can receive per second, and can have an impact on switch performance if set incorrectly.
This issue is related to misconfiguration, and even though the network is to blame in terms of the apparent source of the issue, the actual problem may be related to poor planning and baselining of the network and improper tuning of a feature such as DHCP snooping.

Chapter 777© 2007 – 2010, Cisco Systems, Inc. All rights reserved. Cisco Public
DHCP Issues – Cont. In the case of malicious attacks, many exploit tools are readily
available and are easy to use. DHCP starvation can be purely a denial-of-service (DoS)
mechanism or can be used in conjunction with a malicious rogue server attack to redirect traffic to a malicious computer ready to intercept traffic.
This method performs DoS attacks using DHCP leases. Gobbler looks at the entire DHCP pool and tries to lease all the
DHCP addresses available in the DHCP scope. Several security controls, such as port security, DHCP snooping,
and DHCP rate limits, are available to mitigate this type of attack. You must consider security vulnerabilities and threats when
isolating the problem from a troubleshooting perspective.
Chapter 778© 2007 – 2010, Cisco Systems, Inc. All rights reserved. Cisco Public
Spanning-Tree Issues An ill-behaving instance of STP might slow down the
network and the switch. The impact is that the switch might drop its BPDUs, and as
a result go into Listening state. STP issues can also cause topology loops. If one or more
switches no longer receive or process BPDUs, they will not be able to discover the network topology.
Without knowledge of the correct topology, the switch cannot block the loops. Therefore, the flooded traffic will circulate over the looped topology, consume bandwidth, and result in high CPU utilization.

Chapter 779© 2007 – 2010, Cisco Systems, Inc. All rights reserved. Cisco Public
Spanning-Tree Issues Other STP situations include issues related to capacity
planning. Per-VLAN Spanning Tree Plus (PVST+) creates an instance
of the protocol for each VLAN. When many VLANs exist, each additional instance represents a burden.
The CPU time utilized by STP varies depending on the number of spanning-tree instances and the number of active interfaces. The more instances and the more active interfaces, the greater the CPU utilization.

Chapter 780© 2007 – 2010, Cisco Systems, Inc. All rights reserved. Cisco Public
Spanning-Tree Issues – Cont. In the figure, there is a root for VLANs 10, 30, and 50; and one for
VLANs 20, 40, and 60. If only one root is selected, there will be only one blocked port for all
VLANs, preventing a more balanced utilization of all links. By having poor control over the selection of root bridges, you could be
causing severe traffic performance problems. For example, if an access switch is selected as the root, a high-
bandwidth link between switches might go into Blocking state, or the simple access switch might become a transit point and be flooded and overwhelmed.
Chapter 781© 2007 – 2010, Cisco Systems, Inc. All rights reserved. Cisco Public
HSRP Issues Because of the nature of HSRP, specific network problems can lead to
HSRP instability and to performance degradation. Common HSRP-specific issues include:
• Duplicate HSRP standby IP addresses: This problem typically occurs when both switches in the HSRP group go into the active state. A variety of problems can cause this behavior, including momentary STP loops, EtherChannel configuration issues, or duplicated frames.
• Constant HSRP state changes: These changes cause network performance problems, application timeouts, and connectivity disruption. Poor selection of HSRP timers, such as hello and hold time, in the presence of flapping links or hardware issues, can cause the state changes.
• Missing HSRP peers: If an HSRP peer is missing, the fault tolerance offered by HSRP is at stake. The peer may only appear as missing because of network problems.
• Switch error messages that relate to HSRP: These messages might indicate issues such as duplicate addresses that need to be addressed.
Chapter 782© 2007 – 2010, Cisco Systems, Inc. All rights reserved. Cisco Public
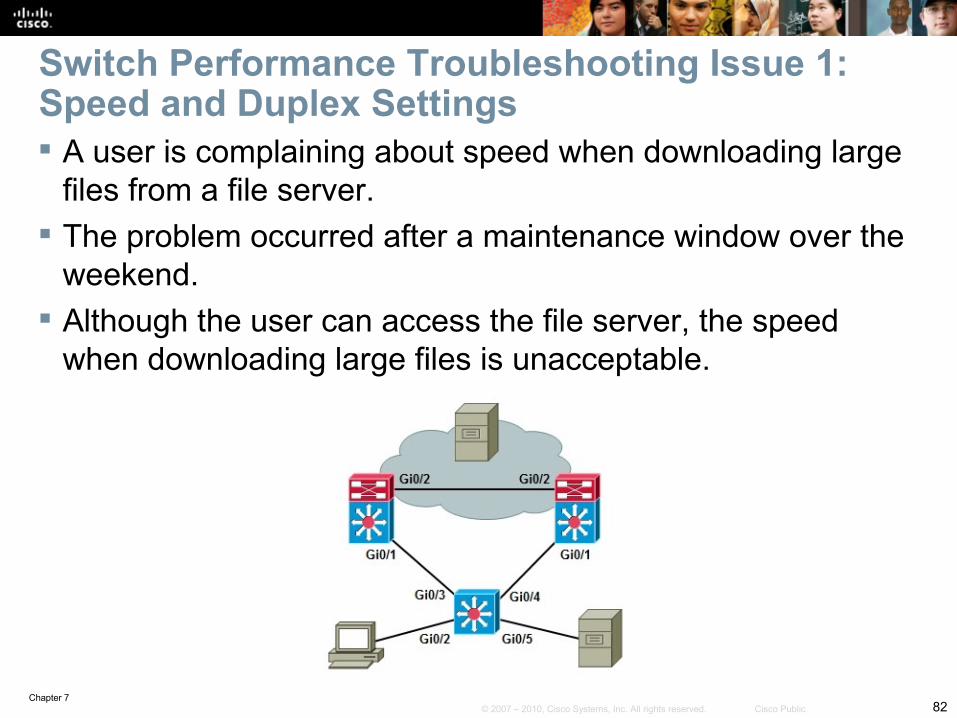
Switch Performance Troubleshooting Issue 1: Speed and Duplex Settings A user is complaining about speed when downloading large
files from a file server. The problem occurred after a maintenance window over the
weekend. Although the user can access the file server, the speed
when downloading large files is unacceptable.
Chapter 783© 2007 – 2010, Cisco Systems, Inc. All rights reserved. Cisco Public
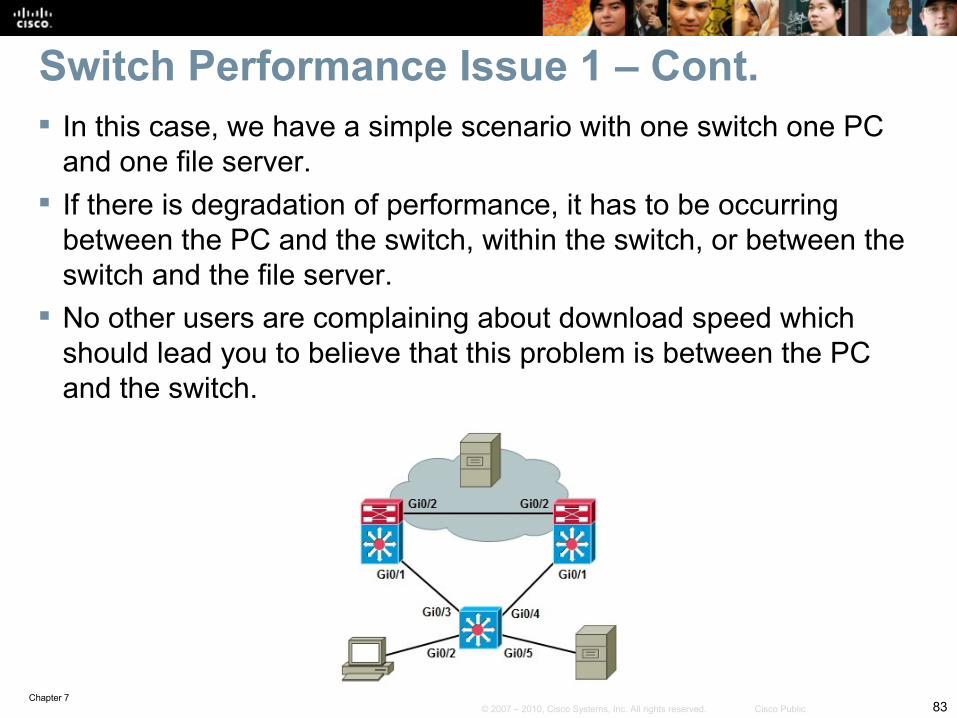
Switch Performance Issue 1 – Cont. In this case, we have a simple scenario with one switch one PC
and one file server. If there is degradation of performance, it has to be occurring
between the PC and the switch, within the switch, or between the switch and the file server.
No other users are complaining about download speed which should lead you to believe that this problem is between the PC and the switch.

Chapter 784© 2007 – 2010, Cisco Systems, Inc. All rights reserved. Cisco Public
Switch Performance Issue 1 – Cont. The PC and the file server are in the same VLAN making it
unlikely that the issue stems from the switch itself, therefore, switching should be very fast.
Confirm the PC and file server connection to the switch using the show interfaces command.
The output confirms that the interfaces connecting to the PC and the file server are up and line protocol is up.
GigabitEthernet0/2 is up, line protocol is up (connected) Hardware is Gigabit Ethernet, address is 0023.5d08.5682 (bia 0023.5d08.5682) Description: to new PC<output omitted>
GigabitEthernet0/5 is up, line protocol is up (connected) Hardware is Gigabit Ethernet, address is 0023.5d08.5685 (bia 0023.5d08.5685) Description: to file server<output omitted>

Chapter 785© 2007 – 2010, Cisco Systems, Inc. All rights reserved. Cisco Public
Switch Performance Issue 1 – Cont.
Use the show controller utilization command to check the bandwidth utilization on the ports connecting to the client (port G0/2) and the server (port G0/5).
This can help verify that you have a performance issue as shown in the example output.
The large discrepancy in the receive and transmit utilization on the user port is due to the fact that the traffic is mostly file downloads. The user is receiving much more than he is sending.
Switch# show controller g0/2 utilizationReceive Bandwidth Percentage Utilization : 2Transmit Bandwidth Percentage Utilization : 76
Switch# show controller g0/5 utilizationReceive Bandwidth Percentage Utilization : 0Transmit Bandwidth Percentage Utilization : 0

Chapter 786© 2007 – 2010, Cisco Systems, Inc. All rights reserved. Cisco Public
Switch# clear counters g0/2Clear "show interface" counters on this interface [confirm]Switch#Switch# show interface g0/2 accountingGigabitEthernet0/2 to new PC Protocol Pkts In Chars In Pkts Out Chars Out Other 0 0 6 360 Spanning Tree 0 0 32 1920 CDP 0 0 1 397
Switch Performance Issue 1 – Cont.
First, clear the counters for the user interface (Gi0/2). While the download runs issue the show interface accounting.
The output in the example shows some STP packets, CDP packets, and others.
There is not a lot of activity, so you do not expect a loop or spanning-tree issue.

Chapter 787© 2007 – 2010, Cisco Systems, Inc. All rights reserved. Cisco Public
Switch# show interface g0/2 statsGigabitEthernet0/2 Switching path Pkts In Chars In Pkts Out Chars Out Processor 0 0 156 11332 Route cache 0 0 0 0 Total 0 0 156 11332
Switch# show int g0/2 counters errors Port Align-Err FCS-Err Xmit-Err Rcv-Err UnderSize OutDiscardsGi0/2 0 0 0 0 0 3495 Port Single-Col Multi-Col Late-Col Excess-Col Carri-Sen Runts GiantsGi0/2 126243 37823 0 0 0 0 0
Switch Performance Issue 1 – Cont. Next, use the show interface g0/2 stats command
as shown in the example. Use the show interface counters errors
command to check interface error counters. These indicate that the switch tried to transmit frames to the
PC, but collisions occurred .

Chapter 788© 2007 – 2010, Cisco Systems, Inc. All rights reserved. Cisco Public
Switch# show interface g0/2 | include duplexHalf-duplex, 10Mb/s, media type is 10/100/1000BaseTXSwitch#
Switch Performance Issue 1 – Cont.
The PCs are new enough to support full duplex, so there should not be any collisions.
Verify the switch interface for parameters such as speed and duplex setting.
This could be a configuration mistake or due to autonegotiation with the PC.

Chapter 789© 2007 – 2010, Cisco Systems, Inc. All rights reserved. Cisco Public
Switch# show run interface g0/2Building configuration… Current configuration : 166 bytes!interface GigabitEthernet0/2 description to new PC switchport access vlan 50 switchport mode access speed 10 duplex half mls qos trust cos no mdix autoend
Switch Performance Issue 1 – Cont. The running configuration for the switch interface shows that it is
manually configured. PCs were moved over the weekend. Perhaps the device that was
once connected to this port required half duplex and 10 Mbps. Reconfigure the interface to auto speed and auto duplex settings
and confirm with the user that this has resolved the issue.
Chapter 790© 2007 – 2010, Cisco Systems, Inc. All rights reserved. Cisco Public
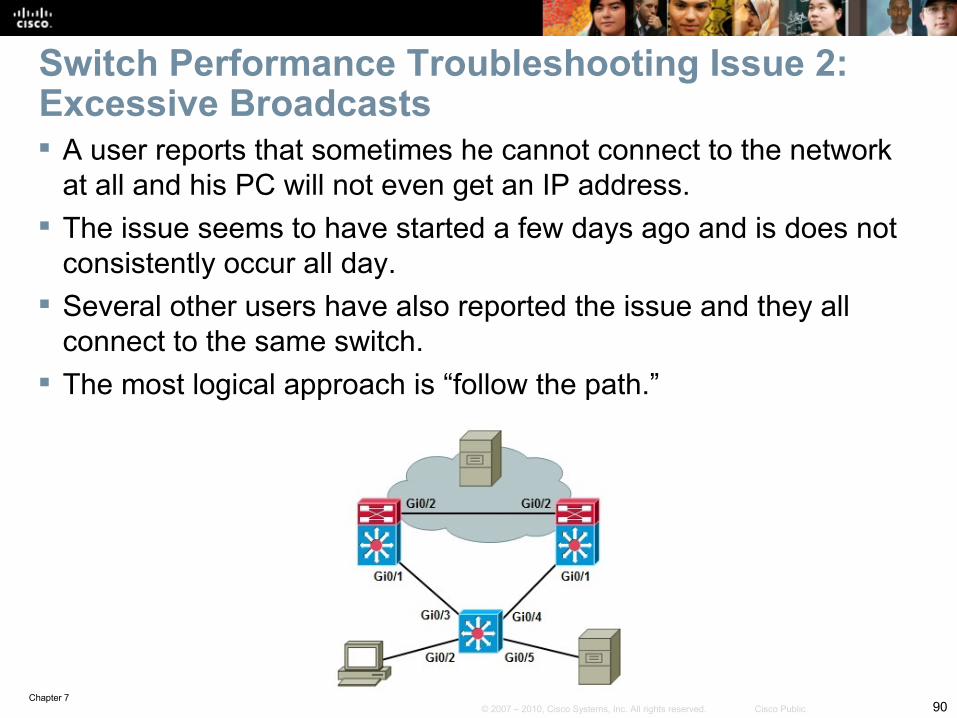
Switch Performance Troubleshooting Issue 2: Excessive Broadcasts A user reports that sometimes he cannot connect to the network
at all and his PC will not even get an IP address. The issue seems to have started a few days ago and is does not
consistently occur all day. Several other users have also reported the issue and they all
connect to the same switch. The most logical approach is “follow the path.”

Chapter 791© 2007 – 2010, Cisco Systems, Inc. All rights reserved. Cisco Public
Switch Performance Issue 2 – Cont. Start troubleshooting at port Gi0/2 where the PC is connected, by
checking the speed and duplex setting and controller utilization. The results are shown in the example.
The show controllers g0/2 utilization command displays a near 0 port utilization.
Verify that the PC is actually connected with the show interfaces command reveals that the interface is up and line protocol is up, and the statistics seem normal.
Switch# show interface g0/2 | inc duplex Full-duplex, 1000Mb/s, media type is 10/100/1000BaseTX
Switch# show controllers g0/2 utilizationReceive Bandwidth Percentage utilization : 0Transmit Bandwidth Percentage utilization : 0 Switch# show interface g0/2GigabitEthernet0/2 is up, line protocol is up (connected) Hardware is Gigabit Ethernet, address is 0023.5d08.5682 (bia 0023.5d08.5682) Description: to new PC MTU 1504 bytes, BW 1000000 Kbit, DLY 10 usec, reliability 255/255, txload 4/255, rxload 1/255<output omitted>

Chapter 792© 2007 – 2010, Cisco Systems, Inc. All rights reserved. Cisco Public
Switch# show processes cpuCPU utilization for five seconds: 98%/18%; one minute: 94%; five minutes 92%PID Runtime(ms) Invoked usecs 5Sec 1Min 5Min TTY Process1 0 15 0 0.00% 0.00% 0.00% 0 Chunk Manager2 24 1517 15 0.00% 0.00% 0.00% 0 Load Meter3 0 1 0 0.00% 0.00% 0.00% 0 CEF RP IPC Backg4 16496 1206 13678 0.00% 0.00% 0.00% 0 Check heaps5 0 1 0 0.00% 0.00% 0.00% 0 Pool Manager6 0 2 0 0.00% 0.00% 0.00% 0 Timers7 0 1 0 0.00% 0.00% 0.00% 0 Image Licensing8 0 2 0 0.00% 0.00% 0.00% 0 License Client N9 2293 26 115115 0.00% 0.00% 0.00% 0 Licensing Auto U10 0 1 0 0.00% 0.00% 0.00% 0 Crash writer11 3330507 521208 6389 44.08% 37.34% 33.94% 0 ARP Input12 0 1 0 0.00% 0.00% 0.00% 0 CEF MIB API13 0 1 0 0.00% 0.00% 0.00% 0 AAA_SERVER_DEADT14 0 2 0 0.00% 0.00% 0.00% 0 AAA high-capacit<output omitted>
Switch Performance Issue 2 – Cont.The show processes cpu command reveals that the switch CPU load is excessive at 98% over 5 seconds, 94% over 1 minute and 92% over 5 minutes.
Chapter 793© 2007 – 2010, Cisco Systems, Inc. All rights reserved. Cisco Public
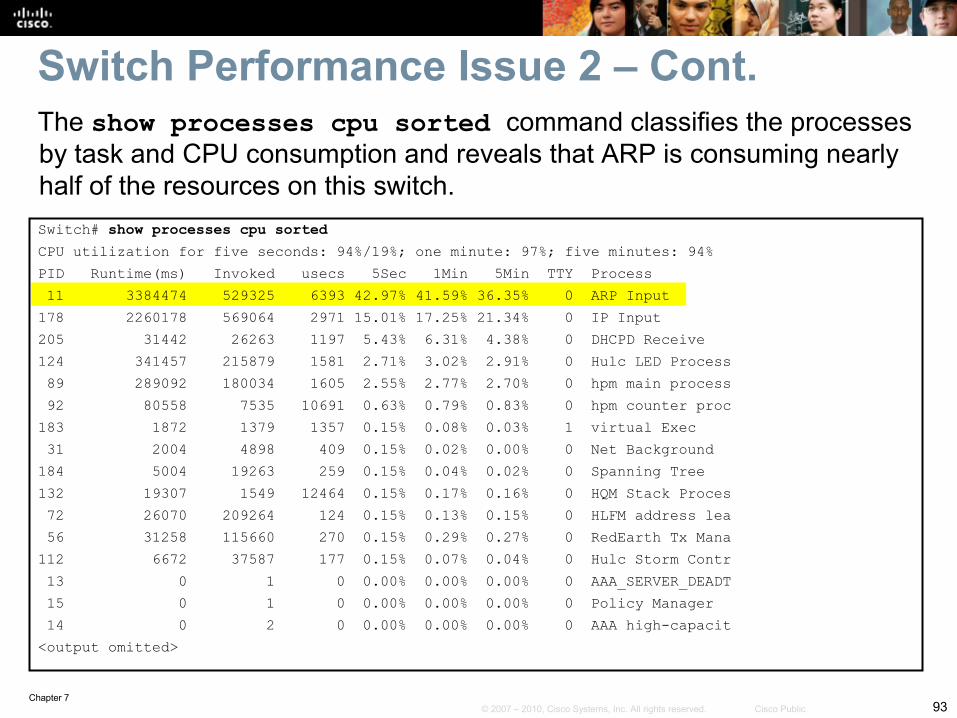
Switch# show processes cpu sortedCPU utilization for five seconds: 94%/19%; one minute: 97%; five minutes: 94%PID Runtime(ms) Invoked usecs 5Sec 1Min 5Min TTY Process 11 3384474 529325 6393 42.97% 41.59% 36.35% 0 ARP Input178 2260178 569064 2971 15.01% 17.25% 21.34% 0 IP Input205 31442 26263 1197 5.43% 6.31% 4.38% 0 DHCPD Receive124 341457 215879 1581 2.71% 3.02% 2.91% 0 Hulc LED Process 89 289092 180034 1605 2.55% 2.77% 2.70% 0 hpm main process 92 80558 7535 10691 0.63% 0.79% 0.83% 0 hpm counter proc183 1872 1379 1357 0.15% 0.08% 0.03% 1 virtual Exec 31 2004 4898 409 0.15% 0.02% 0.00% 0 Net Background184 5004 19263 259 0.15% 0.04% 0.02% 0 Spanning Tree132 19307 1549 12464 0.15% 0.17% 0.16% 0 HQM Stack Proces 72 26070 209264 124 0.15% 0.13% 0.15% 0 HLFM address lea 56 31258 115660 270 0.15% 0.29% 0.27% 0 RedEarth Tx Mana112 6672 37587 177 0.15% 0.07% 0.04% 0 Hulc Storm Contr 13 0 1 0 0.00% 0.00% 0.00% 0 AAA_SERVER_DEADT 15 0 1 0 0.00% 0.00% 0.00% 0 Policy Manager 14 0 2 0 0.00% 0.00% 0.00% 0 AAA high-capacit<output omitted>
Switch Performance Issue 2 – Cont.The show processes cpu sorted command classifies the processes by task and CPU consumption and reveals that ARP is consuming nearly half of the resources on this switch.

Chapter 794© 2007 – 2010, Cisco Systems, Inc. All rights reserved. Cisco Public
Switch# show interfaces accountingvlan1 Protocol Pkts In Chars In Pkts Out Chars Out IP 35 4038 2 684 ARP 13 780 15 900vlan6 Protocol Pkts In Chars In Pkts Out Chars Out ARP 0 0 14 840vlan8 Protocol Pkts In Chars In Pkts Out Chars Out ARP 0 0 14 840vlan10 Protocol Pkts In Chars In Pkts Out Chars Out IP 16705943 1727686324 77739 26586738 ARP 10594397 635663820 484 29040Vlan12 Protocol Pkts In Chars In Pkts Out Chars Out ARP 0 0 14 840
Switch Performance Issue 2 – Cont.The show interfaces accounting command reveals that VLAN 10 is the where the excessive ARP packets are occurring. The show vlan command reveals that Gi 0/2, 9, 11, 12, 13 and 22 are in VLAN 10.

Chapter 795© 2007 – 2010, Cisco Systems, Inc. All rights reserved. Cisco Public
Switch Performance Issue 2 – Cont. To find out which of these ports is the source of the excessive
ARP packets, use the show interfaces interface controller include broadcasts command.
The results shown point to the g0/11 and g0/13 ports, to which the wireless access points (WAPs) are connected.
These are the broadcasts from the wireless clients, and because the WAPs act like hubs and forward all their client broadcasts to the switch.
Switch#show interfaces g0/2 controller | inc broadcast Received 236 broadcasts (28 multicasts)Switch#show interfaces g0/9 controller | inc broadcast Received 0 broadcasts (0 multicasts)Switch#show interfaces g0/11 controller | inc broadcast Received 2829685 broadcasts (2638882 multicasts)Switch#show interfaces g0/13 controller | inc broadcast Received 41685559 broadcasts (145888 multicasts)Switch#show interfaces g0/22 controller | inc broadcast Received 0 broadcasts (0 multicasts)

Chapter 796© 2007 – 2010, Cisco Systems, Inc. All rights reserved. Cisco Public
Switch Performance Issue 2 – Cont. To reduce the impact of the wireless broadcast on the wired
network, you can limit the amount of broadcasts the switch accepts from those ports.
Use the storm-control command on g0/11 and g0/13 interfaces to limit broadcasts, because ARP requests are broadcasts, to 3 packets per second.
Switch# conf tEnter configuration commands, one per line. End with CNTL/Z.Switch(config)# interface g0/11Switch(config-if)# storm-control broadcast level pps 3Switch(config-if)# interface g0/13Switch(config-if)# storm-control broadcast level pps 3Switch(config-if)# end

Chapter 797© 2007 – 2010, Cisco Systems, Inc. All rights reserved. Cisco Public
Switch# show process cpu sortedPID Runtime(ms) Invoked usecs 5Sec 1Min 5Min TTY Process 11 3770480 607472 6206 11.50% 3.65% 4.94% 0 ARP Input 4 19773 1472 13432 0.31% 0.11% 0.11% 0 Check heaps144 7650 9228 828 0.15% 0.11% 0.13% 0 PI MATM Aging Pr183 2559 2062 1241 0.15% 0.03% 0.00% 1 Virtual Exec214 9467 20611 459 0.15% 0.01% 0.00% 0 Marvell wk-a Pow 92 91428 9224 9911 0.15% 0.23% 0.30% 0 hpm counter proc 89 316788 218111 1452 0.15% 0.24% 0.39% 0 hpm main process 7 0 1 0 0.00% 0.00% 0.00% 0 Image Licensing 6 0 2 0 0.00% 0.00% 0.00% 0 Timers 5 0 1 0 0.00% 0.00% 0.00% 0 Pool Manager 8 0 2 0 0.00% 0.00% 0.00% 0 License Client N 9 3714 32 116062 0.00% 0.01% 0.00% 0 Licensing Auto U 13 0 1 0 0.00% 0.00% 0.00% 0 AAA_SERVER_DEADT 10 0 1 0 0.00% 0.00% 0.00% 0 Crash writer 2 24 1878 12 0.00% 0.00% 0.00% 0 Load Meter 16 9 5 1800 0.00% 0.00% 0.00% 0 Entity MIB API<output omitted>
Switch Performance Issue 2 – Cont.Next, observe the positive results in the output of the show processes cpu sorted command and confirm with the users that they are no longer experiencing problems.

Chapter 798© 2007 – 2010, Cisco Systems, Inc. All rights reserved. Cisco Public
Troubleshooting Performance Issues on Routers

Chapter 799© 2007 – 2010, Cisco Systems, Inc. All rights reserved. Cisco Public
Troubleshooting High Router CPU Load The CPU on a router can become too busy when there are
too many packets to forward or excessive management and control plane processes.
In some cases, high CPU utilization is normal and does not cause network problems. Utilization may be high for short periods due to a burst of network management requests or expected peaks of network traffic.
If CPU utilization is consistently very high and packet forwarding or process performance on the router performance degrades, it is usually considered to be a problem and needs to be investigated.
When the router CPU is too busy to forward all packets as they arrive, the router may start to buffer packets, increasing latency, or even drop packets.
Chapter 7100© 2007 – 2010, Cisco Systems, Inc. All rights reserved. Cisco Public
Troubleshooting High Router CPU Load – Cont. Common symptoms of a router CPU that is too busy is that
the router fails to respond to certain service requests. In those situations, the router might exhibit the following
behaviors:• Slow response to Telnet requests or to the commands that are issued
in active Telnet sessions• Slow response to commands issued on the console• High latency on ping responses or too many ping timeouts• Failure to send routing protocol packets to other routers

Chapter 7101© 2007 – 2010, Cisco Systems, Inc. All rights reserved. Cisco Public
Router# show arpProtocol Address Age (min) Hardware Addr Type InterfaceInternet 10.10.10.1 - 0013.1918.caae ARPA FastEthernet0/0Internet 10.16.243.249 0 Incomplete ARPAInternet 10.16.243.250 0 Incomplete ARPAInternet 10.16.243.251 0 Incomplete ARPAInternet 10.16.243.252 0 Incomplete ARPAInternet 10.16.243.253 0 Incomplete ARPAInternet 10.16.243.254 0 Incomplete ARPA
High Router CPU Load: ARP Input The ARP Input process causes high CPU loads if the router
originates excessive ARP requests. This can happen if an IP route has been configured pointing to a
broadcast interface and causes the router to generate an ARP request for each IP address that is not reachable through a more specific route.
A high number of incomplete ARP entries in the ARP table can indicate this type of traffic, as shown in the example.

Chapter 7102© 2007 – 2010, Cisco Systems, Inc. All rights reserved. Cisco Public
High Router CPU Load: Net Background, IP Background and TCP Timer processes Net Background:
• The Net Background process runs when a buffer is required but is not available to a process or an interface.
• Net Background also manages the memory used by each process and cleans up freed-up memory.
IP Background: • This process is responsible for:
• Encapsulation type changes on an interface• Move of an interface to a new state (up or down)• Change of IP address on an interface.• Modifying the routing table based on status of the interfaces• Notifies all routing protocols of the status change of each IP interface
TCP Timer:• The TCP Timer process is responsible for TCP sessions running on the router.• The uses of a lot of CPU resources by this process indicates too many TCP
connections (such as BGP peers).
Chapter 7103© 2007 – 2010, Cisco Systems, Inc. All rights reserved. Cisco Public
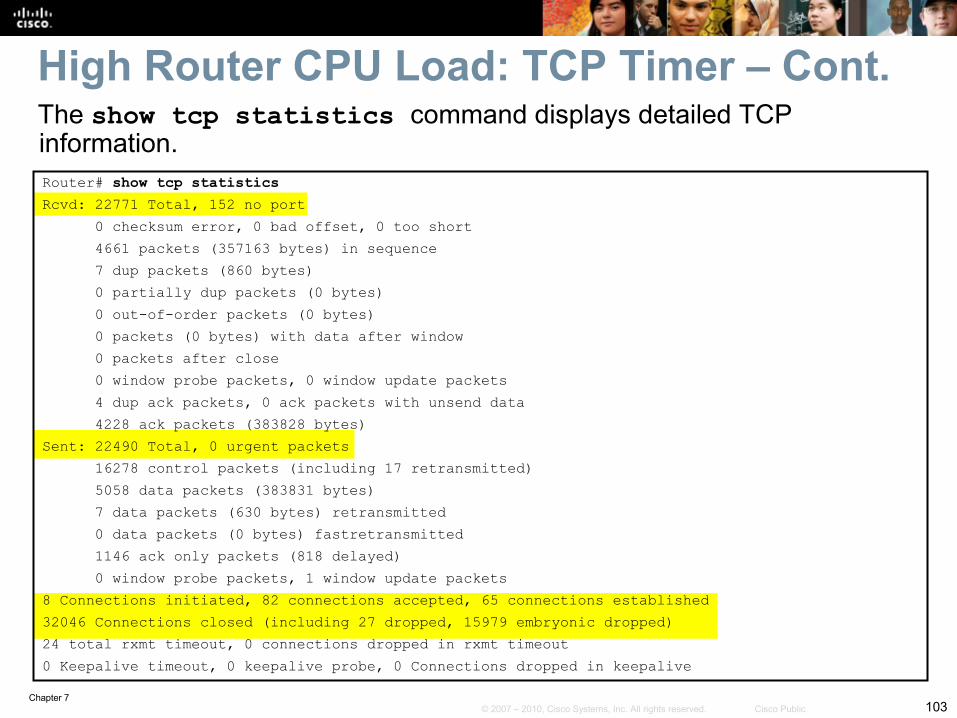
Router# show tcp statisticsRcvd: 22771 Total, 152 no port 0 checksum error, 0 bad offset, 0 too short 4661 packets (357163 bytes) in sequence 7 dup packets (860 bytes) 0 partially dup packets (0 bytes) 0 out-of-order packets (0 bytes) 0 packets (0 bytes) with data after window 0 packets after close 0 window probe packets, 0 window update packets 4 dup ack packets, 0 ack packets with unsend data 4228 ack packets (383828 bytes)Sent: 22490 Total, 0 urgent packets 16278 control packets (including 17 retransmitted) 5058 data packets (383831 bytes) 7 data packets (630 bytes) retransmitted 0 data packets (0 bytes) fastretransmitted 1146 ack only packets (818 delayed) 0 window probe packets, 1 window update packets8 Connections initiated, 82 connections accepted, 65 connections established32046 Connections closed (including 27 dropped, 15979 embryonic dropped)24 total rxmt timeout, 0 connections dropped in rxmt timeout0 Keepalive timeout, 0 keepalive probe, 0 Connections dropped in keepalive
High Router CPU Load: TCP Timer – Cont.The show tcp statistics command displays detailed TCP information.

Chapter 7104© 2007 – 2010, Cisco Systems, Inc. All rights reserved. Cisco Public
Router# show processes cpu sortedCPU utilization for five seconds: 72%/23%; one minute: 74%; five minutes: 71%PID Runtime(ms) Invoked uSecs 5Sec 1Min 5Min TTY Process 62 3218415936 162259897 8149 65.08% 72.01% 68.00% 0 IP Input183 47280 35989616 1 0.16% 0.08% 0.08% 0 RADIUS 47 432 223 2385 0.24% 0.03% 0.06% 0 SSH Process 2 9864 232359 42 0.08% 0.00% 0.00% 0 Load Meter 61 6752 139374 48 0.08% 0.00% 0.00% 0 CDP Protocol 33 14736 1161808 12 0.08% 0.01% 0.00% 0 Per-Second Jobs 73 12200 4538259 2 0.08% 0.01% 0.00% 0 SSS Feature Time<output omitted>
High Router CPU Load – Cont. In the output shown in the example, the CPU utilization for the last 5
seconds was 72%. Out of this total of 72%, 23% of the CPU time was spent in interrupt
mode (switching packets) Use the show processes cpu history command to see the CPU
utilization for the last 60 seconds, 60 minutes, and 72 hours in an ASCII graphical view.
Chapter 7105© 2007 – 2010, Cisco Systems, Inc. All rights reserved. Cisco Public
Troubleshooting Switching Paths Different router platforms have different switching behavior.
The task of packet forwarding (data plane) consists of two steps:
Step 1. Making a routing decision (based on): • Network topology information and configured policies• Information about network destinations, gathered by a routing protocol• Possible restrictions (access lists or policy-based routing (PBR)
Step 2. Switching the packet: • Not to be confused with Layer 2 switching• Involves moving a packet from an input buffer to an output buffer• Rewriting the data link layer header of the frame• Forwards the packet to the next hop toward the final destination.

Chapter 7106© 2007 – 2010, Cisco Systems, Inc. All rights reserved. Cisco Public
The example shows sample output from the show ip interface command after disabling the default Cisco Express Forwarding packet switching mode using the no ip cef command.
In the output, it can be seen that fast switching is enabled for all packets (except for packets that are sent back to the same interface that they came in on), but CEF switching is disabled.
Router# show ip interface Gi0/0GigabitEthernet0/0 is up, line protocol is up<output omitted>IP fast switching is enabledIP fast switching on the same interface is disabledIP Flow switching is disabledIP CEF switching is disabledIP Fast switching turbo vectorIP multicast fast switching is enabledIP multicast distributed fast switching is disabledIP route-cache flags are Fast<output omitted>
Troubleshooting Switching Paths – Cont.

Chapter 7107© 2007 – 2010, Cisco Systems, Inc. All rights reserved. Cisco Public
Router# show ip interface Gi0/0GigabitEthernet0/0 is up, line protocol is up<output omitted> IP fast switching is disabled IP fast switching on the same interface is disabled IP Flow switching is disabled IP CEF switching is disabled IP Fast switching turbo vector IP multicast fast switching is enabled IP multicast distributed fast switching is disabled IP route-cache flags are Fast<output omitted>
If you turn fast switching off too, using the command no ip route-cache, and repeat the show ip interface command, the output will look similar to the one shown in this example.
Multicast fast switching is still enabled. This is because IP multicast routing is configured separate from IP unicast routing.
The no ip route-cache command only applies to unicast packets. To disable fast switching for multicast packets use the no ip mroute
command.
Troubleshooting Switching Paths – Cont.
Chapter 7108© 2007 – 2010, Cisco Systems, Inc. All rights reserved. Cisco Public
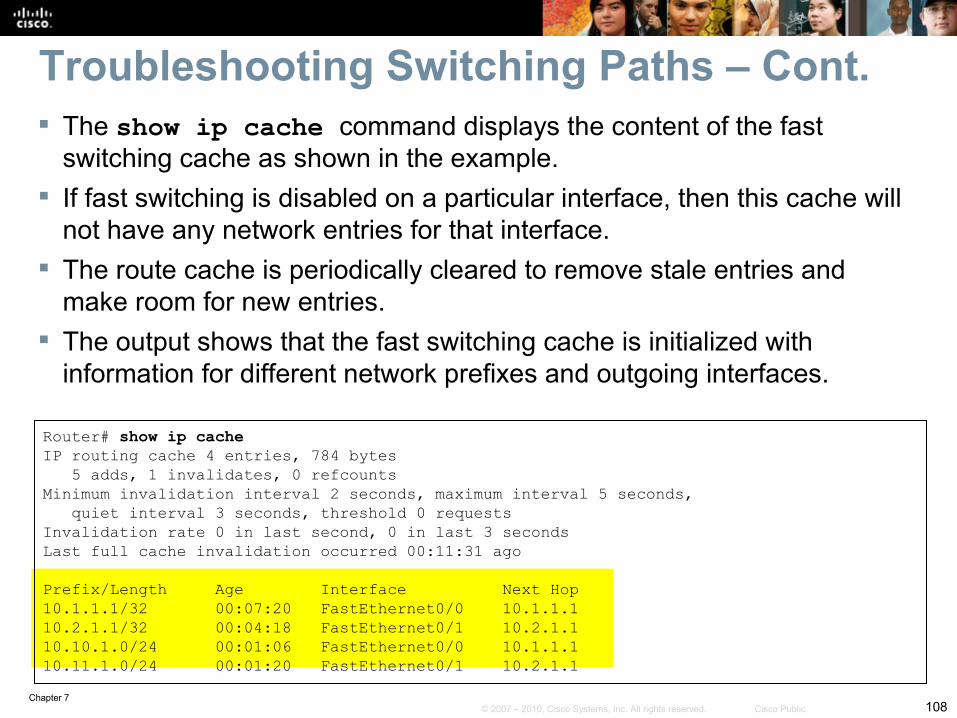
Router# show ip cacheIP routing cache 4 entries, 784 bytes 5 adds, 1 invalidates, 0 refcountsMinimum invalidation interval 2 seconds, maximum interval 5 seconds, quiet interval 3 seconds, threshold 0 requestsInvalidation rate 0 in last second, 0 in last 3 secondsLast full cache invalidation occurred 00:11:31 ago Prefix/Length Age Interface Next Hop10.1.1.1/32 00:07:20 FastEthernet0/0 10.1.1.110.2.1.1/32 00:04:18 FastEthernet0/1 10.2.1.110.10.1.0/24 00:01:06 FastEthernet0/0 10.1.1.110.11.1.0/24 00:01:20 FastEthernet0/1 10.2.1.1
The show ip cache command displays the content of the fast switching cache as shown in the example.
If fast switching is disabled on a particular interface, then this cache will not have any network entries for that interface.
The route cache is periodically cleared to remove stale entries and make room for new entries.
The output shows that the fast switching cache is initialized with information for different network prefixes and outgoing interfaces.
Troubleshooting Switching Paths – Cont.

Chapter 7109© 2007 – 2010, Cisco Systems, Inc. All rights reserved. Cisco Public
Router# show ip interface GigabitEthernet 0/0GigabitEthernet0/0 is up, line protocol is up<output omitted> IP fast switching is enabled IP fast switching on the same interface is disabled IP Flow switching is disabled IP CEF switching is disabled IP Fast switching turbo vector IP multicast fast switching is enabled IP multicast distributed fast switching is disabled IP route-cache flags are Fast<output omitted>
CEF builds two main data structures: the FIB and the adjacency table.
When troubleshooting CEF check both tables and correlate entries between them.• Is Cisco Expresss Forwarding enabled globally and per interface?• Is there a FIB entry for a given network destination?• Is there a next-hop associated with this entry?• Is there an adjacency entry for this next-hop?
Troubleshooting CEF

Chapter 7110© 2007 – 2010, Cisco Systems, Inc. All rights reserved. Cisco Public
Router# show ip cefPrefix Next Hop Interface0.0.0.0/0 10.14.14.19 GigabitEthernet0/00.0.0.0/32 receive 10.14.14.0/24 attached GigabitEthernet0/010.14.14.0/32 receive <output omitted>10.14.14.252/32 receive224.0.0.0/4 drop224.0.0.0/24 receive255.255.255.255/32 receive
If CEF is enabled, output similar to that shown will be displayed using the show ip cef command.
All directly connected networks in the output are marked as “attached” in the “next-hop” field.
Network prefixes that are local to the router are marked as “receive”. The command does not display the interfaces on which CEF is explicitly
disabled. This router uses output interface Gi0/0 and next-hop 10.14.14.19 to
reach 0.0.0.0/0 (the default route).
Troubleshooting CEF – Cont.

Chapter 7111© 2007 – 2010, Cisco Systems, Inc. All rights reserved. Cisco Public
Troubleshooting CEF – Cont.Router# show ip cef adjacency GigabitEthernet0/0 10.14.14.19 detail IP CEF with switching (Table Version 24), flags=0x0 23 routes, 0 reresolve, 0 unresolved (0 old, 0 new), peak 0 2 instant recursive resolutions, 0 used background process 28 leaves, 22 nodes, 26516 bytes, 79 inserts, 51 invalidations 0 load sharing elements, 0 bytes, 0 references universal per-destination load sharing algorithm, id 56F4BAB5 4(1) CEF resets, 2 revisions of existing leaves Resolution Timer: Exponential (currently 1s, peak 1s) 1 in-place/0 aborted modifications refcounts: 6223 leaf, 6144 node Table epoch: 0 (23 entries at this epoch)Adjacency Table has 13 adjacencies0.0.0.0/0, version 22, epoch 0, cached adjacency 10.14.14.190 packets, 0 bytes via 10.14.14.19, 0 dependencies, recursive next hop 10.14.14.19, GigabitEthernet0/0 via 10.14.14.19/32 valid cached adjacency10.14.14.19/32, version 11, epoch 0, cached adjacency 10.14.14.190 packets, 0 bytes via 10.14.14.19, GigabitEthernet0/0, 1 dependency next hop 10.14.14.19, GigabitEthernet0/0 valid cached adjacency

Chapter 7112© 2007 – 2010, Cisco Systems, Inc. All rights reserved. Cisco Public
Router# show adjacency GigabitEthernet 0/0 detail | begin 10.14.14.19Protocol Interface AddressIP GigabitEthernet0/0 10.14.14.9(5) 0 packets, 0 bytes 001200A2BC41001BD5F9E7C00800 ARP 03:19:39 Epoch: 0Router# show ip arp 10.14.14.19Protocol Address Age (min) Hardware Addr Type InterfaceInternet 10.14.14.19 4 0012.009a.0c42 ARPA GigabitEthernet0/0
To see the adjacency table entries for this next hop, use the show adjacency command.
The output shows the full Layer 2 frame header associated with this next hop, which has been built through ARP.
The Layer 2 MAC address for this next-hop IP address can also be checked in the ARP cache using the show ip arp command for the specific 10.14.14.19 address.
Troubleshooting CEF – Cont.
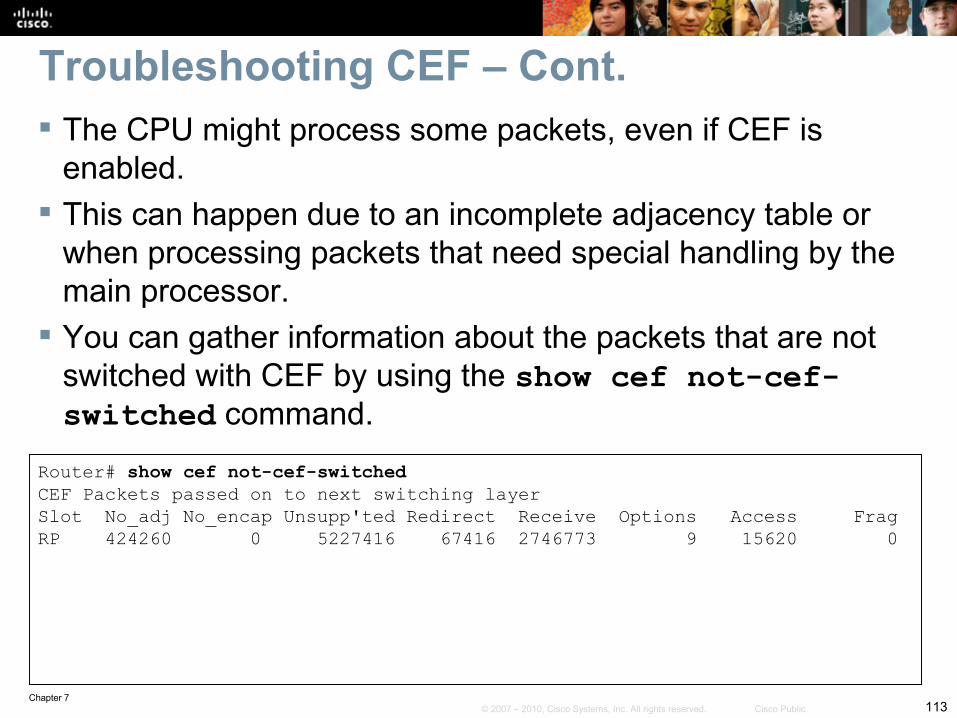
Chapter 7113© 2007 – 2010, Cisco Systems, Inc. All rights reserved. Cisco Public
Router# show cef not-cef-switched CEF Packets passed on to next switching layerSlot No_adj No_encap Unsupp'ted Redirect Receive Options Access FragRP 424260 0 5227416 67416 2746773 9 15620 0
The CPU might process some packets, even if CEF is enabled.
This can happen due to an incomplete adjacency table or when processing packets that need special handling by the main processor.
You can gather information about the packets that are not switched with CEF by using the show cef not-cef-switched command.
Troubleshooting CEF – Cont.

Chapter 7114© 2007 – 2010, Cisco Systems, Inc. All rights reserved. Cisco Public
IOS Tools to Analyze Packet Forwarding
This step-by-step CEF troubleshooting example is based on the network topology shown in the figure.
The actual routers used for command outputs in this example do not have any problems.

Chapter 7115© 2007 – 2010, Cisco Systems, Inc. All rights reserved. Cisco Public
R1# traceroute 10.11.1.1Type escape sequence to abort.Tracing the route to 10.11.1.1 1 10.1.1.2 72 msec 56 msec 64 msec 2 10.2.1.1 76 msec 104 msec *
Use the traceroute utility to identify the problematic router along the path.
Although the output seems normal, suppose that the traceroute command would have shown a much higher delay or packet loss on router R2 compared to router R3.
Such symptoms can lead you to suspect problems in router R2.
Analyzing Packet Forwarding: Step 1
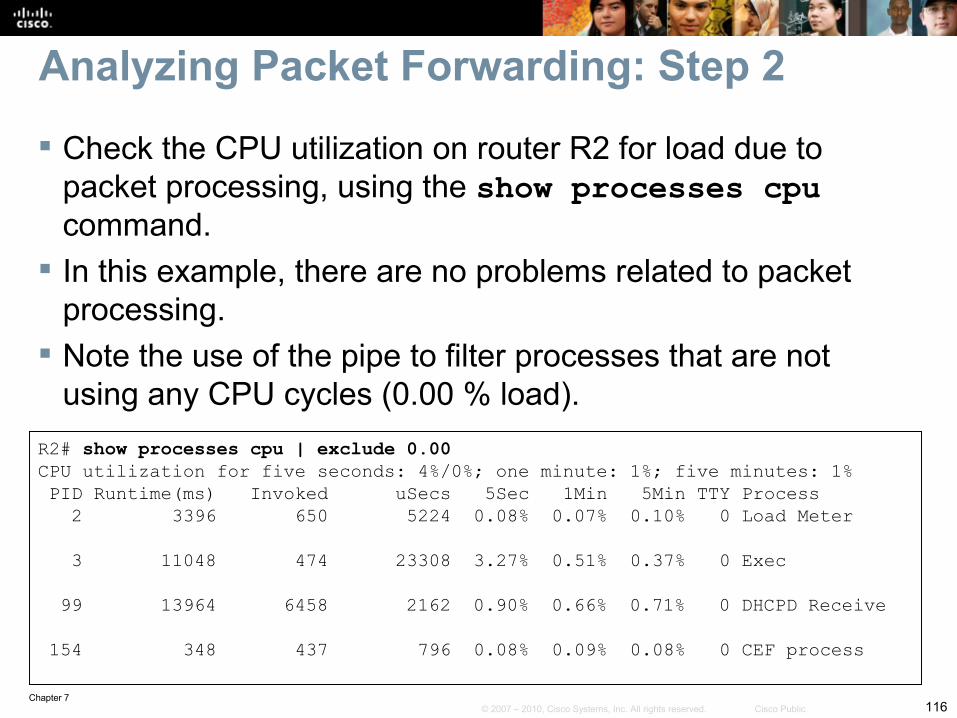
Chapter 7116© 2007 – 2010, Cisco Systems, Inc. All rights reserved. Cisco Public
R2# show processes cpu | exclude 0.00CPU utilization for five seconds: 4%/0%; one minute: 1%; five minutes: 1% PID Runtime(ms) Invoked uSecs 5Sec 1Min 5Min TTY Process 2 3396 650 5224 0.08% 0.07% 0.10% 0 Load Meter 3 11048 474 23308 3.27% 0.51% 0.37% 0 Exec 99 13964 6458 2162 0.90% 0.66% 0.71% 0 DHCPD Receive 154 348 437 796 0.08% 0.09% 0.08% 0 CEF process
Check the CPU utilization on router R2 for load due to packet processing, using the show processes cpu command.
In this example, there are no problems related to packet processing.
Note the use of the pipe to filter processes that are not using any CPU cycles (0.00 % load).
Analyzing Packet Forwarding: Step 2
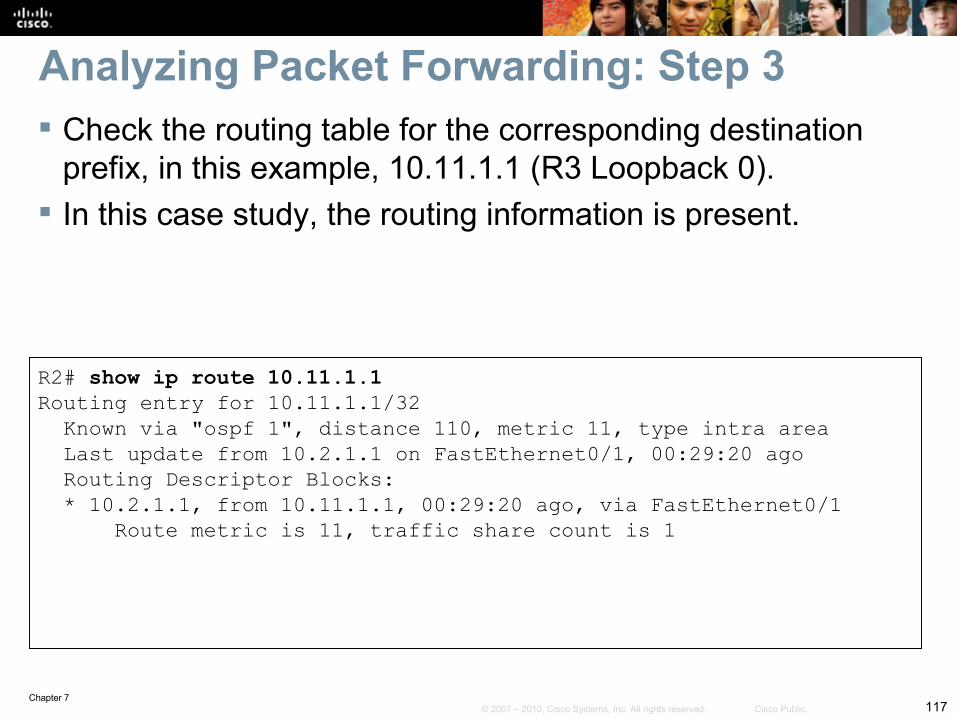
Chapter 7117© 2007 – 2010, Cisco Systems, Inc. All rights reserved. Cisco Public
R2# show ip route 10.11.1.1Routing entry for 10.11.1.1/32 Known via "ospf 1", distance 110, metric 11, type intra area Last update from 10.2.1.1 on FastEthernet0/1, 00:29:20 ago Routing Descriptor Blocks: * 10.2.1.1, from 10.11.1.1, 00:29:20 ago, via FastEthernet0/1 Route metric is 11, traffic share count is 1
Check the routing table for the corresponding destination prefix, in this example, 10.11.1.1 (R3 Loopback 0).
In this case study, the routing information is present.
Analyzing Packet Forwarding: Step 3

Chapter 7118© 2007 – 2010, Cisco Systems, Inc. All rights reserved. Cisco Public
Analyzing Packet Forwarding: Step 4
R2# show ip cefPrefix Next Hop Interface0.0.0.0/0 drop Null0 (default route handler entry)0.0.0.0/32 receive10.1.1.0/24 attached FastEthernet0/010.1.1.0/32 receive10.1.1.1/32 10.1.1.1 FastEthernet0/010.1.1.2/32 receive10.1.1.255/32 receive10.2.1.0/24 attached FastEthernet0/110.2.1.0/32 receive10.2.1.1/32 10.2.1.1 FastEthernet0/110.2.1.2/32 receive10.2.1.255/32 receive10.10.1.1/32 10.1.1.1 FastEthernet0/010.11.1.1/32 10.2.1.1 FastEthernet0/1224.0.0.0/4 drop224.0.0.0/24 receive255.255.255.255/32 receive
Determine which switching mode is used by the router and the interfaces involved in packet forwarding. Use the show ip cef command to see if CEF is enabled.

Chapter 7119© 2007 – 2010, Cisco Systems, Inc. All rights reserved. Cisco Public
R2# show ip interface FastEthernet 0/0 | include CEF IP CEF switching is enabled IP CEF Fast switching turbo vector IP route-cache flags are Fast, CEF R2# show ip interface FastEthernet 0/1 | include CEF IP CEF switching is enabled IP CEF Fast switching turbo vector IP route-cache flags are Fast, CEF
Use the show ip interface for each interface to see what type of switching is operational on it.
In this case study, CEF is enabled globally and all involved interfaces are enabled for CEF switching.
Analyzing Packet Forwarding: Step 4 – Cont.

Chapter 7120© 2007 – 2010, Cisco Systems, Inc. All rights reserved. Cisco Public
R2# show ip cef 10.11.1.1 255.255.255.255 10.11.1.1/32, version 13, epoch 0, cached adjacency 10.2.1.10 packets, 0 bytes via 10.2.1.1, FastEthernet0/1, 0 dependencies next hop 10.2.1.1, FastEthernet0/1 valid cached adjacency
Check the FIB entry for the routing information under investigation (in this case, 10.11.1.1
The related adjacency entry shows interface FastEthernet0/1 with next hop 10.2.1.1.
Analyzing Packet Forwarding: Step 5

Chapter 7121© 2007 – 2010, Cisco Systems, Inc. All rights reserved. Cisco Public
R2# show adjacency FastEthernet0/1 detail Protocol Interface AddressIP FastEthernet0/1 10.2.1.1(7) 203 packets, 307342 bytes C40202640000C4010F5C00010800 ARP 02:57:43 Epoch: 0
Check the adjacency table for the next-hop value of the destination you are investigating.
Use the show adjacency command to discover the layer 2 value for the next hop.
In this case, the relevant adjacency is built using ARP.
Analyzing Packet Forwarding: Step 6
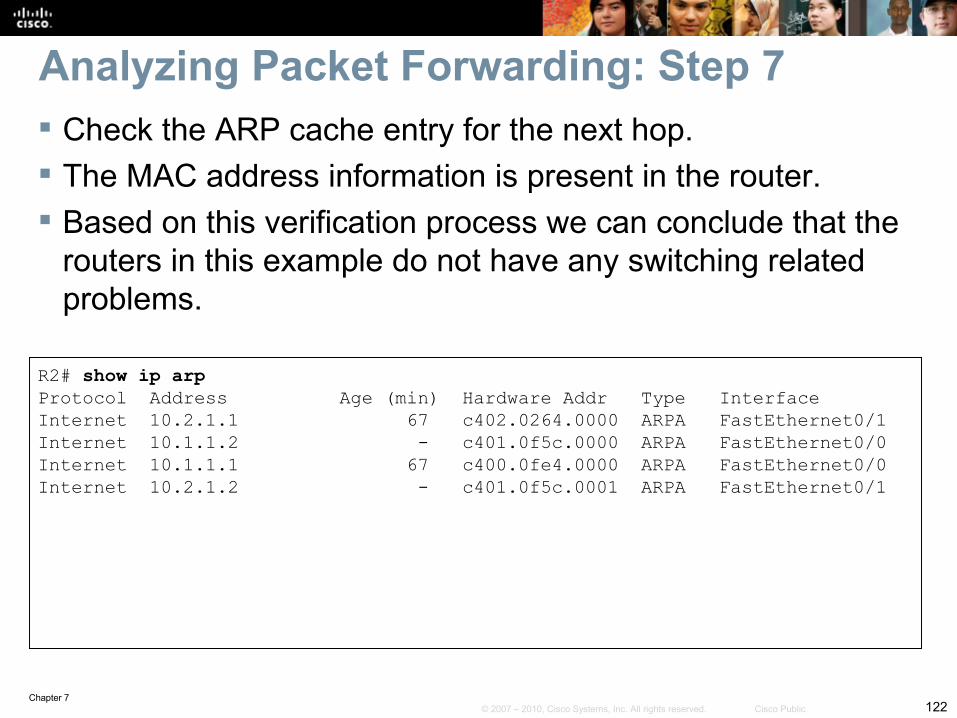
Chapter 7122© 2007 – 2010, Cisco Systems, Inc. All rights reserved. Cisco Public
R2# show ip arp Protocol Address Age (min) Hardware Addr Type InterfaceInternet 10.2.1.1 67 c402.0264.0000 ARPA FastEthernet0/1Internet 10.1.1.2 - c401.0f5c.0000 ARPA FastEthernet0/0Internet 10.1.1.1 67 c400.0fe4.0000 ARPA FastEthernet0/0Internet 10.2.1.2 - c401.0f5c.0001 ARPA FastEthernet0/1
Check the ARP cache entry for the next hop. The MAC address information is present in the router. Based on this verification process we can conclude that the
routers in this example do not have any switching related problems.
Analyzing Packet Forwarding: Step 7

Chapter 7123© 2007 – 2010, Cisco Systems, Inc. All rights reserved. Cisco Public
Troubleshooting Router Memory Issues Memory-allocation failure is the most common router
memory issue. This occurs when a router uses all available memory or the
memory has been fragmented into small pieces. This can happen to processor memory or packet memory. Symptoms of memory allocation failures include:
• Messages display in the router logs, such as: %SYS–2–MALLOCFAIL: Memory allocation of 1028 bytes failed from 0x6015EC84, Pool Processor, alignment 0.
• show commands generate no output.• Receiving Low on memory messages.• Receiving the message Unable to create EXEC – no memory or too many processes on the console.

Chapter 7124© 2007 – 2010, Cisco Systems, Inc. All rights reserved. Cisco Public
Troubleshooting Router Memory Issues When router memory is low, it may not be possible to Telnet
to the router. If possible, connect to the console port to collect data for
troubleshooting. If you receive an error message there is not enough
available memory to allow for a console connection.

Chapter 7125© 2007 – 2010, Cisco Systems, Inc. All rights reserved. Cisco Public
Troubleshooting Router Memory Issues – Cont.Problem: Memory size does not support the Cisco IOS Software image.One cause of memory problems is inadequate memory to support the Cisco IOS Software image.Check the Release Notes or IOS Upgrade Planner for the memory requirements for the Cisco IOS Software feature set and version you are running.The actual memory requirements will vary based on:
• Protocols used• Routing tables• Traffic patterns on the network

Chapter 7126© 2007 – 2010, Cisco Systems, Inc. All rights reserved. Cisco Public
Troubleshooting Router Memory Issues – Cont.Problem: Memory-leak bug The show memory allocating-process totals
command can help identify memory used and free, and the per-process memory utilization of the router.
Memory leaks are caused by bugs in the Cisco IOS code. The solution is to upgrade the Cisco IOS Software to a
version that fixes the issue.
Router# show memory allocating-process totalsHead Total (b) Used(b) Free(b) Lowest(b) Largest(b)Processor 62A2B2D0 183323952 26507580 156816372 155132764 154650100I/0 ED900000 40894464 4957092 35937372 35887920 3590524Allocator PC Summary for: ProcessorPC Total Count Name0x6136A5A8 5234828 1 Init0x608E2208 3576048 812 TTY data0x6053ECEC 1557568 184 Process Stack0x61356928 1365448 99 Init<output omitted>
Chapter 7127© 2007 – 2010, Cisco Systems, Inc. All rights reserved. Cisco Public
Troubleshooting Router Memory Issues – Cont.Problem: Security-relatedMALLOCFAIL errors can also be caused by a security issue.This is more likely if there have not been any recent changes to the network, such as router IOS upgrades or configuration changes.Mitigate can include adding an access list that drops the traffic generated by the worm or virus.The Cisco Product Security Advisories and Notices page contains information on detection of the most likely causes and specific workarounds.

Chapter 7128© 2007 – 2010, Cisco Systems, Inc. All rights reserved. Cisco Public
Troubleshooting Router Memory Issues – Cont.Problem: Memory-allocation failure at process = interrupt level. The error message identifies the cause.If the process is listed as <interrupt level>, as shown in the message that follows, the memory-allocation failure is being caused by a software problem:%SYS–2–MALLOCFAIL: Memory allocation of 68 bytes failed from 0x604CEF48, pool Processor, alignment 0–Process= <interrupt level>, ipl= 3
You can use the Bug Toolkit to search for a matching software bug ID (unique bug identification) for this issue.After you have identified the bug, upgrade to a Cisco IOS Software version that contains the fix to resolve the problem.

Chapter 7129© 2007 – 2010, Cisco Systems, Inc. All rights reserved. Cisco Public
Troubleshooting Router Memory Issues – Cont.Problem: Buffer-leak bug The buffer pool continues to grow as more and more
packets are stuck in the buffers. The show interfaces command displays statistics for
all interfaces configured on the router. The output indicates that the interface input queue is
wedged, which is a symptom of buffer leak.
Router# show interfaces<output omitted>ARP type: ARPA, ARP Timeout 04:00:00 Last input 00:00:58, output never, output hang never Last clearing of "show interface" counters never input queue 76/75, 1250 drops Output queue 0/40, 0 drops;<output omitted>
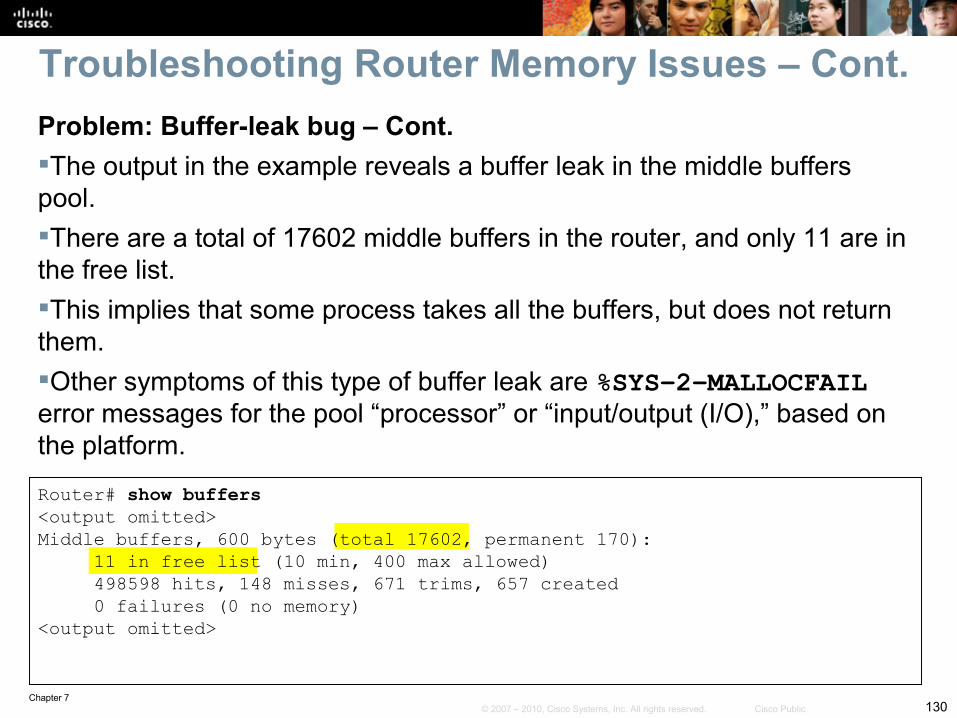
Chapter 7130© 2007 – 2010, Cisco Systems, Inc. All rights reserved. Cisco Public
Router# show buffers<output omitted>Middle buffers, 600 bytes (total 17602, permanent 170): 11 in free list (10 min, 400 max allowed) 498598 hits, 148 misses, 671 trims, 657 created 0 failures (0 no memory)<output omitted>
Problem: Buffer-leak bug – Cont.The output in the example reveals a buffer leak in the middle buffers pool. There are a total of 17602 middle buffers in the router, and only 11 are in the free list.This implies that some process takes all the buffers, but does not return them.Other symptoms of this type of buffer leak are %SYS–2–MALLOCFAIL error messages for the pool “processor” or “input/output (I/O),” based on the platform.
Troubleshooting Router Memory Issues – Cont.

Chapter 7131© 2007 – 2010, Cisco Systems, Inc. All rights reserved. Cisco Public
Troubleshooting Router Memory Issues – Cont.Problem: BGP Memory Use Cisco IOS has three main processes used by BGP:BGP I/O:
• Handles reading, writing, and executing of all BGP messages.• Acts as the interface between TCP and BGP.
BGP router:• Responsible for initiation of a BGP process, session maintenance,
processing of incoming updates, sending of BGP updates, and updating the IP RIB (Routing Information Base) with BGP entries.
• This process consumes the majority of the memory used by BGP.• Uses memory to store the BGP RIB, IP RIB for BGP prefixes, and IP
switching data structures for BGP prefixes.• If there is not enough memory to store this information, BGP cannot
operate in a stable manner, and network reliability will be compromised.

Chapter 7132© 2007 – 2010, Cisco Systems, Inc. All rights reserved. Cisco Public
Troubleshooting Router Memory Issues – Cont.Problem: BGP Memory Use Cisco IOS has three main processes used by BGP:BGP scanner:
• Performs periodic scans of the BGP RIB to update it as necessary.• Scans the IP RIB to ensure that all BGP next hops are valid.

Chapter 7133© 2007 – 2010, Cisco Systems, Inc. All rights reserved. Cisco Public
Troubleshooting Router Memory Issues – Cont.Problem: BGP Memory Use – Cont. Chassis-based routers distribute routing information to line cards. The show diag command displays the different types of cards present in
your router and their respective amounts of memory. This command is useful to identify a lack of memory on the line cards
when the router runs BGP.
Router# show diag | I (DRAM|SLOT)SLOT 0 (RP/LC 0 ): 1 Port SONET based SRP OC-12c/STM-4 Single Mode DRAM size: 268435456 bytes FrFab SDRAM size: 134217728 bytes, SDRAM pagesize: 8192 bytes ToFab SDRAM size: 134217728 bytes, SDRAM pagesize: 8192 bytesSLOT 2 (RP/LC 2 ): 12 Port Packet over E3 DRAM size: 67108864 bytes FrFab SDRAM size: 67108864 bytes ToFab SDRAM size: 67108864 bytesSLOT 3 (RP/LC 3 ): 1 Port Gigabit Ethernet DRAM size: 134217728 bytes FrFab SDRAM size: 134217728 bytes, SDRAM pagesize: 8192 bytes ToFab SDRAM size: 134217728 bytes, SDRAM pagesize: 8192 bytesSLOT 5 (RP/LC 5 ): Route Processor DRAM size: 268435456 bytes

Chapter 7134© 2007 – 2010, Cisco Systems, Inc. All rights reserved. Cisco Public
Top Related