


Languages
Pages
Legal

Chapter 4
Petroleum Assessment of the Pottsville Coal Total Petroleum System, Black Warrior Basin, Alabama and Mississippi
By Joseph R. Hatch and Mark J. Pawlewicz
U.S. Geological Survey Digital Data Series DDS–69–I
U.S. Department of the Interior U.S. Geological Survey
Chapter 4 ofGeologic Assessment of Undiscovered Oil and Gas Resources of the Black Warrior Basin Province, Alabama and Mississippi
Compiled by Joseph R. Hatch and Mark J. Pawlewicz
Volume Title Page

U.S. Department of the Interior DIRK KEMPTHORNE, Secretary
U.S. Geological Survey Mark D. Myers, Director
U.S. Geological Survey, Reston, Virginia: 2007
For product and ordering information: World Wide Web: http://www.usgs.gov/pubprod Telephone: 1–888–ASK–USGS
For more information on the USGS—the Federal source for science about the Earth, its natural and living resources, natural hazards, and the environment: World Wide Web: http://www.usgs.gov Telephone:1–888–ASK–USGS
Any use of trade, product, or firm names is for descriptive purposes only and does not imply endorsement by the U.S. Government.
Although this report is in the public domain, permission must be secured from the individual copyright owners to reproduce any copyrighted materials contained within this report.
Suggested citation: Hatch, Joseph, R., and Pawlewicz, Mark J., 2007, Petroleum assessment of the Pottsville Coal Total Petroleum System, Black War-rior Basin, Alabama and Mississippi, in Hatch, Joseph R., and Pawlewicz, Mark J., compilers, Geologic assessment of undiscovered oil and gas resources of the Black Warrior Basin Province, Alabama and Mississippi: U.S. Geological Survey Digital Data Series DDS–69–I, chap. 4, 28 p.
ISBN 1-411-31775-0

Contents
Overview..........................................................................................................................................................1Geologic Setting .............................................................................................................................................2
Stratigraphic and Sedimentological Framework .............................................................................2Structural Framework ..........................................................................................................................5
Appalachian Folds and Thrust Faults .......................................................................................5Pottsville Formation Fracture Systems ....................................................................................8
Hydrocarbon Source-Rock Characterization ..........................................................................................12Organic Carbon Contents—Organic Facies ...................................................................................12Organic Matter Thermal Maturity ....................................................................................................12
Thermal Maturity Modeling .....................................................................................................12Produced Water Chemistry ........................................................................................................................14Natural Gas Chemistry ................................................................................................................................15Black Warrior Basin Assessment Unit .....................................................................................................18
Gas and Water Production ...............................................................................................................18Historical Production ...............................................................................................................18Drilling Practices........................................................................................................................20Cumulative Gas and Water Production .................................................................................20Well Production Controls ..........................................................................................................21
Assessment Results ...........................................................................................................................24References Cited..........................................................................................................................................24
Figures
1. Map showing location of the Pottsville Coal Total Petroleum System and the Black Warrior Basin Assessment Unit ........................................................................................................................12. Petroleum system events chart ...........................................................................................................23. Generalized elevation contour map of the unconformity separating the Pennsylvanian Pottsville Formation and Upper Cretaceous strata in the southeastern part of the Black Warrior Basin ........................................................................................................................................34. Stratigraphy of the upper part of the Pennsylvanian Pottsville Formation ...................................45. Cross section showing idealized depositional cycle in the Pennsylvanian Pottsville Formation, Black Warrior Basin ………………………………………………………… 56. Generalized isopach map of the Ream through Gwin coal zones, Pennsylvanian Pottsville Formation ...............................................................................................................................................77. Generalized map showing net coal isoliths in the upper part of the Pennsylvanian Pottsville Formation in the southeastern part of Black Warrior Basin .........................................................78. Generalized structural contour map of the top of the Pratt coal zone ..........................................8
iii

9. Photograph of a small normal fault and associated fracturing ....................................................910. Photograph of jointed shale above the Gwin coal zone ................................................................911. Photograph of a bedding plane exposure of a cleat system in Alabama coal ........................1012. Generalized map showing joint (A), and cleat (B) systems in the southeastern part of the Black Warrior Basin ........................................................................................................................1113. Stacked bar histogram showing distribution of hydrogen indices for 16 shale samples and 23 coal samples from the Pennsylvanian Pottsville Formation ................................................1314. Generalized map showing vitrinite reflectance (Ro) and rank of coals in the Mary Lee coal zone, Pennsylvanian Pottsville Formation....................................................................................1315. Plot showing relation between burial history and thermal gas generation in the Pennsylvanian Pottsville Formation in the Shell Holiman #13-16 well in Pickens County, Alabama .............................................................................................................................................1416. Stiff diagrams showing composition of formation water produced from the Pennsylvanian Pottsville Formation in the southeastern part of the Black Warrior Basin .............................1517. Generalized map showing relation of freshwater plumes in the Mary Lee coal zone, Pennsylvanian Pottsville Formation, to geologic structure and Upper Cretaceous strata, along the southeast margin of the Black Warrior Basin ...........................................................1618. Generalized structural cross section showing meteoric recharge areas and subsurface flow patterns in the upper part of the Pennsylvanian Pottsville Formation ...........................1619. Generalized map showing distribution of gas wetness for samples of coal gas from the Pennsylvanian Pottsville Formation in the southeastern part of the Black Warrior Basin ...................................................................................................................................................1720. Generalized map showing locations and status of coal degasification fields in the southeastern part of the Black Warrior Basin ............................................................................1921. Histograms of coal-gas and water production (A) and new well permits and producing wells (B) in the southeastern part of the Black Warrior Basin ................................................1922. Generalized map showing cumulative gas production from vertical wells in the southeastern part of the Black Warrior Basin ............................................................................2023. Generalized map showing cumulative water production from vertical wells in the southeastern part of the Black Warrior Basin ............................................................................2124. Generalized map showing alignment of exceptionally productive gas wells along a synclinal fold hinge in the Oak Grove coal degasification field in the southeastern part of the Black Warrior Basin .............................................................................................................2225. Generalized map showing relation of gas (A) and water (B) production to extensional structure in the Deerlick Creek coal degasification field in the southeastern part of the Black Warrior Basin ........................................................................................................................2326. Graph showing distribution of estimated ultimate recoveries (EURs) for gas wells within the Black Warrior Basin Assessment Unit, Black Warrior Basin ............................................2527. Graph showing distribution of estimated ultimate recoveries (EURs) by thirds for gas wells within the Black Warrior Basin Assessment Unit, Black Warrior Basin ................................25
iv

Plate
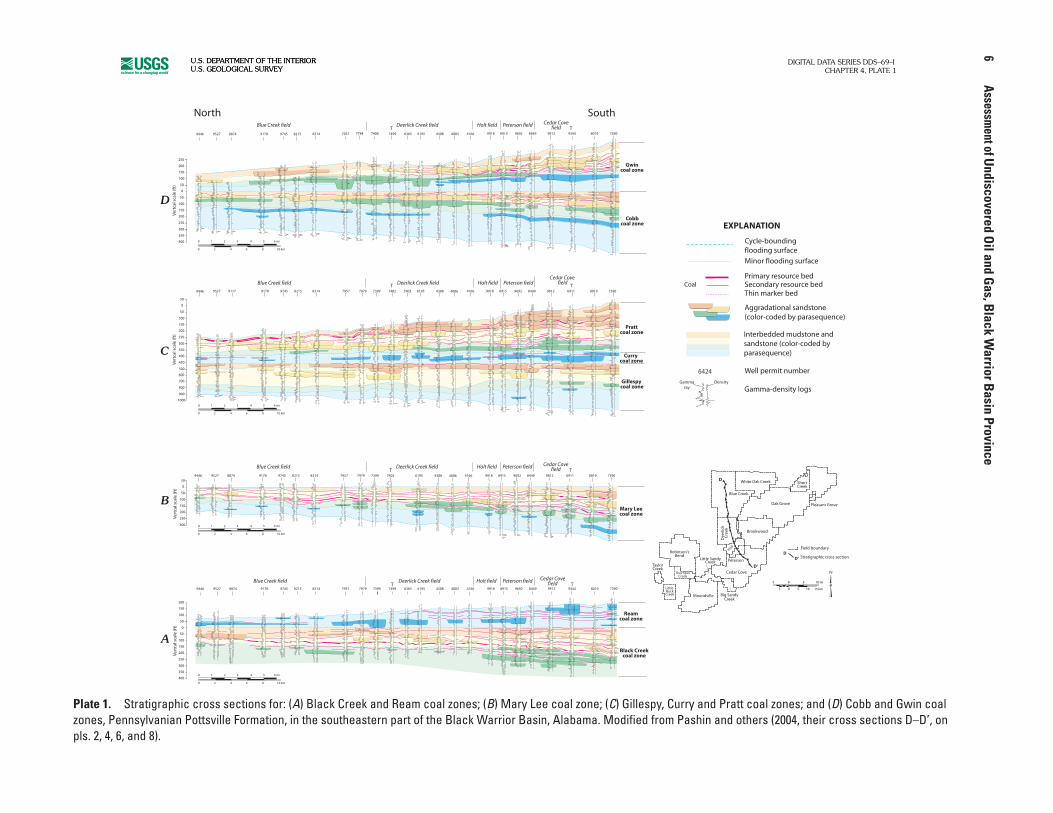
1. Stratigraphic cross sections for: (A) Black Creek and Ream coal zones; (B) Mary Lee coal zone; (C) Gillespy, Curry and Pratt coal zones; and (D) Cobb and Gwin coal zones, Pennsylvanian Pottsville Formation, in the southeastern part of the Black Warrior Basin, Alabama ...................................................................................................................6
Tables
1. Ranges and median values of organic carbon contents, and hydrogen indices for coal and shale samples from the Pennsylvanian Pottsville Formation in the southeastern part of the Black Warrior Basin ..............................................................................122. Ranges and median values for gas wetness, N2, and CO2 contents, and d13C1 for gases from coals in the Pennsylvanian Pottsville Formation, southeastern part of the Black Warrior Basin......................................................................................................................................173. Cumulative gas and water production data for the ten most productive coal degasification fields in the Black Warrior Basin ....................................................................................................18
v

Petroleum Assessment of the Pottsville Coal Total Petroleum System, Black Warrior Basin, Alabama and MississippiBy Joseph R. Hatch and Mark J. Pawlewicz
Overview
The Pottsville Coal Total Petroleum System (TPS) in the Black Warrior Basin of Alabama and Mississippi (fig. 1) produces natural gas from coals in the Lower to Middle Pennsylvanian Pottsville Formation. The areal extent of the Pottsville Coal TPS (about 7,100 mi2, fig. 1) is defined by the occurrence of coal in the upper part of the formation. The Pottsville Coal TPS includes one continuous gas assessment
unit, the Black Warrior Basin Assessment Unit (AU), which has the same boundaries.
Historical production data and the relation of this production to the basin’s geologic framework were used to estimate volumes of gas to be discovered in undrilled areas. Geologic framework factors, considered in the estimation of undiscovered hydrocarbon resources of the Pottsville Coal TPS and the Black Warrior Basin AU, are shown in the petroleum system events chart in figure 2.
Figure 1. Location of the Pottsville Coal Total Petroleum System (TPS) and the Black Warrior Basin Assessment Unit (AU) in the Black Warrior Basin Province of northwestern Alabama and northeastern Mississippi.
POTTSVILLE COAL TPS AND BLACK WARRIOR BASIN AU
Tuscaloosa
Jefferson
Sumter
Pickens
Walker
Attala
Hale
Monroe
Marion
Kemper
Panola
Cullman
Greene
Noxubee
Carroll
Lamar
Colbert
Fayette
Lawrence
Lee
Leflore
Lafayette
Winston
Franklin
Winston
Morgan
Calhoun
Clay
Tallahatchie
Lowndes
Itawam
ba
Pontotoc
Union
Chickasaw
Yalobusha
Grenada
Prentiss
Webster
ChoctawOktibbeha
Quitman
Tish
omin
go
Montgomery
ALABAMA
TENNESSEE
MISSISSIPPI

� Assessment of Undiscovered Oil and Gas, Black Warrior Basin Province
Source rocks for the gas accumulations in the Pottsville Coal TPS and the Black Warrior Basin AU are the Pottsville Formation coals, which also form the principal reservoirs. Coal gas was generated primarily through thermal maturation of coal during the late Paleozoic. Coal gases are characterized by having low gas wetness (median = 0.01 percent), low CO2 and N2 contents (medians = 0.08 percent and <0.01 percent, respectively), and relatively negative d13C1 (median = –47.4 parts per thousand PDB), the latter indicating that some of the gas formed from a late-stage microbial process.
Volumes of gas and water produced are dependent on well design and completion practices, well spacing, coal thickness, gas content (thermal maturity and coal chemical composition), and reservoir quality, which are determined by the abundance and openness of natural fractures, including cleats, joints, and fault-related shear fractures. Virtually all coal-gas production from the Pottsville Formation is from high-volatile A bituminous or higher rank coals, which occur in areas of Tuscaloosa, Jefferson, and Walker Counties, Alabama, in the southeastern part of the Black Warrior Basin AU.
Through the first quarter of 2000, more than 3,500 gas wells had been completed within the Black Warrior Basin AU, of which about 3,200 were still producing. Cumulative production through January 2003 was about 1.42 trillion cubic feet of gas (TCFG). Our resource analysis resulted in estimated volumes of potential additions to reserves within
the AU to be 4.61 TCFG at the 95-percent certainty level, 6.85 TCFG at the 50-percent certainty level, 10.18 TCFG at the 5-percent certainty level, and a mean resource estimate of 7.06 TCFG.
Geologic Setting
Stratigraphic and Sedimentological Framework
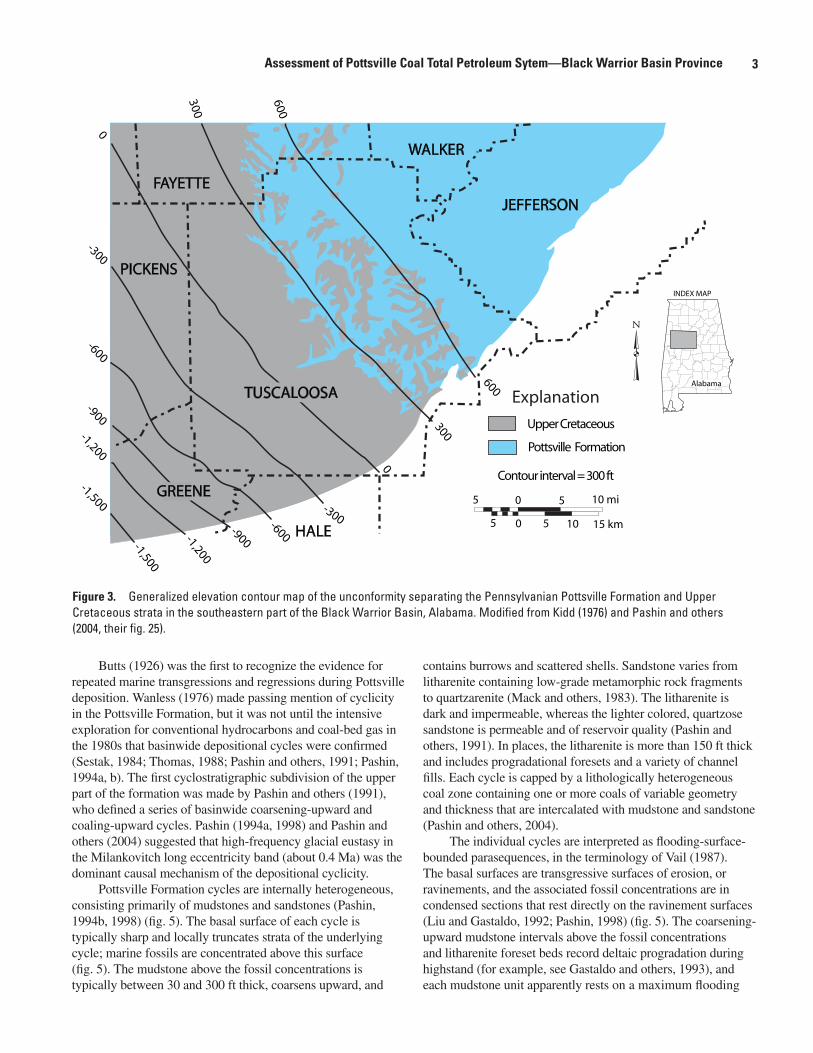
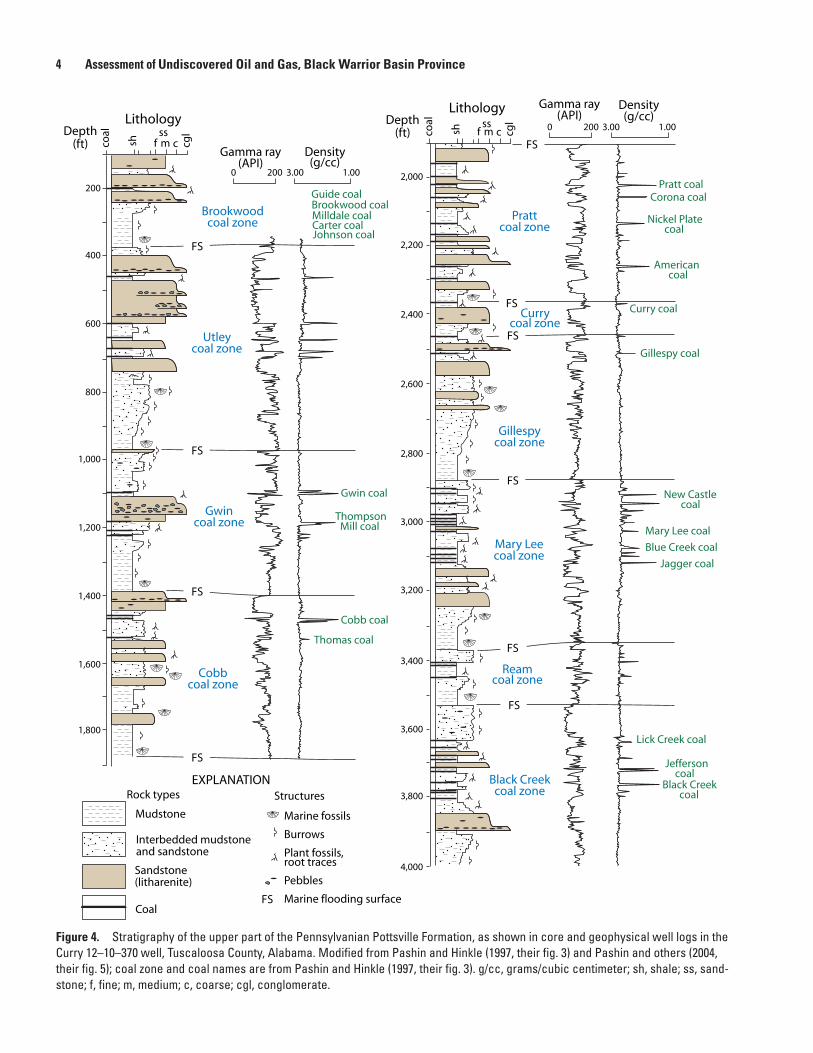
The Lower to Middle Pennsylvanian Pottsville Formation is composed principally of shale, sandstone, and coal; thicknesses of the formation locally exceed 6,000 ft (Thomas, 1988). The formation is exposed at the surface in the eastern one-third of the Black Warrior Basin and is overlain with angular unconformity by poorly consolidated Mesozoic and Cenozoic strata of the Gulf Coastal Plain and Mississippi Embayment in the western two-thirds of the area (fig. 3) (Mellen, 1947). Economically important coals, primarily in the upper part of the formation, are assigned to several widespread “coal zones” (McCalley, 1900). In ascending order, these are the Black Creek, Ream, Mary Lee, Gillespy, Curry, Pratt, Cobb, Gwin, Utley, and Brookwood “coal zones” (fig. 4).
Figure �. Petroleum system events chart showing interpreted timing of elements and processes related to hydrocarbon generation and accumulation for the Pottsville Coal Total Petroleum System and the Black Warrior Basin Assessment Unit, Black Warrior Basin, Alabama and Mississippi. Modified from Magoon and Dow (1994). MYBP, million years before present; Paleo., Paleocene; Eoc., Eocene; Olig., Oligocene; Mio., Miocene; Plio., Pliocene.
POTTSVILLE FM. DEPOSITION
SOURCE ROCK
RESERVOIR ROCK
SEAL ROCK
OVERBURDEN ROCK
TRAP FORMATION
HYDROCARBON PRESERVATION
CRITICAL MOMENT
HYDROCARBON GENERATION
HYDROCARBON ACCUMULATION
HYDROCARBON MIGRATION
Mio.
Eoc.
Paleo.
ULUMLUMULUMLULUMLUML
23
65
145
200
251
299
318
359
416
444
488
2,500
542
Neo
gen
e
Paleog
ene
Cretaceo
us
Jurassic
Triassic
Permian
Penn
sylvanian
Mississip
pian
Devo
nian
Silurian
Ord
ovician
Cam
brian
Proterozo
ic
Arch
ean Petroleum
Systems Events
Geologic Time Scale
50
100
150
200
250
300
350
400
450
500
550
Water block
Biogenic gas
Thermogenic gas
Biogenic gas
(MYBP)
?
?
?
L
M &
U
LL U Olig.
Plio.
�Assessment of Pottsville Coal Total Petroleum Sytem—Black Warrior Basin Province
Butts (1926) was the first to recognize the evidence for repeated marine transgressions and regressions during Pottsville deposition. Wanless (1976) made passing mention of cyclicity in the Pottsville Formation, but it was not until the intensive exploration for conventional hydrocarbons and coal-bed gas in the 1980s that basinwide depositional cycles were confirmed (Sestak, 1984; Thomas, 1988; Pashin and others, 1991; Pashin, 1994a, b). The first cyclostratigraphic subdivision of the upper part of the formation was made by Pashin and others (1991), who defined a series of basinwide coarsening-upward and coaling-upward cycles. Pashin (1994a, 1998) and Pashin and others (2004) suggested that high-frequency glacial eustasy in the Milankovitch long eccentricity band (about 0.4 Ma) was the dominant causal mechanism of the depositional cyclicity.
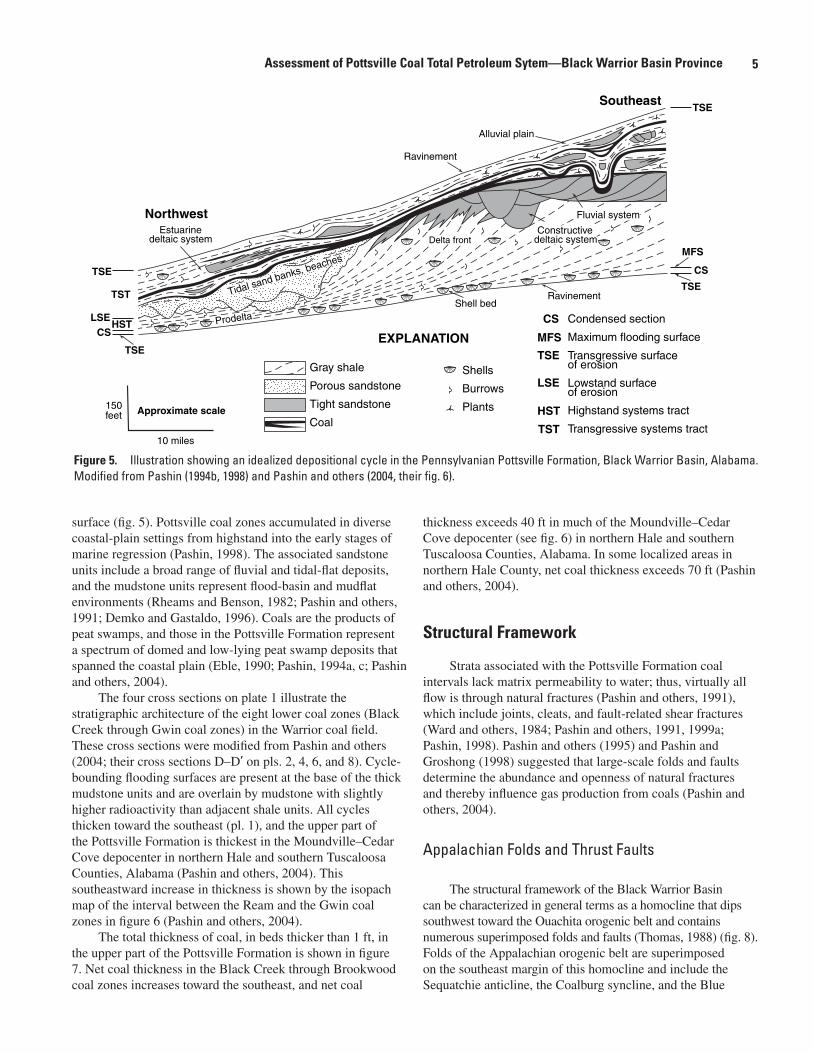
Pottsville Formation cycles are internally heterogeneous, consisting primarily of mudstones and sandstones (Pashin, 1994b, 1998) (fig. 5). The basal surface of each cycle is typically sharp and locally truncates strata of the underlying cycle; marine fossils are concentrated above this surface (fig. 5). The mudstone above the fossil concentrations is typically between 30 and 300 ft thick, coarsens upward, and
contains burrows and scattered shells. Sandstone varies from litharenite containing low-grade metamorphic rock fragments to quartzarenite (Mack and others, 1983). The litharenite is dark and impermeable, whereas the lighter colored, quartzose sandstone is permeable and of reservoir quality (Pashin and others, 1991). In places, the litharenite is more than 150 ft thick and includes progradational foresets and a variety of channel fills. Each cycle is capped by a lithologically heterogeneous coal zone containing one or more coals of variable geometry and thickness that are intercalated with mudstone and sandstone (Pashin and others, 2004).
The individual cycles are interpreted as flooding-surface-bounded parasequences, in the terminology of Vail (1987). The basal surfaces are transgressive surfaces of erosion, or ravinements, and the associated fossil concentrations are in condensed sections that rest directly on the ravinement surfaces (Liu and Gastaldo, 1992; Pashin, 1998) (fig. 5). The coarsening-upward mudstone intervals above the fossil concentrations and litharenite foreset beds record deltaic progradation during highstand (for example, see Gastaldo and others, 1993), and each mudstone unit apparently rests on a maximum flooding
Figure �. Generalized elevation contour map of the unconformity separating the Pennsylvanian Pottsville Formation and Upper Cretaceous strata in the southeastern part of the Black Warrior Basin, Alabama. Modified from Kidd (1976) and Pashin and others (2004, their fig. 25).
� Assessment of Undiscovered Oil and Gas, Black Warrior Basin Province
Figure �. Stratigraphy of the upper part of the Pennsylvanian Pottsville Formation, as shown in core and geophysical well logs in the Curry 12–10–370 well, Tuscaloosa County, Alabama. Modified from Pashin and Hinkle (1997, their fig. 3) and Pashin and others (2004, their fig. 5); coal zone and coal names are from Pashin and Hinkle (1997, their fig. 3). g/cc, grams/cubic centimeter; sh, shale; ss, sand-stone; f, fine; m, medium; c, coarse; cgl, conglomerate.
�Assessment of Pottsville Coal Total Petroleum Sytem—Black Warrior Basin Province
surface (fig. 5). Pottsville coal zones accumulated in diverse coastal-plain settings from highstand into the early stages of marine regression (Pashin, 1998). The associated sandstone units include a broad range of fluvial and tidal-flat deposits, and the mudstone units represent flood-basin and mudflat environments (Rheams and Benson, 1982; Pashin and others, 1991; Demko and Gastaldo, 1996). Coals are the products of peat swamps, and those in the Pottsville Formation represent a spectrum of domed and low-lying peat swamp deposits that spanned the coastal plain (Eble, 1990; Pashin, 1994a, c; Pashin and others, 2004).
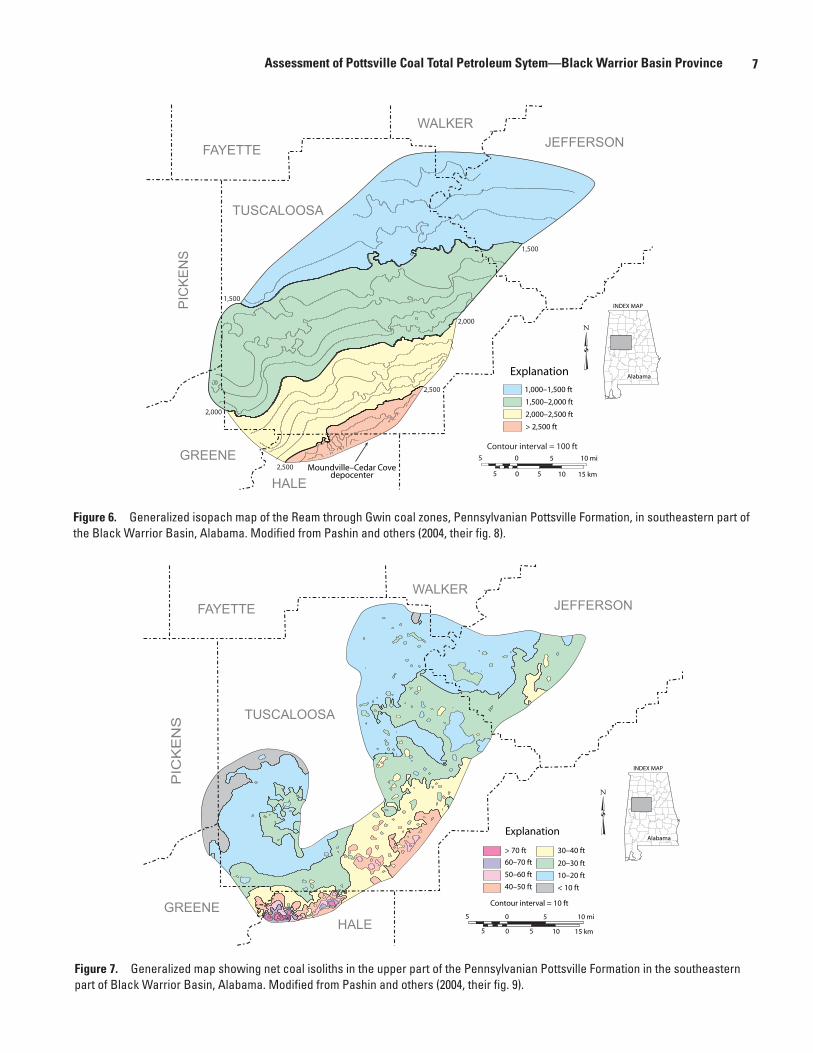
The four cross sections on plate 1 illustrate the stratigraphic architecture of the eight lower coal zones (Black Creek through Gwin coal zones) in the Warrior coal field. These cross sections were modified from Pashin and others (2004; their cross sections D–D’ on pls. 2, 4, 6, and 8). Cycle-bounding flooding surfaces are present at the base of the thick mudstone units and are overlain by mudstone with slightly higher radioactivity than adjacent shale units. All cycles thicken toward the southeast (pl. 1), and the upper part of the Pottsville Formation is thickest in the Moundville–Cedar Cove depocenter in northern Hale and southern Tuscaloosa Counties, Alabama (Pashin and others, 2004). This southeastward increase in thickness is shown by the isopach map of the interval between the Ream and the Gwin coal zones in figure 6 (Pashin and others, 2004).
The total thickness of coal, in beds thicker than 1 ft, in the upper part of the Pottsville Formation is shown in figure 7. Net coal thickness in the Black Creek through Brookwood coal zones increases toward the southeast, and net coal
thickness exceeds 40 ft in much of the Moundville–Cedar Cove depocenter (see fig. 6) in northern Hale and southern Tuscaloosa Counties, Alabama. In some localized areas in northern Hale County, net coal thickness exceeds 70 ft (Pashin and others, 2004).
Structural Framework
Strata associated with the Pottsville Formation coal intervals lack matrix permeability to water; thus, virtually all flow is through natural fractures (Pashin and others, 1991), which include joints, cleats, and fault-related shear fractures (Ward and others, 1984; Pashin and others, 1991, 1999a; Pashin, 1998). Pashin and others (1995) and Pashin and Groshong (1998) suggested that large-scale folds and faults determine the abundance and openness of natural fractures and thereby influence gas production from coals (Pashin and others, 2004).
Appalachian Folds and Thrust Faults
The structural framework of the Black Warrior Basin can be characterized in general terms as a homocline that dips southwest toward the Ouachita orogenic belt and contains numerous superimposed folds and faults (Thomas, 1988) (fig. 8). Folds of the Appalachian orogenic belt are superimposed on the southeast margin of this homocline and include the Sequatchie anticline, the Coalburg syncline, and the Blue
Figure �. Illustration showing an idealized depositional cycle in the Pennsylvanian Pottsville Formation, Black Warrior Basin, Alabama. Modified from Pashin (1994b, 1998) and Pashin and others (2004, their fig. 6).
EXPLANATION
Ravinement Shell bed
Ravinement
Estuarine deltaic system
Alluvial plain
Prodelta
Delta front Constructive
deltaic system
Fluvial system
Gray shale
Porous sandstone
Tight sandstone
Coal
Shells
Burrows
Plants
Condensed section
Maximum flooding surface
Transgressive surfaceof erosion
Lowstand surface of erosion
Highstand systems tract
Transgressive systems tract
TSE
MFS
CS
LSE
HST
TST
TSE
MFS
CS
TSESoutheast
Northwest
TSE
TSE
LSEHST
CS
TST
10 miles
Approximate scale 150feet
Tidal sand banks, beaches
�
Assessment of U
ndiscovered Oil and G
as, Black W
arrior Basin Province
Plate 1. Stratigraphic cross sections for: (A) Black Creek and Ream coal zones; (B) Mary Lee coal zone; (C) Gillespy, Curry and Pratt coal zones; and (D) Cobb and Gwin coal zones, Pennsylvanian Pottsville Formation, in the southeastern part of the Black Warrior Basin, Alabama. Modified from Pashin and others (2004, their cross sections D–D’, on pls. 2, 4, 6, and 8).
739080199344TT
981284499692891599184166400343086195636574997399797979578314821597459170887495279446
Reamcoal zone
Black Creekcoal zone
Cedar CovefieldPeterson fieldHolt fieldDeerlick Creek fieldBlue Creek field
0
50
100
150
200
250
50
300
350
400
Vert
cal s
cale
(ft)
200
150
100
0
0 2 431 5 6 mi
2 4 6 8 10 km
0
50
100
150
200
250
50
300
7390801969119812844996928915991841664308619574027399797979578314821597459170887495279446T T
4006
Vert
cal s
cale
(ft)
Cedar CovefieldPeterson fieldHolt fieldDeerlick Creek fieldBlue Creek field
Mary Leecoal zone
0
0 2 431 5 6 mi
2 4 6 8 10 km
73908019691198128449969289159918416643086195590374027399797979578314821597459170911795279446T T
4006
Peterson fieldCedar Cove
fieldHolt fieldDeerlick Creek fieldBlue Creek field
Prattcoal zone
Curry coal zone
Gillespy coal zone
0
50
100
150
200
250
50
300
350
400
450
500
600
700
800
900
1000
Vert
cal s
cale
(ft)
0
0 2 431 5 6 mi
2 4 6 8 10 km
41664003430861956365749979578314 73908019934498128449969289159918821597459170887495279446
0
0 2 431 5 6 mi
2 4 6 8 10 km
TT74007744
Gwincoal zone
Cobbcoal zone
Cedar CovefieldPeterson fieldHolt fieldDeerlick Creek fieldBlue Creek field
0
50
100
150
200
250
50
300
350
400
Vert
cal s
cale
(ft)
250
200
150
100
D
D
D'
D'
Oak Grove
White Oak Creek
Blue Creek
ShortCreek
Pleasant Grove
Field boundary
Stratigraphic cross section
Holt
Brookwood
Cedar Cove
Moundville
Dee
rlic
kC
reek
PetersonLittle SandyCreek
LittleBuckCreek
Robinson'sBend
Big SandyCreek
TaylorCreek
ThorntonCreek
0 5 10 mi5
5 0 5 10 15 km
EXPLANATION
6424 Well permit number
Gamma-density logs
Aggradational sandstone(color-coded by parasequence)
Interbedded mudstone and sandstone (color-coded by parasequence)
Primary resource bedSecondary resource bedThin marker bed
Coal
Gammaray
Density
Cycle-boundingflooding surface
Minor flooding surface
D
C
B
A
North South
U.S. DEPARTMENT OF THE INTERIORU.S. GEOLOGICAL SURVEYU.S. DEPARTMENT OF THE INTERIORU.S. GEOLOGICAL SURVEY
DIGITAL DATA SERIES DDS–69–ICHAPTER 4, PLATE 1
�Assessment of Pottsville Coal Total Petroleum Sytem—Black Warrior Basin Province
7390
8019
9344T
T98
1284
4996
9289
1599
1841
6640
0343
0861
9563
6574
9973
9979
7979
5783
1482
1597
4591
7088
7495
2794
46
Rea
mco
al z
on
e
Bla
ck C
reek
coal
zo
ne
Ced
ar C
ove
field
Pete
rson
fiel
dH
olt f
ield
Dee
rlic
k C
reek
fiel
dBl
ue C
reek
fiel
d
0 50 100
150
200
250
50 300
350
400
Vertcal scale (ft)200
150
100
002
43
15
6 m
i
24
68
10 k
m
0 50 100
150
200
250
50 300
7390
8019
6911
9812
8449
9692
8915
9918
4166
4308
6195
7402
7399
7979
7957
8314
8215
9745
9170
8874
9527
9446
TT
4006
Vertcal scale (ft)
Ced
ar C
ove
field
Pete
rson
fiel
dH
olt f
ield
Dee
rlic
k C
reek
fiel
dBl
ue C
reek
fiel
d
Mar
y Le
eco
al z
on
e
002
43
15
6 m
i
24
68
10 k
m
7390
8019
6911
9812
8449
9692
8915
9918
4166
4308
6195
5903
7402
7399
7979
7957
8314
8215
9745
9170
9117
9527
9446
TT
4006
Pete
rson
fiel
dC
edar
Cov
e fi
eld
Hol
t fie
ldD
eerl
ick
Cre
ek fi
eld
Blue
Cre
ek fi
eld
Pra
ttco
al z
on
e
Cu
rry
coal
zo
ne
Gill
esp
y c
oal
zo
ne
0 50 100
150
200
250
50 300
350
400
450
500
600
700
800
900
1000
Vertcal scale (ft)
002
43
15
6 m
i
24
68
10 k
m
4166
4003
4308
6195
6365
7499
7957
8314
7390
8019
9344
9812
8449
9692
8915
9918
8215
9745
9170
8874
9527
9446
002
43
15
6 m
i
24
68
10 k
m
TT
7400
7744
Gw
inco
al z
on
e
Co
bb
coal
zo
ne
Ced
ar C
ove
field
Pete
rson
fiel
dH
olt f
ield
Dee
rlic
k C
reek
fiel
dBl
ue C
reek
fiel
d
0 50 100
150
200
250
50 300
350
400
Vertcal scale (ft)
250
200
150
100
D
D
D'
D'
Oak
Gro
ve
Wh
ite
Oak
Cre
ek
Blu
e C
reek
Sho
rtC
reek
Plea
san
t G
rove
Fiel
d b
ou
nd
ary
Stra
tig
rap
hic
cro
ss s
ecti
on
Holt
Bro
okw
oo
d
Ced
ar C
ove
Mo
un
dvi
lle
DeerlickCreek Pe
ters
on
Litt
le S
and
yC
reek
Litt
leB
uck
Cre
ekRo
bin
son
'sB
end
Big
San
dy
Cre
ek
Tayl
or
Cre
ekTh
orn
ton
Cre
ek
05
10 m
i5
50
510
15 k
m
EXP
LAN
ATI
ON
6424
Wel
l per
mit
nu
mb
er
Gam
ma-
den
sity
log
s
Ag
gra
dat
ion
al s
and
sto
ne
(co
lor-
cod
ed b
y p
aras
equ
ence
)
Inte
rbed
ded
mu
dst
on
e an
d
san
dst
on
e (c
olo
r-co
ded
by
par
aseq
uen
ce)
Prim
ary
reso
urc
e b
edSe
con
dar
y re
sou
rce
bed
Thin
mar
ker b
edC
oal
Gam
ma
ray
Den
sity
Cyc
le-b
ou
nd
ing
floo
din
g s
urf
ace
Min
or f
loo
din
g s
urf
ace
D C B A
No
rth
Sou
th
U.S
. D
EPA
RT
ME
NT
OF
TH
E IN
TE
RIO
RU
.S.
GE
OL
OG
ICA
L S
UR
VE
YU
.S.
DE
PAR
TM
EN
T O
F T
HE
INT
ER
IOR
U.S
. G
EO
LO
GIC
AL
SU
RV
EY
DIG
ITA
L D
ATA
SER
IES D
DS–6
9–I
CH
AP
TER
4,
PLA
TE 1
Figure �. Generalized isopach map of the Ream through Gwin coal zones, Pennsylvanian Pottsville Formation, in southeastern part of the Black Warrior Basin, Alabama. Modified from Pashin and others (2004, their fig. 8).
PIC
KE
NS
TUSCALOOSA
JEFFERSONWALKER
FAYETTE
GREENE
HALE
Figure �. Generalized map showing net coal isoliths in the upper part of the Pennsylvanian Pottsville Formation in the southeastern part of Black Warrior Basin, Alabama. Modified from Pashin and others (2004, their fig. 9).
PIC
KE
NS TUSCALOOSA
WALKERFAYETTE
HALEGREENE
JEFFERSON
� Assessment of Undiscovered Oil and Gas, Black Warrior Basin Province
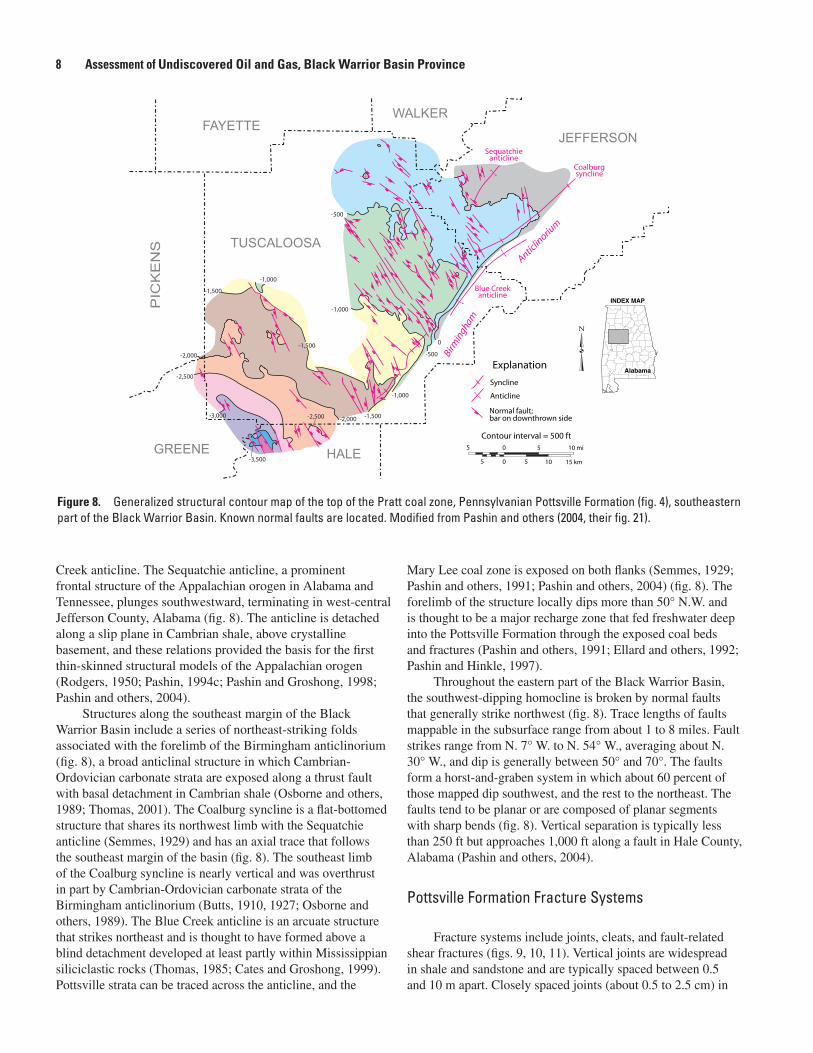
Figure �. Generalized structural contour map of the top of the Pratt coal zone, Pennsylvanian Pottsville Formation (fig. 4), southeastern part of the Black Warrior Basin. Known normal faults are located. Modified from Pashin and others (2004, their fig. 21).
Creek anticline. The Sequatchie anticline, a prominent frontal structure of the Appalachian orogen in Alabama and Tennessee, plunges southwestward, terminating in west-central Jefferson County, Alabama (fig. 8). The anticline is detached along a slip plane in Cambrian shale, above crystalline basement, and these relations provided the basis for the first thin-skinned structural models of the Appalachian orogen (Rodgers, 1950; Pashin, 1994c; Pashin and Groshong, 1998; Pashin and others, 2004).
Structures along the southeast margin of the Black Warrior Basin include a series of northeast-striking folds associated with the forelimb of the Birmingham anticlinorium (fig. 8), a broad anticlinal structure in which Cambrian-Ordovician carbonate strata are exposed along a thrust fault with basal detachment in Cambrian shale (Osborne and others, 1989; Thomas, 2001). The Coalburg syncline is a flat-bottomed structure that shares its northwest limb with the Sequatchie anticline (Semmes, 1929) and has an axial trace that follows the southeast margin of the basin (fig. 8). The southeast limb of the Coalburg syncline is nearly vertical and was overthrust in part by Cambrian-Ordovician carbonate strata of the Birmingham anticlinorium (Butts, 1910, 1927; Osborne and others, 1989). The Blue Creek anticline is an arcuate structure that strikes northeast and is thought to have formed above a blind detachment developed at least partly within Mississippian siliciclastic rocks (Thomas, 1985; Cates and Groshong, 1999). Pottsville strata can be traced across the anticline, and the
Mary Lee coal zone is exposed on both flanks (Semmes, 1929; Pashin and others, 1991; Pashin and others, 2004) (fig. 8). The forelimb of the structure locally dips more than 50° N.W. and is thought to be a major recharge zone that fed freshwater deep into the Pottsville Formation through the exposed coal beds and fractures (Pashin and others, 1991; Ellard and others, 1992; Pashin and Hinkle, 1997).
Throughout the eastern part of the Black Warrior Basin, the southwest-dipping homocline is broken by normal faults that generally strike northwest (fig. 8). Trace lengths of faults mappable in the subsurface range from about 1 to 8 miles. Fault strikes range from N. 7° W. to N. 54° W., averaging about N. 30° W., and dip is generally between 50° and 70°. The faults form a horst-and-graben system in which about 60 percent of those mapped dip southwest, and the rest to the northeast. The faults tend to be planar or are composed of planar segments with sharp bends (fig. 8). Vertical separation is typically less than 250 ft but approaches 1,000 ft along a fault in Hale County, Alabama (Pashin and others, 2004).
Pottsville Formation Fracture Systems
Fracture systems include joints, cleats, and fault-related shear fractures (figs. 9, 10, 11). Vertical joints are widespread in shale and sandstone and are typically spaced between 0.5 and 10 m apart. Closely spaced joints (about 0.5 to 2.5 cm) in
PIC
KE
NS TUSCALOOSA
JEFFERSON
WALKER FAYETTE
GREENE 0 5 10 mi 5
5 0 5 10 15 km
Explanation
Normal fault; bar on downthrown side
Anticline
Syncline
Contour interval = 500 ft
-500
-1,000
-1,500
-1,000
-1,500
-2,000
-2,500
-2,500
-3,500
-2,000 -1,500
-1,000
-500
0
-3,000
HALE
INDEX MAP
Alabama
Sequatchie anticline
Coalburg syncline
Blue Creek anticline
Birmin
gham
Anticlin
orium

�Assessment of Pottsville Coal Total Petroleum Sytem—Black Warrior Basin Province
Figure �. Small normal fault and associated fracturing in an abandoned mine highwall, Brookwood coal zone, Pennsylvanian Pottsville Formation, Tuscaloosa County, Alabama. Modified from Pashin and others (2004, their fig. 26).
Figure 10. Jointed shale above the Gwin coal zone, Pennsylvanian Pottsville Formation, Jefferson County, Alabama. Modified from Pashin and others (1991, 2004, their fig. 27).
10 Assessment of Undiscovered Oil and Gas, Black Warrior Basin Province
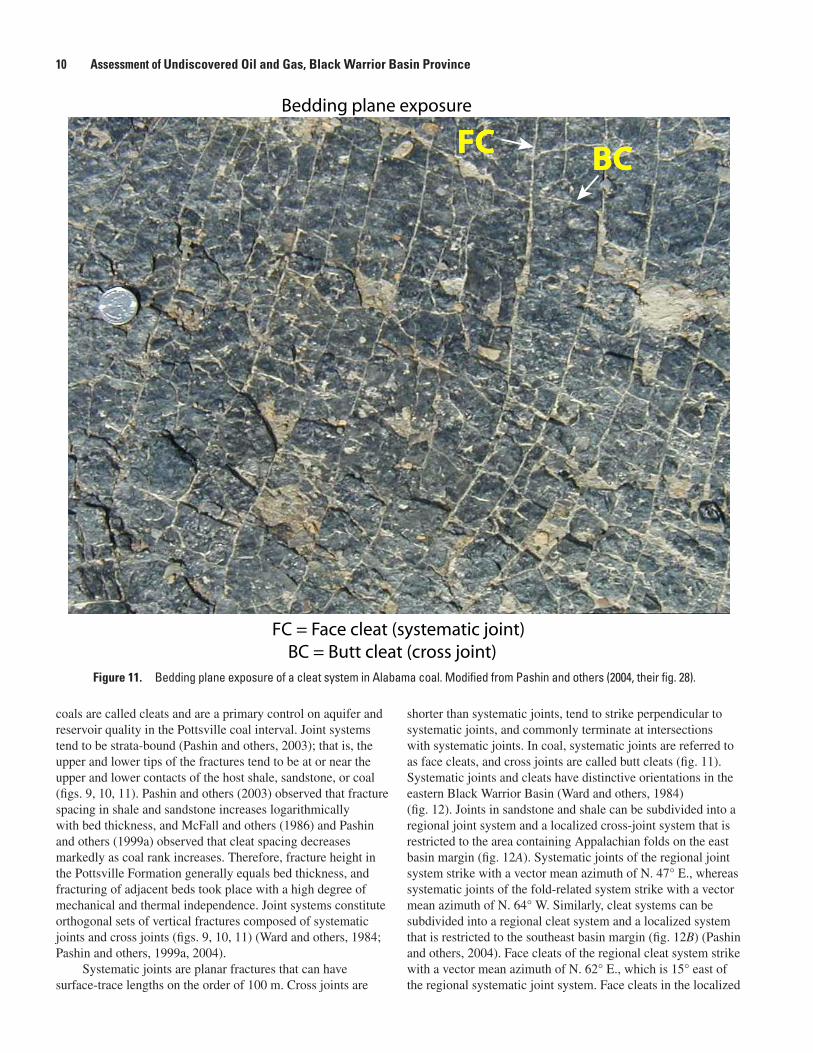
Figure 11. Bedding plane exposure of a cleat system in Alabama coal. Modified from Pashin and others (2004, their fig. 28).
coals are called cleats and are a primary control on aquifer and reservoir quality in the Pottsville coal interval. Joint systems tend to be strata-bound (Pashin and others, 2003); that is, the upper and lower tips of the fractures tend to be at or near the upper and lower contacts of the host shale, sandstone, or coal (figs. 9, 10, 11). Pashin and others (2003) observed that fracture spacing in shale and sandstone increases logarithmically with bed thickness, and McFall and others (1986) and Pashin and others (1999a) observed that cleat spacing decreases markedly as coal rank increases. Therefore, fracture height in the Pottsville Formation generally equals bed thickness, and fracturing of adjacent beds took place with a high degree of mechanical and thermal independence. Joint systems constitute orthogonal sets of vertical fractures composed of systematic joints and cross joints (figs. 9, 10, 11) (Ward and others, 1984; Pashin and others, 1999a, 2004).
Systematic joints are planar fractures that can have surface-trace lengths on the order of 100 m. Cross joints are
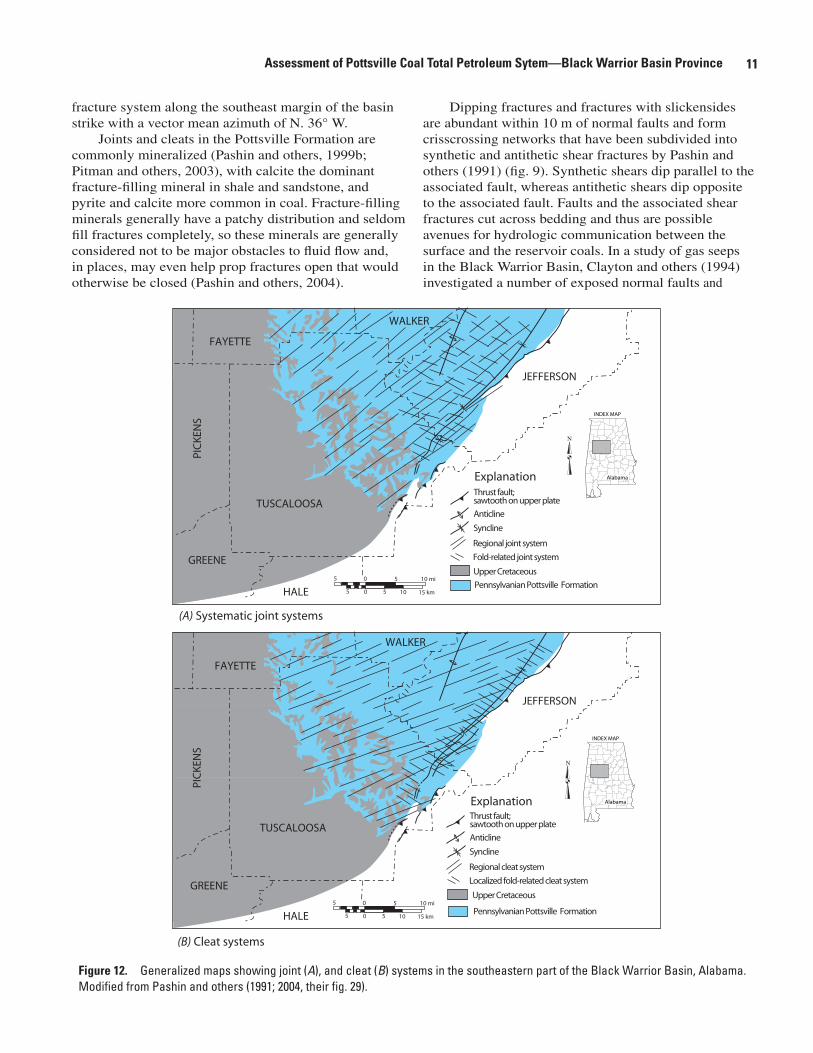
shorter than systematic joints, tend to strike perpendicular to systematic joints, and commonly terminate at intersections with systematic joints. In coal, systematic joints are referred to as face cleats, and cross joints are called butt cleats (fig. 11). Systematic joints and cleats have distinctive orientations in the eastern Black Warrior Basin (Ward and others, 1984) (fig. 12). Joints in sandstone and shale can be subdivided into a regional joint system and a localized cross-joint system that is restricted to the area containing Appalachian folds on the east basin margin (fig. 12A). Systematic joints of the regional joint system strike with a vector mean azimuth of N. 47° E., whereas systematic joints of the fold-related system strike with a vector mean azimuth of N. 64° W. Similarly, cleat systems can be subdivided into a regional cleat system and a localized system that is restricted to the southeast basin margin (fig. 12B) (Pashin and others, 2004). Face cleats of the regional cleat system strike with a vector mean azimuth of N. 62° E., which is 15° east of the regional systematic joint system. Face cleats in the localized
FFCC BBCC
FC = Face cleat (systematic joint) BC = Butt cleat (cross joint)
Bedding plane exposure
11Assessment of Pottsville Coal Total Petroleum Sytem—Black Warrior Basin Province
fracture system along the southeast margin of the basin strike with a vector mean azimuth of N. 36° W.
Joints and cleats in the Pottsville Formation are commonly mineralized (Pashin and others, 1999b; Pitman and others, 2003), with calcite the dominant fracture-filling mineral in shale and sandstone, and pyrite and calcite more common in coal. Fracture-filling minerals generally have a patchy distribution and seldom fill fractures completely, so these minerals are generally considered not to be major obstacles to fluid flow and, in places, may even help prop fractures open that would otherwise be closed (Pashin and others, 2004).
Dipping fractures and fractures with slickensides are abundant within 10 m of normal faults and form crisscrossing networks that have been subdivided into synthetic and antithetic shear fractures by Pashin and others (1991) (fig. 9). Synthetic shears dip parallel to the associated fault, whereas antithetic shears dip opposite to the associated fault. Faults and the associated shear fractures cut across bedding and thus are possible avenues for hydrologic communication between the surface and the reservoir coals. In a study of gas seeps in the Black Warrior Basin, Clayton and others (1994) investigated a number of exposed normal faults and
Figure 1�. Generalized maps showing joint (A), and cleat (B) systems in the southeastern part of the Black Warrior Basin, Alabama. Modified from Pashin and others (1991; 2004, their fig. 29).
1� Assessment of Undiscovered Oil and Gas, Black Warrior Basin Province
reported a significant gas seep along one fault in Oak Grove field. However, Pitman and others (2003) observed pervasive cementation of coal cleats within 10 m of normal faults in the Black Warrior Basin. This cementation appears to inhibit flow in coal along large segments of many faults (Pashin and others, 2004).
Hydrocarbon Source-Rock Characterization
The potential for sedimentary rocks to generate hydrocarbons, and the nature of the hydrocarbons generated, depend on the amount, composition, and thermal maturity of organic matter in the rock (Tissot and Welte, 1984). Total organic carbon (TOC) content is measured in terms of weight percent (wt %). The relative hydrogen richness of the organic matter, and an indication of the types of hydrocarbons that will be generated, are measured by hydrogen index (HI, Rock-Eval®, S2/TOC, mg/g). Relative thermal maturity of organic matter is measured by Tmax (Rock-Eval®, °C), vitrinite reflectance (Ro), and calculations from proximate analyses and calorific value determinations (BTU/lb) of coal (for example, see American Society for Testing and Materials D–388, 2001). Source rocks for the gas accumulations in the Pottsville Coal TPS and the Black Warrior Basin AU are the Pottsville Formation coals and coaly shales, which also form the principal reservoirs (fig. 2).
Organic Carbon Contents—Organic Facies
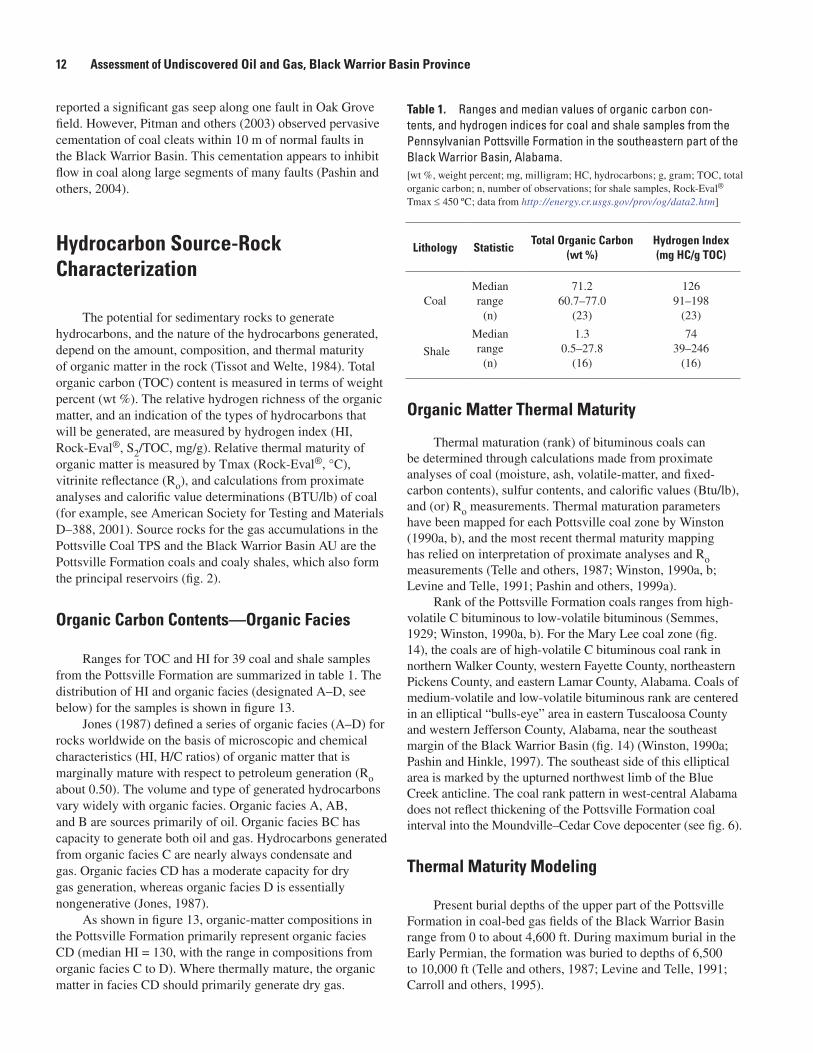
Ranges for TOC and HI for 39 coal and shale samples from the Pottsville Formation are summarized in table 1. The distribution of HI and organic facies (designated A–D, see below) for the samples is shown in figure 13.
Jones (1987) defined a series of organic facies (A–D) for rocks worldwide on the basis of microscopic and chemical characteristics (HI, H/C ratios) of organic matter that is marginally mature with respect to petroleum generation (Ro about 0.50). The volume and type of generated hydrocarbons vary widely with organic facies. Organic facies A, AB, and B are sources primarily of oil. Organic facies BC has capacity to generate both oil and gas. Hydrocarbons generated from organic facies C are nearly always condensate and gas. Organic facies CD has a moderate capacity for dry gas generation, whereas organic facies D is essentially nongenerative (Jones, 1987).
As shown in figure 13, organic-matter compositions in the Pottsville Formation primarily represent organic facies CD (median HI = 130, with the range in compositions from organic facies C to D). Where thermally mature, the organic matter in facies CD should primarily generate dry gas.
Organic Matter Thermal Maturity
Thermal maturation (rank) of bituminous coals can be determined through calculations made from proximate analyses of coal (moisture, ash, volatile-matter, and fixed-carbon contents), sulfur contents, and calorific values (Btu/lb), and (or) Ro measurements. Thermal maturation parameters have been mapped for each Pottsville coal zone by Winston (1990a, b), and the most recent thermal maturity mapping has relied on interpretation of proximate analyses and Ro measurements (Telle and others, 1987; Winston, 1990a, b; Levine and Telle, 1991; Pashin and others, 1999a).
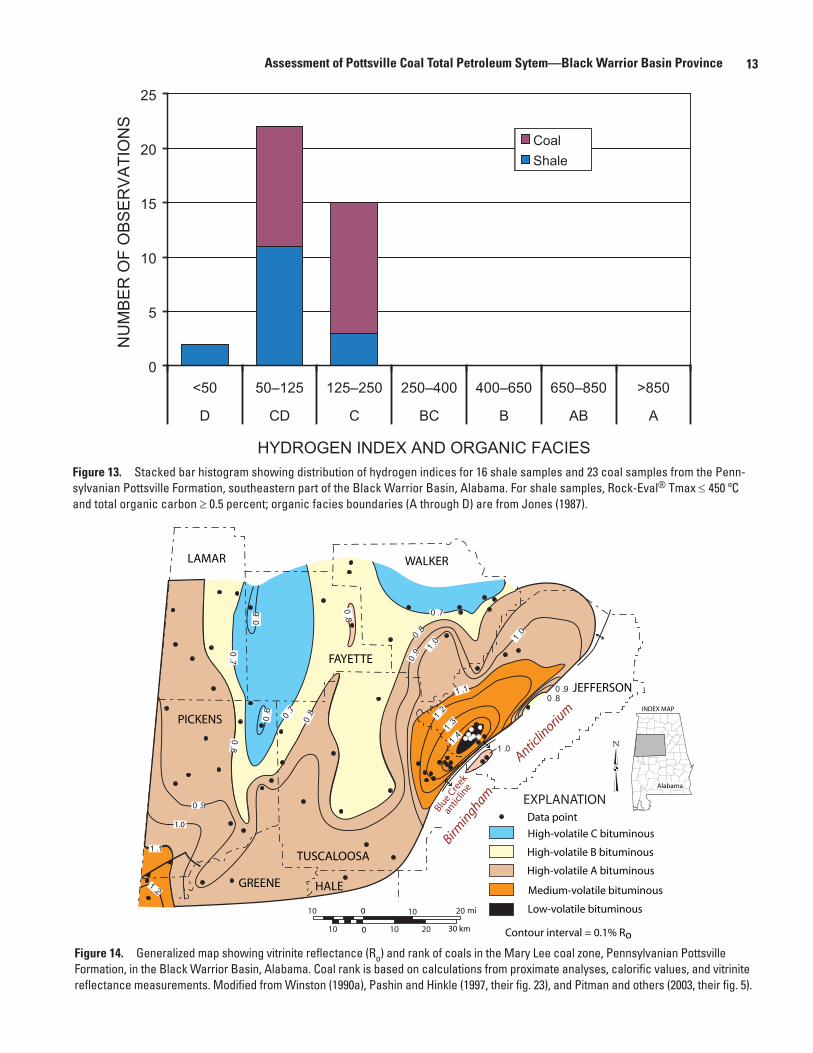
Rank of the Pottsville Formation coals ranges from high-volatile C bituminous to low-volatile bituminous (Semmes, 1929; Winston, 1990a, b). For the Mary Lee coal zone (fig. 14), the coals are of high-volatile C bituminous coal rank in northern Walker County, western Fayette County, northeastern Pickens County, and eastern Lamar County, Alabama. Coals of medium-volatile and low-volatile bituminous rank are centered in an elliptical “bulls-eye” area in eastern Tuscaloosa County and western Jefferson County, Alabama, near the southeast margin of the Black Warrior Basin (fig. 14) (Winston, 1990a; Pashin and Hinkle, 1997). The southeast side of this elliptical area is marked by the upturned northwest limb of the Blue Creek anticline. The coal rank pattern in west-central Alabama does not reflect thickening of the Pottsville Formation coal interval into the Moundville–Cedar Cove depocenter (see fig. 6).
Thermal Maturity Modeling
Present burial depths of the upper part of the Pottsville Formation in coal-bed gas fields of the Black Warrior Basin range from 0 to about 4,600 ft. During maximum burial in the Early Permian, the formation was buried to depths of 6,500 to 10,000 ft (Telle and others, 1987; Levine and Telle, 1991; Carroll and others, 1995).
Table 1. Ranges and median values of organic carbon con-tents, and hydrogen indices for coal and shale samples from the Pennsylvanian Pottsville Formation in the southeastern part of the Black Warrior Basin, Alabama.[wt %, weight percent; mg, milligram; HC, hydrocarbons; g, gram; TOC, total organic carbon; n, number of observations; for shale samples, Rock-Eval® Tmax ≤ 450 ºC; data from http://energy.cr.usgs.gov/prov/og/data2.htm]
Lithology StatisticTotal Organic Carbon
(wt %)Hydrogen Index(mg HC/g TOC)
CoalMedianrange
(n)
71.260.7–77.0
(23)
12691–198
(23)
Shale
Medianrange
(n)
1.30.5–27.8
(16)
7439–246
(16)
1�Assessment of Pottsville Coal Total Petroleum Sytem—Black Warrior Basin Province
Figure 1�. Stacked bar histogram showing distribution of hydrogen indices for 16 shale samples and 23 coal samples from the Penn-sylvanian Pottsville Formation, southeastern part of the Black Warrior Basin, Alabama. For shale samples, Rock-Eval® Tmax ≤ 450 ºC and total organic carbon ≥ 0.5 percent; organic facies boundaries (A through D) are from Jones (1987).
Figure 1�. Generalized map showing vitrinite reflectance (Ro) and rank of coals in the Mary Lee coal zone, Pennsylvanian Pottsville Formation, in the Black Warrior Basin, Alabama. Coal rank is based on calculations from proximate analyses, calorific values, and vitrinite reflectance measurements. Modified from Winston (1990a), Pashin and Hinkle (1997, their fig. 23), and Pitman and others (2003, their fig. 5).
� ��� ��
���
���
� ��
� ���
��
� ��
� ��
� ��
� ��
���
� ��� ��
� ��� ��
���
���
� ��
� ��
���
� ��
0
5
10
15
20
25
<50 50–125 125–250 250–400 400–650 650–850 >850
D CD C BC B AB A
HYDROGEN INDEX AND ORGANIC FACIES
NU
MB
ER
OF
OB
SE
RV
ATI
ON
SCoalShale
1� Assessment of Undiscovered Oil and Gas, Black Warrior Basin Province
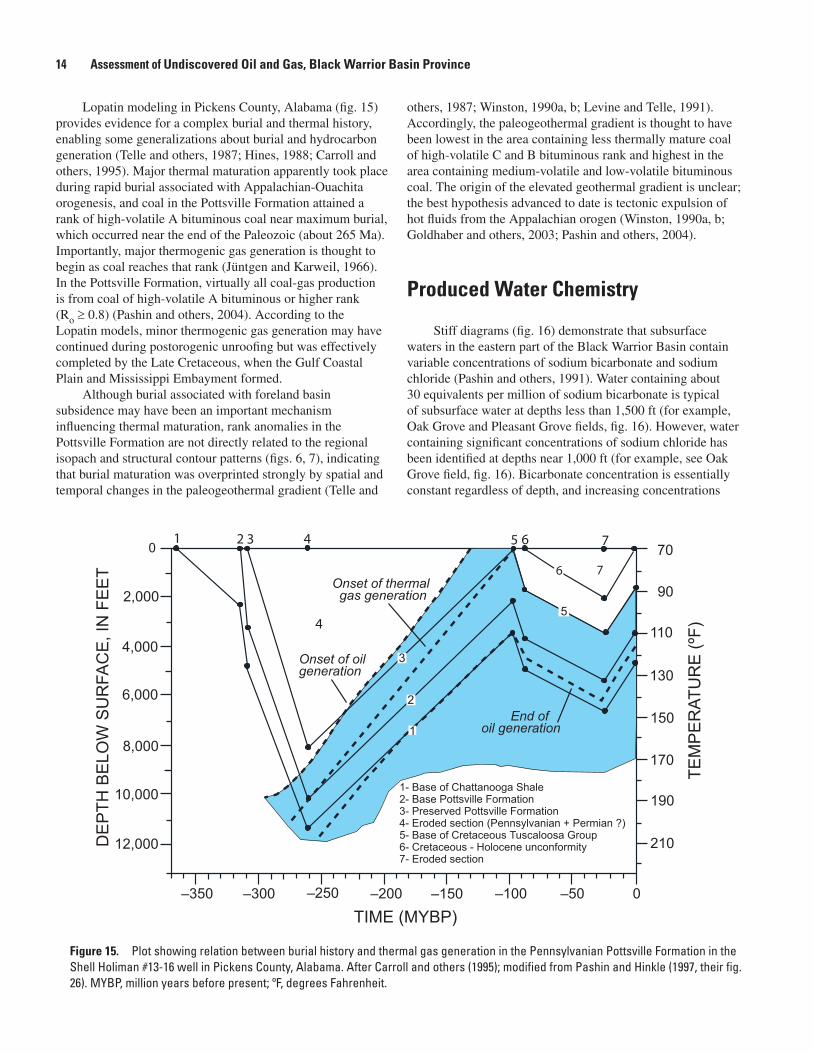
Lopatin modeling in Pickens County, Alabama (fig. 15) provides evidence for a complex burial and thermal history, enabling some generalizations about burial and hydrocarbon generation (Telle and others, 1987; Hines, 1988; Carroll and others, 1995). Major thermal maturation apparently took place during rapid burial associated with Appalachian-Ouachita orogenesis, and coal in the Pottsville Formation attained a rank of high-volatile A bituminous coal near maximum burial, which occurred near the end of the Paleozoic (about 265 Ma). Importantly, major thermogenic gas generation is thought to begin as coal reaches that rank (Jüntgen and Karweil, 1966). In the Pottsville Formation, virtually all coal-gas production is from coal of high-volatile A bituminous or higher rank (Ro ≥ 0.8) (Pashin and others, 2004). According to the Lopatin models, minor thermogenic gas generation may have continued during postorogenic unroofing but was effectively completed by the Late Cretaceous, when the Gulf Coastal Plain and Mississippi Embayment formed.
Although burial associated with foreland basin subsidence may have been an important mechanism influencing thermal maturation, rank anomalies in the Pottsville Formation are not directly related to the regional isopach and structural contour patterns (figs. 6, 7), indicating that burial maturation was overprinted strongly by spatial and temporal changes in the paleogeothermal gradient (Telle and
others, 1987; Winston, 1990a, b; Levine and Telle, 1991). Accordingly, the paleogeothermal gradient is thought to have been lowest in the area containing less thermally mature coal of high-volatile C and B bituminous rank and highest in the area containing medium-volatile and low-volatile bituminous coal. The origin of the elevated geothermal gradient is unclear; the best hypothesis advanced to date is tectonic expulsion of hot fluids from the Appalachian orogen (Winston, 1990a, b; Goldhaber and others, 2003; Pashin and others, 2004).
Produced Water Chemistry
Stiff diagrams (fig. 16) demonstrate that subsurface waters in the eastern part of the Black Warrior Basin contain variable concentrations of sodium bicarbonate and sodium chloride (Pashin and others, 1991). Water containing about 30 equivalents per million of sodium bicarbonate is typical of subsurface water at depths less than 1,500 ft (for example, Oak Grove and Pleasant Grove fields, fig. 16). However, water containing significant concentrations of sodium chloride has been identified at depths near 1,000 ft (for example, see Oak Grove field, fig. 16). Bicarbonate concentration is essentially constant regardless of depth, and increasing concentrations
Figure 1�. Plot showing relation between burial history and thermal gas generation in the Pennsylvanian Pottsville Formation in the Shell Holiman #13-16 well in Pickens County, Alabama. After Carroll and others (1995); modified from Pashin and Hinkle (1997, their fig. 26). MYBP, million years before present; ºF, degrees Fahrenheit.
0
2,000
4,000
6,000
8,000
10,000
12,000
–350 –300 –250 –200 –150 –100 –50 0
70
90
110
130
150
170
190
210
TIME (MYBP)
TEM
PE
RAT
UR
E (º
F)
DE
PTH
BE
LOW
SU
RFA
CE
, IN
FE
ET
1- Base of Chattanooga Shale2- Base Pottsville Formation3- Preserved Pottsville Formation4- Eroded section (Pennsylvanian + Permian ?)5- Base of Cretaceous Tuscaloosa Group6- Cretaceous - Holocene unconformity7- Eroded section
End of oil generation
3
2
1
5
Onset of oilgeneration
Onset of thermal gas generation

1�Assessment of Pottsville Coal Total Petroleum Sytem—Black Warrior Basin Province
Figure 1�. Stiff diagrams showing the composition of formation water produced from the Pennsylvanian Pottsville Formation in the southeastern part of the Black Warrior Basin, Alabama. Modified from Pashin and others (1991; 2004, their fig. 43).
of sodium chloride dominate the water chemistry at depths greater than 1,500 ft (Raymond, 1991; Ortiz and others, 1993; Pashin and Hinkle, 1997; Pashin and others, 2004).
At depths less than 1,500 ft in the Pottsville Formation (fig. 16), bicarbonate water apparently formed by meteoric recharge of the phreatic zone. Similar amounts of bicarbonate in deeper, higher salinity water (such as in the Brookwood field, fig. 16) suggest a genetic linkage with the shallower water, but increased chlorinity indicates that the deeper water is sufficiently old to have mixed with brine from strata below the Pottsville coals. The presence of contrasting bicarbonate and chloride waters between 1,000 and 1,500 ft indicates mixing within the productive reservoir zone (fig. 16). Dissolved-solids content is less than 10,000 milligrams per liter (mg/L) in most areas of coal-gas production (Pashin and others, 1991; Ellard and others, 1992, 1997; Sparks and others, 1993; Pashin and others, 2004).
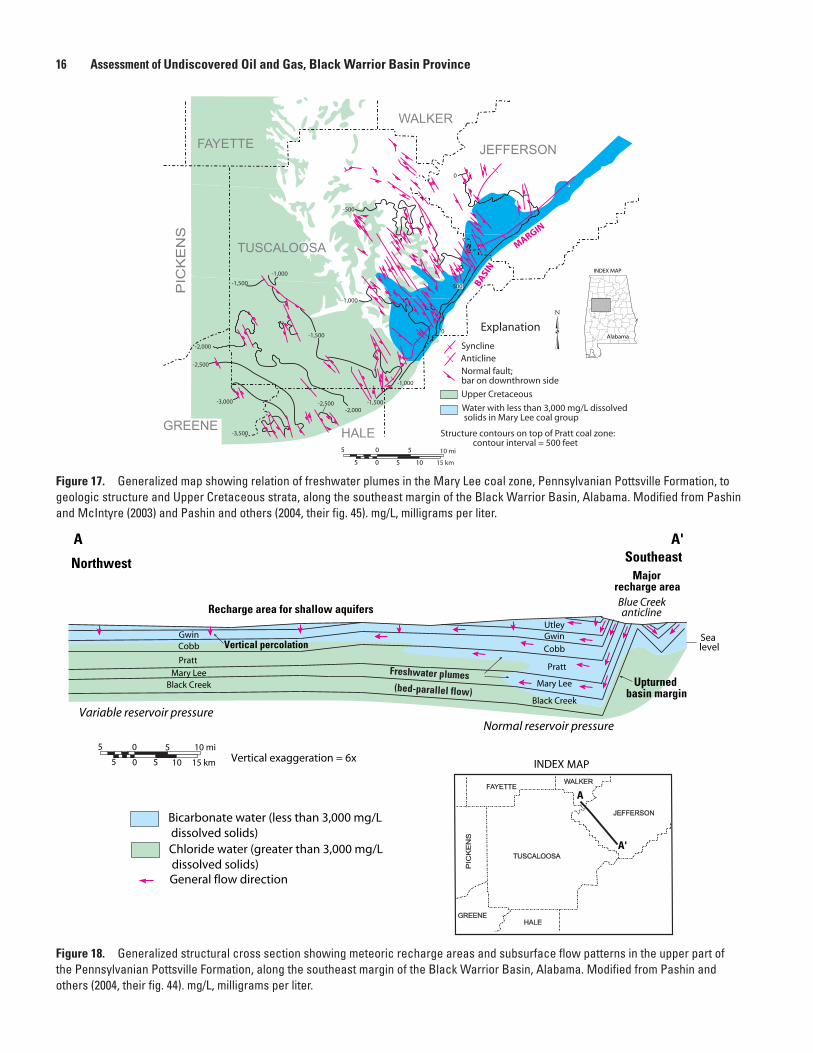
Along the southeast margin of the basin, water in the Mary Lee coal zone consistently has dissolved-solids content less than 3,000 mg/L, and in places, dissolved-solids content is less than 1,000 mg/L (Pashin and others, 1991) (figs. 17, 18). Upturned and fractured strata in the forelimb of the Birmingham anticlinorium form a recharge zone in which the coals are at or near the surface. Accordingly, water with dissolved-solids content less than 3,000 mg/L has been interpreted to define a series of active freshwater plumes that extend from the forelimb of the Birmingham anticlinorium deep into the Black Warrior Basin (Pashin and others, 1991).
The freshwater plumes terminate at the edge of Cretaceous outcrops, suggesting that the poorly consolidated strata of the Upper Cretaceous Tuscaloosa Group intercept the freshwater recharge in those areas (Pashin and others, 2004).
Natural Gas Chemistry
Natural gases produced from coals in the Black Warrior Basin are very dry, with median gas wetness only about 0.1 percent; median CO2 content is 0.08 percent, and median N2 content less than 0.01 percent (table 2). There is no measurable H2S. Geographic distributions of sampled gases and gas wetnesses (Oak Grove, Brookwood, and Deerlick Creek degasification fields) are shown in figure 19. Rice (1993) interpreted the coal gases to be mainly of thermogenic origin. However, based primarily on the relatively negative d13C1 compositions of the coal-bed gases, he (Rice, 1993) suggested that the gases are a mixture of thermogenic gas and gas produced during a late-stage methanogenesis. This methanogenesis was initiated by freshwater incursions into the shallower coals on the east side of the basin (see figs. 17, 18) that may have begun during the late stages of Mesozoic unroofing. These incursions are apparently controlled by northwest-trending faults and fractures (Pashin and others, 1991).
1� Assessment of Undiscovered Oil and Gas, Black Warrior Basin Province
Figure 1�. Generalized map showing relation of freshwater plumes in the Mary Lee coal zone, Pennsylvanian Pottsville Formation, to geologic structure and Upper Cretaceous strata, along the southeast margin of the Black Warrior Basin, Alabama. Modified from Pashin and McIntyre (2003) and Pashin and others (2004, their fig. 45). mg/L, milligrams per liter.
PIC
KE
NS
TUSCALOOSA
WALKER
FAYETTE
HALEGREENE
JEFFERSON
Figure 1�. Generalized structural cross section showing meteoric recharge areas and subsurface flow patterns in the upper part of the Pennsylvanian Pottsville Formation, along the southeast margin of the Black Warrior Basin, Alabama. Modified from Pashin and others (2004, their fig. 44). mg/L, milligrams per liter.
Mary Lee
Black Creek
A
Northwest
A'Southeast
Vertical exaggeration = 6x
Bicarbonate water (less than 3,000 mg/L dissolved solids) Chloride water (greater than 3,000 mg/L dissolved solids) General flow direction
INDEX MAP
Blue Creek anticline
Majorrecharge area
Normal reservoir pressure Variable reservoir pressure
Recharge area for shallow aquifers
Vertical percolation
Upturnedbasin margin
Pratt
Cobb
Gwin
Mary Lee Black Creek
Pratt
CobbSealevel
GwinUtley
0 5 10 mi 5
5 0 5 10 15 km
A
A'
Freshwater plumes(bed-parallel flow)
PIC
KE
NS
TUSCALOOSA
JEFFERSON
WALKER FAYETTE
HALEGREENE

1�Assessment of Pottsville Coal Total Petroleum Sytem—Black Warrior Basin Province
Figure 1�. Generalized map showing the distribution of gas wetness for samples of coal gas from the Pennsylvanian Pottsville Forma-tion in the southeastern part of the Black Warrior Basin, Alabama. Coal degasification field outlines (dashed blue lines) are from Pashin and others (2001a; 2001b; 2004); fields are identified in figure 20; gas wetness percent = 100 x (1–[C1mole %/ΣC1–C5 mol %].
Explanation
PIC
KE
NS
TUSCALOOSA JEFFERSON
WALKERFAYETTE
GREENEHALE
INDEX MAP
Oak Grove
BrookwoodDeerlick Creek
Gas wetness percent 0 – 0.90.9 – 2.62.6 – 5.2
5.2 – 9.29.2 – 14.5
14.5 – 28.5
Table �. Ranges and median values for gas wetness, N2, and CO2 contents, and d13C1 for gases from coals in the Pennsylvanian Pottsville Formation, southeastern part of the Black Warrior Basin, Alabama.[Gas wetness % = 100 x (1–[mole % C1/Σ mole % C1–C5]); n, number of observations; %, percent; ‰, part per thousand; PDB, relative to Pee Dee belemnite standard; < , less than. C1 to C5, N2 and CO2 analyses are from Moore and Sigler (1987) and Hamak and Sigler (1991); d13C1 analyses are from Pashin and Hinkle (1997, their table 3)]
Statistic Gas wetness (%)CO�
(mole %)N�
(mole %)d1�C1
(‰ PDB)
MedianRange
(n)
0.01<0.01 to 4.0
(19)
0.080.03 to 0.20
(19)
<0.01<0.01 to 1.2
(19)
–47.4–51.0 to –41.9
(17)
1� Assessment of Undiscovered Oil and Gas, Black Warrior Basin Province
Black Warrior Basin Assessment Unit
Gas and Water Production
Estimates of volumes of undiscovered gas from undrilled areas in the Black Warrior Basin are based on historical production data, well characteristics, distributions of gas and water production, and the relation of gas production to the geologic framework.
Historical Production
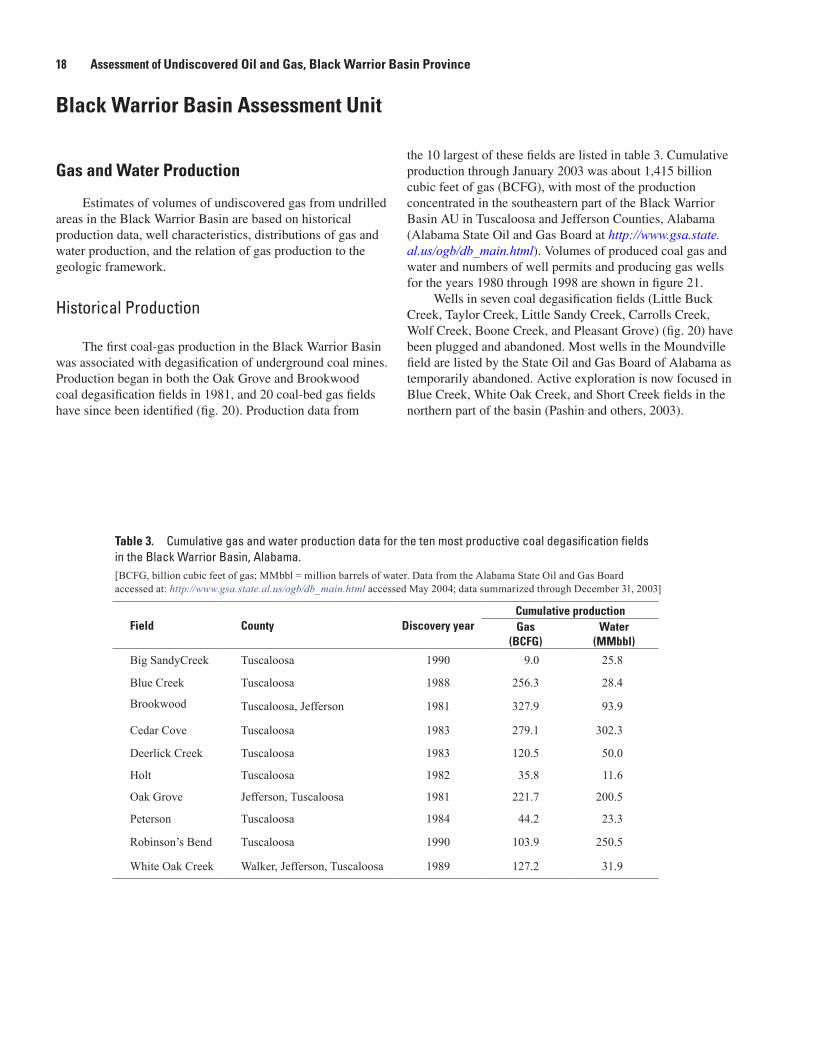
The first coal-gas production in the Black Warrior Basin was associated with degasification of underground coal mines. Production began in both the Oak Grove and Brookwood coal degasification fields in 1981, and 20 coal-bed gas fields have since been identified (fig. 20). Production data from
the 10 largest of these fields are listed in table 3. Cumulative production through January 2003 was about 1,415 billion cubic feet of gas (BCFG), with most of the production concentrated in the southeastern part of the Black Warrior Basin AU in Tuscaloosa and Jefferson Counties, Alabama (Alabama State Oil and Gas Board at http://www.gsa.state.al.us/ogb/db_main.html). Volumes of produced coal gas and water and numbers of well permits and producing gas wells for the years 1980 through 1998 are shown in figure 21.
Wells in seven coal degasification fields (Little Buck Creek, Taylor Creek, Little Sandy Creek, Carrolls Creek, Wolf Creek, Boone Creek, and Pleasant Grove) (fig. 20) have been plugged and abandoned. Most wells in the Moundville field are listed by the State Oil and Gas Board of Alabama as temporarily abandoned. Active exploration is now focused in Blue Creek, White Oak Creek, and Short Creek fields in the northern part of the basin (Pashin and others, 2003).
Table �. Cumulative gas and water production data for the ten most productive coal degasification fields in the Black Warrior Basin, Alabama.[BCFG, billion cubic feet of gas; MMbbl = million barrels of water. Data from the Alabama State Oil and Gas Board accessed at: http://www.gsa.state.al.us/ogb/db_main.html accessed May 2004; data summarized through December 31, 2003]
Field County Discovery yearCumulative productionGas
(BCFG)Water
(MMbbl)
Big SandyCreek Tuscaloosa 1990 9.0 25.8
Blue Creek Tuscaloosa 1988 256.3 28.4
Brookwood Tuscaloosa, Jefferson 1981 327.9 93.9
Cedar Cove Tuscaloosa 1983 279.1 302.3
Deerlick Creek Tuscaloosa 1983 120.5 50.0
Holt Tuscaloosa 1982 35.8 11.6
Oak Grove Jefferson, Tuscaloosa 1981 221.7 200.5
Peterson Tuscaloosa 1984 44.2 23.3
Robinson’s Bend Tuscaloosa 1990 103.9 250.5
White Oak Creek Walker, Jefferson, Tuscaloosa 1989 127.2 31.9

1�Assessment of Pottsville Coal Total Petroleum Sytem—Black Warrior Basin Province
Figure �0. Generalized map showing locations and status of coal degasification fields in the southeastern part of the Black Warrior Basin, Alabama (modified from Pashin and others (2001a; 2001b; 2004, their fig. 69).
Figure �1. Histograms of coal-gas and water production (A) and new well permits and producing wells (B) in the southeastern part of the Black Warrior Basin, Alabama, for the years 1980 through 1998. Histograms are from the Alabama Geological Survey Web site accessed at http://www.gsa.state.al.us, May/2004. BCFG, billion cubic feet of gas; MMbbl, million barrels.

�0 Assessment of Undiscovered Oil and Gas, Black Warrior Basin Province
Drilling Practices
Three types of coal-gas wells are drilled in the Black Warrior Basin—vertical wells, gob wells, and horizontal wells. Gob wells and horizontal wells are drilled in association with underground mining operations, whereas vertical wells are similar to conventional petroleum wells, have no dependence on mining operations, and are drilled in all coal-gas fields (Pashin and others, 2004).
Coal-gas development in the Black Warrior Basin began in 1980, and most wells have produced gas for 9 to 15 years. The earliest wells, which were underground mine degasification wells drilled between 1975 and 1980, are in closely spaced patterns (about 15 acres) in eastern Oak Grove field and in Pleasant Grove field. Subsequent field development has primarily utilized 40- and 80-acre well spacing. Most wells were drilled between 1988 and 1991 prior to expiration of the Section 29 tax credit, and nearly all are still producing (Pashin and others, 2004).
Completion practices in vertical wells vary considerably (for examples, see Lambert and others, 1980; Holditch and others, 1989; Pashin and Hinkle, 1997). Many early wells were open holes completed in single coals, but virtually all modern
wells are cased and perforated in multiple coals (Graves and others, 1983). Stimulation practices have also varied—early wells were stimulated with water and sand, nitrogen foam, or cross-linked gel, whereas the most recent vertical wells were stimulated with nitrogen foam (Pashin and others, 2004).
Essentially all vertical wells produce at least some water and gas, and the volumes of fluid produced and the production decline characteristics of these wells can be difficult to predict; however, some generalizations can be made. Gas and water production tend to peak during the first 2 years that wells are on line, although it is not uncommon for some wells to take more than 4 years to reach peak flow rates (Pashin and Hinkle, 1997). Once peak gas production is reached, it tends to decline exponentially (a constant rate of decline), whereas water production tends to decline hyperbolically (a decreasing rate of decline) (Pashin and others, 2004).
Cumulative Gas and Water Production The cumulative gas production map (fig. 22) shows a
general arcuate trend to the area in which most wells have produced more than 300 million cubic feet of gas (MMCFG). Within this trend, which extends from the Cedar Cove field
Figure ��. Generalized map showing cumulative gas production from vertical wells in the southeastern part of the Black Warrior Basin, Alabama. Modified from Pashin and others (2004, their fig. 77). Coal degasification field outlines (dashed blue lines) are from Pashin and others (2001a; 2001b; 2004). Fields are identified in figure 20. MMCFG, million cubic feet of gas.
PIC
KE
NS
TUSCALOOSA
WALKERFAYETTE
HALEGREENE
JEFFERSON
�1Assessment of Pottsville Coal Total Petroleum Sytem—Black Warrior Basin Province
northward into the White Oak Creek field (fields identified in fig. 20), many wells have had cumulative production exceeding 1 BCFG, and some wells in the Cedar Cove field have produced more than 1.5 BCFG. Outside this arcuate trend, cumulative production exceeding 300 MMCFG of gas has a patchy distribution; in the Little Sandy Creek, Moundsville, Little Buck Creek, and Taylor Creek fields, for example, only one well has produced more than 100 MMCFG (Pashin and others, 2004).
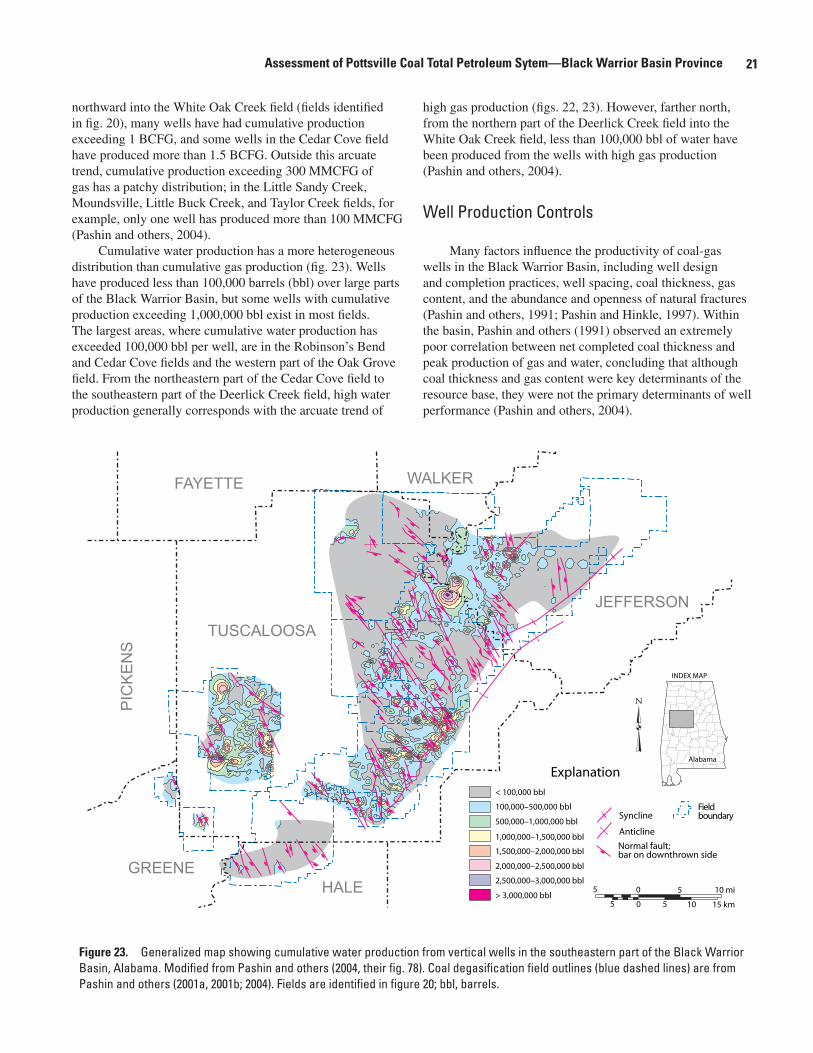
Cumulative water production has a more heterogeneous distribution than cumulative gas production (fig. 23). Wells have produced less than 100,000 barrels (bbl) over large parts of the Black Warrior Basin, but some wells with cumulative production exceeding 1,000,000 bbl exist in most fields. The largest areas, where cumulative water production has exceeded 100,000 bbl per well, are in the Robinson’s Bend and Cedar Cove fields and the western part of the Oak Grove field. From the northeastern part of the Cedar Cove field to the southeastern part of the Deerlick Creek field, high water production generally corresponds with the arcuate trend of
high gas production (figs. 22, 23). However, farther north, from the northern part of the Deerlick Creek field into the White Oak Creek field, less than 100,000 bbl of water have been produced from the wells with high gas production (Pashin and others, 2004).
Well Production Controls
Many factors influence the productivity of coal-gas wells in the Black Warrior Basin, including well design and completion practices, well spacing, coal thickness, gas content, and the abundance and openness of natural fractures (Pashin and others, 1991; Pashin and Hinkle, 1997). Within the basin, Pashin and others (1991) observed an extremely poor correlation between net completed coal thickness and peak production of gas and water, concluding that although coal thickness and gas content were key determinants of the resource base, they were not the primary determinants of well performance (Pashin and others, 2004).
Figure ��. Generalized map showing cumulative water production from vertical wells in the southeastern part of the Black Warrior Basin, Alabama. Modified from Pashin and others (2004, their fig. 78). Coal degasification field outlines (blue dashed lines) are from Pashin and others (2001a, 2001b; 2004). Fields are identified in figure 20; bbl, barrels.
PIC
KE
NS
TUSCALOOSA
WALKERFAYETTE
HALEGREENE
JEFFERSON
�� Assessment of Undiscovered Oil and Gas, Black Warrior Basin Province
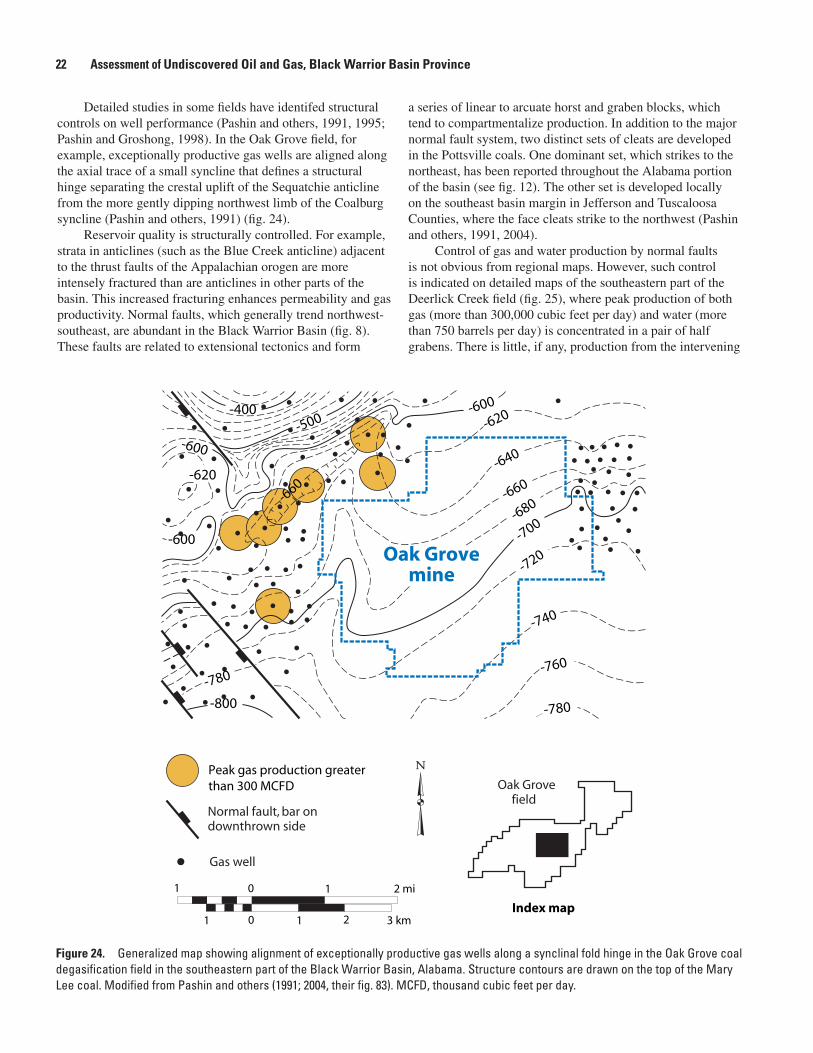
Detailed studies in some fields have identifed structural controls on well performance (Pashin and others, 1991, 1995; Pashin and Groshong, 1998). In the Oak Grove field, for example, exceptionally productive gas wells are aligned along the axial trace of a small syncline that defines a structural hinge separating the crestal uplift of the Sequatchie anticline from the more gently dipping northwest limb of the Coalburg syncline (Pashin and others, 1991) (fig. 24).
Reservoir quality is structurally controlled. For example, strata in anticlines (such as the Blue Creek anticline) adjacent to the thrust faults of the Appalachian orogen are more intensely fractured than are anticlines in other parts of the basin. This increased fracturing enhances permeability and gas productivity. Normal faults, which generally trend northwest-southeast, are abundant in the Black Warrior Basin (fig. 8). These faults are related to extensional tectonics and form
a series of linear to arcuate horst and graben blocks, which tend to compartmentalize production. In addition to the major normal fault system, two distinct sets of cleats are developed in the Pottsville coals. One dominant set, which strikes to the northeast, has been reported throughout the Alabama portion of the basin (see fig. 12). The other set is developed locally on the southeast basin margin in Jefferson and Tuscaloosa Counties, where the face cleats strike to the northwest (Pashin and others, 1991, 2004).
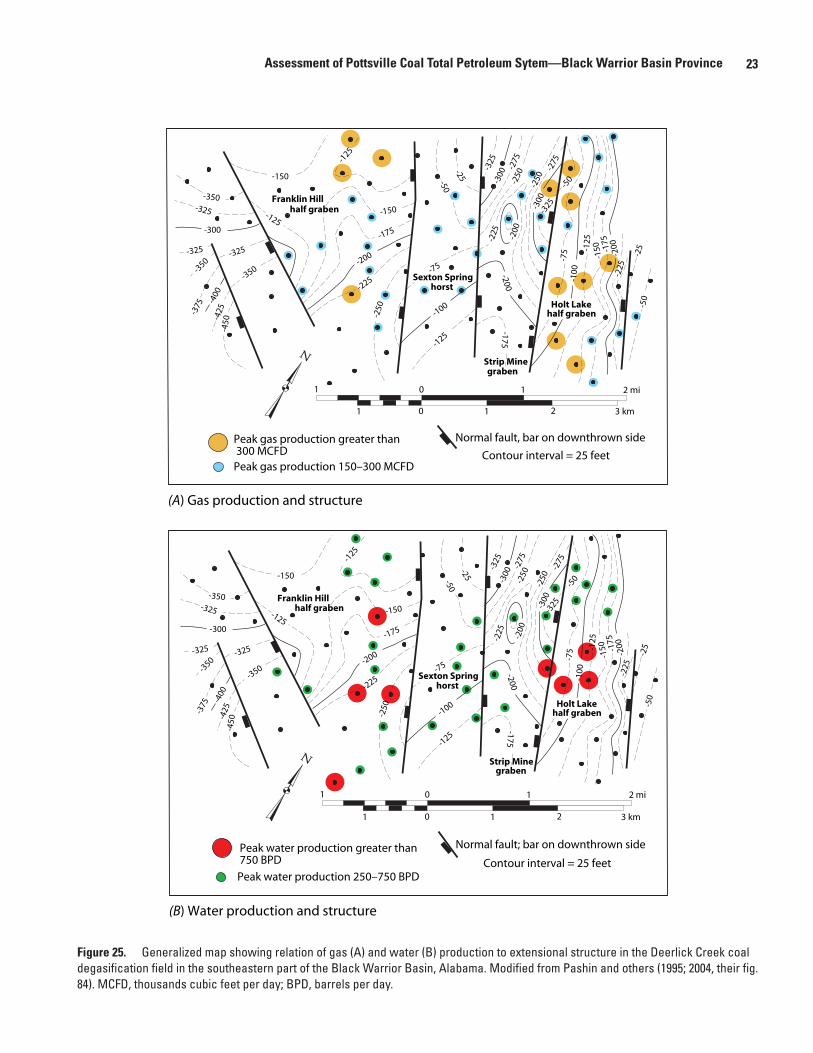
Control of gas and water production by normal faults is not obvious from regional maps. However, such control is indicated on detailed maps of the southeastern part of the Deerlick Creek field (fig. 25), where peak production of both gas (more than 300,000 cubic feet per day) and water (more than 750 barrels per day) is concentrated in a pair of half grabens. There is little, if any, production from the intervening
Figure ��. Generalized map showing alignment of exceptionally productive gas wells along a synclinal fold hinge in the Oak Grove coal degasification field in the southeastern part of the Black Warrior Basin, Alabama. Structure contours are drawn on the top of the Mary Lee coal. Modified from Pashin and others (1991; 2004, their fig. 83). MCFD, thousand cubic feet per day.
��Assessment of Pottsville Coal Total Petroleum Sytem—Black Warrior Basin Province
Figure ��. Generalized map showing relation of gas (A) and water (B) production to extensional structure in the Deerlick Creek coal degasification field in the southeastern part of the Black Warrior Basin, Alabama. Modified from Pashin and others (1995; 2004, their fig. 84). MCFD, thousands cubic feet per day; BPD, barrels per day.
�� Assessment of Undiscovered Oil and Gas, Black Warrior Basin Province
half graben and full graben (Pashin and others, 1995; Pashin and Groshong, 1998; Pashin and others, 2004).
The highly productive wells within the Strip Mine graben penetrate the bounding fault and are completed within the Holt Lake half graben. Well performance within the half grabens is extremely variable. Pashin (1998) and Pashin and Groshong (1998) attributed this variability to variable structural conditions between wells that influence the abundance and openness of natural fractures, thereby determining the effectiveness with which wells can dewater and depressurize the reservoir.
Assessment Results
Through the first quarter of 2000, more than 3,500 gas wells had been completed within the Black Warrior Basin AU, and some 3,200 of these wells were still producing (Pashin and others, 2004). A graph showing the estimated ultimate recovery (EUR) for gas wells in all fields, based on production from 3,200 wells, is shown in figure 26. Only wells with minimum recoveries of more than 10 MMCFG were used to calculate the EUR distributions shown in figure 26. The estimated minimum total recovery of 10 MMCFG was based on considerations of the minimum recovery that might be required for an untested cell to be economically viable within similar geologic and production constraints on producing gas wells in the basin.
EUR distributions by “thirds,” shown in figure 27, are based on dates of initial production for the first (early), second (middle), and third (late) fractions of the 3,200 producing gas wells; each third includes about 1,070 wells regardless of the number of years involved. Figure 27 shows two trends of interest to resource assessment: (1) earlier wells have overall lower maximum EUR projections, suggesting that more recent production has improved in terms of minimum recovery (likely the result of improved recovery technology); and (2) EUR projections of later wells have decreased from those of the middle wells, suggesting that the best wells (on average) have been drilled.
The EUR distributions were the primary basis for estimating minimum, median, and maximum ultimate recoveries for untested cells in the assessment unit. Our estimated median total recovery of gas per well of 400 MMCFG was based on the EURs estimated for 50 percent of the most recent one-third of the producing wells in the assessment unit (fig. 27). In contrast, our estimated maximum total recovery of 20,000 MMCFG (fig. 27 at 100 percent) per untested cells reflects the possibility that other wells with this much production might exist. Within the Black Warrior Basin AU, a general southeast to northwest decrease in well productivity is predicted, a likely result of the decreasing coal thermal maturity, decreasing number of coal beds, and resultant decrease in EUR per well. Our estimate for the minimum percentage of the untested area within the AU that has the potential for additions to reserves during the next 30 years is about 9 percent (about 640 mi2). This value assumes that
additional gas production will focus primarily on infill drilling, resulting in an increase in production within existing fields. Our estimated median percentage of untested area with the potential for additions to reserves in the next 30 years is about 27 percent (about 1,920 mi2). This value includes additions to reserves from infill drilling coupled with expansion of fields into currently untested areas.
Our analysis resulted in estimated volumes of potential additions to reserves within the Black Warrior Basin AU of 4.61 TCGF at the 95-percent certainty level, 6.85 TCFG at the 50-percent certainty level, 10.18 TCFG at the 5-percent certainty level, and a mean of 7.06 TCFG (U.S. Geological Survey, 2003, their table 1). In comparison, for the four Black Warrior Basin coal-gas plays characterized by Rice and Fenn (1995) for the 1995 USGS National Assessment Oil and Gas Assessment, Charpentier and others (1996) listed an estimated 2.2 TCFG at the 50-percent certainty level of potential additions to gas reserves.
References Cited
American Society for Testing and Materials, 2001, Standard classification of coals by rank (ASTM designation D 388–99): 2001 Annual Book of ASTM Standards, p. 190–195.
Butts, Charles, 1910, Description of the Birmingham quad-rangle, Alabama: U.S. Geological Survey Geologic Atlas, Folio 175, 24 p.
Butts, Charles, 1926, The Paleozoic rocks, in Adams, G.I., Butts, Charles, Stephenson, L.W., and Cooke, C.W., eds., Geology of Alabama: Alabama Geological Survey Special Report 14, p. 41–230.
Butts, Charles, 1927, Bessemer-Vandiver folio: U.S. Geologi-cal Survey Geologic Atlas, Folio 221, 22 p.
Carroll, R.E., Pashin, J.C., and Kugler, R.L., 1995, Burial history and source-rock characteristics of Upper Devonian through Pennsylvanian strata, Black Warrior basin, Ala-bama: Alabama Geological Survey Circular 187, 29 p.
Cates, L.M., and Groshong, R.H., Jr., 1999, Confirmation of regional thin-skinned extension in the eastern Black War-rior basin, Alabama, in Pashin J.C., and Carroll, R.E., eds., 1999, Geology of the Cahaba coal field: Alabama Geologi-cal Society 36th Annual Field Trip Guidebook, p. 49–57.
Charpentier, R.R., Klett, T.R., Obuch, R.C., and Brewton, J.D., 1996, Tabular data, text, and graphical images in support of the 1995 National Assessment of United States Oil and Gas Resources: U.S. Geological Survey Digital Data Series 36, one CD–ROM.

��Assessment of Pottsville Coal Total Petroleum Sytem—Black Warrior Basin Province
Figure ��. Distribution of estimated ultimate recoveries (EURs) for gas wells within the Black Warrior Basin Assessment Unit, Black Warrior Basin, Alabama. Only wells with minimum EURs exceeding 10 million cubic feet of gas (MMCFG) are shown.
Figure ��. Distribution of estimated ultimate recoveries (EURs) by thirds for gas wells within the Black Warrior Basin Assessment Unit, Black Warrior Basin, Alabama. Only wells with minimum EURs exceeding 10 million cubic feet of gas (MMCFG) are shown.
10
100
1,000
10,000
100,000
0 10 20 30 40 50 60 70 80 90 100
PERCENTAGE OF SAMPLED WELLS
ESTI
MAT
ED U
LTIM
ATE
RECO
VERY
(M
MCF
G)
10
100
1,000
10,000
100,000
0 10 20 30 40 50 60 70 80 90 100
PERCENTAGE OF SAMPLED WELLS
ESTI
MAT
ED U
LTIM
ATE
RECO
VERY
(M
MCF
G)
�� Assessment of Undiscovered Oil and Gas, Black Warrior Basin Province
Clayton, J.L., Leventhal, J.S., Rice, D.D., Pashin, J.C., Mosher, Byard, and Czepiel, Peter, 1994, Atmospheric methane flux from coals—Preliminary investigation of coal mines and geologic structures in the Black Warrior Basin, Alabama, in Howell, D.G., ed., The future of energy gases: U.S. Geological Survey Professional Paper 1570, p. 471–492.
Demko T.M., and Gastaldo R.A., 1996, Eustatic and autocy-clic influences on deposition of the lower Pennsylvanian Mary Lee coal zone, Warrior Basin, Alabama: International Journal of Coal Geology, v. 31, p. 3–19.
Eble, C.F., 1990, A palynological transect, swamp interior to swamp margin, in the Mary Lee coal bed, Warrior basin, Alabama, in Gastaldo, R.A., Demko, T.M., and Liu, Y., eds., Carboniferous coastal environments of the Mary Lee coal zone, Marion and Walker Counties, Alabama: Geological Society of America Southeastern Section Guidebook, Field Trip 5, Alabama Geological Survey Guidebook Series 3–VI, p. 65–81.
Ellard, J.S., Moffett, T.B., and Litzinger, L.A., 1997, Produc-tion-related causes of scaling in wells in the Cedar Cove and Oak Grove coal-bed methane fields of central Alabama: Tuscaloosa, University of Alabama, College of Continuing Studies, 1997 International Coal-Bed Methane Symposium Proceedings, p. 235–247.
Ellard, J.S., Roark, R.P., and Ayers, W.B., Jr., 1992, Geologic controls on coal-bed methane production—An example from the Pottsville Formation (Pennsylvanian Age), Black Warrior basin, Alabama, U.S.A., in Beamish, B.B., and Gamson, P.D., eds., 1992 Symposium on coal-bed methane research and development in Australia: Townsville, Austra-lia, James Cook University of North Queensland, p. 45–61.
Gastaldo, R.A., Demko, T.M., and Liu, Y., 1993, Application of sequence and genetic stratigraphic concepts to Carbon-iferous coal-bearing strata—An example from the Black Warrior Basin, USA: Geologische Rundschau, v. 82, p. 212–226.
Goldhaber, M.B., Lee, R.C., Hatch, J.R., Pashin, J.C., and Treworgy, Janet, 2003, Role of large-scale fluid flow in subsurface arsenic enrichment, in Welch, A.H., and Stol-lenwerk, K.G., eds., chapter 5 of Arsenic in groundwater—Occurrence and geochemistry: Boston/Dordrecht/London, Kluwer Academic Publishers, p. 127–176.
Graves, S.L., Patton, A F., and Beavers, W.M., 1983, Multiple zone coal degasification potential in the Warrior coal field of Alabama: Gulf Coast Association of Geological Societies Transactions, v. 33, p. 275–280.
Hamak, J.E., and Sigler, Stella, 1991, Analyses of natural gases, 1986–90: U.S. Bureau of Mines Information Circular 9301, 315 p.
Hines, R.A., Jr., 1988, Carboniferous evolution of the Black Warrior foreland basin, Alabama and Mississippi: Tusca-loosa, University of Alabama, unpublished Ph.D. disserta-tion, 231 p.
Holditch, S.A., Ely, J.W., and Carter, R.H., 1989, Develop-ment of a coal seam fracture design manual: Tuscaloosa, University of Alabama, 1989 Coal-Bed Methane Sympo-sium Proceedings, p. 299–320.
Jones, R.W., 1987, Organic facies, in Brooks, J., and Welte, D., eds., Advances in petroleum geochemistry, Volume 2: London, Academic Press, p. 1–90.
Jüntgen, H., and Karweil, J., 1966, Gasbildung und Gas-speicherung in Steinkohlenflözen, Teilen 1 und 2: Erdol und Kohle-Erdgas-Petrochemie, v. 19, p. 339–344.
Kidd, J.T., 1976, Configuration of the top of the Pottsville Formation in west-central Alabama: Alabama State Oil and Gas Board Oil and Gas Map 1.
Lambert, S.W., Trevits, M.A., and Steidl, P.F., 1980, Verti-cal borehole design and completion practices to remove methane gas from mineable coal beds: U.S. Department of Energy Report DOE/CMTC/TR–80/2, 163 p.
Levine, J.R., and Telle, W.R.,1991, Coal rank patterns in the Cahaba Coal Field and surrounding areas, and their significance, in Thomas, W.A., and Osborne, W.E., eds., Mississippian-Pennsylvanian tectonic history of the Cahaba synclinorium: Alabama Geological Society 28th Annual Field Trip Guidebook, p. 99–117.
Liu, Y., and Gastaldo, R.A., 1992, Characteristics of a Penn-sylvanian ravinement surface: Sedimentary Geology, v. 77, p. 197–213.
Mack, G.H., Thomas, W.A., and Horsey, C.A., 1983, Compo-sition of Carboniferous sandstones and tectonic framework of southern Appalachian-Ouachita orogen: Journal of Sedi-mentary Petrology, v. 54, p. 1444–1456.
Magoon, L.B., and Dow, W.G., 1994, The petroleum system, in Magoon, L.B., and Dow, W.G., eds., The petroleum system—From source to trap: American Association of Petroleum Geologists Memoir 60, p. 3–24.
McCalley, Henry, 1900, Report on the Warrior coal basin: Alabama Geological Survey Special Report 10, 327 p.
McFall, K.S., Wicks, D.E., and V.A. Kuuskraa, 1986, A geological assessment of natural gas from coal seams in the Warrior basin, Alabama—Topical report (September 1985 – September 1986): Gas Research Institute Contract no. 5084–214–1066: Washington, D.C., Lewin and Associates, 80 p.
��Assessment of Pottsville Coal Total Petroleum Sytem—Black Warrior Basin Province
Mellen, F.F., 1947, Black Warrior basin, Alabama and Mis-sissippi: American Association of Petroleum Geologists Bulletin, v. 31, p. 1801–1816.
Moore, B.J., and Sigler, Stella, 1987, Analyses of natural gases, 1917–85: U.S. Bureau of Mines Information Circular 9129, 1197 p.
Ortiz, I., Weller, T.F., Anthony, R.V., Frank, J., Linz, D., and Nakles, D., 1993, Disposal of produced waters—Under-ground injection option in the Black Warrior basin: Tusca-loosa, University of Alabama, 1993 International Coal-Bed Methane Symposium Proceedings, p. 339–364.
Osborne, W.E., Szabo, M.W., Copeland, C.W., Jr., and Neathery, T.L., 1989, Geologic map of Alabama: Alabama Geological Survey Special Map 221, scale 1:500,000.
Pashin, J.C., 1994a, Flexurally influenced eustatic cycles in the Pottsville Formation (Lower Pennsylvanian), Black Warrior basin, Alabama, in Dennison, J.M., and Ettensohn, F.R., eds., Tectonic and eustatic controls on sedimentary cycles: Society of Economic Paleontologists and Mineralo-gists Concepts in Sedimentology and Paleontology, v. 4, p. 89–105.
Pashin, J.C., 1994b, Cycles and stacking patterns in Carbonif-erous rocks of the Black Warrior foreland basin: Gulf Coast Association of Geological Societies Transactions, v. 44, p. 555–563.
Pashin, J.C., 1994c, Coal-body geometry and syn-sedimentary detachment folding in Oak Grove coal-bed methane field, Black Warrior basin, Alabama: American Association of Petroleum Geologists Bulletin, v. 78, p. 960–980.
Pashin, J.C., 1998, Stratigraphy and structure of coal-bed methane reservoirs in the United States—An overview: International Journal of Coal Geology, v. 35, p. 209–240.
Pashin, J.C., Carroll, R.E., Groshong, R.H., Jr., Raymond, D.E., McIntyre, Marcella, and Payton, W.J., 2003, Geologic screening criteria for sequestration of CO2 in coal—Quan-tifying potential of the Black Warrior coal-bed methane fairway, Alabama: Annual Technical Progress Report, U.S. Department of Energy, National Technology Laboratory, contract DE–FC–00NT40927, 190 p.
Pashin, J.C., Carroll, R.E., Groshong, R.H., Jr., Raymond, D.E., McIntyre, Marcella, and Payton, J. W., 2004, Geologic screening criteria for sequestration of CO2 in coal— Quan-tifying potential of the Black Warrior coal-bed methane fair-way, Alabama: Final Technical Report, U.S. Department of Energy, National Energy Technology Laboratory, contract DE–FC26–00NT40927, 254 p.
Pashin, J.C., Carroll, R.E., Hatch, J.R., and Goldhaber, M.B., 1999a, Mechanical and thermal control of cleating and shearing in coal—Examples from the Alabama coal-bed methane fields, USA, in Mastalerz, M., Glikson, M., and Golding, S., eds., Coal-bed methane—Scientific, environ-mental and economic evaluation: Dordrecht, Netherlands, Kluwer Academic Publishers, p. 305–327.
Pashin, J.C., Carroll, R.E., Hatch, J.R., and Goldhaber, M.B., 1999b, Interplay among cleating, maturation, and mineral-ization in coal-bed methane reservoirs of the Black Warrior basin: 1999 International Coal-bed Methane Symposium Proceedings: Tuscaloosa, University of Alabama College of Continuing Studies, p. 367–375.
Pashin, J.C., and Groshong, R.H., Jr., 1998, Structural control of coal-bed methane production in Alabama: International Journal of Coal Geology, v. 38, p. 89–113.
Pashin, J.C., Groshong, R.H., Jr., and Carroll, R.E., 2001a, Enhanced coal-bed methane recovery through sequestration of carbon dioxide—Potential for a market-based environ-mental solution in the Black Warrior basin of Alabama: Washington, D.C., U.S. Department of Energy, National Energy Technology Laboratory, First National Confer-ence on Carbon Sequestration Proceedings, nonpaginated CD–ROM.
Pashin, J.C., Groshong, R.H., Jr., and Carroll, R.E., 2001b, Carbon sequestration potential of coal-bed methane res-ervoirs in the Black Warrior basin—A preliminary look: Tuscaloosa, University of Alabama, College of Continuing Studies, 2001 International Coal-Bed Methane Symposium Proceedings, p. 51–62.
Pashin, J.C., Groshong, R.H., Jr., and Wang, Saiwei, 1995, Thin-skinned structures influence gas production in Ala-bama coal-bed methane fields: Tuscaloosa, University of Alabama, Inter Gas ‘95 Proceedings, p. 39–52.
Pashin, J.C., and Hinkle, Frank, 1997, Coal-bed methane in Alabama: Alabama Geological Survey Circular 192, 71 p.
Pashin, J.C., and McIntyre, M.R., 2003, Temperature-pres-sure conditions in coal-bed methane reservoirs of the Black Warrior basin, Alabama, U.S.A—Implications for carbon sequestration and enhanced coal-bed methane recovery: International Journal of Coal Geology, v. 54, p. 167–183.
Pashin, J.C., Ward, W.E. II, Winston, R.B., Chandler, R.V., Bolin, D.E., Richter, K.E., Osborne, W.E., and Sarnecki, J.C., 1991, Regional analysis of the Black Creek–Cobb coal-bed-methane target interval, Black Warrior basin, Alabama: Alabama Geological Survey Bulletin 145, 127 p.
�� Assessment of Undiscovered Oil and Gas, Black Warrior Basin Province
Pitman, J.K., Pashin, J.C., Hatch, J.R., and Goldhaber, M.B., 2003, Origin of minerals in joint and cleat systems of the Pottsville Formation, Black Warrior basin, Ala-bama—Implications for coal-bed methane generation and production: American Association of Petroleum Geologists Bulletin, v. 87, p. 713–731.
Raymond, R.N., 1991, Regulatory aspects of permitting and operating a class II salt water disposal (SWD) well in the coal-bed methane production areas of Alabama: Tuscaloosa, University of Alabama, 1991 Coal-Bed Methane Sympo-sium Proceedings, p. 6973.
Rheams, L.J., and Benson, D.J., 1982, Depositional setting of the Pottsville Formation in the Black Warrior basin: Alabama Geological Society 19th Annual Field Trip Guide-book, 94 p.
Rice, D.D., 1993, Composition and origins of coal-bed gas, in Law, B.E., and Rice, D.D., eds., Hydrocarbons from coal: American Association of Petroleum Geologists Studies in Geology no. 38, p. 159–184.
Rice, D.D., and Finn, T.M., 1995, Black Warrior Basin Prov-ince (065), in Gautier D.L., Dolton, G.L., Takahasi, K.I., and Varnes, K.L., eds., 1995 National assessment of United States Oil and Gas Resources: U.S. Geological Survey Digi-tal Data Series 30, one CD–ROM.
Rodgers, John, 1950, Mechanics of Appalachian folding as illustrated by the Sequatchie anticline, Tennessee and Alabama: American Association of Petroleum Geologists Bulletin, v. 34, p. 672–681.
Semmes, D.R., 1929, Oil and gas in Alabama: Alabama Geo-logical Survey Special Report 15, 408 p.
Sestak, H.M., 1984, Stratigraphy and depositional environ-ments of the Pennsylvanian Pottsville Formation in the Black Warrior basin, Alabama and Mississippi: Tuscaloosa, University of Alabama, unpub. Master’s thesis, 184 p.
Sparks, D.P., Lambert, S.W., and McLendon, T.H., 1993, Coal-bed gas well flow performance controls, Cedar Cove area, Warrior basin, U.S.A.: Tuscaloosa, University of Ala-bama, 1993 International Coal-Bed Methane Symposium Proceedings, p. 529–548.
Telle, W.R., Thompson, D.A., Lottman, L.K., and Malone, P.G., 1987, Preliminary burial-thermal history investiga-tions of the Black Warrior basin—Implications for coal-bed methane and conventional hydrocarbon development: Tus-caloosa, University of Alabama, 1987 Coal-bed Methane Symposium Proceedings, p. 37–50.
Thomas, W.A., 1985, Northern Alabama sections, in Wood-ward, N.B., ed., Valley and Ridge thrust belt—Balanced structural sections, Pennsylvania to Alabama: University of Tennessee Department of Geological Sciences Studies in Geology 12, p. 54–60.
Thomas, W.A., 1988, The Black Warrior basin, in Sloss, L.L., ed., Sedimentary cover—North American craton: Geologi-cal Society of America, The geology of North America, v. D–2, p. 471–492.
Thomas, W.A., 2001, Mushwad—Ductile duplex in the Appa-lachian thrust belt in Alabama: American Association of Petroleum Geologists Bulletin, v. 85, p. 1847–1869.
Tissot, B.P., and Welte, D.H., 1984, Petroleum formation and occurrence, second revised and enlarged edition: New York, Springer-Verlag, 699 p.
U.S. Geological Survey, 2003, Assessment of undiscovered oil and gas resources of the Black Warrior Basin Province, 2002: U.S. Geological Survey Fact Sheet FS–038–03, 2 p.
Vail, P.R., 1987, Seismic stratigraphy interpretation procedure: American Association of Petroleum Geologists Studies in Geology 27, v. 1, p. 1–10.
Wanless, H.R., 1976, Appalachian region: U.S. Geological Survey Professional Paper 853–C, p. 17–62.
Ward, W.E. II, Drahovzal, J.A., and Evans, F.E., Jr., 1984, Fracture analyses in a selected area of the Warrior coal basin, Alabama: Alabama Geological Survey Circular 111, 78 p,
Winston, R.B., 1990a, Vitrinite reflectance of Alabama’s bituminous coal: Alabama Geological Survey Circular 139, 54 p.
Winston, R.B., 1990b, Preliminary report on coal quality trends in upper Pottsville Formation coal groups and their relationships to coal resource development, coal-bed meth-ane occurrence, and geologic history in the Warrior coal basin, Alabama: Alabama Geological Survey Circular 152, 53 p.
Volume Title Page
Top Related