


Languages
Pages
Legal

1
CHAPTER 1
BACKGROUND
1.1 INTRODUCTION
Nowadays, natural resources such as natural gas and fossil fuels are depleting fast
together with the current energy crisis, fluctuating fossil fuel price is a big problem for
lots of industrial owner or even shareholder. Companies face bankrupt or zero
production due to the unforeseen economy conditions. Biomass is the solution to the
problem with the reason that biomass is contributing to the green industries with
associated growth in rural economies [2, 8]. As a readily renewable fuel, biomass has
become one of the significant components in the global sustainable and environmentally
friendly energy. Besides this, it could also be supplied easily compared to others natural
resources. Another reason for it is because the price of raw material is much lower
compared to the other resources.
Renewable biomass could be readily gasified to produce high purity hydrogen and other
gases such as methane, carbon dioxide, carbon monoxide and so on. However, in this
project, biomass will be mainly focused on Empty Fruit Bunch (EFB) to produce
hydrogen. Hydrogen produced from biomass is a type of clean energy where no net
carbon dioxide is being produced. What is the reason for no net carbon? It is because,
Palm oil trees need carbon dioxide while Empty Fruit Bunch from palm oil trees may
produce carbon dioxide for the tress. With that, carbon dioxide that is being produced is
neutral and it could be absorbed again by the plantation of Palm Oil or other plants.
Hydrogen also could be readily be used in most of the present natural gas derived
hydrogen energy conversion systems and also in advanced power generation devices
such as fuel cells. With the forecasted EFB availability around Malaysia per year, 28.46
x 106 tons of EFB is being produced per year. This number is equivalent to a total of 8%
of Hydrogen world demand which mentioned by Yong et al. While biomass currently
contribute 11% of the total world energy supply according to IEA report year 2007.
Gasification produces a product gas from biomass, which could be used either hydrogen
or other value-added by-products. Gasification technology is renewed every now and
brought to you by COREView metadata, citation and similar papers at core.ac.uk
provided by UTPedia

2
since and it keeps on evolving in order to meet the demand of lowest cost of production
and higher production rate. This project focused on integrated pressurized gasification
which a technology that has yet been discovered until the time where this report is
produced.
1.2 TECHNICAL BACKGROUND
Gasification of biomass is a process used to produce gas from solid biomass.
Gasification includes both bio-chemical and thermo-chemical process gasification.
Biochemical gasification means gasification by microorganism at normal temperature
and pressure while thermo-chemical gasification means using either air, oxygen or
steam at temperature more than 800 degree Celsius [1]. In this research gasification will
refer to thermo-chemical gasification. In our system, we incorporated carbon dioxide
removal unit to enhance the production of hydrogen and to conduct it in high pressure
system.
1.2.1 Gasification Reactor Type
Currently found in the industry was the fluidized bed and fixed bed, direct firing and
indirect firing, updraft or down draft, or entrained bed and many more. Well in this
project, Fluidized bed will be the main concern to be considered into the situation.
Section 1.2.2.1 will explain into more detail about fluidized bed.
1.2.1.1 Fluidized bed
The advantages of fluidized bed gasification is the uniform temperature distribution
achieved in the gasification zone which is being achieve by using a bed of fine-grained
material into which air or steam or air-steam mixture is introduced [1]. Fluidization is to
ensure the bed has intimate mixing of the hot bed material, the hot combustion gas and
the biomass feed. There are two main types of fluidized bed.
First fluidized bed is the Circulating Fluidized Bed also known as CFB in short.
Circulating Fluidized Bed has high throughput and its bed material were circulated
between the reactor and cyclone separator. It can be operated in elevated pressure [3].

3
Second type of fluidized bed is the bubbling bed. It has a grate at the bottom of the
moving bed which is used for air intake [1]. The moving bed consists of fine-grained
material where feed is being introduced. Bed temperature is being controlled by
manipulating the air to biomass ratio.
However, most difficulties faced by fluidized bed is the slagging of bed material due to
ash content of biomass. To avoid slagging, temperature has to be lowered down [1]. The
gas formed in the gasifier has the below compound:
a. Particulates
Mostly consist of char. Quantity depends on technology used. Fixed bed
produces lesser particulates comparing fluidized bed [1]. Particulates above
10µm can be removed using separator while finer particles require filtering
device.
b. Tar
Tar will be condensed at temperature of less than 450 degree C [1]. Tar can
accumulate at the surface of piping and partly remaining as aerosol in the gas.
Steam gasification produces liquid tar with low molecular weight. High
temperature gasification produces tar at lower oxygen content [1].
c. Nitrogen compound
Nitrogen is being feed into the gasifier together with air. Content of Nitrogen
will dilute the system and lower the productivity.
d. Sulphur compound
Sulphur compound will damage the catalyst and causes high cost in maintenance
and catalyst changing.
e. Alkali compound
Alkali compound such as Ammonia might form with the presence of Nitrogen
and Hydrogen after gasification. This problem might cause effects to the piping
system and increase cost of maintenance and operating in the end as ammonia
need to be separated again before products can be further used.

4
Table 1: Pros and Cons of a Fluidized Bed
Advantages Disadvantages
Flexible feed rate and composition High product gas temperature
High ash fuel acceptable High tar and fines content in gas
Able to pressurized Possibility of high C content in gas
High CH4 in product gas Operating temperature limited by ash clinkering
High volumetric capacity
Easy temperature control
1.2.2 Choices of Gasifying Agent
There are three types of gasifying agent for the gasification of biomass to take place.
Air can be used as gasifying agent. Beware that air consist of nitrogen and oxygen at the
same time. Nitrogen content in air will dilute the outlet gas and need extra work for
separation. Besides separation, nitrogen, as mentioned will cause the formation of some
alkaline gas, thus causes some pollution if purged and corrosion might happened at
piping system or instrumentation system in the flowsheet.
Next gasifying agent is pure oxygen. Oxygen is mixed together in the gasification unit
in order to have the biomass gasify. Pure oxygen may eliminate the problem of nitrogen
and ammonia. However producing or purchasing of oxygen may be very expensive.
Another type of gasification agent is steam. Steam can be high in temperature and
pressure. Reaction with Empty Fruit Bunch and Steam is a type of endothermic
reaction. Endothermic reaction needs heat so that the reaction will run well. It requires
heat to be supplied at a temperature around 700 degrees Celsius [1].
1.2.3 Reaction in Integrated Gasifier
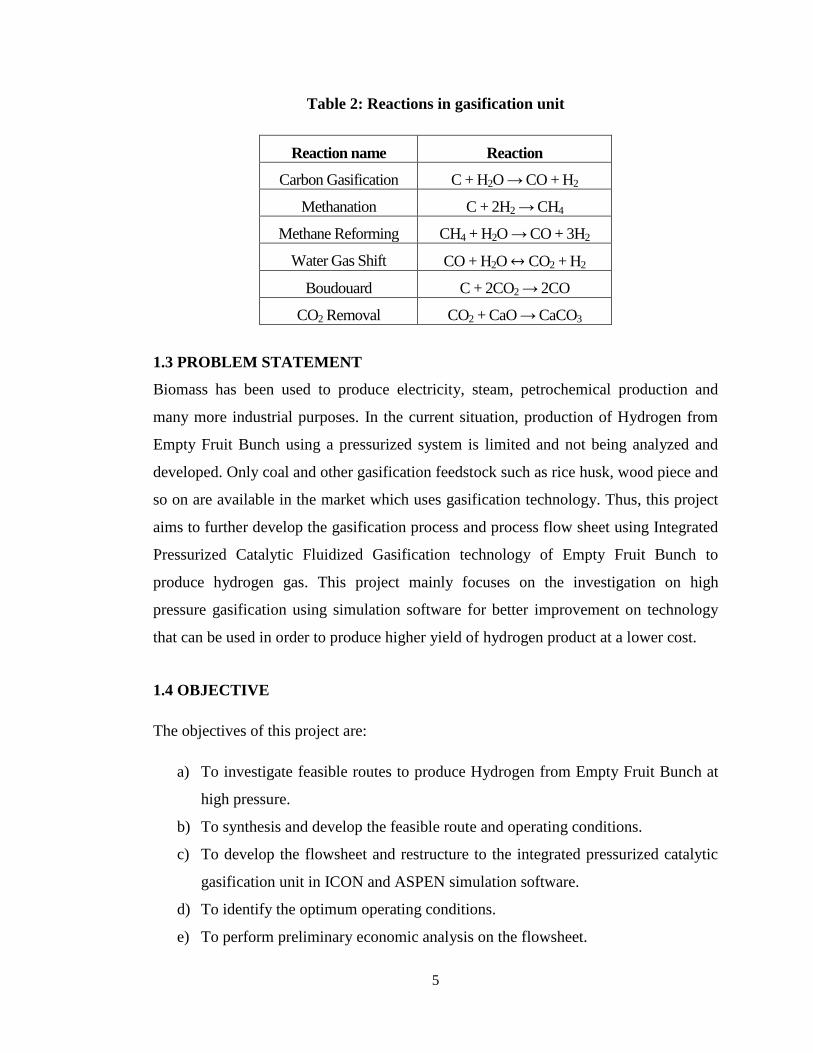
Table below shows reactions for gasification unit. In this gasifier, we have carbon
gasification reaction, methanation reaction, methane reforming reaction, water gas shift
reaction, boudouard reaction, and not to forget, carbon dioxide removal reaction. In
carbon dioxide removal system, we use calcium oxide as the catalyst.
5
Table 2: Reactions in gasification unit
Reaction name Reaction
Carbon Gasification C + H2O → CO + H2
Methanation C + 2H2 → CH4
Methane Reforming CH4 + H2O → CO + 3H2
Water Gas Shift CO + H2O ↔ CO2 + H2
Boudouard C + 2CO2 → 2CO
CO2 Removal CO2 + CaO → CaCO3
1.3 PROBLEM STATEMENT
Biomass has been used to produce electricity, steam, petrochemical production and
many more industrial purposes. In the current situation, production of Hydrogen from
Empty Fruit Bunch using a pressurized system is limited and not being analyzed and
developed. Only coal and other gasification feedstock such as rice husk, wood piece and
so on are available in the market which uses gasification technology. Thus, this project
aims to further develop the gasification process and process flow sheet using Integrated
Pressurized Catalytic Fluidized Gasification technology of Empty Fruit Bunch to
produce hydrogen gas. This project mainly focuses on the investigation on high
pressure gasification using simulation software for better improvement on technology
that can be used in order to produce higher yield of hydrogen product at a lower cost.
1.4 OBJECTIVE
The objectives of this project are:
a) To investigate feasible routes to produce Hydrogen from Empty Fruit Bunch at
high pressure.
b) To synthesis and develop the feasible route and operating conditions.
c) To develop the flowsheet and restructure to the integrated pressurized catalytic
gasification unit in ICON and ASPEN simulation software.
d) To identify the optimum operating conditions.
e) To perform preliminary economic analysis on the flowsheet.

6
1.5 SCOPE OF STUDY
This project aimed to produce a flowsheet and develop an integrated pressurized
catalytic fluidized gasification unit of EFB in iCON simulation. This project also
involved investigation and improvement the current technology and feasible route to
produce hydrogen from EFB at high pressure. Operating ranges for the project is
0.6MPa to 2MPa for pressure, and temperature range from 1200ºC to 1500ºC while
Steam to biomass ratio is analyzed at a ratio of 2 to 3. Gasification agent is steam while
absorbent used to absorb carbon dioxide is calcium oxide.

7
CHAPTER 2
LITERATURE REVIEW AND THEORY
This chapter focused mainly on theory, experiment or project done by other peoples and
the stage of developed gasification system and so on. Literature review is to guide and
facilitate the understanding of the topic before proceed into the development of
simulation for gasification of EFB.
2.1 Empty Fruit Bunch, Cellulose, Biomass
According to the literature by Wang et al, the author mentioned bio-energy from
biomass is sustainable and environment-friendly featured by its low emissions of SO2
and NOx while producing no net Carbon Dioxide [5]. No net Carbon Dioxide in this
report means Carbon Dioxide produced will not have any effects to the environment and
the green house because Carbon Dioxide that is being gasified is equals to the amount
needed by the palm tree. This also means Carbon Dioxide is then being absorbed by the
palm oil trees again without polluting the environment.
Maniatis et al. mentioned that biomass is sustainable and environment-friendly featured
by its low emissions of alkaline salt while producing no net Carbon Dioxide. This short
rotation forestry and other energy crops can contribute significantly towards the
objectives of the Kyoto Agreement in reducing the green house gases emissions and to
the problems related to climate change [9]. Empty fruit Bunch not only contributing in
term of Carbon Dioxide, it also contribute in producing clean gas which is Hydrogen.
Hydrogen currently is being used even as a type of fuel for vehicle. Wide usage of
Hydrogen causes this project to be feasible.
2.2 Flowsheet simulation on gasifier
Maniatis et al. also presented that, in order to stay competence in the biomass energy
conversion market, one must be able to produce something different from the current
available technology [9]. Pressurized Integrated Catalytic Gasification may still the

8
feasible one as it has never been developed before and as mentioned by the author we
need to be creative with new ideas and development from the previous experience by
other researcher. This has added a possibility and opportunity to contribute to the
world’s biomass gasification technology.
2.3 Kinetics of gasification
Moilanen et al. observed that steam gasification of peat char presents a rate slightly
faster than that observed in Carbon Dioxide environment. For high pressure
gasification, kinetics of reaction is hard to be found. The reason is, the technology has
not widely being developed yet. In this project of integrated gasification which
including the carbon dioxide removal using calcium oxide, reducing Carbon Dioxide at
the same time with gasification will eliminate this problem and thus increase its
production of hydrogen. Which also means rate of gasification will increase with the
decreasing amount of Carbon Dioxide [10].
Matsuoka et al. conducted an experiment using Australian Loy Yng Lignite and
Indonesian sub-bituminous Adaro coal. Kinetics of Char Gasification was found for
these two different types of char [11].
1. Adaro Coal k = 1.06 x10⁹ P
0.5(H2O) exp (-250000/RT)
2. Loy Yang Lignite k = 8.04 x 10⁹ P
0.4 (H2O) exp (-230000/RT)
This kinetics was put into consideration in our model but at last it was not adapted. The
experiment conducted by them was being run through in a high pressure gasifier of
0.2MPa, and 0.5Mpa. At the same time, another experiment also being run under high
pressure but at different temperature. Temperature also has impact in this case.
From one of the figure published, the rate of gas formation is very low at the operating
pressure of 0.5MPa and temperature at 1046K. While for another figure published, with
the operating pressure of 0.5MPa and temperature of 1114K, the product yield reaches a
peak within less than 500 seconds. This is a great figure to prove that hydrogen
production is applicable in high pressure system. However, when compare the above
mentioned figure to the third figure in the paper, which operates at 0.2MPa and 1123K,
we found that the hydrogen also yield although the peak but it is not as sharp as the one

9
in the second figure. However, the amount is about the same. With these, it is concluded
by them that high pressure gasification system does not have significant effects on the
hydrogen yield. This statement is then supported by another literature by Mahishi et al.
[13].
2.4 Pressurized gasification
Wang et al., mentioned pressurized gasification system with hot gas cleaning is an
advance concept, which can provide higher efficiency and have less serious tar issues
[5]. However, according to an online paper (no author name mentioned), at gasification
conditions 825ºC and 2 MPa, tars, chars, and volatile alkalis are generated [6]. The
reason might due to probably due to the low temperature for tar formation. Usually a
gasification unit will work at high temperature. For simulation purposes, tar issues will
not be considered.
Fermoso et al. reported that an increase in pressure was observed to produce a slight
increase in Methane and Carbon Dioxide to the detriment of Hydrogen and Carbon
Monoxide, as the increase in pressure shifts the equilibrium to the side with the fewer
moles of gas (equations below). The same tendencies were observed when the
equilibrium gas composition was calculated by varying the total pressure [12].
Steam Reforming: CH4 + H2O→CO + 3H2,
Dry Reforming: CH4 + CO2→2CO + 2H2
With this, we can come to a small conclusion that, high pressure really can cause
decrease in Hydrogen yield but prove needs to be done in order to have the appropriate
explanation. As form one of the figure in their paper, we can analyze that Hydrogen
yield decreased while Carbon Monoxide and Methane increases. However, in our
project, this phenomenon might help us when it comes to methane reforming in the later
part of the reactions as we can break up the CH4 bone and get more Hydrogen from
there.
Fiaschi et al. however mentioned that, bed temperature increases with pressure causing
Boudard reaction shift to the left and leads to overall reduction in gasification process.
Char conversion ratio versus pressure shows an optimized value of 5bar. (Maximum
Carbon Monoxide and Hydrogen and minimum Carbon Dioxide & Methane observed)
10
From this, it can be noticed that the temperature they used are too high. So this might
cause their operating parameters different from us. With that, 5bars is just a reference as
our operating temperature is different.
Mahishi et al.’s experiment has proven that effects of pressure will reduce the rate of
Hydrogen production. As pressure increases, the equilibrium Hydrogen and Carbon
Monoxide yields reduce. Simulation has been carried out to prove the statement and it
was found that if the reaction were to be under pressure, the change in Hydrogen yield
is negligible even for pressure at 0.1atm [13]. From this statement and table above, they
have proven that Hydrogen is not increasing with pressure but decreasing.
2.5 Economics
According to this article by a group of technical specialist from California (name not
mentioned), Indirect heating plus pressurized operation, results in smaller gas volumes
and much smaller equipment. Even though this results in higher unit costs of high-
pressure vessels and piping, but the overall effect is lower total equipment costs [7].
This could not be concluded yet as their product might be different from ours as we
need only Hydrogen and they probably need methane or other product which is higher
in price to cover back their losses in capital cost for pressurized system. However, this
could be used as a guideline for this project.
Maniatis et al.’s article also commented on economics part regarding biomass
gasification. Gasification technologies have recently been successfully demonstrated at
large scale and several demonstration projects are under implementation, they are still
relatively expensive in comparison to fossil based energy and, therefore, new entrants
may have to face economic and other non-technical barriers when trying to penetrate the
energy markets [9].
Lau et al. in their article mentioned that a pressurized plant with all the equipment being
pressurized, high equipment wear and higher power consumption need to be considered.
Cost of purchasing or maintenance can be quite high when times come [14]. This has to
add into consideration of this project when comes to economics evaluation.

11
Besides all the above, Maniatis et al. also commented about pressurized fluidized bed
system in this paper mentioned above. According to the paper, pressurized fluidized bed
systems are considered of medium market attractiveness due to the more complex
operation of the installation and to the additional costs related to the construction of all
pressurized vessels. Pressurized systems have been proposed mainly by CARBONA
and FOSTER WHEELER with the successful application of SYDKRAFT’s Värnamo
IGCC (Sweden) [9]. In my personal opinion, product selling can conclude a plant’s
profit and its rate of return for the investment on the capital cost of the plant. If our
product, Hydrogen is not selling high, we might end up losses in term of money or on
the other hand if our product, hydrogen is selling well, it will be the best gasification
unit on earth.
All and all, it depends on what we sell as our product in order to cover the capital cost
and operating cost of this biomass gasification plant. We could draw a small conclusion
that, the operating cost must be considered importantly as it might cause the project to
lose money or from another aspect gaining profit as we supply to a plant which causes
the plant cut cost in purchasing Hydrogen as their feedstock.
2.6 Research by other author
As addition to the above information, Hanaoka et al. conducted a gasification
experiment at high pressure using woody biomass and steam together, incorporated with
the carbon dioxide removal unit. They reported that at pressure of 0.6-0.7MPa,
hydrogen yield increases with temperature. The highest hydrogen yield is predicted at
0.6MPa. Hanaoka et al. is a good reference for this project as it provides us a platform
to develop and compare the simulated empty fruit bunch simulation result [23].
In addition, Florin et al. [22] investigated on a system of gasification combined with
carbon dioxide removal. Based on their results, they reported that hydrogen yield is
increasing with temperature. Hydrogen yield also poses the same trend of increment
corresponding to the steam-to-biomass ratio. Meanwhile, overall hydrogen production is
observed to increase with its pressure.

12
Since the hydrogen production from biomass via pressurized gasification that is
coupled with carbon dioxide adsorption has not been widely investigated and there are
limited models to represent the case, this paper hence focus to develop such system and
predict its performance via a simulation approach. In this work, a simulation model is
developed in PETRONAS iCON process simulator and is used to investigate the
technical feasibility of the biomass pressurized gasification system based on the effect
of parameters such as pressure, temperature and steam-to-biomass ratio on the hydrogen
yield.

13
CHAPTER 3
METHODOLOGY
3.1 RESEARCH AND ANALYSIS TECHNIQUE
Research technique in this Final Year Project 1 will mainly based on journals,
conference, paper, reports and reliable source on the internet or e-book at the same time
communicate with the project team for the previous research done.
3.2 FLOWCHART
This project first focused on understanding of the topic and the relevancy to the current
biomass technology - gasification. This include reviewing previous material which
inclusive of journals, previous reports, conference papers and articles on gasification of
biomass and types of gasification that has been developed and used in the current time
and date and those has yet been developed.
After the literature review and understanding of the whole concept of the project, it is
then moved on to evaluation and detailed analysis on other people’s work and
achievements while identify the temperature and pressure. The project is then being
continued by including modifications and developing a process flow sheet which
focused on integrated pressurized catalytic fluidized gasification reactor. There are three
cases of which is to be investigated. Firstly, biomass is referred to carbon only but at
both high pressure and atmospheric pressure. After that, kinetic of EFB was being
identified and incurred into the atmospheric system. With that, preliminary block
diagram was developed and process simulation was used to identify the flow and
operating conditions of the gasification.
After the simulation has been completed, this project runs through a system
performance analysis to enhance the system’s parameter to identify whether there is
some improvement or betterment to be done.

14
Lastly, the project will go through an economic evaluation to identify the feasibility of
the project to be applied in the real industrial world. Please refer to figure 1 for better
understanding of the simplified process flow.
Figure 1: Flowchart on process of project
Evaluation and Identification of T, P
Synthesis and Development of Process flow
Start
Gasification Literature Review Types of Biomass and Gasification Process
Review
System Performance Analysis
& Profile Comparison
End
Preliminary Block Diagram Process Simulation Software
Economic Evaluation
Validation with
previous work
Deviation <
Tolerance
YES
NO
Biomass = C
P = 1 atm
Biomass = C
High pressure
system
Biomass = CHO
P = 1 atm

15
3.3 TOOLS / SOFTWARE REQUIRED
a. ICON Simulation Software
b. ASPEN Simulation Software
As this project mainly relates about modeling, both ICON and ASPEN Simulation
Software can be used to compare the accuracy and the adaptability of this modeling
results. Comparison may assist in the project modeling accuracy.

16
3.4 GANTT CHART
Semester Semester 1 Break Semester 2
Period 1/4 2/4 3/4 4/4
1/4 2/4 3/4 4/4
To Investigate feasible routes to produce Hydrogen
from Empty Fruit Bunch
Synthesis and develop the feasible route and
operating conditions via process simulation software
Develop flowsheet and restructure to the integrated
pressurized catalytic gasification unit using Aspen
and Icon
To identify optimum operating conditions
To perform economic analysis
Figure 2: Gantt Chart representation on progress of project and task accomplishment and deadlines.
17
CHAPTER 4
RESULTS AND DISCUSSION
4.1 CASE 1: Biomass was represented by C at high pressure gasification.
In result and discussion, this chapter will mainly discuss about the findings at Chapter 2,
literature review and the results of simulation. In this section until the time being, all
simulation results are based on an assumption of EFB is represented by Carbon only.
As from the literature review, most of the research team start the flowsheeting work by
dividing the plant into three section namely feedstock processing, gasifier or
gasification reactor, and last part is purification before Hydrogen is being produced. In
order to start the simulation, reactions must be known and finalized before proceed to
kinetic researched.
4.1.1 Reactions in Integrated gasification unit
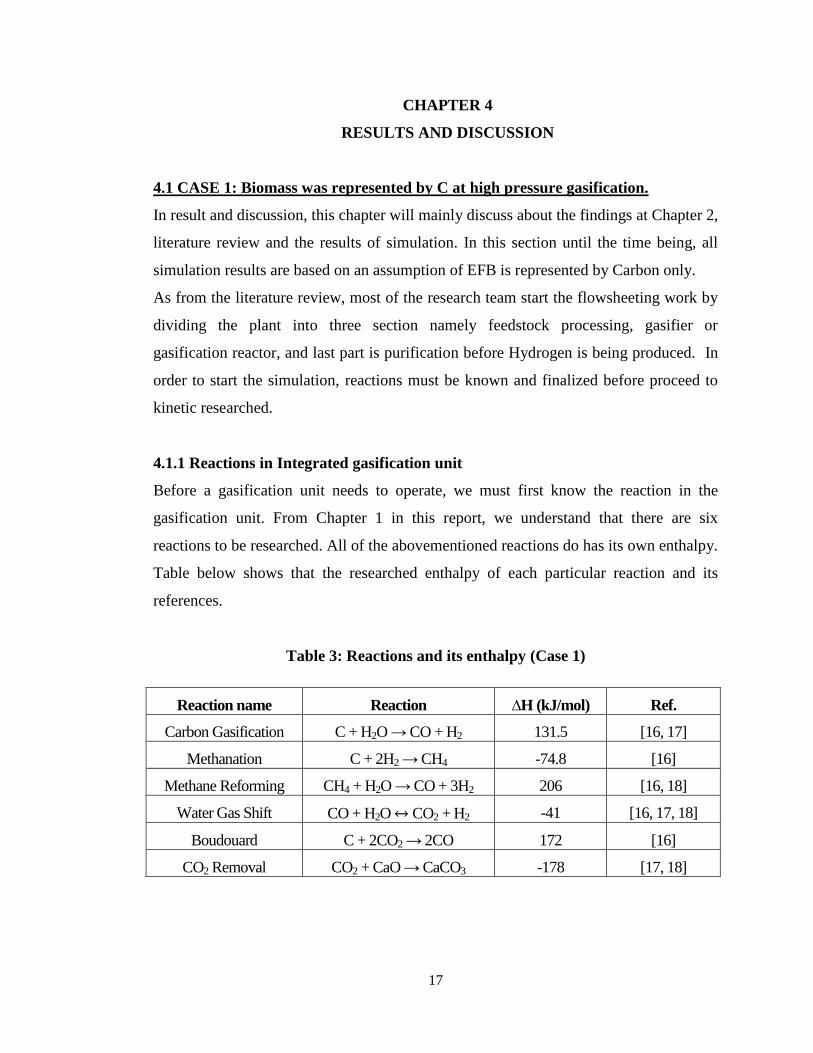
Before a gasification unit needs to operate, we must first know the reaction in the
gasification unit. From Chapter 1 in this report, we understand that there are six
reactions to be researched. All of the abovementioned reactions do has its own enthalpy.
Table below shows that the researched enthalpy of each particular reaction and its
references.
Table 3: Reactions and its enthalpy (Case 1)
Reaction name Reaction ∆H (kJ/mol) Ref.
Carbon Gasification C + H2O → CO + H2 131.5 [16, 17]
Methanation C + 2H2 → CH4 -74.8 [16]
Methane Reforming CH4 + H2O → CO + 3H2 206 [16, 18]
Water Gas Shift CO + H2O ↔ CO2 + H2 -41 [16, 17, 18]
Boudouard C + 2CO2 → 2CO 172 [16]
CO2 Removal CO2 + CaO → CaCO3 -178 [17, 18]
18
4.1.2 Kinetic Research
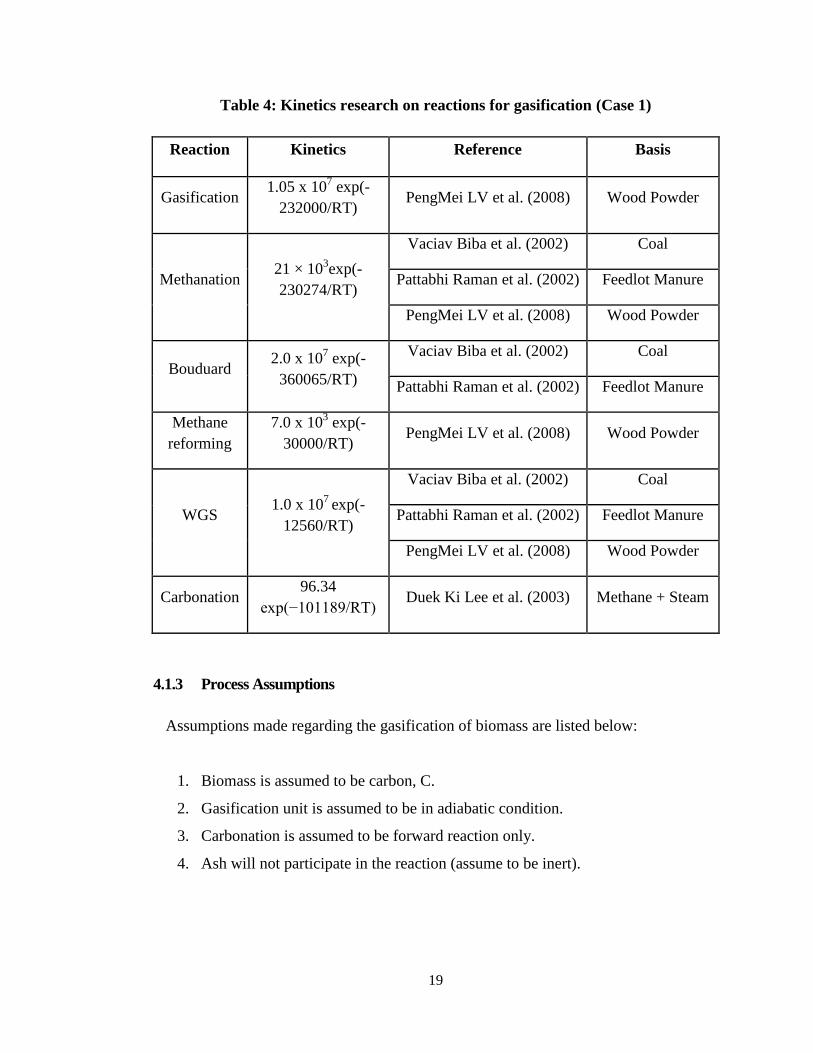
After knowing the reactions, the project now focused on the research on kinetics. Table
below shows the kinetic applied in the simulation software to identify the results of
pressurized gasification of biomass.
For gasification of biomass, kinetics was adapted from Lv et al. [21]. Reason to adapt
the kinetics from there is because Lv et al. has the same kinetics of methanation with
Biba et al. which their reported operating pressure is set to 2.648Mpa [19]. Since Biba
et al. reported high pressure kinetics, Lv et al. is assumed to report in high pressure too.
Raman et al. is also having the same kinetics as Biba et al. but no pressure parameters
were being mentioned in Raman text [20].
Methanation reaction, Biba et al, Raman et al. and Lv et al. has the same value [19, 20,
21]. However, as mentioned above, only Biba et al. has the pressure parameter of
2.648Mpa. Other author did not mention about pressure parameters. With this, the
kinetics has been adapted for this investigation.
Next, bouduard reaction’s kinetic was also adapted from Biba et al with the reaction
pressure of 2.648Mpa and the kinetics is the same as the one published by Raman et al
[19, 20].
Lv et al. with no pressure parameter specify, has the same kinetics value for
methanation as well as water gas shift reaction which published by Biba et al. and
Raman et al. [19, 20, 21]. With that, methane reforming’s kinetic is adopted from Lv et
al. since Biba et al. and Raman et al. did not mention about kinetic value for methane
reforming.
While for water gas shift reaction, Lv et al., Biba et al. and Raman et al. has the same
kinetic value. This kinetic is considered as the kinetic of reaction for high pressure
system in this case as Biba et al. mentioned about 2.648Mpa for their modeling [19, 20,
21].
Carbonation kinetic was adapted from Lee et al. which the operating pressure reported
are 3, 7, and 15 bar.
19
Table 4: Kinetics research on reactions for gasification (Case 1)
Reaction Kinetics Reference Basis
Gasification 1.05 x 10
7 exp(-
232000/RT) PengMei LV et al. (2008) Wood Powder
Methanation 21 × 10
3exp(-
230274/RT)
Vaciav Biba et al. (2002) Coal
Pattabhi Raman et al. (2002) Feedlot Manure
PengMei LV et al. (2008) Wood Powder
Bouduard 2.0 x 10
7 exp(-
360065/RT)
Vaciav Biba et al. (2002) Coal
Pattabhi Raman et al. (2002) Feedlot Manure
Methane
reforming
7.0 x 10³ exp(-
30000/RT) PengMei LV et al. (2008) Wood Powder
WGS 1.0 x 10
7 exp(-
12560/RT)
Vaciav Biba et al. (2002) Coal
Pattabhi Raman et al. (2002) Feedlot Manure
PengMei LV et al. (2008) Wood Powder
Carbonation 96.34
exp(−101189/RT) Duek Ki Lee et al. (2003) Methane + Steam
4.1.3 Process Assumptions
Assumptions made regarding the gasification of biomass are listed below:
1. Biomass is assumed to be carbon, C.
2. Gasification unit is assumed to be in adiabatic condition.
3. Carbonation is assumed to be forward reaction only.
4. Ash will not participate in the reaction (assume to be inert).

20
4.1.4 Process flow explaination
Firstly, feed is being treated and pelletized before it is being fed into the gasification unit. The
whole process of gasification is assumed to be happened in the gasification unit that coupled
with the Carbon Dioxide Removal unit. Reaction happens in the gasification include Carbon
Gasification, Methanation, Methane Reforming, Water Gas Shift, and Bouduard. Carbon
Dioxide Removal was then coupled outside of the gasification unit. However, in this paper,
both of the unit is assumed to be combined in order to simulate for the result. After the Carbon
Dioxide Removal, the product gas is then being fed into the Pressure Swing Adsorption (PSA)
unit to eliminate the remaining gas. Figure below shows the iCON simulation software layout
of the gasification process coupled with carbon dioxide removal unit while another figure
shows the table representation from one of the iCON analysis.
4.1.5 Effects of Steam to Biomass ratio
From the simulation, steam to biomass ratio effects towards hydrogen yield was being
investigated. Figure below shows the mass percent of product gas versus steam to
biomass ratio. From the result, hydrogen product from the end of the production line is
decreasing with increase steam to biomass ratio. According to Florin et al., steam to
biomass will increase hydrogen yield [22]. The reason being is because carbon or
biomass in this case has fully reacted in the earlier part of gasification reaction and
methanation. Since steam is water at high temperature, the more water being feed into
the system, the less concentrated hydrogen is as at the temperature and pressure,
provided gasification reactions do not react further as water has been fed in with enough
quantity at first to have the reaction of carbon to complete. With this, increasing steam
to biomass ratio is concluded to increase the hydrogen yield provided enough carbon
remains in the gasification. Here, we define hydrogen yield as amount of hydrogen
produced over amount of biomass fed (in kgs). With the same analysis, hydrogen yield
increases with increasing steam to biomass ratio. Figure 5 shows the graph of hydrogen
yield over steam to biomass ratio. According to Florin et al. and Mahishi et al., both
agree with increase hydrogen yield with increasing steam to biomass ratio. Reason
being the increment is because of the forward reaction of water gas shift reaction.

21
Fig
ure
3:
iCO
N s
imu
lati
on
soft
ware
in
terfa
ce
Fig
ure
4:
Tab
le a
dap
tati
on
fro
m i
CO
N s
imu
lati
on
soft
ware

22
As more water is being fed into the reaction and the carbon or biomass has finish reacted,
increasing amount of water will cause a forward reaction to the water gas shift reaction too.
With this, an increasing amount of hydrogen is noticed.
Figure 5: Effects of mol percent on steam to biomass ratio (Case 1)
Figure 6: Effects of hydrogen yield on steam to biomass ratio (Case 1)
0.00%
10.00%
20.00%
30.00%
40.00%
50.00%
60.00%
70.00%
80.00%
2 2.1 2.2 2.3 2.4 2.5 2.6 2.7 2.8 2.9 3
Mo
l %
Steam to Biomass ratio
HYDROGEN CARBON MONOXIDECARBON DIOXIDE METHANE
0
50
100
150
200
250
300
350
2 2.1 2.2 2.3 2.4 2.5 2.6 2.7 2.8 2.9 3
Hyd
rogen
Yie
ld (
g H
2/k
g E
FB
)
Steam to Biomass Ratio

23
4.1.6 Effects of Pressure
In order to simulate the effects of pressure, steam to biomass ratio and temperature is fixed.
After simulate, hydrogen percentage were found to be in the increasing trend with pressure.
This was also reported in the paper by Florin et al. Reason for the increment is because of the
integrated system where all the reactions were combined and assist by the carbon dioxide
removal unit. Carbon dioxide that produced in the reactions will cause dilution on the hydrogen
component in the product gas. After removing carbon dioxide, hydrogen composition increases
in the product gas. This can conclude that, the mixture of reactions mentioned in Table I can
really increase the hydrogen yield. Figure below shows hydrogen increases with pressure while
carbon monoxide decreases and the result shows none of the carbon dioxide. Second figure
below shows hydrogen yield increase with pressure. This increase is only noted at 1 percent. In
other hand, the increment of hydrogen production over a fixed amount of biomass is said to be
negligible. This is also reported by Mahishi et al.
Figure 7: Effects of mol percent on pressure (Case 1)
0.00%
10.00%
20.00%
30.00%
40.00%
50.00%
60.00%
70.00%
80.00%
90.00%
100.00%
600 800 1000 1200 1400 1600 1800
Mol
%
Pressure (kPa)
HYDROGEN CARBON MONOXIDE
CARBON DIOXIDE METHANE

24
Figure 8: Effects of hydrogen yield on pressure (Case 1)
4.1.7 Effects of Temperature
In term of temperature, for high pressure gasification system, Hydrogen product
increases with increasing temperature. This was supported by the paper published by
Hanaoka et al. in the year 2005[23]. It was then mentioned too in another paper by
Fermoso et al. about the statement of hydrogen product increase with temperature [12].
Figure 9: Effects of mol percent on temperature (Case 1)
174
176
178
180
182
184
186
188
190
192
600 800 1000 1200 1400 1600 1800 2000
Hyd
rogen
yie
ld (
%)
Pressure (kPa)
0.00%
10.00%
20.00%
30.00%
40.00%
50.00%
60.00%
70.00%
80.00%
90.00%
1200 1250 1300 1350 1400 1450 1500 1550 1600
Mo
l %
Temperature (ºC)
HYDROGEN CARBON MONOXIDE
CARBON DIOXIDE METHANE

25
Figure 10: Effects of hydrogen yield on temperature (Case 1)
Reason for increasing hydrogen product when increasing temperature is because when
temperature increases, carbon tends to react with carbon dioxide more and produces
more carbon monoxide. With this, carbon monoxide then can react with more water
(steam) to produce more hydrogen. Since all of this happens in a gasification unit, this
reaction is repeated and more hydrogen product is produced. The production of methane
is constant with increasing temperature which is also mentioned by Fermoso et al [12].
Another figure below illustrate the effects of mass percent of hydrogen and other
components on temperature while figure below shows the effects of hydrogen yield on
temperature.
4.2 CASE 2: Biomass was represented by C at atmospheric pressure gasification.
In result and discussion of case 2, it will mainly discuss about the findings from the
simulation. In this section until the time being, all simulation results are based on an
assumption of EFB is represented by Carbon only and the whole system is to be in
atmospheric pressure.
As from chapter 2 not much literature review has been done for this part due to time
constraint as this task is a side task (beside the main task – high pressure gasification).
However, most of the research team too starts with the flowsheeting work by dividing
the plant into three sections namely feedstock processing, gasifier or gasification
reactor, and last part is purification before Hydrogen is being produced. In order to start
176
178
180
182
184
186
188
190
192
194
1200 1250 1300 1350 1400 1450 1500 1550 1600Hy
dro
gen
Yie
ld (
g H
2/
kg
EF
B)
Temperature (°C)

26
the simulation, reactions must be known and finalized before proceed to kinetic
researched.
4.2.1 Reactions in Integrated gasification unit
Before the gasification unit needs to be operated, we must first know the reaction in the
gasification unit. From Chapter 1 in this report, we understand that there are six
reactions to be researched. The abovementioned reactions do has its own enthalpy.
Table below shows that the researched enthalpy of each particular reaction and its
references.
Table 5: Reactions and its enthalpy (Case 2)
Reaction name Reaction ∆H (kJ/mol)
Carbon Gasification C + H2O → CO + H2 118.9
Methanation C + 2H2 → CH4 -74.8
Methane Reforming CH4 + H2O → CO + 3H2 222.35
Water Gas Shift CO + H2O ↔ CO2 + H2 -42
Boudouard C + 2CO2 → 2CO 172
CO2 Removal CO2 + CaO → CaCO3 -170.5
4.2.2 Kinetic Research
As from research, it is found that the kinetics were totally different from the kinetics of
high pressure system. Gasification was adapted from Corella J et al. [26] and Gonzalez
et al. [27] Both of them have the same agreed kinetics for the system. Next,
methanation, we have Choi Y. C et al. [28] and Govin R. et al. [29] agreed with the
same kinetics. From this case, we can surely adapt the kinetic as they were being agreed
upon. While for Bouduard reaction, we have two different author (Choi Y. C et al. [28]
and Brown B.W. et al. [30]) agreed at the same kinetic too while they were using
different kind of feedstock for their process. Methane reforming is another reaction
which agreed by four authors namely, Corella J. et al., [26] Therien N. et al., [31] Liu

27
H. et al., [32] and Fletcher D. F. et al. [33] while Corella J. er al., [26] Gonzalez et al.,
[27] Xu J. et al., [34] and Simell P. A. et al. [35] agreed with the same kinetic for the
water gas shift reaction. For carbonation, we have Irfan A. et al. [36] with the feedstock
of pure carbon dioxide and Milne B. W. et al.[37] with the feed stock of biomass to
agree together on the same kinetic as of tabled below.
Table 6: Kinetics research on reactions for gasification (Case 2).
Reaction Kinetics Reference Basis
Gasification 2.0 x 10
5 exp(-
600/T) [26] , [27] Biomass
Methanation 0.12 × 10
3exp(-
1792/T) [28] , [29] Coal
Bouduard 4.4 x 10
3 exp(-1.62
x103/T)
[28] Coal
[30] Biomass
Methane
reforming
3.1005 exp(-
1500/T) [26] , [31] , [32] , [33] Biomass
WGS 1.0 x 10
6 exp(-
6370/T) [26] , [27] , [34] , [35] Biomass
Carbonation 10.2 x10
6
exp(−44.5/T)
[36] Pure CO2
[37] Biomass
4.2.3 Process Assumptions
Assumptions made regarding the gasification of biomass are listed below:
1. Biomass is assumed to be carbon, C.
2. Gasification unit is assumed to be in adiabatic condition.
3. Carbonation is assumed to be forward reaction only.
4. Ash will not participate in the reaction (assume to be inert).
28
4.2.4 Process Description
All process descriptions are as of above in section 4.1.4. Please refer above for accuracy of
each analysis performed. However, in this case, we will mainly focus on atmospheric pressure
and assuming Empty Fruit Bunch as Carbon only.
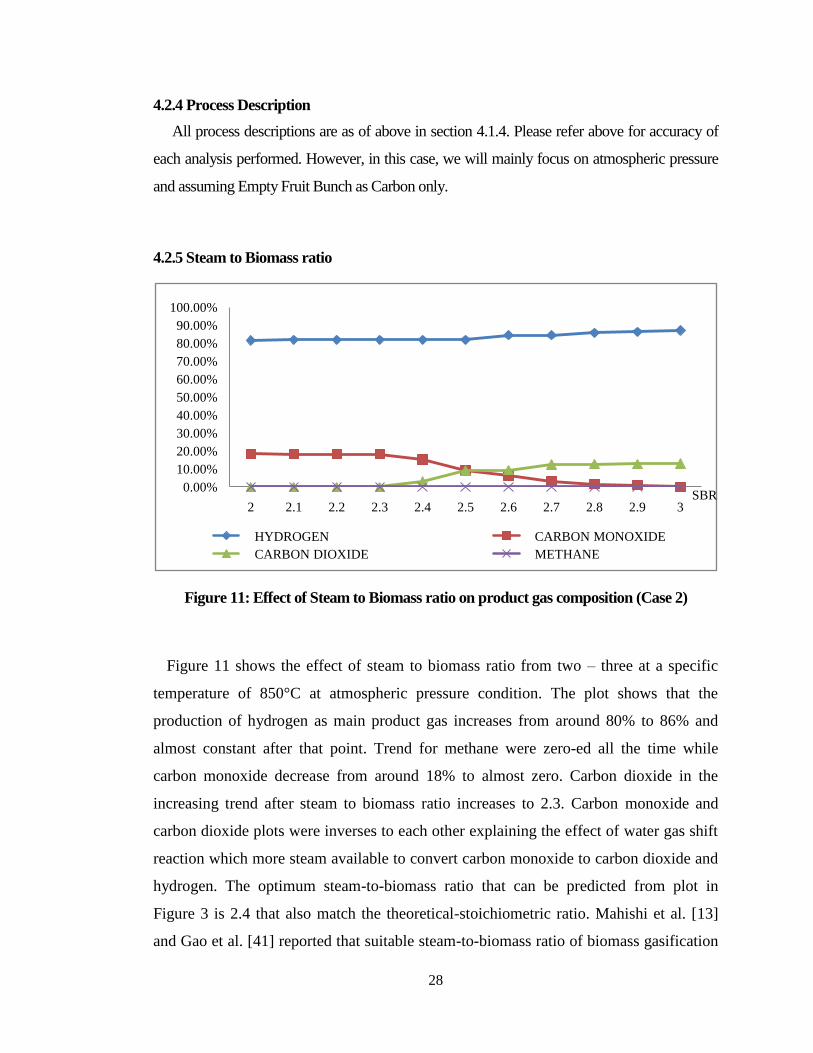
4.2.5 Steam to Biomass ratio
Figure 11: Effect of Steam to Biomass ratio on product gas composition (Case 2)
Figure 11 shows the effect of steam to biomass ratio from two – three at a specific
temperature of 850°C at atmospheric pressure condition. The plot shows that the
production of hydrogen as main product gas increases from around 80% to 86% and
almost constant after that point. Trend for methane were zero-ed all the time while
carbon monoxide decrease from around 18% to almost zero. Carbon dioxide in the
increasing trend after steam to biomass ratio increases to 2.3. Carbon monoxide and
carbon dioxide plots were inverses to each other explaining the effect of water gas shift
reaction which more steam available to convert carbon monoxide to carbon dioxide and
hydrogen. The optimum steam-to-biomass ratio that can be predicted from plot in
Figure 3 is 2.4 that also match the theoretical-stoichiometric ratio. Mahishi et al. [13]
and Gao et al. [41] reported that suitable steam-to-biomass ratio of biomass gasification
0.00%
10.00%
20.00%
30.00%
40.00%
50.00%
60.00%
70.00%
80.00%
90.00%
100.00%
2 2.1 2.2 2.3 2.4 2.5 2.6 2.7 2.8 2.9 3
HYDROGEN CARBON MONOXIDE
CARBON DIOXIDE METHANE
SBR

29
is 3 and 2.05 respectively, which close to the finding of this study i.e. 2.4.
4.2.6 Pressure
Figure 12: Effect of pressure on product gas composition (Case 2)
As from the graph, we can see that hydrogen is around the range of 80% while methane is
around 0% to 10%. When pressure increases, hydrogen production will decrease. The finding
only reaches a pressure of 100°C only as the simulation went un-converged after that. The main
reason might be due to the kinetics which is not suitable to be applied in a high pressure
situation of more than 1MPa.
4.2.7 Temperature
Figure 13: Effect of temperature on product gas composition (Case 2)
0.00%
20.00%
40.00%
60.00%
80.00%
100.00%
120.00%
600 800 1000
HYDROGEN CARBON MONOXIDECARBON DIOXIDE METHANE
Pressure
(kPa)
0.00%
10.00%
20.00%
30.00%
40.00%
50.00%
60.00%
70.00%
80.00%
850 900 950 1000 1050 1100
HYDROGEN CARBON MONOXIDE
CARBON DIOXIDE METHANE
T
(°C)
30
From the above figure, we can see that the effect of temperature ranging from 850°C
to 1100°C on the product gas composition at a specific condition of steam-to-biomass
ratio of 2.4 and pressure at 1 atmospheric. The plot shows production of hydrogen is
almost constant throughout the temperature range studied. However production of other
product gas like carbon dioxide shows increases trend, but carbon monoxide production
decreases over an increased temperature.
Although there is not much difference on overall trends of the plot, consistent amount
of gases is observed at 850oC and onwards. This is due to the amount of carbon
monoxide and carbon dioxide is almost stable, hence the improvement can be done at
this point via manipulating other effects such as to increase steam-to-biomass ratio to
convert more carbon monoxide to carbon dioxide and hydrogen, and also to increase
adsorbent-to-biomass ratio to capture more carbon dioxide to drive the overall reaction
scheme to produce more hydrogen. Mahishi et al. [10] also reported that the optimum
operating temperature of his system is at 1030 K which is equal to 857oC.
4.3 CASE 3: Biomass was represented by C3.4H4.1O3.3 at atmospheric pressure
gasification.
In result and discussion of case 3, it will mainly discuss about the findings from the
simulation. In this section until the time being, all simulation results are based on an
assumption of EFB is represented by C3.4H4.1O3.3 only and the whole system is to be in
atmospheric pressure.
As from chapter 2 not much literature review has been done for this part due to time
constraint as this task is a side task (beside the main task – high pressure gasification).
However, most of the research team too starts with the flowsheeting work by dividing
the plant into three sections namely feedstock processing, gasifier or gasification
reactor, and last part is purification before Hydrogen is being produced. In order to start
the simulation, reactions must be known and finalized before proceed to kinetic
researched.

31
4.3.1 Reactions in Integrated gasification unit
Before the gasification unit needs to be operated, we must first know the reaction in the
gasification unit. From Chapter 1 in this report, we understand that there are six
reactions to be researched. As from the table below, the entire reaction scheme has been
changed due to the balance equation when C3.4H4.1O3.3 is being applied into the
equation.
Table 7: Reactions and its enthalpy (Case 3)
Reaction name Reaction
Carbon Gasification C3.4H4.1O3.3 + 0.1H2O → 3.4CO + 2.15H2
Methanation C3.4H4.1O3.3 + 8.05H2 → 3.4CH4 + 3.3H2O
Methane Reforming CH4 + H2O → CO + 3H2
Water Gas Shift CO + H2O ↔ CO2 + H2
Boudouard C3.4H4.1O3.3 + CO2 → 4.4CO + 0.9H2O + 1.15H2
CO2 Removal CO2 + CaO → CaCO3
4.3.2 Kinetic Research
As shown in table 8, we see that the kinetics of Empty Fruit Bunch for atmospheric
pressure has finally been found. For gasification, the kinetic were support by Corella J
et al. [26], Gonzalez et al. [27], and C. Fushimi et al. [38]. Next, methanation and
bouduard kinetics were found the kinetic in a paper by Marcio L. de Souza-Santos [39]
and we applied it into our system. As usual methane reforming were very widely being
researched. With this, we have four authors supporting a single kinetic which are
Corella J. et al. [26], Therien N. et al. [31], Liu H. et al. [32], and Fletcher D. F. et al.
[33] while Corella J. er al., [26] Gonzalez et al., [27] Xu J. et al., [34] and Simell P. A.
et al. [35] agreed with the same kinetic for the water gas shift reaction. Carbonation was
supported by Ping S. et al. [40].

32
Table 8: Kinetics research on reactions for gasification (Case 3)
Reaction Kinetics Reference
Gasification 2.0×10⁵ exp (-6000/T) [26] , [27] , [38]
Methanation 2.345×10⁻¹¹
exp (-13670/T) [39]
Bouduard 1.19x10⁻³
exp (-16840/T) [39]
Methane
reforming 3x10
5 exp (-15000/T) [26] , [31] , [32] , [33]
WGS 106
exp (-6370/T) [26] , [27] , [34] , [35]
Carbonation 1.67×10⁻³
exp (-29/T) [40]
4.3.3 Process Assumptions
Assumptions made regarding the gasification of biomass are listed below:
1. Biomass is Empty Fruit Bunch, C3.4H4.1O3.3.
2. Gasification unit is assumed to be in adiabatic condition.
3. Carbonation is assumed to be forward reaction only.
4. Ash will not participate in the reaction (assume to be inert).
4.3.4 Process Description
All process descriptions are as of above in section 4.1.4. Please refer above for accuracy
of each analysis performed. However, in this case, we will mainly focus on atmospheric
pressure and assuming Empty Fruit Bunch as C3.4H4.1O3.3 only.

33
4.3.5 Steam to Biomass ratio
Figure 14: Effect of Steam to Biomass ratio on product gas composition (case 3)
From the above figure, we can see that the effect of steam to biomass ranging from 2
to 3 on the product gas composition at a specific condition of temperature of 850°C and
pressure at 1 atmospheric. The plot shows production of hydrogen is almost constant
throughout the temperature range studied. However, hydrogen gas was reported to be a
little increase after ratio reaches 2.7. On the other hand production of other product gas
like carbon dioxide, carbon monoxide, and methane were constant throughout the range
of investigation.
Although there is not much difference on overall trends of the plot, consistent amount
of gases is observed towards the trend. This is due to the kinetic used in the system
poses slow reaction except for gasification and water gas shift reactions. Hence there
are improvements to be done at this point via manipulating other effects such as to
increase temperature to convert more other components into hydrogen.
0.00%
10.00%
20.00%
30.00%
40.00%
50.00%
60.00%
70.00%
2 2.1 2.2 2.3 2.4 2.5 2.6 2.7 2.8 2.9 3
HYDROGEN CARBON MONOXIDE
CARBON DIOXIDE METHANE
SBR

34
4.3.6 Pressure
Figure 15: Effect of pressure on product gas composition (Case 3)
From the above figure, we can see that the effect of pressure ranging from 600kPa to
2000kPa on the product gas composition at a specific condition of steam-to-biomass
ratio of 2.0 and temperature at 850°C. The plot shows production of hydrogen is almost
constant throughout the pressure range studied with a little fluctuation due to the
sensitivity of reactions. However production of other product gas like methane and
carbon monoxide production was constant zero with increased pressure. Carbon dioxide
production maintains fluctuating with the fluctuation of hydrogen production.
Although there is not much difference on overall trends of the plot, consistent amount
of gases is observed. This is due to the amount of carbon monoxide and methane is
almost stable, hence the improvement can be done at this point via manipulating other
effects such as to increase steam-to-biomass ratio to convert more hydrogen production,
and also to increase adsorbent-to-biomass ratio to capture more carbon dioxide to drive
the overall reaction scheme to produce more hydrogen.
0.00%
10.00%
20.00%
30.00%
40.00%
50.00%
60.00%
70.00%
600 800 1000 1200 1400 1600 1800 2000
HYDROGEN CARBON MONOXIDE
CARBON DIOXIDE METHANE
Pressure
(kPa)
35
4.3.7 Temperature
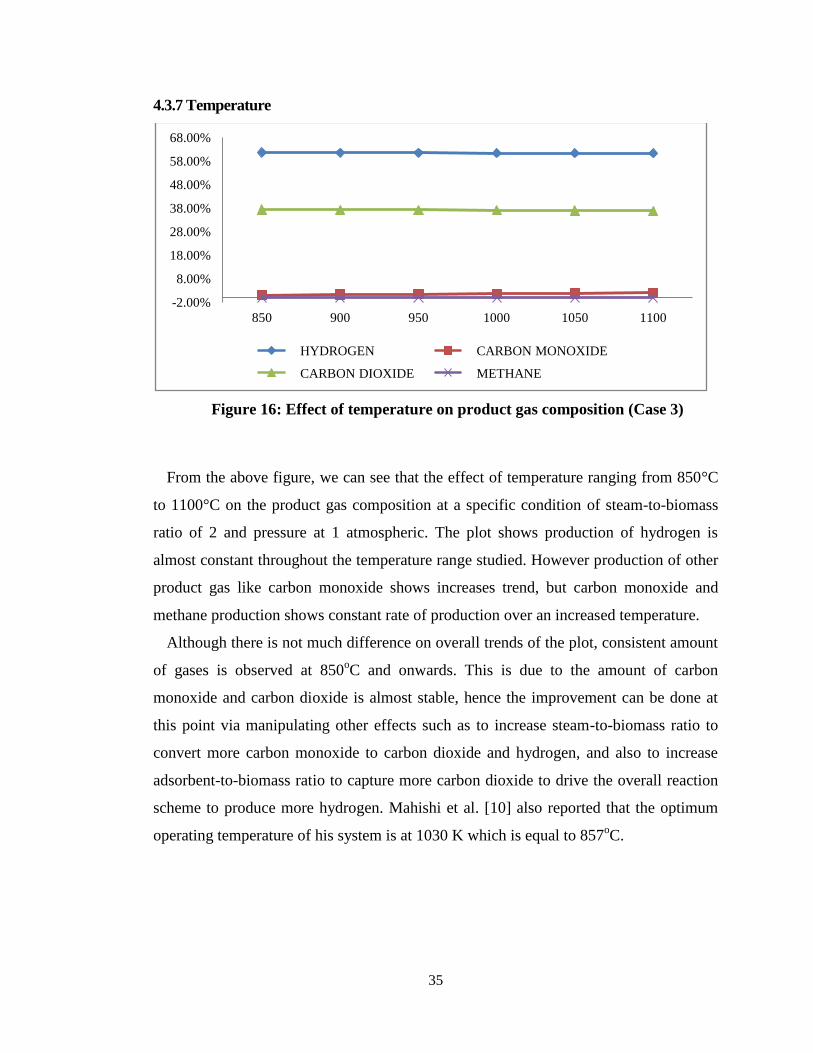
Figure 16: Effect of temperature on product gas composition (Case 3)
From the above figure, we can see that the effect of temperature ranging from 850°C
to 1100°C on the product gas composition at a specific condition of steam-to-biomass
ratio of 2 and pressure at 1 atmospheric. The plot shows production of hydrogen is
almost constant throughout the temperature range studied. However production of other
product gas like carbon monoxide shows increases trend, but carbon monoxide and
methane production shows constant rate of production over an increased temperature.
Although there is not much difference on overall trends of the plot, consistent amount
of gases is observed at 850oC and onwards. This is due to the amount of carbon
monoxide and carbon dioxide is almost stable, hence the improvement can be done at
this point via manipulating other effects such as to increase steam-to-biomass ratio to
convert more carbon monoxide to carbon dioxide and hydrogen, and also to increase
adsorbent-to-biomass ratio to capture more carbon dioxide to drive the overall reaction
scheme to produce more hydrogen. Mahishi et al. [10] also reported that the optimum
operating temperature of his system is at 1030 K which is equal to 857oC.
-2.00%
8.00%
18.00%
28.00%
38.00%
48.00%
58.00%
68.00%
850 900 950 1000 1050 1100
HYDROGEN CARBON MONOXIDE
CARBON DIOXIDE METHANE

36
CHAPTER 5
ECONOMIC EVALUATION
Economic of the high pressure gasification of Empty Fruit Bunch system was being
determined and evaluated according to the process flow sheet mentioned in the previous
chapter. However, in this stage, we will only analyze for economic potential level one.
Data gathered for price of all the raw material and production costs are as of below:
Table 9: Raw material cost
Material Price (USD / ton) Source
Steam 10.40 [25] & MOX (2009)
Empty Fruit Bunch 40.00 [24]
Calcium Oxide Catalyst 2400.00 [25]
Table 10: Product cost
Material Price (USD / ton) Source
Hydrogen 3300 Estimation
Assumptions to determine the economic potential level one of the high pressure
gasification system are as of below:
(a) All production rates are as of average or mid range according to the table above.
(b) Plant operate only 330days per year, 24hours per day.

37
CASE1: High pressure gasification with assumption biomass is carbon.
Operating conditions to calculate the economics feasibilities of high pressure
gasification of Empty Fruit Bunch into Hydrogen are as of below:
Table 11: Operating parameters used to calculate economic potential level one
(Case 1)
Parameters Variables Unit
Temperature 1400 Degree C
Pressure 600 kPa
Steam to Biomass ratio 2.45 -
From the above operating condition we find that the production and the reactants given
in table 16 below:
Table 12: Amount of reactants and products at the selected operating parameters
(Case 1)
Material Amount (kg/hr) Amount (ton/yr)
Steam 2.45 19.404
Empty Fruit Bunch 1 7.92
Calcium Oxide 0.01 0.0792
Hydrogen production 0.18 1.4256
In order to have the system economically viable, revenue of the system must be higher
than the cost. Main reason is to gain profit out of the process while second reason is to
recover back the capital cost that has been imposed into the manufacturing of
equipments and man power. However, since we are focusing on economic potential
level one only, we will only consider the cost of all inlet and outlet material.
Economic potential level one was being calculated as of below:
Economic Potential Level ONE = Revenue – Raw cost material

38
In order to have profit out of this process flow, we must obey to the inequalities as of
below:
Revenue – Cost ≥ 0 (Revenue – cost must not equals to zero or less than zero)
Revenue ≥ Cost (Revenue must more than cost)
[USD (Hydrogen)] - [USD (Steam + Calcium Oxide + EFB)] ≥ 0
[(1.4256 ton / yr x USD 3300 / ton)] – [(0.0792 ton / yr x USD 2400 / ton) + (7.92 ton /
yr x USD 40 / ton) + (19.404 ton / yr x USD 10.40 / ton)]
= USD 4704.48 / yr – (USD 190.08 / yr + USD 316.8 / yr + USD 201.8016 / yr)
= USD 3995.80 / yr (net profit)
Revenue is higher than Cost by USD 3995.80 per year.
With this amount of revenue per year, we will finally consider that, this process is
applicable to the real industrial. This profit would be multiply if the real case involved
high amount of feed and product.

39
CASE 2: Atmospheric pressure gasification with assumption biomass is carbon.
Operating conditions to calculate the economics feasibilities of high pressure
gasification of Empty Fruit Bunch into Hydrogen are as of below:
Table 13: Operating parameters used to calculate economic potential level one
(Case 2)
Parameters Variables Unit
Temperature 850 Degree C
Pressure 101.325 kPa
Steam to Biomass ratio 2.0 -
From the above operating condition we find that the production and the reactants given
in table 16 below:
Table 14: Amount of reactants and products at the selected operating parameters
(Case 2)
Material Amount (kg/hr) Amount (ton/yr)
Steam 0.24 1.9008
Empty Fruit Bunch 0.12 0.9504
Calcium Oxide 0.05 0.396
Hydrogen production 0.06 0.4752
In order to have the system economically viable, revenue of the system must be higher
than the cost. Main reason is to gain profit out of the process while second reason is to
recover back the capital cost that has been imposed into the manufacturing of
equipments and man power. However, since we are focusing on economic potential
level one only, we will only consider the cost of all inlet and outlet material.
Economic potential level one was being calculated as of below:
Economic Potential Level ONE = Revenue – Raw cost material

40
In order to have profit out of this process flow, we must obey to the inequalities as of
below:
Revenue – Cost ≥ 0 (Revenue – cost must not equals to zero or less than zero)
Revenue ≥ Cost (Revenue must more than cost)
[USD (Hydrogen)] - [USD (Steam + Calcium Oxide + EFB)] ≥ 0
[(0.4752 ton / yr x USD 3300 / ton)] – [(0.396 ton / yr x USD 2400 / ton) + (0.9504 ton
/ yr x USD 40 / ton) + (1.9008 ton / yr x USD 10.40 / ton)]
= USD 1568.16 / yr – (USD 950.40 / yr + USD 38.016 / yr + USD 19.7683 / yr)
= USD 559.98 / yr (net profit)
Revenue is higher than Cost by USD 559.98 per year.
With this amount of revenue per year, we will finally consider that, this process is
applicable to the real industrial. This profit would be multiply if the real case involved
high amount of feed and product.

41
CASE 3: Atmospheric pressure gasification with assumption biomass as C3.4H4.1O3.3.
Operating conditions to calculate the economics feasibilities of high pressure
gasification of Empty Fruit Bunch into Hydrogen are as of below:
Table 15: Operating parameters used to calculate economic potential level one
(Case 3)
Parameters Variables Unit
Temperature 850 Degree C
Pressure 101.325 kPa
Steam to Biomass ratio 2.0 -
From the above operating condition we find that the production and the reactants given
in table 16 below:
Table 16: Amount of reactants and products at the selected operating parameters
(Case 3)
Material Amount (kg/hr) Amount (ton/yr)
Steam 0.24 1.9008
Empty Fruit Bunch 0.12 0.9504
Calcium Oxide 0.01 0.0792
Hydrogen production 0.06 0.4752
In order to have the system economically viable, revenue of the system must be higher
than the cost. Main reason is to gain profit out of the process while second reason is to
recover back the capital cost that has been imposed into the manufacturing of
equipments and man power. However, since we are focusing on economic potential
level one only, we will only consider the cost of all inlet and outlet material.
Economic potential level one was being calculated as of below:
Economic potential level one = Revenue – Raw cost material

42
In order to have profit out of this process flow, we must obey to the inequalities as of
below:
Revenue – Cost ≥ 0 (Revenue – cost must not equals to zero or less than zero)
Revenue ≥ Cost (Revenue must more than cost)
[USD (Hydrogen)] - [USD (Steam + Calcium Oxide + EFB)] ≥ 0
[(0.4752 ton / yr x USD 3300 / ton)] – [(0.0792 ton / yr x USD 2400 / ton) + (0.9504 ton
/ yr x USD 40 / ton) + (1.9008 ton / yr x USD 10.40 / ton)]
= USD 1568.16 / yr – (USD 190.08 / yr + USD 38.016 / yr + USD 19.7683 / yr)
= USD 1320.30 / yr (net profit)
Revenue is higher than Cost by USD 1320.30 per year.
With this amount of revenue per year, we will finally consider that, this process is
applicable to the real industrial. This profit would be multiply if the real case involved
high amount of feed and product.

43
CHAPTER 6
CONCLUSION AND RECOMMENDATION
This project has completed its original set objective and target successfully which
feasible foute to produce Hydrogen from Empty Fruit Bunch at high pressure has been
investigated. Integrated gasification is the efficient gasification unit to improve the
productivity of hydrogen. Second objective has also been accomplished where feasible
route with operating conditions has been investigated. Besides that, Flowsheet has been
restructure and developed to suit the integrated version where pressurized catalytic
gasification unit in iCON. After that, identification of the optimum operating conditions
has been carried out and the result is, higher temperature, higher steam to biomass ratio
and higher pressure, all the system will increase hydrogen yield. Economics feasibility
has also been identified in term of economic potential level one only.
With this, further research and analysis has to be carried out in order to ensure the
researched statements are correct in the sense of application in Malaysia. Besides that,
the kinetic of catalyst are to be further studied as most of the researchers do not include
the studies on Empty Fruit Bunch and combination of catalytic and pressurized system.
This has the chance of excluding the high pressure system kinetics where empty fruit
bunch were employed instead of assuming empty fruit bunch as carbon at this moment.
Next, economic wise, one must investigate the cost of building the plant and the
payback period as building a high pressure plant might be costly. All and all, the
development of integrated pressurized catalytic fluidized gasification process is
hopefully to be greatly useful for the future economic and environment.
44
REFERENCES
[1] P. McKendry, Energy Production from biomass (Part 3): gasification technologies,
Review paper, Applied Environmental Research Centre Ltd, UK
[2] S. Babu, Biomass Gasification for Hydrogen Production – Process Description and
research Needs, Thermal Gasification of Biomass, IEA Bionergy Agreement, Gas
Technology Institute, Dublin, Ireland
[3] L. G. Sheng and T.W. Kwang, 1MWe Biomass Modular Power Plant, China
EnerSave Ltd, China, April 2004
[4] A. Hussain, F. N. Ani, A. N. Darus, H. Mokhtar, S. Azam, A. Mustafa,
Thermodynamical Behaviour of Empty Fruit Bunches and oil palm shell waste in a
Circulating Fluidized Bed Combustor (CFBC), Journal of Oil Palm Research Vol. 18
June 2006 page. 210 – 218.
[5] W. Wang, G. Olofsson, Reduction of Ammonia and Tar in Pressurized Biomass,
Lund University, Sweeden
[6] An overview of Biomass Gasification,
www.nrel.gov/biomass/pdfs/overview_biomass_gasification.pdf
[7] TSS Consultants, Gridley Ethanol Demonstration Project Utilizing Biomass
Gasification Technology: Pilot Plant Gasifier and Syngas Conversion Testing August
2002—June 2004, National Renewable Energy Laboratory, Gridley, California.
[8] S. P. Babu, OBSERVATIONS ON THE CURRENT STATUS OF BIOMASS
GASIFICATION, 17 March 2005.
[9] K. Maniatis, European Commission, Progress in Biomass Gasification: An
Overview, Belgium
[10] C. D. Blasi, KINETIC MODELING OF BIOMASS GASIFICATION AND
COMBUSTION

45
[11] K. Matsuoka, FACTORS AFFECTING STEAM GASIFICATION RATE OF LOW
RANK COAL CHAR IN A PRESSURIZED FLUIDIZED BED, 2009
[12] J. Fermoso, B. Arias, M.G. Plaza, C. Pevida, F. Rubiera, J.J. Pis, F. García-Peña, P.
Casero, High-pressure co-gasification of coal with Biomass and Petroleum Coke,
Belgium, 2009
[13] M. R. Mahishi, Goswami D. Y. “Thermodynamics optimization of biomass gasifier
for hydrogen production”, International Journal of Hydrogen Energy, Vol 32, p. 3831-
3840, 2007.
[14] F. S. Lau, Techno-Economic Analysis of Hydrogen Production by Gasification of
Biomass, Gas Technology Institute, 2002
[15] Yong., Potential of hydrogen from oil palm biomass as a source of renewable
energy worldwide, Energy Policy, 35, 2007
[16] L. Shen, Y. Gao, J. Xiao, Simulation of Hydrogen production from biomass
gasification in interconnected fluidized beds, Southeast University, Nanjing, China,
2007
[17] S. Lin, M. Harada, Y. Suzuki, H. Hatano, Hydrogen production from coal by
separating carbon dioxide during gasification, Onogawa, Tsukuba, Japan
[18] D. K. Lee, I. H. Baek, W. L. Yoon, Modeling and simulation for the methane
steam reforming enhanced by in situ CO2 removal utilizing the CaO carbonation for H2
production, Republic of Korea, 2003
[19] V. Biba, J. Macak, E. Klose and J. Malech, Mathematical Model for the
Gasification of Coal Under Pressure, Prague, Czechoslovakla, and Freiberg, 2002
[20] P. Raman, W. P. Walawender, L. T. Fan, and C. C. Chang, Mathematical Model
for the Fluid-Bed Gasification of Biomass Materials. Application to Feedlot Manure,
Department of Chemical Engineering, Kansas State University, Manhattan, Kansas.

46
[21] P. Lv, X. KONG, C. WU, Z. YUAN, L. MA, J. CHANG, Modeling and simulation
of biomass air-steam gasification in a fluidized bed, Guangzou Institure of Energy
Conversion, Guangdong, Guangzhou, China.
[22] N. H. Florin, A. T. Harris, Enhanced hydrogen production from biomass with in
situ carbon dioxide capture using calcium oxide sorbents, University of Sydney, NSW,
Australia, 2006
[23] T. Hanaoka, T. Yoshida, S. Fujimoto, K. Kamei, M. Harada, Y. Suzuki, H. Hanato,
S.Yokoyama, T. Minowa, Hydrogen production from woody biomass by steam
gasification using a CO2 sorbent, Japan, 2004
[24] Hydrogen Economy, National Academic Press, 2004
[25] Peters et al. (2003), Renewable Energy, Vol 33, 2008, pp 1874-1879
[26] Corella, J., and Sanz, A., Modeling circulating fluidized bed biomass gasifiers. A-
pseudo-rigorous model for stationary state, Fuel Processing Technology, 86, p. 1021 –
1053, 2005.
[27] Gonzalez, S.J., Advances in biomass gasification in fluidized bed, PhD thesis,
University of Saragossa (Dept. Of Chemical Engineering), 1988.Unpublished.
[28] Choi, Y.C., Li, X.Y., Park, T.J., Kim, J.H., and Lee, J.G., Numerical study on the
coal gasification characteristics in an entrained flow coal gasifier, Fuel, vol. 80, p. 2193-
2201, 2001.
[29] Govin, R., and Shah, J., Modeling and simulation of an entrained flow coal
gasifier, AIChE Journal, Vol. 30,p. 79, 1984.

47
[30] Brown, B.W., Smoot, L.D., Smith, P.J., and Hedman, P.O., Measurement and
prediction of entrained flow gasification process, AIChE Journal, Vol. 34, p. 435, 1988.
[31] Therien, N., Marchand, P., Chamberland, A., and Gravel, G., Computer modeling
and simulation of biomass fluidized bed gasifier, Proceeding of the XVIII Congress:
The Use of Computer in Chemical Engineering-CEF87, 26-30 April, Gianardi
Naxos,Italy, p. 187-192, 1987.
[32] Liu, H., and Gibbs, B.M., Modeling NH3 and HCN emissions from biomass
circulating fluidizied biomass gasifiers, Fuel, vol. 82. p.1591 - 1604, 2003.
[33] Fletcher, D.F., Haynes,D.S., Christo, F.C., and Joseph, S.D., A CFD based
combustion model of an entrained flow biomass gasifier, Applied Mathematics
Modeling, Vol. 24, p. 165-182, 2000.
[34] Xu, J., and Froment, G.J., Methane steam reforming, methanation and water gas
shift: 1. intrinsic kinetics, AIChE Journal, vol. 35, p. 88-96, 1989.
[35] Simell, P.A., Hirvensalo, E.K., Smolander, S.T., and Krause,A.O., Steam
reforming of gasification gas tar over dolomite with benzene as a model compound,
Industrial and Engineering Chemistry Research, vol.38, p. 1250, 1999.
[36] Irfan, A., and Dogu, G., Cacination kinetics of high purity limestones, Chemical
Engineering Journal, vol.83, p. 131-137, 2001.
[37] Milne, C.R., Silciox, G.R., Pershing, D.W., Kirchgesner, D.A., Calculation and
sintering models for applications of high temperature short time sulfaction of calcium
based sorbent, Ind Eng. Chem. Res., vol. 29,p. 139-152, 1990.
48
[38] C. Fushimi, K. Araki, Y. Yamaguchi and A. Tsutsumi “Effect of heating rate on
steam gasification of biomass: 1. Reactivity of char”, Industrial and Engineering
Chemistry Research 42 (2003) 3922-3928
[39] Marcio L. de Souza-Santos “ Solid Fuels Combustion and gasification: Modeling,
Simulation and Equipment Operation” Marcel Dekker, New York, USA (2004) pp. 146-
159
[40] Ping Sun, John R. Grace, Jim Lim and Edward Anthony “Determination of
intrinsic rate constants of the CaO-CO2 reaction”, Chemical Engineering Science 63
(2008) 47-56
[41] Gao N., Li A., Quan C., A Novel reforming method for hydrogen production from
biomass steam gasification, Bioresource Technology, Vol. 100, p. 4271-4277, 2009.
Top Related