


Languages
Pages
Legal


Centre for Health Systems and Safety Research
Examination of changes in pathology tests ordered by Diagnosis-Related Group (DRGs) following CPOE introduction
E Vecellio 1, A Georgiou 1, G Toouli 1, A Eigenstetter 2, L Li 1, R Wilson 2, JI Westbrook 1
1 Centre for Health Systems and Safety Research, University of New South Wales, Sydney, NSW2 South Eastern Area Laboratory Services, Prince of Wales Hospital, Sydney, NSW
Research Areas
Background
• Too many tests?
• Too few tests?
• The ‘just right’ number of tests?
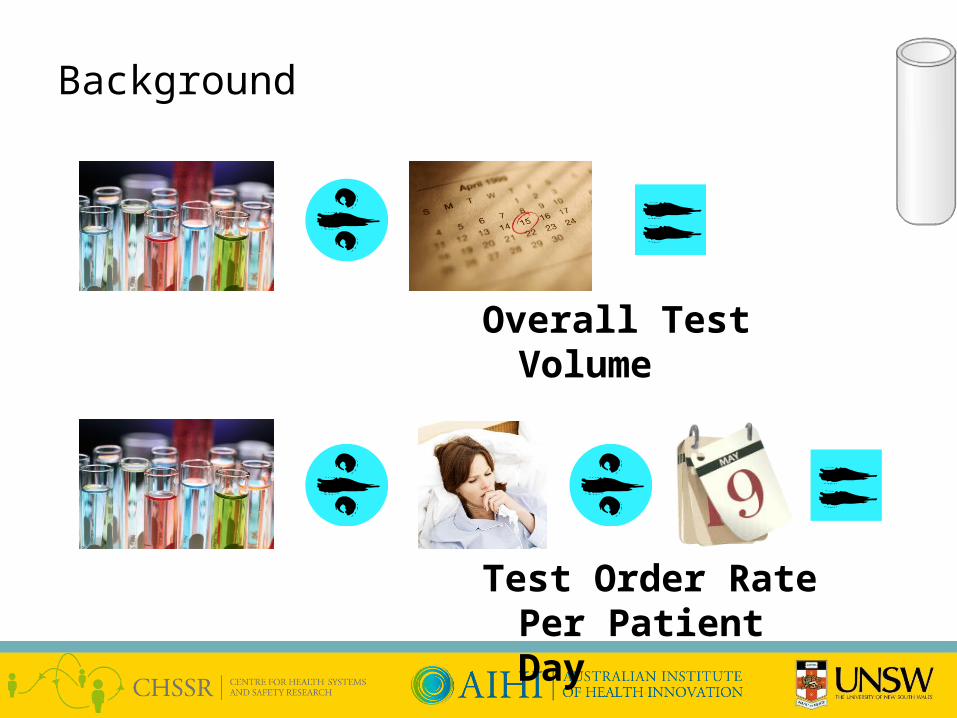
Background
Overall Test Volume
Test Order Rate Per Patient Day
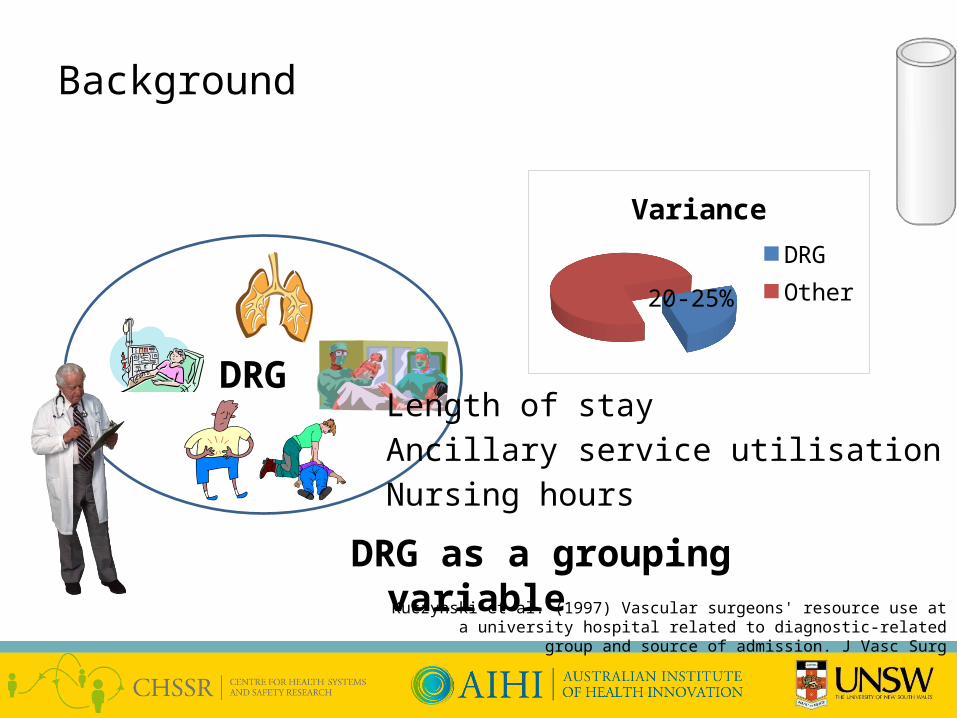
Background
DRG as a grouping variable
DRG
Variance
DRGOther
Length of stay
Ancillary service utilisation
Nursing hours
Kuczynski et al. (1997) Vascular surgeons' resource use at a university hospital related to diagnostic-related group and source of admission. J Vasc Surg
20-25%

Research Questions
Test Order Rate Per DRG Per Patient (Per Day)
DRG

Research Questions
Monitor test volume during the implementation of EMR
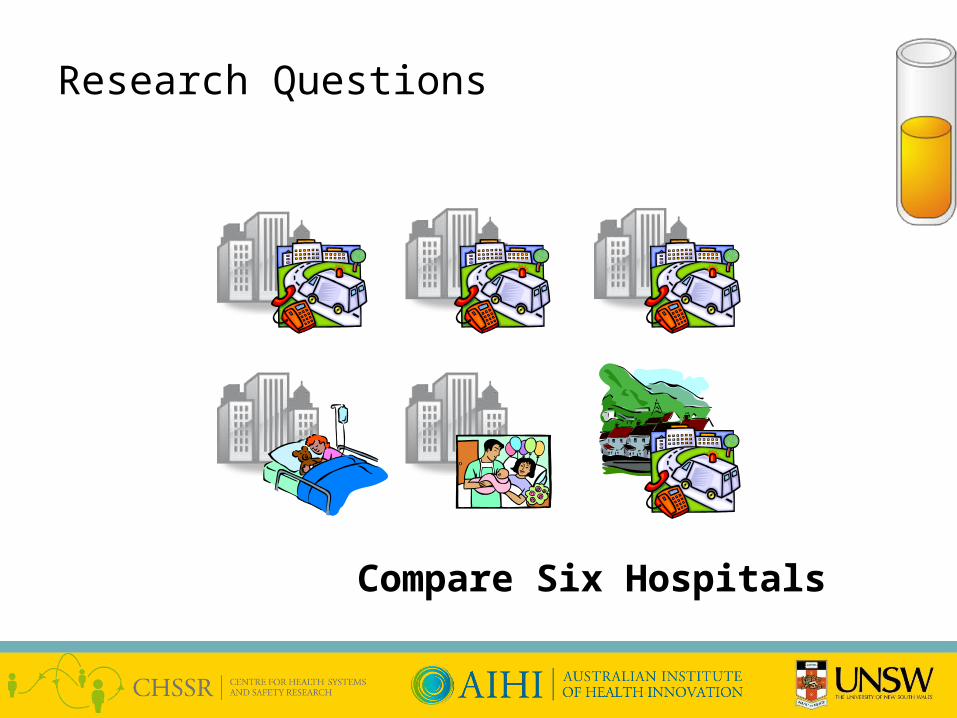
Research Questions
Compare Six Hospitals
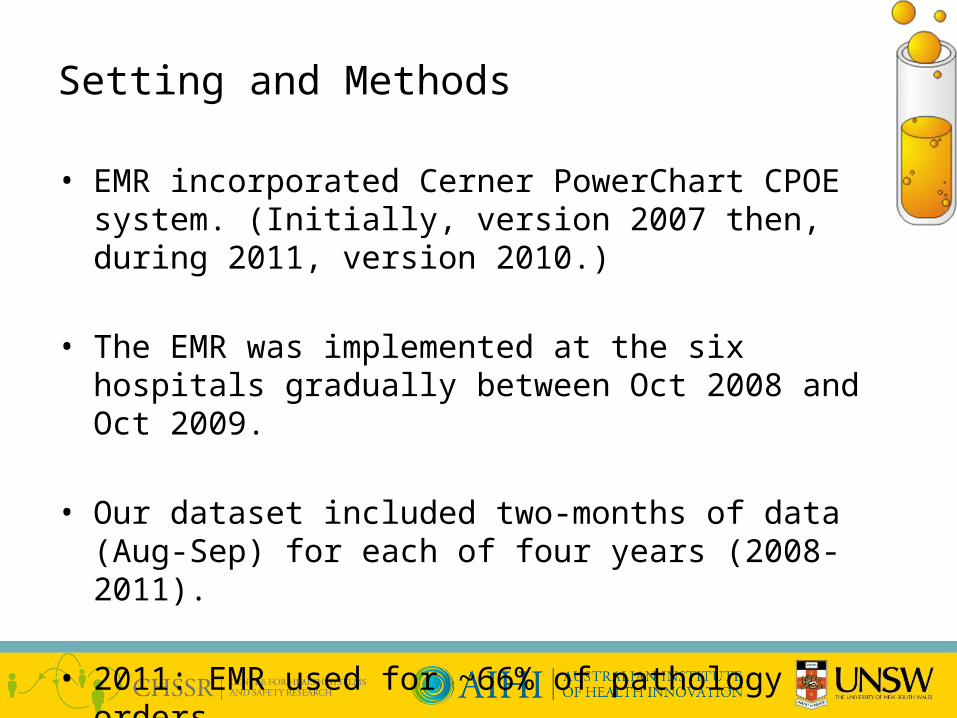
• EMR incorporated Cerner PowerChart CPOE system. (Initially, version 2007 then, during 2011, version 2010.)
• The EMR was implemented at the six hospitals gradually between Oct 2008 and Oct 2009.
• Our dataset included two-months of data (Aug-Sep) for each of four years (2008-2011).
• 2011: EMR used for ~66% of pathology orders
Setting and Methods
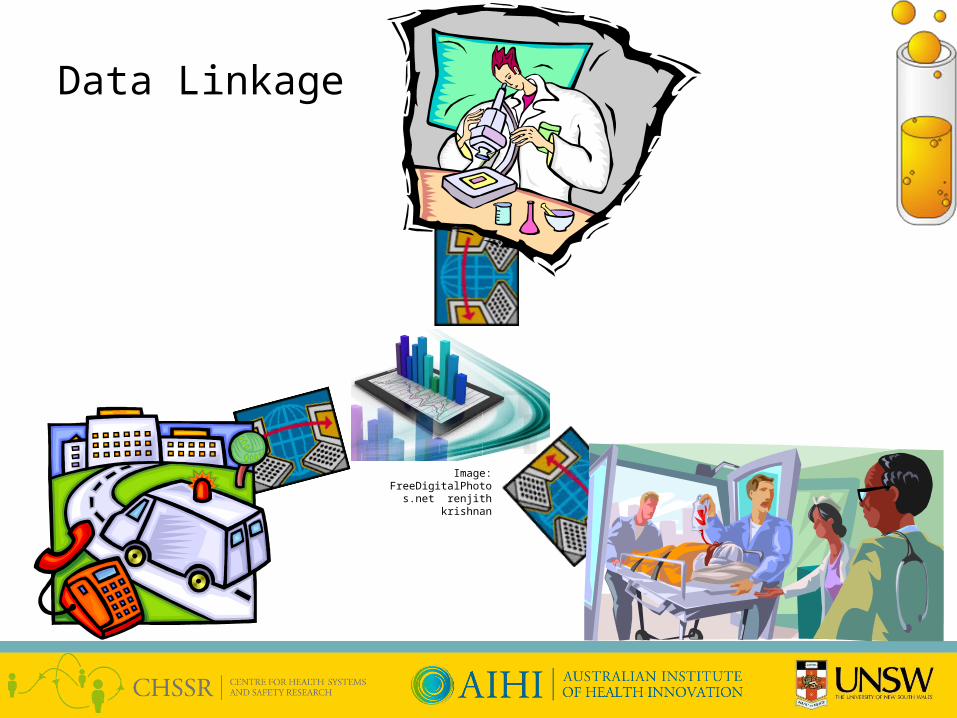
Data Linkage
Image: FreeDigitalPhotos.net renjith krishnan
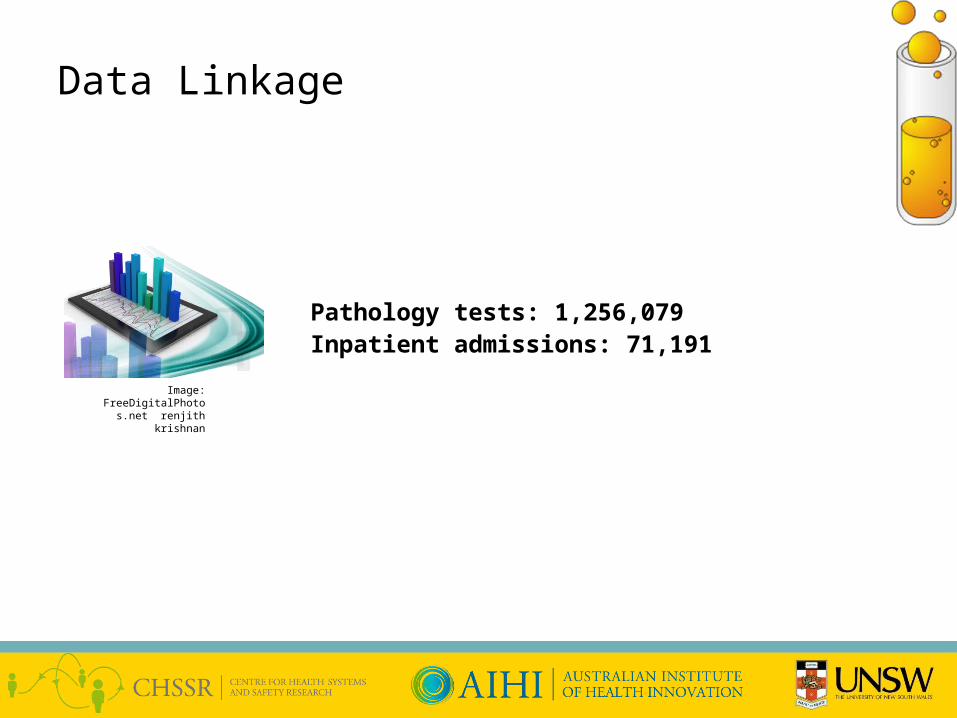
Data Linkage
Image: FreeDigitalPhotos.net renjith krishnan
Pathology tests: 1,256,079Inpatient admissions: 71,191
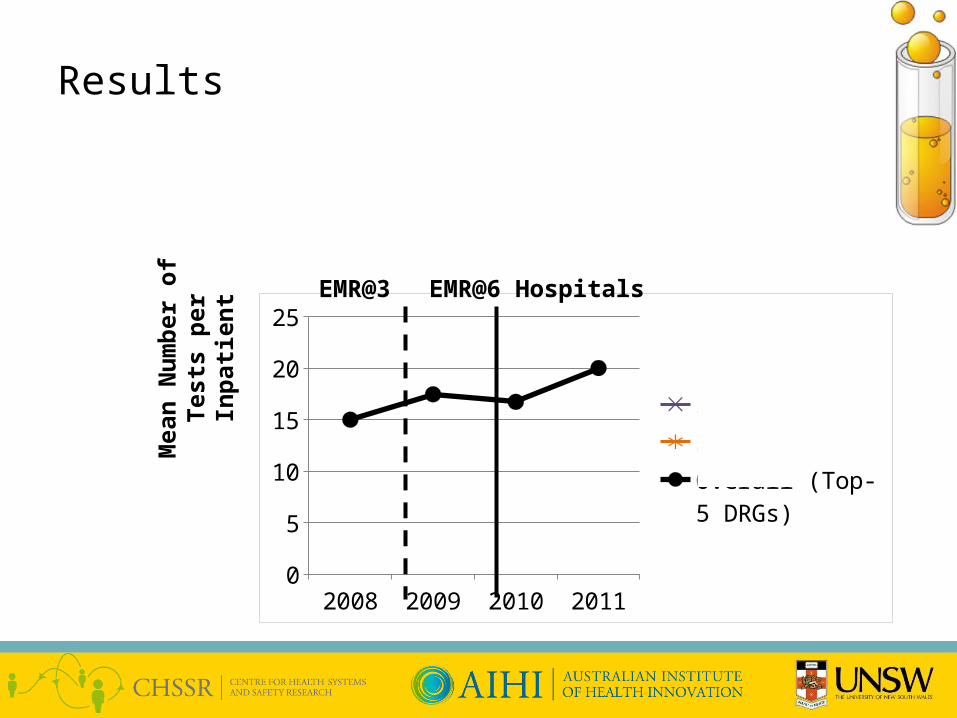
Results
2008 2009 2010 20110
5
10
15
20
25
Series1Series2Overall (Top-5 DRGs)
Mea
n N
um
ber
of
Test
s p
er I
np
atie
nt
EMR@6 HospitalsEMR@3

2008 2009 2010 201125
75
125
175
225
TracheostomyRehabilitationRespiratory Infec-tion
Results
2008 2009 2010 20110
5
10
15
20
25
HaemodialysisChest PainOverall (Top-5 DRGs)
Mea
n N
um
ber
of
Test
s p
er I
np
atie
nt
EMR@6 HospitalsEMR@3
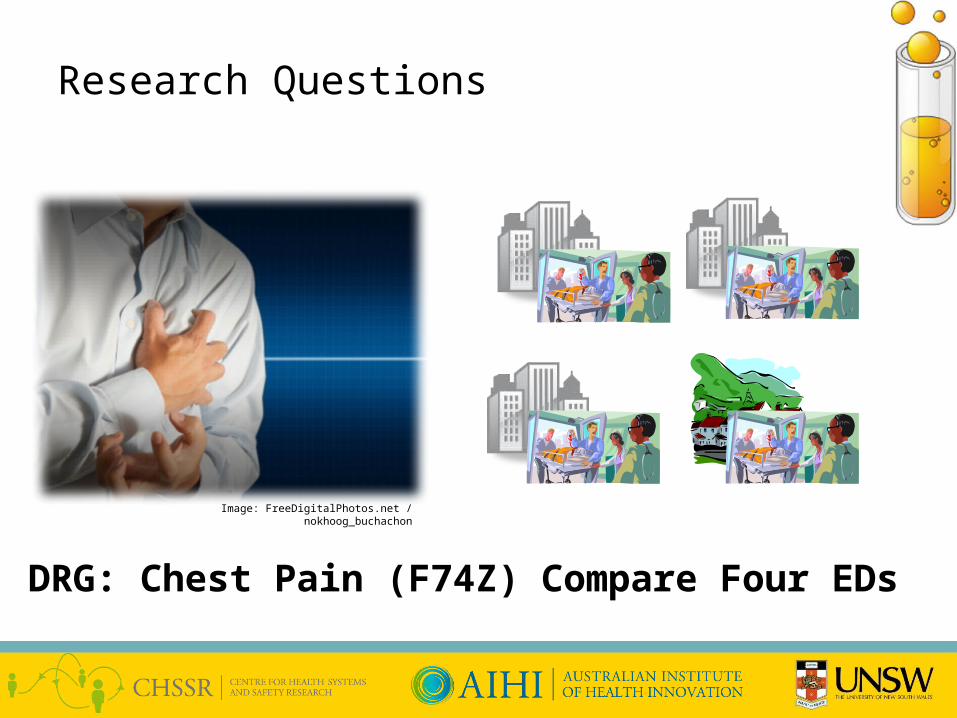
Research Questions
Compare Four EDsDRG: Chest Pain (F74Z)
Image: FreeDigitalPhotos.net / nokhoog_buchachon
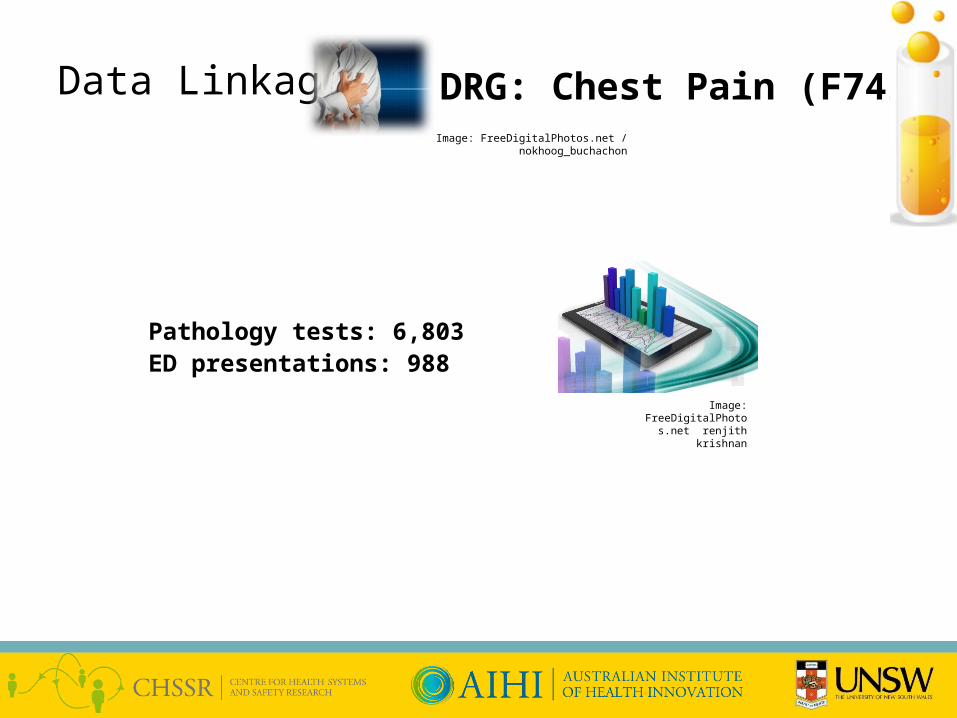
Data Linkage
Image: FreeDigitalPhotos.net renjith krishnan
Pathology tests: 6,803ED presentations: 988
DRG: Chest Pain (F74Z)Image: FreeDigitalPhotos.net / nokhoog_buchachon
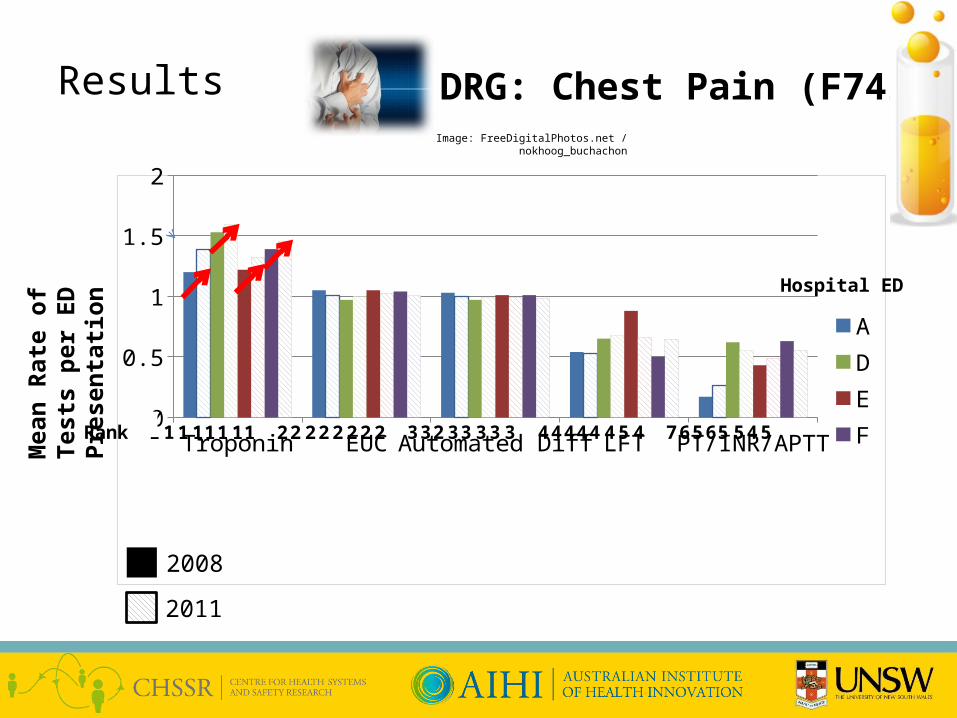
ResultsM
ean
Rat
e o
f Te
sts
per
ED
P
rese
nta
tio
n
Troponin EUC Automated Diff
LFT PT/INR/
APTT
00.20.40.60.8
11.21.41.61.8
ADEF1 1 1 11 1 11 2 2 2 22 2 2 2 3 32 33 3 3 3 4 44 44 4 5 4 7 65 56 4 55
Hospital ED
Rank
2008
2011
DRG: Chest Pain (F74Z)Image: FreeDigitalPhotos.net / nokhoog_buchachon

So, what does it mean?
Thank You
This project was funded by a grant from:
Australian Government
Department of Health and Ageing,
Quality Use of Pathology Program.
Email: [email protected]
www.aihi.unsw.edu.au
Centre for Health Systems and Safety Research
Examination of changes in pathology tests ordered by Diagnosis-Related Group (DRGs) following CPOE introduction
E Vecellio 1, A Georgiou 1, G Toouli 1, A Eigenstetter 2, L Li 1, R Wilson 2, JI Westbrook 1
1 Centre for Health Systems and Safety Research, University of New South Wales, Sydney, NSW2 South Eastern Area Laboratory Services, Prince of Wales Hospital, Sydney, NSW
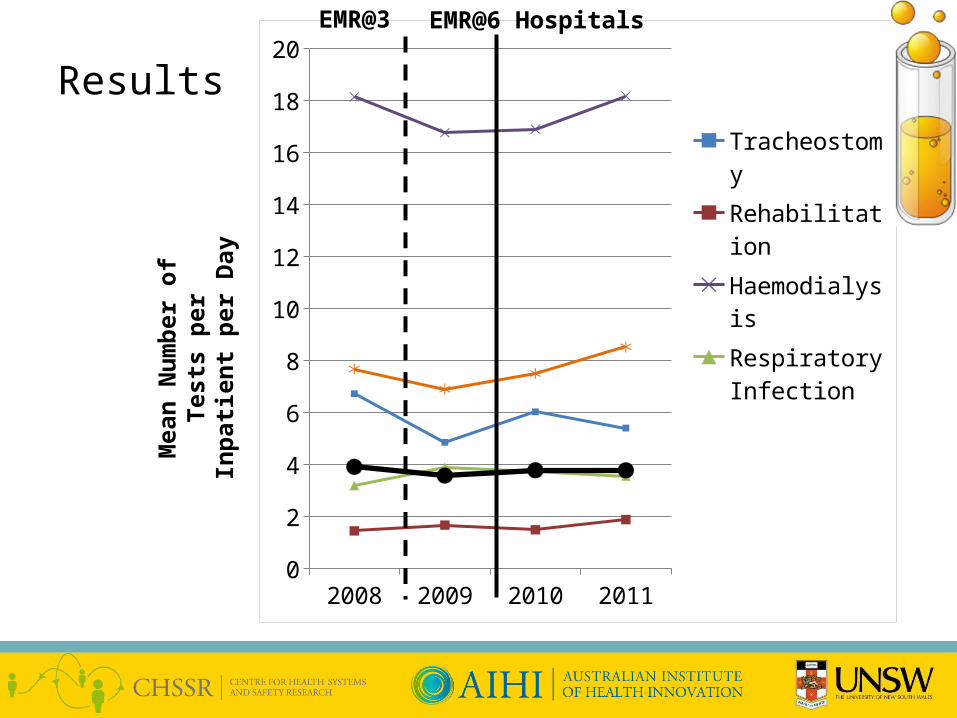
Results
2008 2009 2010 20110
2
4
6
8
10
12
14
16
18
20
Tracheostomy
Rehabilitation
Haemodialysis
Respiratory In-fection
Chest Pain
Overall (Top-5 DRGs)
Mea
n N
um
ber
of
Test
s p
er I
np
atie
nt
per
Day
EMR@6 HospitalsEMR@3
Top Related